Article

NMR Profiling of Milk from Treated Dried off Cows

by
Antonella Caterina Boccia
*,
Laura Ruth Cagliani
*,
Dalila Iannone
and
Roberto Consonni
National Research Council, Institute of Chemical Sciences and Technologies “G. Natta” (SCITEC), via A. Corti 12, 20133 Milan, Italy
*
Authors to whom correspondence should be addressed.
Foods 2026, 15(4), 770; https://doi.org/10.3390/foods15040770
Submission received: 28 January 2026 / Revised: 16 February 2026 / Accepted: 18 February 2026 / Published: 20 February 2026
(This article belongs to the Section Dairy)

Abstract

The milk metabolite profiles of dairy cows during the dry-off and peripartum periods were investigated using 1H NMR combined with chemometric analysis to evaluate the effects of different dry-off management strategies. Milk samples were collected 14 days before dry-off (T0) and 28 days after calving (T1) from cows receiving an internal teat sealant combined with intramammary antibiotics (CTR), an internal teat sealant alone (SIG), or an internal teat sealant associated with dietary supplementation of lyophilized Aloe arborescens (ASIG). Analysis of both aqueous and organic milk extracts revealed no significant metabolite differences among treatment groups. In contrast, a clear discrimination was detected between samples collected at T0 and T1. Aqueous extracts at T0 were characterized by higher levels of choline, butyrate, branched-chain amino acids, and N-acetylated compounds, whereas T1 samples exhibited higher levels of saccharides, citrate, phosphorylcholine, and galactose-1-phosphate. Organic extracts at T0 showed higher concentrations of conjugated linoleic acids (CLAs) and caproleic acid. These findings indicated that the physiological stage of the cows had a more pronounced impact on milk metabolite composition than the dry-off treatments, with no detrimental effects on milk composition or overall metabolite balance.

1. Introduction

Bovine milk constitutes a fundamental component of the human diet and is among the most widely consumed food products globally. Its nutritional value is largely determined by its complex composition, which includes high-quality proteins and a diverse array of carbohydrates and lipids, as well as essential minerals and vitamins [1]. In addition to these macronutrients and micronutrients, milk contains numerous bioactive compounds synthesized and secreted by the mammary gland, including enzymes, hormones, and immunoglobulins [2].
As milk production increases and calving intervals shorten, high daily milk yields at dry-off have become more common, making the dry-off process more challenging and raising the risk of health issues during this period [3,4,5,6].
This phase represents a critical transition in the production cycle of dairy cows, characterized by profound physiological adaptations as the mammary gland shifts from an active lactating state to a non-lactating condition. The process involves extensive mammary tissue remodeling, including epithelial cell turnover, structural reorganization, and functional regression followed by regeneration. Appropriate management of the dry period is therefore essential to promote mammary gland recovery, ensure optimal tissue renewal, and support maximal performance in the subsequent lactation cycle, while minimizing the risk of health disorders during this vulnerable period [7,8].
During this transition period, the cow’s physiological status is profoundly influenced by endocrine and metabolic adaptations, accompanied by alterations in immune function. These changes may predispose animals to the development of metabolic and/or infectious disorders, including mastitis [9]. Maintaining optimal health status during both the dry period and lactation has therefore become a major challenge for the dairy industry.
The use of antibiotics has long been a common clinical practice aimed to prevent bacterial infection and maintain high levels of cow productivity [10]. However, the implementation of Regulation (EU) 2019/6 has introduced substantial restrictions on antimicrobial use in livestock production [11,12,13]. This regulation, which has received broad consumer support due to growing demand for residue-free dairy products, prohibits routine preventive antibiotic treatments and permits their administration only in cases of diagnosed pathological intramammary infection, as determined by somatic cell count evaluation or bacteriological culture.
Consequently, both researchers and dairy producers are increasingly encouraged to investigate alternative strategies aimed at meeting nutritional requirements while preserving physiological homeostasis in dairy cows. In this context, numerous studies have evaluated the effects of dietary supplementation in dairy production systems [14,15].
For instance, diets enriched with nutraceutical compounds have been shown to modulate rumen fermentation dynamics and influence gut microbiota composition. Moreover, such supplementation strategies may exert beneficial effects on immune function and metabolic activity, thereby contributing to improved health status and productive performance during critical physiological stages [16,17].
Vitamin E supplementation has been extensively studied for its role in promoting udder health and reducing the incidence of periparturient diseases. Evidence indicates that the efficacy of vitamin E is dose-dependent, highlighting the need for carefully optimized administration protocols to achieve maximal health benefits [18]. Beyond vitamin E, other nutraceutical interventions have demonstrated significant benefits. Cattaneo et al. [19] reported that dietary supplementation with lyophilized Aloe arborescens improved hepatic function, mitigated post-partum inflammatory responses, and reduced the incidence of intramammary infections in cows managed under an antibiotic-free protocol during the dry-off period. Importantly, supplementation also increased milk yield in the subsequent lactation without affecting milk composition.
A well-established and widely adopted strategy to mitigate infection risk during the dry-off period is the use of internal teat sealants. These products, serving as an alternative to prophylactic antibiotics, create a physical barrier that prevents pathogen invasion of the mammary gland [20,21,22]. In line with this approach, Cremonesi et al. [23] investigated the combined effects of Aloe arborescens supplementation and topical teat sealant application, or topical teat sealant, with or without antibiotic treatment, on the rumen, rectal, and milk microbiomes during the transition period. Their findings indicated that the polysaccharide-based diet, characterized by anti-inflammatory, immunostimulatory, antibacterial, and antioxidant properties, modulated the composition of the rectal and milk microbiomes, whereas no significant effects were observed in the rumen.
These studies highlight the potential of nutraceutical interventions, alone or in combination with physical protective strategies such as teat sealants, to support health, modulate microbiomes, and enhance productive performance in dairy cows, particularly under antibiotic-restricted management systems.
Based on these results, the present study aimed to investigate the metabolite profiling of milk from dairy cows treated with a teat sealant alone (i), in combination with intramammary antibiotics (ii) after supplementation of lyophilized Aloe arborescens (iii). The experimental period extended from 14 days prior to dry-off (T0) to 28 days post-calving (T1). Meanwhile, based on the treatment, cows were split into three groups and the collected milk fractions were analyzed by high resolution nuclear magnetic resonance spectroscopy (NMR) and chemometrics. Both aqueous and organic profiles of milk samples were compared to evaluate the synergistic effects derived from the treatments.
NMR has transformed food science research and development by providing un-precedented analytical insights offering a non-destructive, highly reproducible approach capable of capturing detailed molecular profiles. Its broad applicability in assessing chemical composition, quality, and safety makes it a powerful tool for metabolomic studies [24,25]. By providing detailed molecular-level insights into milk composition, NMR enables a precise evaluation of how nutritional supplementation and management interventions modulate milk metabolites, thereby informing strategies to optimize both health and productive performance in dairy cows.

2. Materials and Methods

2.1. Sampling

Milk samples were collected from twenty-seven multiparous, clinically healthy dairy cows that were randomly allocated into three experimental groups and enrolled in the program. Particularly cows belonged to: CTR group (10 cows dried off subjected to standardized antibiotic treatment, along with the application of an internal teat sealant); SIG group (9 cows dried-off and subjected only to the internal teat sealant treatment); ASIG group (8 cows dried-off and receiving a dietary supplement consisting of Aloe arborescens, 200 mL of homogenized leaf daily, administered from 7 days prior to dry-off through 7 days post dry-off, along with the application of an internal teat sealant). The Aloe arborescens dosage was calculated to ensure a uniform dry matter intake across all animals. Detailed information regarding cow enrollment, dietary composition and experimental sampling has been previously reported [19]. Rations were formulated in accordance with the National Research Council (NRC) guidelines [26]. Milk samples were collected 14 days before the dry-off period (T0) and 28 days after calving (T1). The collected milk samples were lyophilized as received and stored at −80 °C until the data acquisition.

2.2. Samples Preparation

A biphasic extraction was performed at room temperature in glass vials by adding 500 μL of deuterated water buffered at pH = 7.02 (D2O, Merck, 99.96 atom % D, Milan, Italy), 450 μL of deuterated methanol (CD3OD, Eurisotop, 99.96 atom % D, Saint Aubin, France) and 900 μL of deuterated chloroform (CDCl3, Merck, 99.96 atom % D, Milan, Italy) to 60 mg of lyophilized milk. Samples were vortexed and, after 30 min at r.t., centrifuged at 3500 rcf for 10 min at 4 °C. A total of 600 μL of aqueous and organic fractions were used for NMR analysis.

2.3. NMR Data Acquisition and Processing

All NMR spectra were recorded on a Bruker AVANCE NEO 600 spectrometer (Bruker Biospin, GmbH Rheinstetten, Karlsruhe, Germany), operating at 14.07 T, equipped with a 5 mm reverse Z gradient cryoprobe Prodigy, and thermostated autosampler, at 298 K.
For the aqueous extracts, the monodimensional 1H NMR experiments were acquired with a modified 1D-NOESY sequence including a low-power water presaturation scheme, introducing an extra relaxation delay. 256 scans over 32 K of data and a spectral width of 8197 Hz, were applied. All spectra were acquired with a total relaxation delay larger than 15 s (D1 = 1.2 s, AQ = 2 s, extra delay = 12 s).
A resolution enhancement function, with a line broadening of 0.5 Hz, was applied before Fourier transformation. All spectra were phased, baseline corrected and aligned with respect the α-glucose anomeric proton of lactose occurring at 5.19 ppm (Bruker Biospin software TOPSPIN 4.1.4 version, GmbH Rheinstetten, Karlsruhe, Germany). All spectra were subjected to intelligent bucketing in the range of 0.50–10.00 ppm according to the resonances assignment, with the exclusion of residual solvents signals between 4.70–5.00 ppm (water), and 3.31–3.34 ppm (methanol). Buckets were normalized with respect to the total integral value using the ACD/Spec Manager (ACD Labs, version 11, Toronto, ON, Canada).
For organic extracts, the monodimensional 1H NMR experiments were acquired with 128 scans over 64 K of data, and a spectral width of 8197 Hz. All spectra were acquired with a total relaxation delay larger than 15 s. All spectra were phased, baseline corrected and aligned with respect to the TAG (Triacylglycerol) signal at 4.27 ppm. Spectra were subjected to manual bucketing in the range of 0.20–8.15 ppm according to the resonances assignment, with the exclusion of residual solvent signals between 7.07–7.45 ppm and 2.50–3.10 ppm, and between 3.30–3.40 ppm (water). Buckets were normalized with respect to the total integral value using the ACD/Spec Manager.
Bidimensional 1H-13C HSQC, and 1H-1H TOCSY spectra of both aqueous and organic extracts were recorded to confirm resonance assignments.

2.4. Statistical Methods

NMR data were imported into SIMCA-P 13.0.3 (Sartorius Data Analytics, Umeå, Sweden) for multivariate statistical analysis. Principal component analysis (PCA), projection to latent structures discriminant analysis (PLS-DA), and orthogonal projection to latent structures discriminant analysis (OPLS-DA) were performed by using “mean centering” for aqueous and “unit variance” for organic extracts respectively, as data pre-treatment. To overcome the randomness of OPLS-DA models, 200 permutations were performed in the permutation test, on the corresponding PLS-DA models.

3. Results and Discussion

3.1. NMR Spectra Analysis

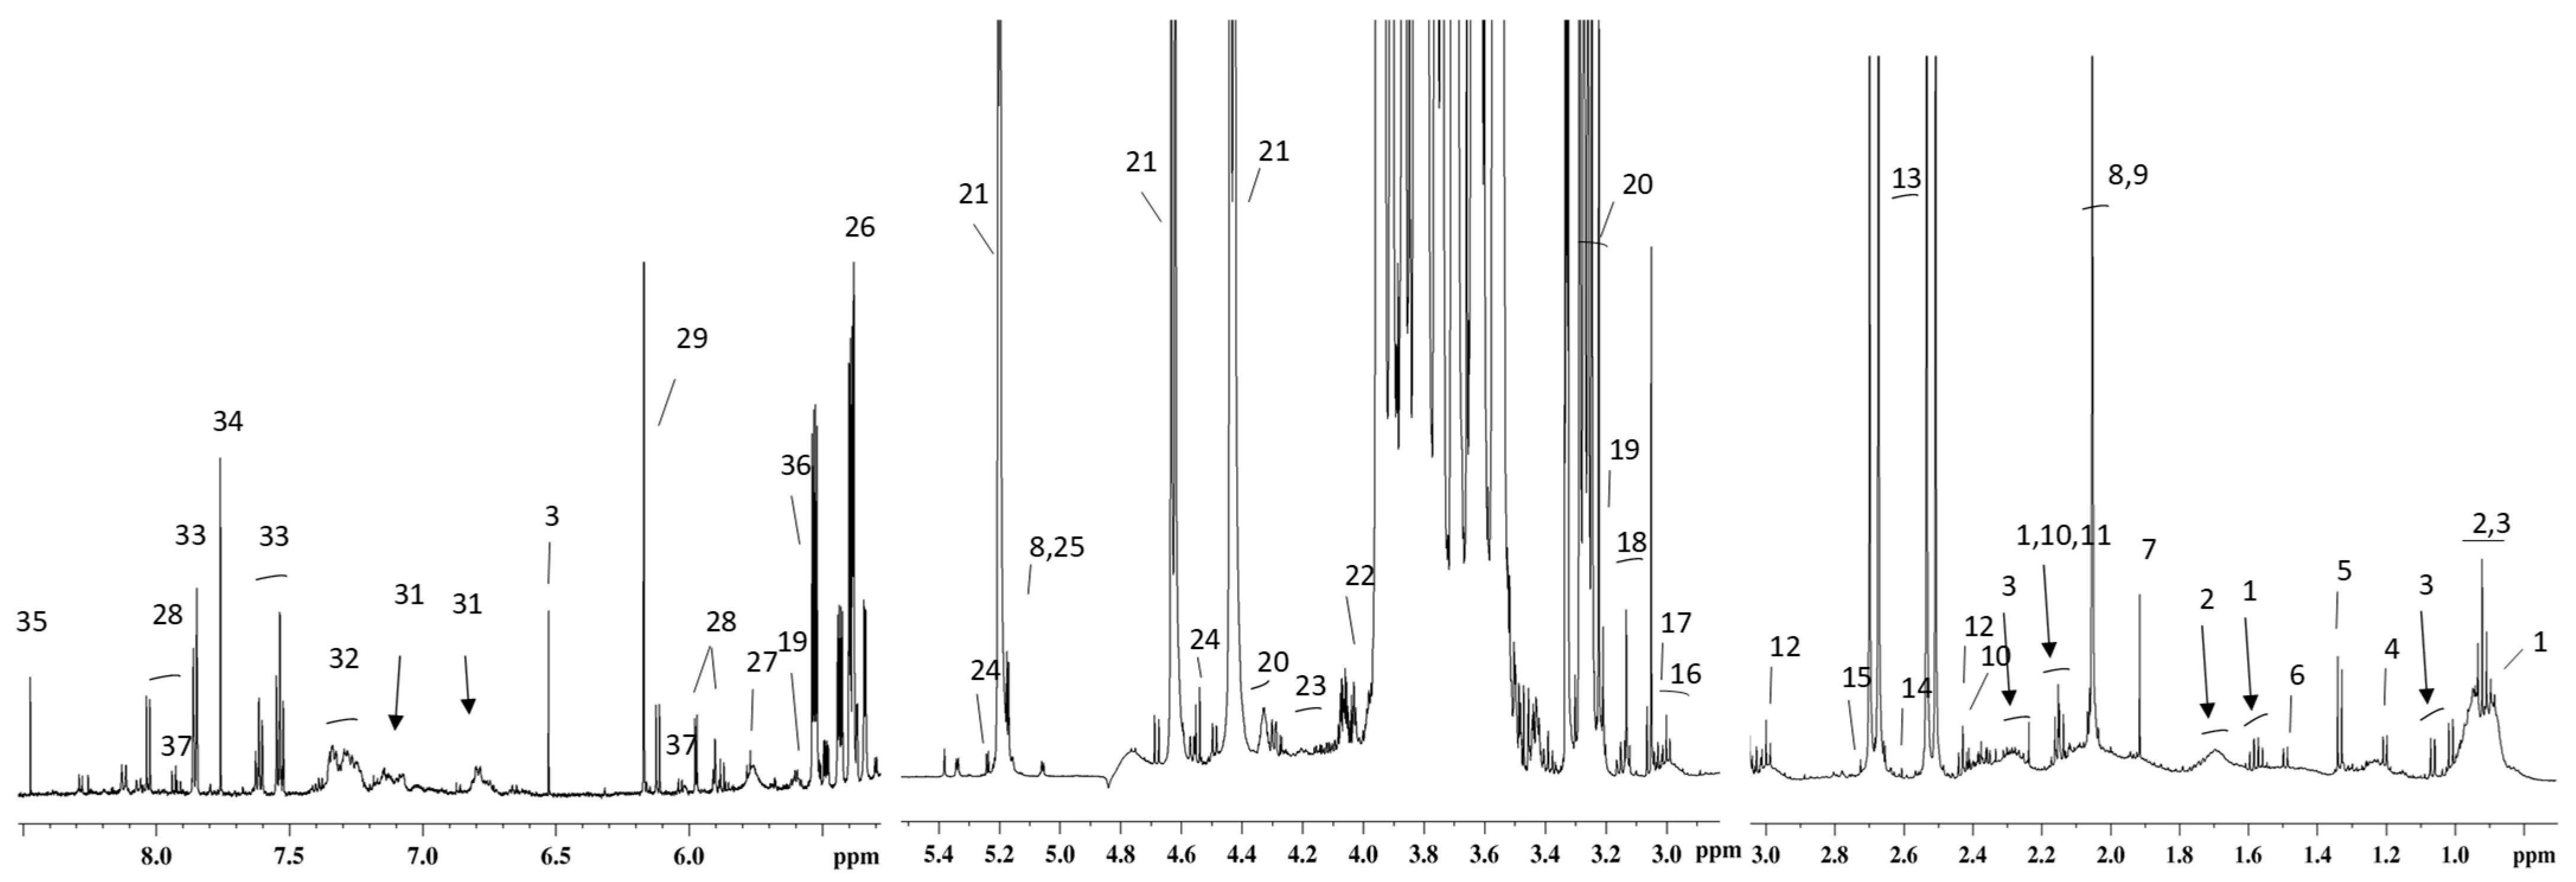
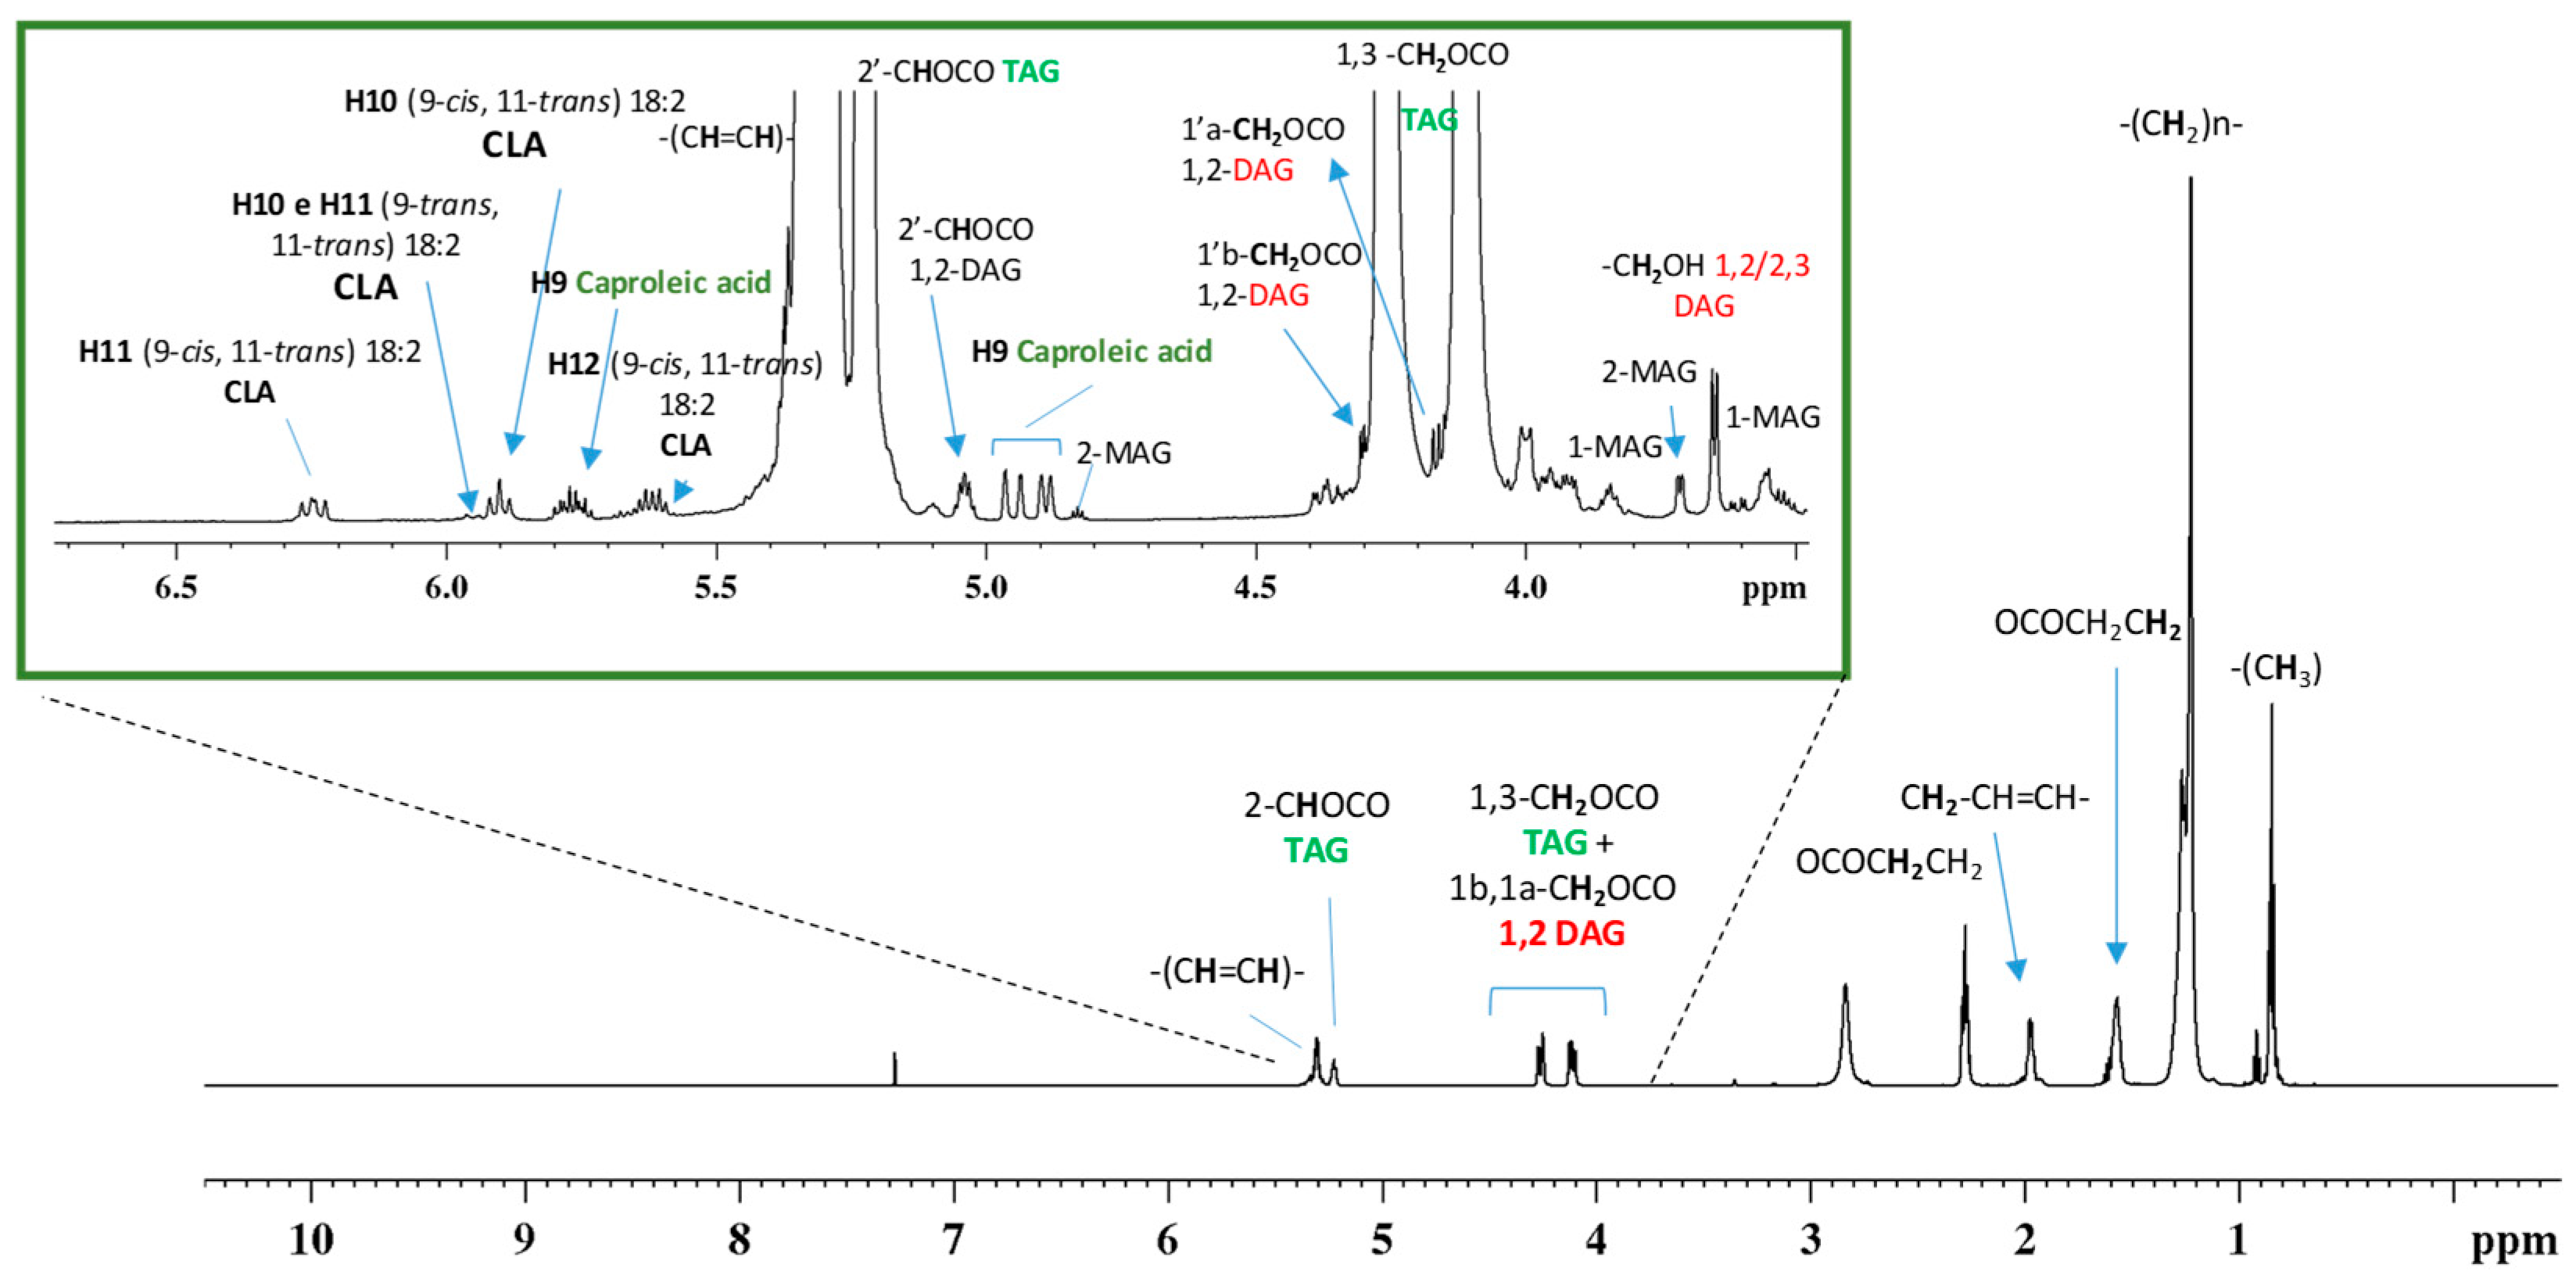
1H NMR spectra of the aqueous and organic milk extracts are represented in Figure 1 and Figure 2 respectively. The resonance assignment was performed with the aid of bidimensional homo- and hetero-nuclear experiments, and with the use of databases (https://www.hmdb.ca/ (accessed on 5 February 2026); CHENOMX NMR suite V12.0; https://bmrb.io/metabolomics (accessed on 5 February 2026)) and compared with data from the existing literature [27,28,29,30].

3.1.1. Aqueous Milk Extract

The 1H NMR spectrum, representative of an aqueous cow milk extract, is shown in Figure 1, with the following identified metabolite numbering.
Milk profiling enabled the identification of several chemical classes, including saccharides, amino acids, organic acids, short-chain fatty acids, nucleotides, alcohol derivatives, organosulfur compounds, and amides, in agreement with previous studies [28,31,32,33,34,35]. Lactose and citrate are the predominant metabolites, as expected, but lower-intensity peaks attributable to less abundant metabolites were also assigned.

3.1.2. Organic Milk Extract

The 1H NMR spectrum of organic extract, represented in Figure 2, shows two distinct groups of signals: The first group is dominated by resonances corresponding to the primary components of milk, namely saturated and unsaturated triacylglycerols (TAG) as expected. The methyl and methylenic groups of fatty acid (FA) were assigned at 0.84 ppm and 1.21–1.26 ppm, respectively. The α- and β-methylenic protons of all acyl chains of FA were at 2.27 ppm and at 1.58 ppm respectively, while the unsaturated proton resonances were found in the 5.30–5.34 ppm range. All the remaining glycerol signals were respectively assigned at 4.11 ppm as sn-1 and sn-3 Ha protons, CH2 TAG; at 4.26 ppm as sn-3 and sn-1 Hb protons, CH2 TAG, and finally at 5.23 ppm sn-2, CH TAG [36].
The second group of resonances consists of less intense signals indicative of minor constituents, identified by the analysis of two-dimensional experiments and according to literature data [30,36,37,38,39,40]. The unsaturated region of CLA (18:2 conjugated linoleic acid) evidenced the 9-cis, 11-trans, also known as rumenic acid, as the most prevalent isoform and in less abundance the isomer 9-trans, 11-trans. In the same region the caproleic acid (C10:1 cis-9) due to the characteristic pattern of resonances respectively at 5.75 ppm and 4.94 and 4.88 ppm was identified [40]. Diacylglycerol (1,2-DAG) was also identified by signals at 5.03 ppm and 3.65 ppm; while diacylglycerol (1,3-DAG) was assigned at 3.98 ppm. Monoacylglycerol (1-MAG) were assigned due to the characteristic pattern of signals at 3.52 and 3.61 ppm, and 3.84 ppm. Analogously, 2-MAG were assigned due to the resonances at 3.71 and 4.82 ppm, in the proton spectrum [41]. Butyric acid was also identified for the presence of a characteristic triplet at 0.91 ppm [32]. Cyclopropane fatty acids were identified due to the characteristic high field resonances respectively at −0.37 and 0.54 ppm in the proton and TOCSY spectra (Figure S1) [42]. Finally, linolenic and linoleic acid were also identified due to the multiplets at 2.78 and 2.77 ppm respectively [43].

3.2. Multivariate Statistical Analysis of NMR Data

3.2.1. Aqueous Milk Extract

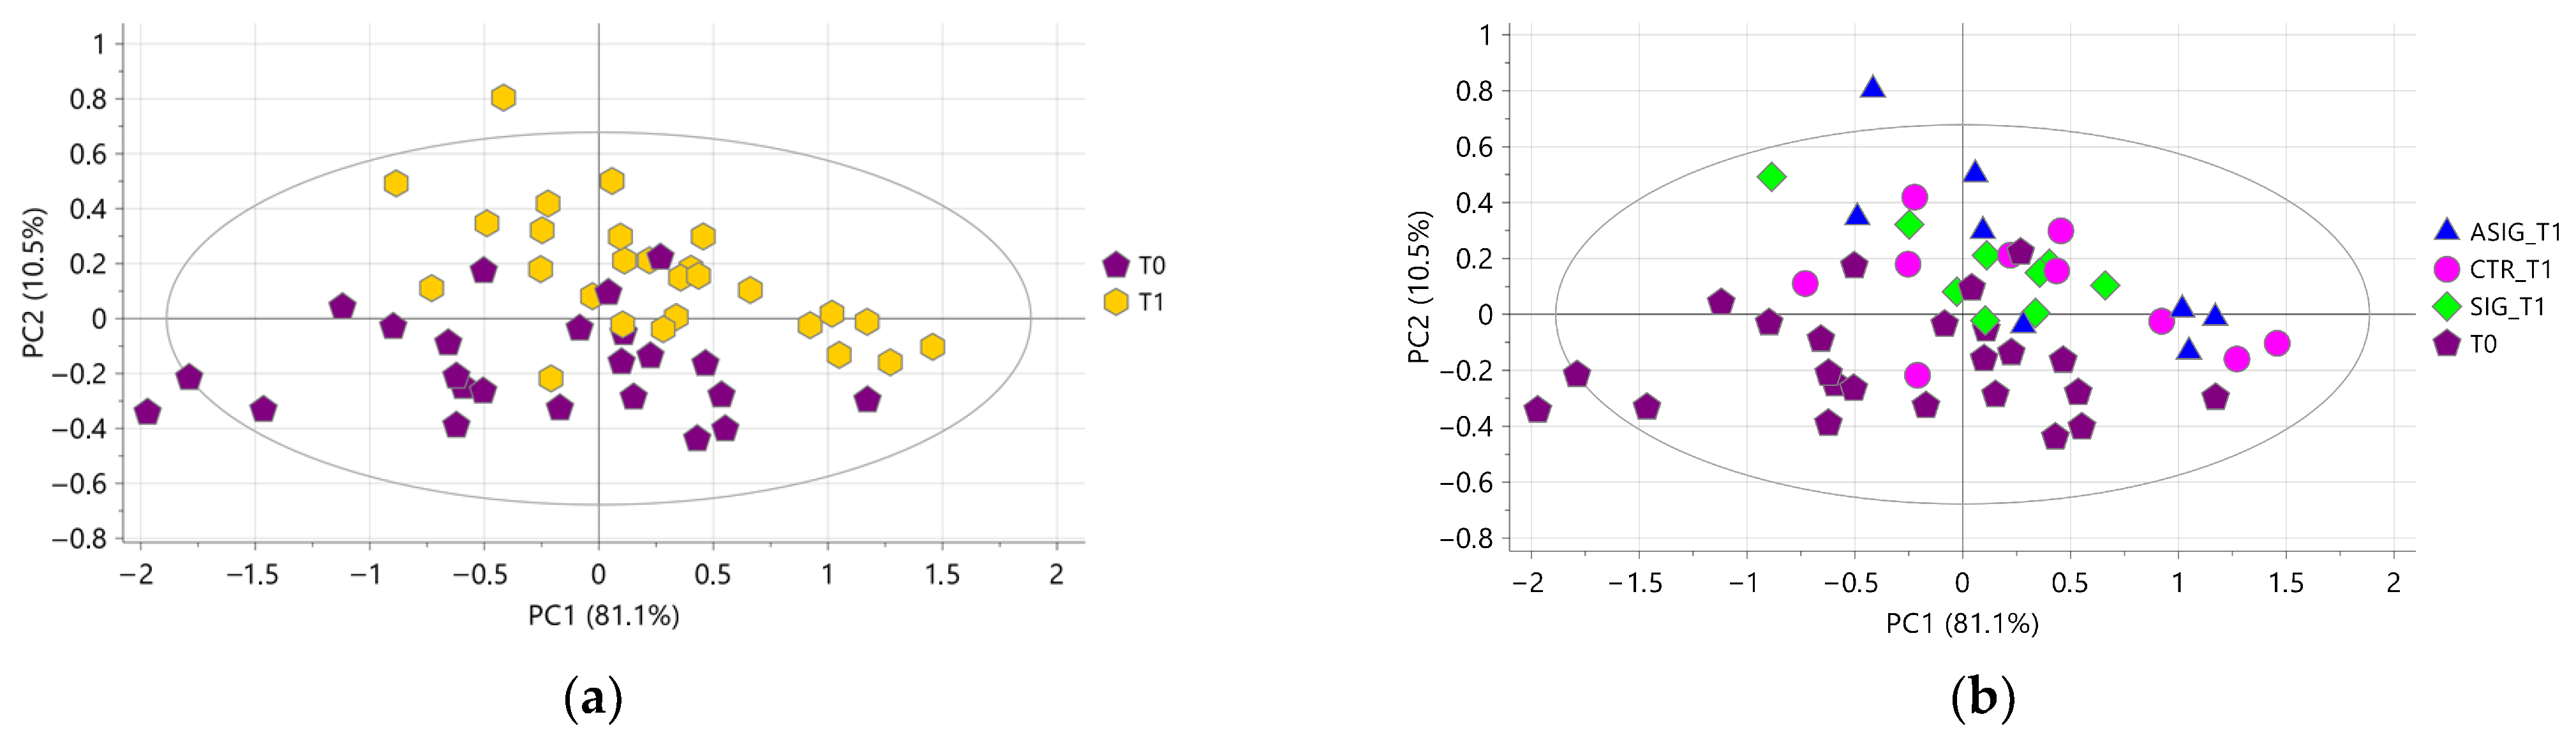
A preliminary PCA performed on all aqueous milk extracts resulted in three components explaining 96.5% of the total variance, with Q2 = 65.1%. After excluding three strong outliers, a new PCA was performed characterized by three components explaining 94.7% of the total variance, with Q2 = 47.5%. The score plot showed a natural clustering of samples according to the sampling time points (Figure 3a) along with a complete overlap of the samples belonging to the three treatments at T1 (Figure 3b). These results indicate that the aqueous milk extracts were strongly influenced by the physiological stages of the cow’s life and not influenced by the treatment administered.
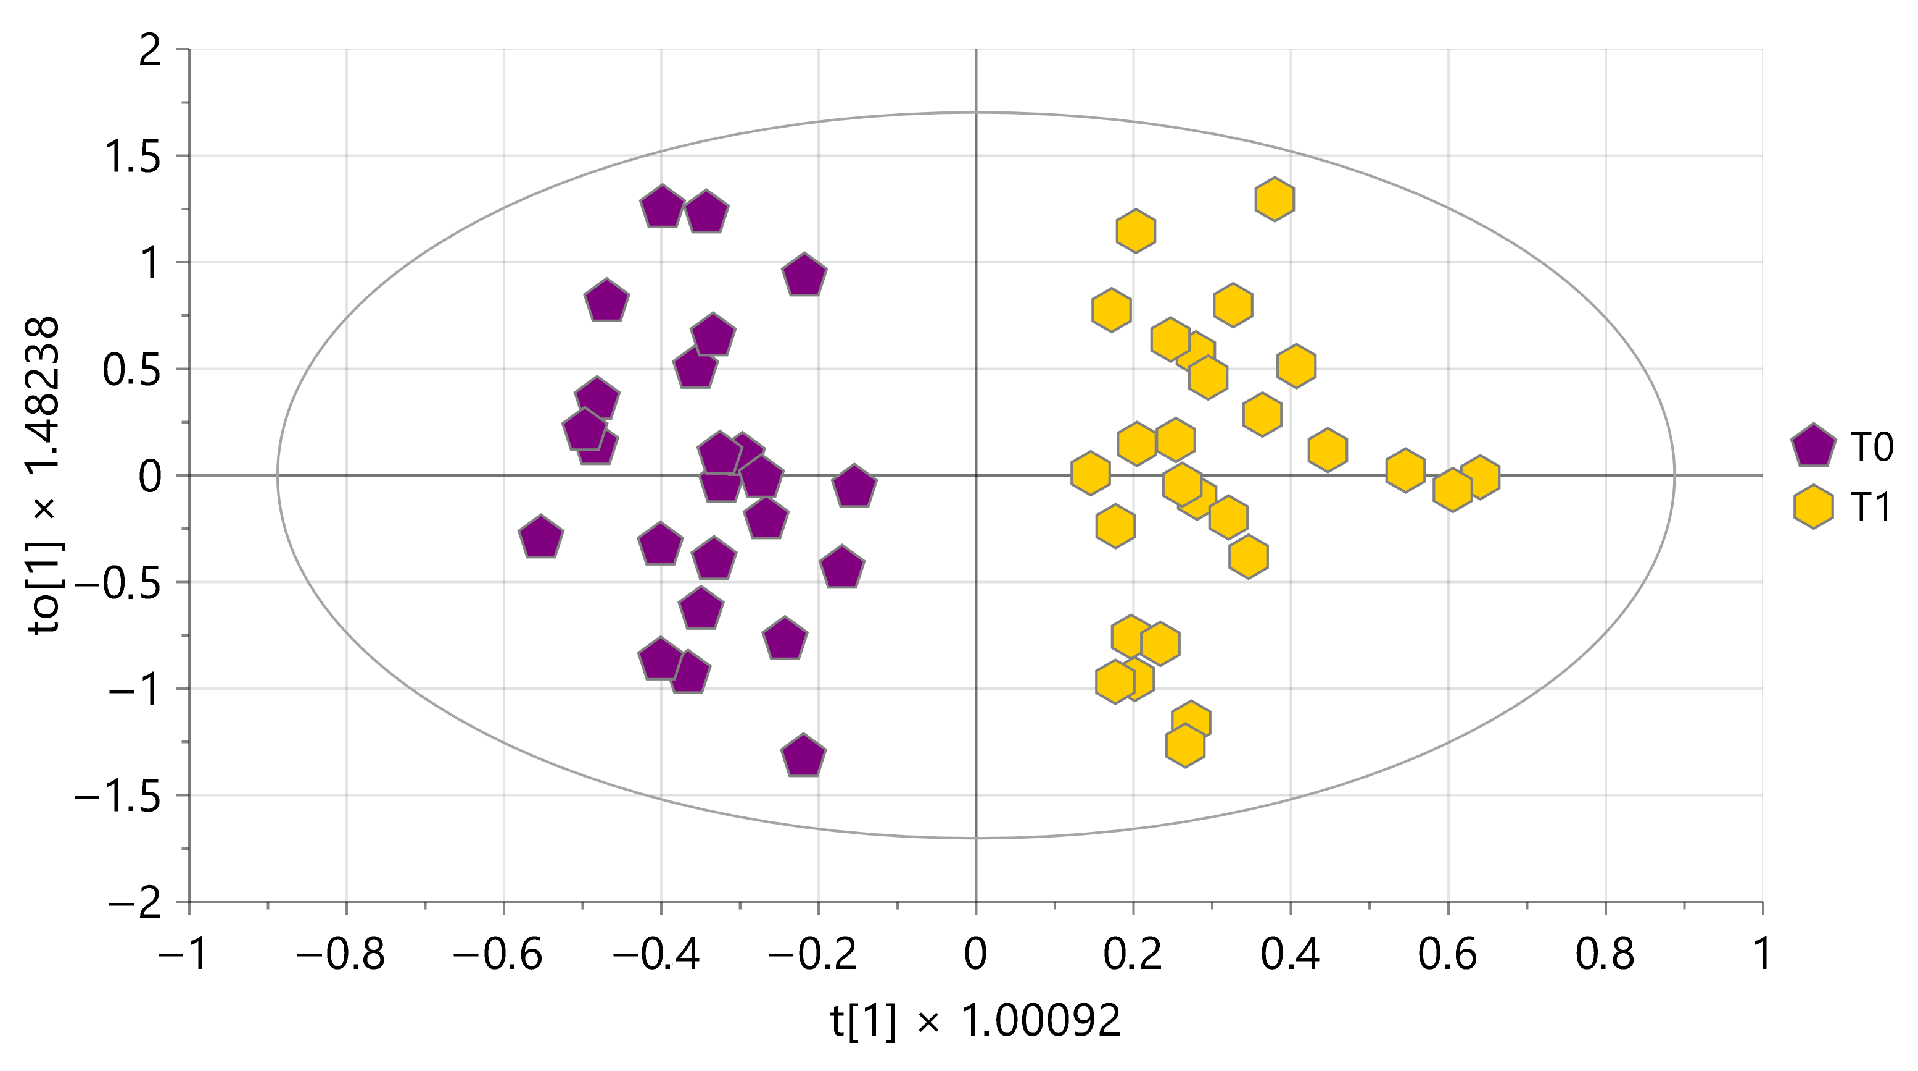
A two-class OPLS-DA model was performed to highlight the variables responsible for the natural clustering of samples according to the collection time point. The model consisted of one predictive and two orthogonal components (Figure 4), showing a clear-cut separation of samples along the first predictive component. The corresponding S-plot (Figure S2) indicated that milk samples at T0 were characterized by a higher content in choline (buckets 3.21–3.23 ppm and 4.04–4.07 ppm), butyrate (buckets at 0.62–1.04 ppm and 2.11–2.20 ppm), leucine (buckets at 0.62–1.04 ppm and 1.61–1.76 ppm), valine (buckets at 0.62–1.04 ppm and 2.24–2.32 ppm), and N-Acetylglucosamine and 9, N-acetylcarbohydrates (bucket 2.04–2.09 ppm).
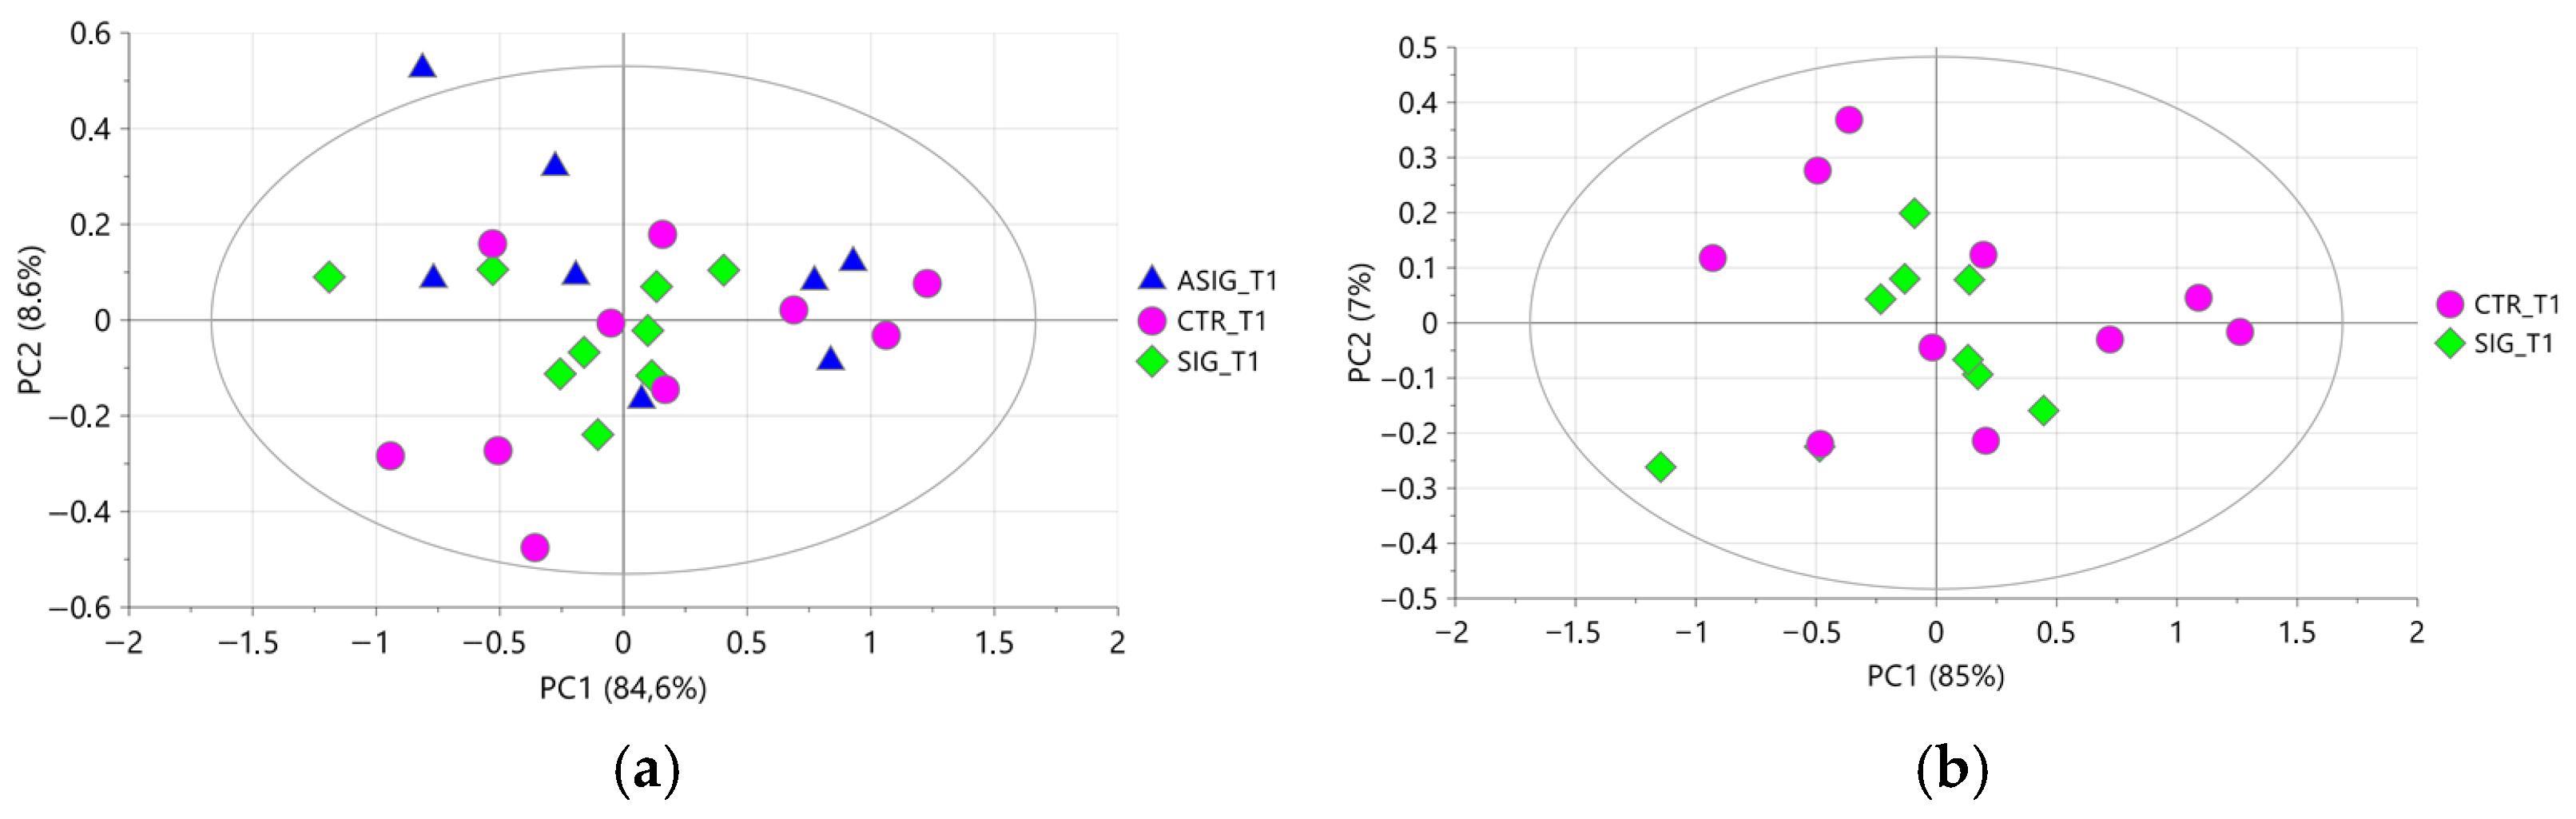
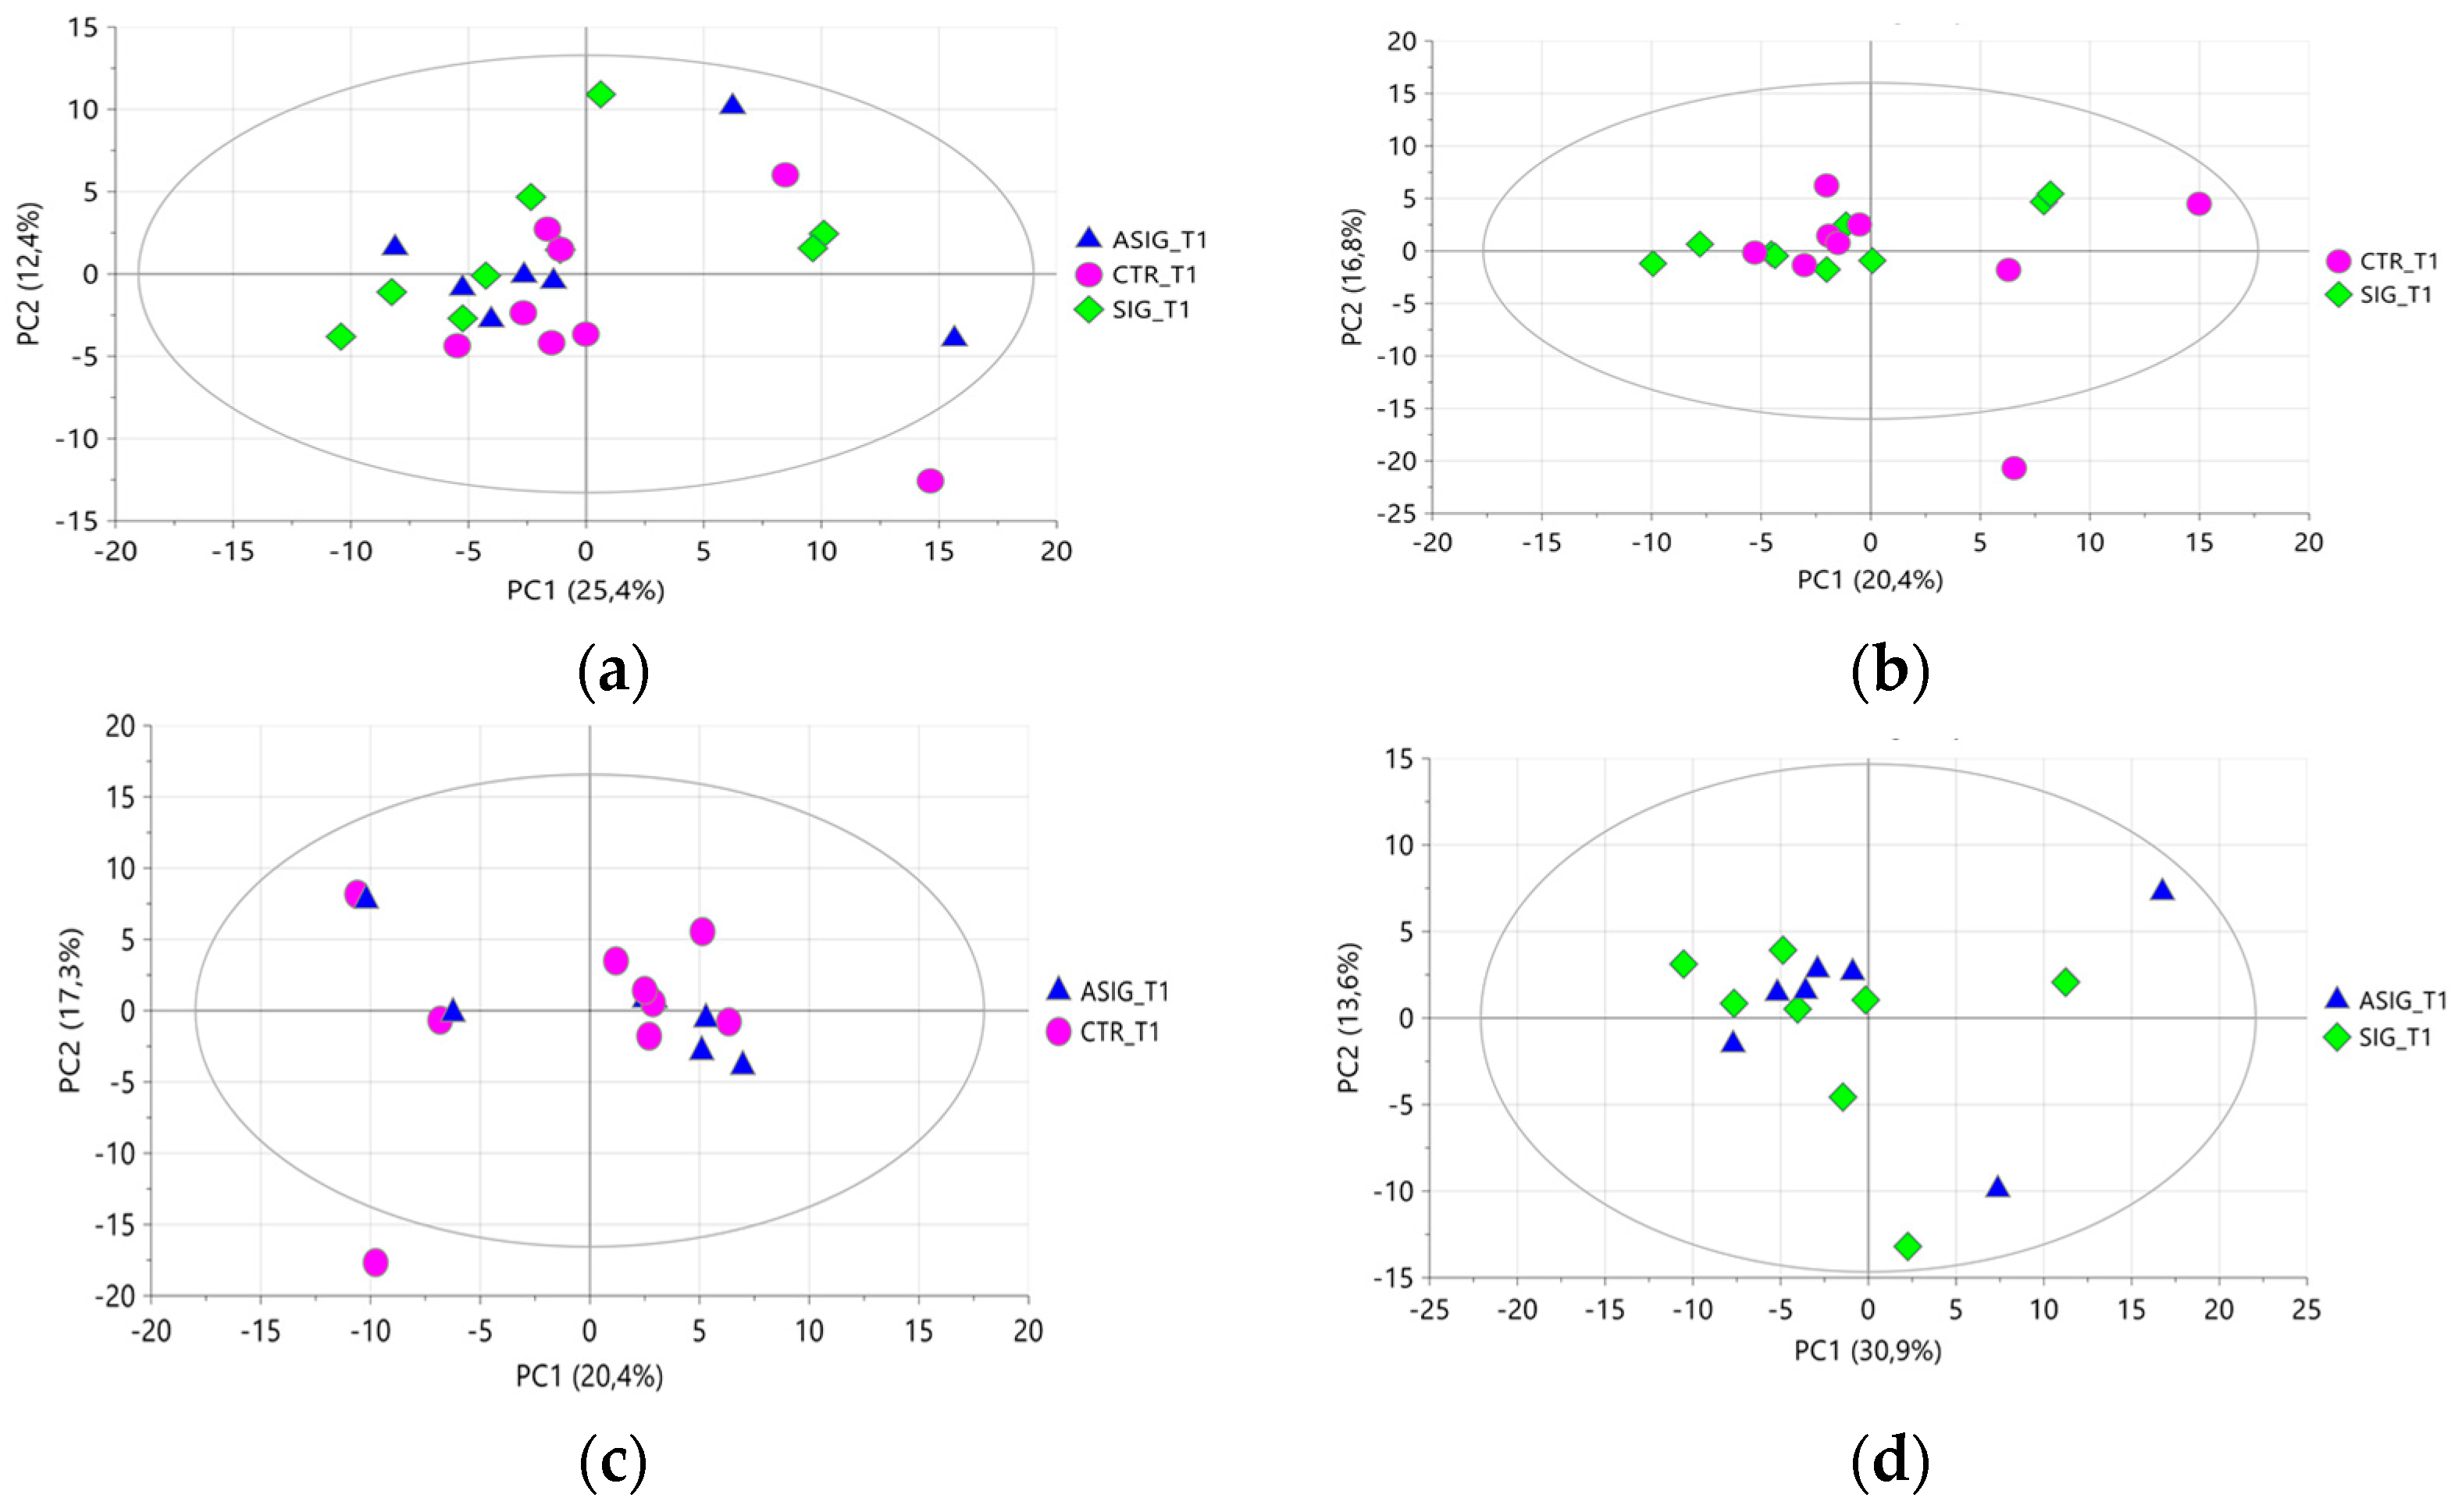
Samples at T1 showed a greater amount of saccharide moieties (bucket at 3.52–3.99 ppm), citrate (buckets 2.49–2.55 ppm and 2.66–2.72 ppm), phosphorylcholine (buckets 3.23–3.24 ppm and 4.16–4.23 ppm), and galactose-1-phosphate (bucket at 5.51–5.56 ppm). Successively, the analysis focused exclusively on the samples collected at T1 to assess whether the treatment induced sample differentiation at this time point. PCA conducted on all samples, as well as on subsets of milk samples from cows subjected to pairwise treatment comparisons, did not reveal any treatment-related clustering (Figure 5a–d) and the corresponding PLS-DA models did not fit. The findings demonstrate that the use of internal teat sealant alone or in combination with oral supplementation of Aloe arborescens did not alter the metabolite composition of the aqueous extracts. The metabolite profiles were comparable between these treatments and, notably, also to those observed in milk from cows subjected to the conventional dry-off procedure involving antibiotic treatment and the use of an internal teat sealant. Therefore, from a metabolite composition perspective, antibiotic treatment could be successfully replaced by using an internal teat sealant alone, without the need for dietary supplementation of Aloe arborescens, at least at the time point considered.

3.2.2. Organic Milk Extract

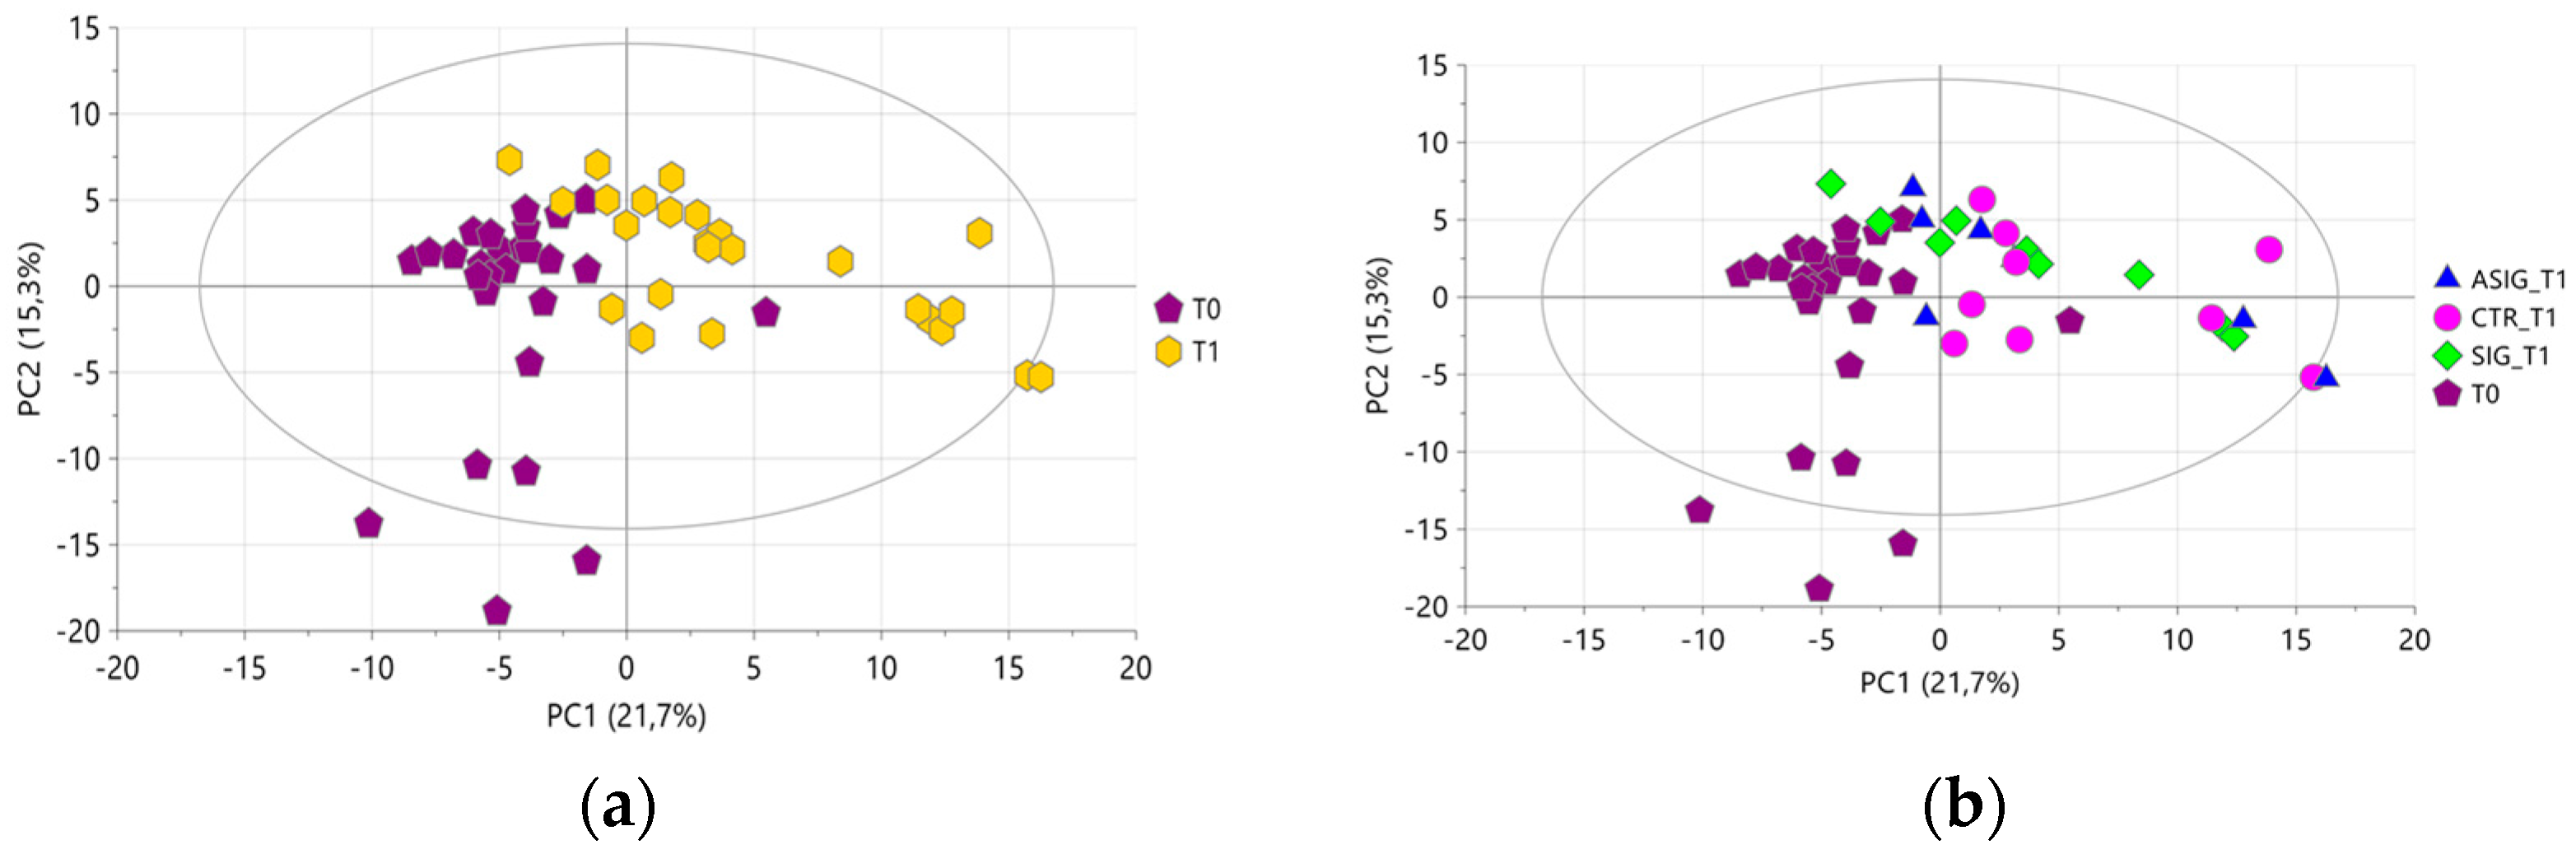
The PCA performed on all organic milk extracts resulted in eight components explaining 74.5% of the total variance, with Q2 = 26.5%. After excluding two strong outliers, a new PCA was performed yielding in eight components explaining 70.1% of the total variance, with Q2 = 13.9%. As shown in the score plot reported in Figure 6a, a natural clustering of samples according to the collection time point was evident along with a complete overlap of samples belonging to the three treatments a T1 (Figure 6b). These data indicate that the metabolite profiles of the organic extracts were also largely influenced by the physiological stages of the cows rather than by the treatment applied to prevent infection diseases, consistent with what was observed in the analysis of the aqueous milk extracts.
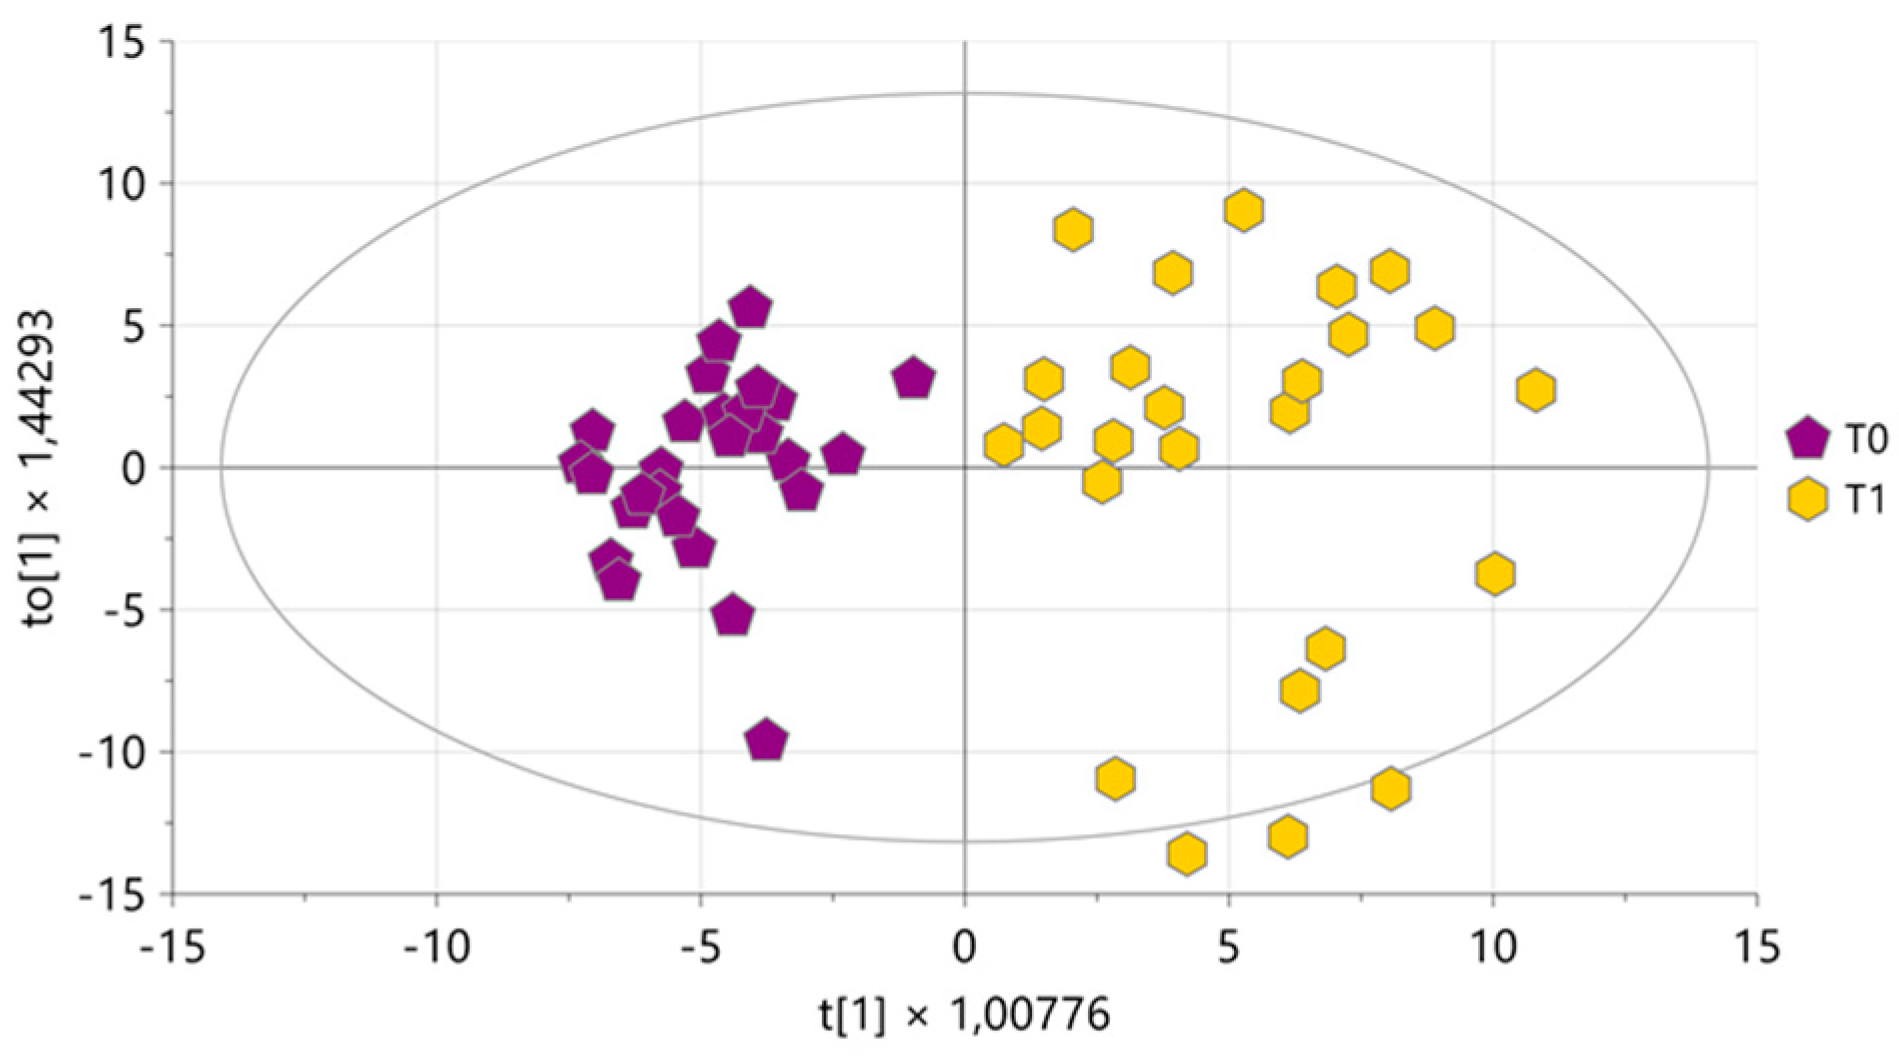
A two-class OPLS-DA model was performed to highlight the organic metabolites responsible for sample differentiation according to the collection time point. The model consisted of one predictive and two orthogonal components (Figure 7). A clear separation of the samples was observed with a wider dispersion for milks collected at T1, most likely due to individual metabolic responses of each cow during transition period, which may have affected the metabolite composition.
The corresponding S-plot indicated that milk samples collected at T0 were characterized by a higher content of CLA 18:2 9-trans, 11-trans (bucket 5.93–5.99 ppm) and CLA 18:2 9-cis, 11-trans (bucket 5.86–5.93 ppm and 6.20–6.32 ppm) along with caproleic acid (buckets 5.70–5.83 ppm), linoleic/linolenic, CLA and caproleic acids (buckets from 2.03 to 2.06 ppm) compared with samples collected at T1. This finding is consistent with Cremonesi et al., who reported no significant differences in fatty acids content between milk collected before (14 days before dry-off) and after (28 days after calving) the oral administration of Aloe arborescens, except for a slightly lower content in CLA 18:2 (9-cis, 11-trans) and caproleic acid after calving [23].
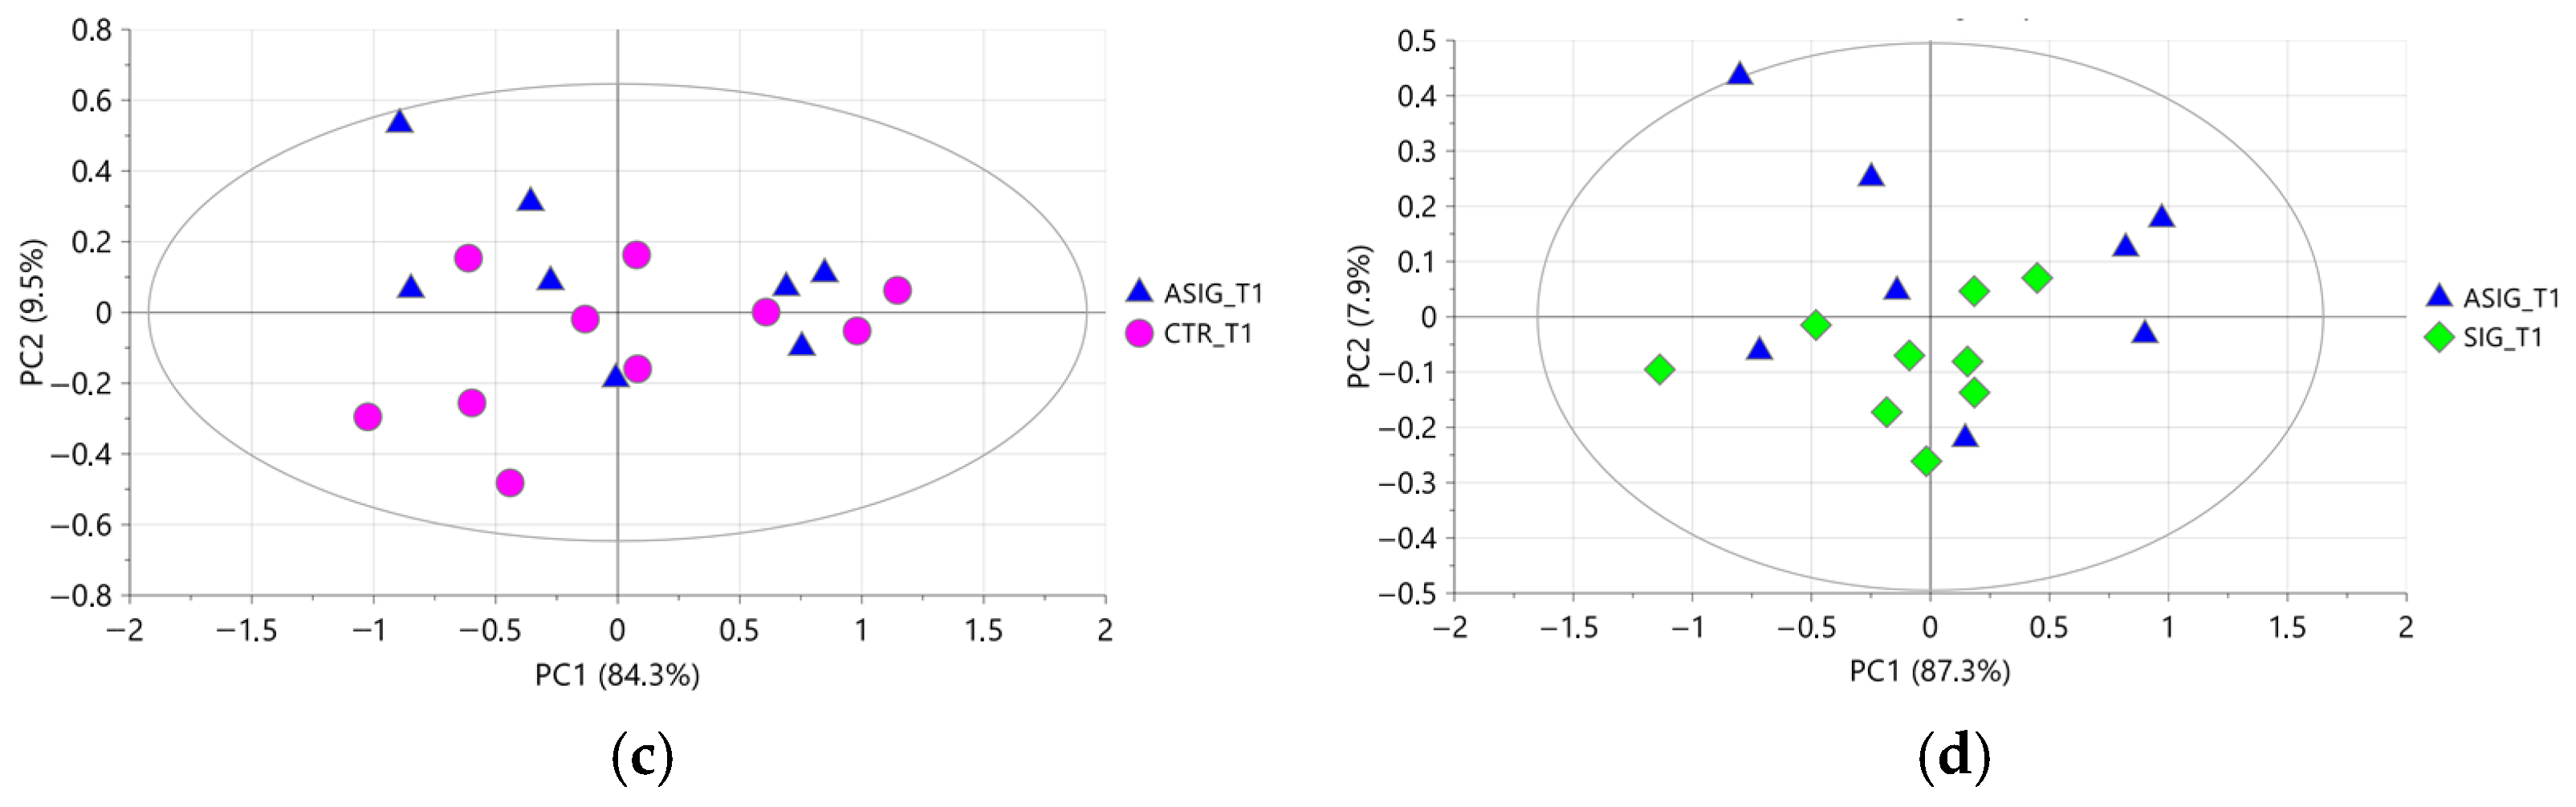
A deeper investigation into a possible differentiation of samples according to the treatment was performed by considering only the milk samples collected at T1, also for the organic extracts. Even in this case, the PCA did not reveal any clustering of samples according to the treatments, either when considering all samples together or when evaluating only the samples obtained from cows subjected to pairwise treatment comparisons (Figure 8a–d). The corresponding PLS-DA models did not fit, indicating that differentiation of samples based on treatment was not achievable.
Interestingly, the findings obtained on the organic extracts confirmed those observed in the aqueous ones: from the perspective of metabolite profiling, antibiotic treatment could be effectively replaced by the use of an internal teat sealant alone, without the need for dietary supplementation with Aloe arborescens, at least at the time point considered. Indeed, the organic metabolite composition of milk from cows subjected to the three different treatments, aimed at maintaining physiological well-being, was comparable.
The results are consistent with those of Cattaneo et al., who reported that the Aloe arborescens treatment did not lead any difference between groups in the investigated periods in milk composition [19].

4. Conclusions

1H NMR metabolomics, combined with chemometric analysis, provides a powerful tool to elucidate the metabolite composition of cow’s milk and evaluate the effects of nutritional supplementation and management strategies. The results of the present study indicated that neither intramammary antibiotic administration nor dietary supplementation with Aloe arborescens induced significant alterations in metabolite profiles of aqueous and organic milk extracts compared with cows treated with the internal teat sealant alone.
These findings suggest that, from a metabolite perspective, using a physical barrier alone may be the preferable strategy, particularly in antibiotic-restricted production systems, for promoting dairy cow well-being. Alternative interventions are generally associated with higher costs and may be less favorable in terms of animal welfare.

Supplementary Materials

The following supporting information can be downloaded at: https://www.mdpi.com/article/10.3390/foods15040770/s1, Figure S1: 1H-1H TOCSY NMR spectrum (expanded region) of cow milk organic fraction at 600 MHz, in CDCl3 at 298 K. The characteristic high field resonances of Cyclopropane fatty acid were shown. Figure S2. S-plot of OPLS-DA score plot performed on milk aqueous extracts. R2X = 93.3%, R2Y = 88.6%, and Q2 = 84.1%. The numbers indicate the initial ppm of each bucket.

Author Contributions

Conceptualization, A.C.B., L.R.C. and R.C.; methodology, A.C.B., R.C. and L.R.C.; software, L.R.C., A.C.B. and D.I.; validation, A.C.B., L.R.C., D.I. and R.C.; formal analysis, D.I., A.C.B. and L.R.C.; investigation, A.C.B., R.C., L.R.C. and D.I.; writing—original draft preparation, A.C.B., R.C. and L.R.C.; writing—review and editing, A.C.B., R.C., L.R.C. and D.I.; supervision, R.C., A.C.B. and L.R.C.; project administration, R.C.; funding acquisition, R.C. All authors have read and agreed to the published version of the manuscript.

Funding

This research was carried out within the National Research Centre for Agricultural Technologies (Agritech) and received funding from the European Union Next-GenerationEU (PIANO NAZIONALE DI RIPRESA E RESILI ENZA (PNRR)—MISSIONE 4 COMPONENTE 2, INVESTIMENTO 1.4—D.D. 1032 17/06/2022, CN00000022). Fellowship SCITEC_006_2023_Mic PNNR AGRITECH Spoke 9. This manuscript reflects only the authors’ views and opinions, neither the European Union nor the European Commission can be considered responsible for them.

Institutional Review Board Statement

Not applicable.

Informed Consent Statement

Not applicable.

Data Availability Statement

The data presented in this study are available on request from the corresponding authors.

Acknowledgments

The “Scientific Foundation A. De Marco” is acknowledged for partial financial support; Paola Cremonesi, and Bianca Castiglioni of the Institute of Biology and Biotechnology in Agriculture, National Research Council (CNR), Milan, Italy for providing samples.

Conflicts of Interest

The authors declare no conflicts of interest.

References

  1. Antunes, I.C.; Bexiga, R.; Pinto, C.; Roseiro, L.C.; Quaresma, M.A.G. Cow’s Milk in Human Nutrition and the Emergence of Plant-Based Milk Alternatives. Foods 2022, 12, 99. [Google Scholar] [CrossRef] [Scilit] [PubMed]
  2. Balthazar, C.F.; Guimarães, J.T.; Rocha, R.S.; Pimentel, T.C.; Neto, R.P.C.; Tavares, M.I.B.; Graça, J.S.; Alves Filho, E.G.; Freitas, M.Q.; Esmerino, E.A.; et al. Nuclear magnetic resonance as an analytical tool for monitoring the quality and authenticity of dairy foods. Trends Food Sci. Technol. 2021, 108, 84–91. [Google Scholar] [CrossRef] [Scilit]
  3. Odensten, M.O.; Holtenius, K.; Persson Waller, K. Effects of Two Different Feeding Strategies During Dry-off on Certain Health Aspects of Dairy Cows. J. Dairy Sci. 2007, 90, 898–907. [Google Scholar] [CrossRef] [Scilit] [PubMed]
  4. Bach, L.; Ammann, J.; Bruckmaier, R.M.; Müller, U.; Umstätter, C. Drying-off practices on Swiss dairy farms: Status quo and adoption potential of integrating incomplete milking. J. Dairy Sci. 2022, 105, 8342–8353. [Google Scholar] [CrossRef] [Scilit]
  5. Rajala-Schultz, P.J.; Hogan, J.S.; Smith, K.L. Short Communication: Association Between Milk Yield at Dry-Off and Probability of Intramammary Infections at Calving. J. Dairy Sci. 2005, 88, 577–579. [Google Scholar] [CrossRef] [Scilit]
  6. Cattaneo, L.; Minuti, A.; Dahl, G.E.; Trevisi, E. Graduate Student Literature Review: The challenge of drying-off high-yielding dairy cows. J. Dairy Sci. 2023, 106, 6416–6426. [Google Scholar] [CrossRef] [Scilit]
  7. Capuco, A.V.; Akers, R.M.; Smith, J.J. Mammary growth in Holstein cows during the dry period: Quantification of nucleic acids and histology. J. Dairy Sci. 1997, 80, 477–487. [Google Scholar] [CrossRef] [Scilit]
  8. Sorensen, M.T.; Nørgaard, J.V.; Theil, P.K.; Vestergaard, M.; Sejrsen, K. Cell Turnover and Activity in Mammary Tissue During Lactation and the Dry Period in Dairy Cows. J. Dairy Sci. 2006, 89, 4632–4639. [Google Scholar] [CrossRef] [Scilit]
  9. Caixeta, L.S.; Omontese, B.O. Monitoring and Improving the Metabolic Health of Dairy Cows during the Transition Period. Animals 2021, 11, 352. [Google Scholar] [CrossRef] [Scilit]
  10. Niemi, R.E.; Hovinen, M.; Vilar, M.J.; Simojoki, H.; Rajala-Schultz, P.J. Dry cow therapy and early lactation udder health problems-associations and risk factors. Prev. Vet. Med. 2021, 188, 105268. [Google Scholar] [CrossRef] [Scilit]
  11. Regulation (EU) 2019/6 of the European Parliament and of the Council of 11 December 2018 on Veterinary Medicinal Products and Repealing Directive 2001/82/EC. Available online: http://data.europa.eu/eli/reg/2019/6/oj (accessed on 10 February 2026).
  12. Hommels, N.M.C.; Ferreira, F.C.; van den Borne, B.H.P.; Hogeveen, H. Antibiotic use and potential economic impact of implementing selective dry cow therapy in large US dairies. J. Dairy Sci. 2021, 104, 8931–8946. [Google Scholar] [CrossRef] [Scilit]
  13. Weber, J.; Borchardt, S.; Seidel, J.; Schreiter, R.; Wehrle, F.; Donat, K.; Freick, M. Effects of Selective Dry Cow Treatment on Intramammary Infection Risk after Calving, Cure Risk during the Dry Period, and Antibiotic Use at Drying-Off: A Systematic Review and Meta-Analysis of Current Literature (2000–2021). Animals 2021, 11, 3403. [Google Scholar] [CrossRef] [Scilit] [PubMed]
  14. Dancy, K.M.; Ribeiro, E.S.; De Vries, T.J. Effect of dietary transition at dry off on the behavior and physiology of dairy cows. J. Dairy Sci. 2019, 102, 4387–4402. [Google Scholar] [CrossRef] [Scilit] [PubMed]
  15. Lopreiato, V.; Mezzetti, M.; Cattaneo, L.; Ferronato, G.; Minuti, A.; Trevisi, E. Role of nutraceuticals during the transition period of dairy cows: A review. J. Anim. Sci. Biotechnol. 2020, 11, 96. [Google Scholar] [CrossRef] [Scilit] [PubMed]
  16. Gazzola, A.; Ceccarani, C.; Castiglioni, B.; Biscarini, F.; Morandi, S.; Silvetti, T.; Piccinini, R.; Brasca, M.; Cremonesi, P. Nisin A-producing Lactococcus cremoris formulations for pre- and post-milking teat disinfection modulate the bovine milk microbiota. BMC Vet. Res. 2025, 21, 48. [Google Scholar] [CrossRef] [Scilit]
  17. Trevisi, E.; Minuti, A. Assessment of the innate immune response in the periparturient cow. Res. Vet. Sci. 2018, 116, 47–54. [Google Scholar] [CrossRef] [Scilit]
  18. Bouwstra, R.J.; Nielen, M.; Stegeman, J.A.; Dobbelaar, P.; Newbold, J.R.; Jansen, E.H.J.M.; van Werven, T. Vitamin E supplementation during the dry period in dairy cattle. Part I: Adverse effect on incidence of mastitis postpartum in a double-blind randomized field trial. J. Dairy Sci. 2010, 93, 5684–5695. [Google Scholar] [CrossRef] [Scilit]
  19. Cattaneo, L.; Piccioli-Cappelli, F.; Minuti, A.; Trevisi, E. Drying-off dairy cows without antibiotic therapy and orally supplemented with lyophilized Aloe arborescens: Effects on rumen activity, immunometabolic profile, and milk yield. J. Anim. Physiol. Anim. Nutr. 2023, 107, 794–807. [Google Scholar] [CrossRef] [Scilit]
  20. McArt, J.A.A.; Wieland, M. Efficacy of internal and external teat sealants on cure and new infection risk in dry-off protocols for Holstein cows. JDS Comm. 2024, 5, 644–648. [Google Scholar] [CrossRef] [Scilit]
  21. El Ashmawy, W.R.; Okello, E.; Williams, D.R.; Anderson, R.J.; Karle, B.; Lehenbauer, T.W.; Aly, S.S. Effectiveness of Intramammary Antibiotics, Internal Teat Sealants, or Both at Dry-Off in Dairy Cows: Milk Production and Somatic Cell Count Outcomes. Vet. Sci. 2022, 9, 559. [Google Scholar] [CrossRef] [Scilit]
  22. Pearce, S.D.; Parmley, E.J.; Winder, C.B.; Sargeant, J.M.; Prashad, M.; Ringelberg, M.; Felker, M.; Kelton, D.F. Evaluating the efficacy of internal teat sealants at dry-off for the prevention of new intra-mammary infections during the dry-period or clinical mastitis during early lactation in dairy cows: A systematic review update and sequential meta-analysis. Prev. Vet. Med. 2023, 212, 105841. [Google Scholar] [CrossRef] [Scilit] [PubMed]
  23. Cremonesi, P.; Biscarini, F.; Conte, G.; Piccioli-Cappelli, F.; Morandi, S.; Silvetti, T.; Tringali, S.; Trevisi, E.; Castiglioni, B.; Brasca, M. Aloe arborescens supplementation in drying-off dairy cows: Influence on rumen, rectum and milk microbiomes. Anim. Microbiome 2024, 6, 49. [Google Scholar] [CrossRef] [Scilit] [PubMed]
  24. Qu, Q.; Jin, L. Application of nuclear magnetic resonance in food analysis. Food Sci. Technol. 2022, 42, e43622. [Google Scholar] [CrossRef] [Scilit]
  25. Alkanan, Z.T.; Altemimi, A.B.; Awlqadr, F.H.; Alkaisy, Q.H.; Bagher Hashemi, S.M.; Pratap-Singh, A. Exploring the Frontiers of Food Science: A Comprehensive Review of Advanced Magnetic Resonance Applications in Food Analysis, Quality Analysis, and Safety Assessment. Food Sci. Nutr. 2025, 13, 7. [Google Scholar] [CrossRef] [Scilit]
  26. National Research Council. Nutrient Requirements of Dairy Cattle, 7th ed.; National Academies of Sciences: Washington, DC, USA, 2001.
  27. Phuenpong, M.; Kongboonkird, M.; Duangmal, K.; Lerdvorasap, W.; Suksawwawimon, M.; Mekboonsonglarp, W.; Nuamchit, N.; Chantaprasarn, N.; Settachaimongkon, S. Molecular discrimination between organic and conventional liquid milk products in Thailand using 1H-NMR metabolomics approach. Trop. Anim. Sci. 2021, 44, 478–488. [Google Scholar] [CrossRef] [Scilit]
  28. Sundekilde, U.K.; Larsen, L.B.; Bertram, H.C. NMR-based milk metabolomics. Metabolites 2013, 3, 204–222. [Google Scholar] [CrossRef] [Scilit]
  29. Fangyu, F.; Furihata, K.; Ito-Ishida, M.; Kaminogawa, S.; Tanokura, M. Nondestructive observation of bovine milk by NMR spectroscopy: Analysis of existing states of compounds and detection of new compounds. J. Agric. Food Chem. 2004, 52, 4969–4974. [Google Scholar] [CrossRef] [Scilit]
  30. Tsiafoulis, C.G.; Papaemmanouil, C.; Alivertis, D.; Tzamaloukas, O.; Miltiadou, D.; Balayssac, S.; Malet-Martino, M.; Gerothanassis, I.P. NMR-based metabolomics of the lipid fraction of organic and conventional bovine milk. Metabolites 2019, 24, 1067. [Google Scholar] [CrossRef] [Scilit]
  31. Zhu, C.; Tang, K.; Lu, X.; Tang, J.; Laghi, L. An Untargeted Metabolomics Investigation of Milk from Dairy Cows with Clinical Mastitis by 1H-NMR. Foods 2021, 10, 1707. [Google Scholar] [CrossRef] [Scilit]
  32. Tsermoula, P.; Kristensen, N.B.; Mobaraki, N.; Engelsen, S.B.; Khakimov, B. Efficient Quantification of Milk Metabolites from 1H NMR Spectra Using the Signature Mapping (SigMa) Approach: Chemical Shift Library Development for Cows’ Milk and Colostrum. Anal. Chem. 2024, 96, 1861–1871. [Google Scholar] [CrossRef] [Scilit]
  33. Bobbo, T.; Meoni, G.; Niero, G.; Tenori, L.; Luchinat, C.; Cassandro, M.; Penasa, M. Nuclear magnetic resonance spectroscopy to investigate the association between milk metabolites and udder quarter health status in dairy cows. J. Dairy Sci. 2022, 105, 535–548. [Google Scholar] [CrossRef] [Scilit] [PubMed]
  34. Klein, M.S.; Almstetter, M.F.; Schlamberger, G.; Nürnberger, N.; Dettmer, K.; Oefner, P.J.; Meyer, H.H.D.; Wiedemann, S.; Gronwald, W. Nuclear magnetic resonance and mass spectrometry-based milk metabolomics in dairy cows during early and late lactation. J. Dairy Sci. 2010, 93, 1539–1550. [Google Scholar] [CrossRef] [Scilit] [PubMed]
  35. Chen, J.H.; Wu, Y.V.; DeCarolis, P.; O’Connor, R.; Somberg, C.J.; Singer, S. Resolution of creatine and phosphocreatine 1H signals in isolated human skeletal muscle using HR-MAS 1H NMR. Magn. Reson. Med. 2008, 59, 1221–1224. [Google Scholar] [CrossRef] [Scilit] [PubMed]
  36. Alexandri, E.; Ahmed, R.; Siddiqui, H.; Choudhary, M.I.; Tsiafoulis, C.G.; Gerothanassis, I.P. High Resolution NMR Spectroscopy as a Structural and Analytical Tool for Unsaturated Lipids in Solution. Molecules 2017, 22, 1663. [Google Scholar] [CrossRef] [Scilit]
  37. Ralli, E.; Spyros, A. A Study of Greek Graviera Cheese by NMR-Based Metabolomics. Molecules 2023, 28, 5488. [Google Scholar] [CrossRef] [Scilit]
  38. Eltemur, D.; Robatscher, P.; Oberhuber, M.; Ceccon, A. Improved Detection and Quantification of Cyclopropane Fatty Acids via Homonuclear Decoupling Double Irradiation NMR Methods. ACS Omega 2023, 8, 41835–41843. [Google Scholar] [CrossRef] [Scilit]
  39. Xu, W.; van Knegsel, A.; Saccenti, E.; van Hoeij, R.; Kemp, B.; Vervoort, J. Metabolomics of Milk Reflects a Negative Energy Balance in Cows. J. Proteome Res. 2020, 19, 2942–2949. [Google Scholar] [CrossRef] [Scilit]
  40. Boccia, A.C.; Cusano, E.; Scano, P.; Consonni, R. NMR Lipid Profile of Milk from Alpine Goats with Supplemented Hempseed and Linseed Diets. Molecules 2020, 25, 1491. [Google Scholar] [CrossRef] [Scilit]
  41. Compton, D.L.; Vermillion, K.E.; Laszlo, J.A. Acyl Migration Kinetics of 2-Monoacylglycerols from Soybean Oil via 1H NMR. J. AOCS 2007, 84, 343–348. [Google Scholar] [CrossRef] [Scilit]
  42. Lolli, V.; Marseglia, A.; Palla, G.; Zanardi, E.; Caligiani, A. Determination of Cyclopropane Fatty Acids in Food of Animal Origin by 1H NMR. J. Anal. Methods Chem. 2018, 2018, 8034042. [Google Scholar] [CrossRef] [Scilit]
  43. Scano, P.; Anedda, R.; Melis, M.P.; Dessi’, M.A.; Lai, A.; Roggio, T. 1H- and 13C-NMR Characterization of the Molecular Components of the Lipid Fraction of Pecorino Sardo Cheese. J. Am. Oil Chem. Soc. 2011, 88, 1305–1316. [Google Scholar] [CrossRef] [Scilit]
Figure 1. 1H NMR spectrum of aqueous cow milk extract at 600 MHz and 298 K. Each number in the figure corresponds to a specific identified metabolite: 1, butyrate; 2, leucine; 3, valine; 4, 3-hydroxybutyrate; 5, lactate; 6, alanine; 7, acetate; 8, N-acetylglucosamine; 9, N-acetylcarbohydrates; 10, glutamate; 11, O-acetylcarnitine; 12, 2-oxoglutarate; 13, citrate; 14, methylamine; 15, dimethylamine; 16, creatine/phosphorylcreatine; 17, creatinine; 18, dimethylsulfone; 19, O-acetylcarnitine; 20, glycerophosphorylcoline; 21, lactose; 22, choline; 23, phosphorylcholine; 24, galactose; 25, mannose; 26, glucose 1-phosphate; 27, urea; 28, UDP-derivatives; 29, orotate; 30, fumarate; 31, tyrosine; 32, phenylalanine and derivatives; 33, hippurate; 34, histidine; 35, formate; 36, galactose 1-phosphate; 37, cytidine.
Foods 15 00770 g001
Figure 2. 1H NMR spectrum of cow milk organic fraction at 600 MHz, in CDCl3 at 298 K. The insert shows an expanded region of the spectrum between 3.5 and 6.8 ppm.
Foods 15 00770 g002
Figure 3. PCA score plot performed on milk aqueous extracts. In (a) samples are coloured according to the time of collection (purple pentagons for T0, and yellow hexagons for T1); in (b) samples collected at T1 are coloured according to the treatment (blue triangles for ASIG, pink dots for CTR, and green diamonds for SIG) and samples collected at T0 are represented with purple pentagons.
Foods 15 00770 g003
Figure 4. OPLS-DA score plot performed on milk aqueous extracts. Samples are coloured according to the time of collection: purple pentagons for T0, and yellow hexagons for T1. R2X = 93.3%, R2Y = 88.6%, and Q2 = 84.1%. Permutation test resulted in Q2 < 0 and R2Y = 0.05.
Foods 15 00770 g004
Figure 5. PCA score plots performed on all (a), CTR and SIG (b), CTR and ASIG (c), and SIG and ASIG (d) of aqueous milk extracts collected a T1. Samples are colored according to the treatment: pink dots for CTR, blue triangles for ASIG, and green diamonds for SIG. (a) 2PCs, R2X = 93.2% and Q2 = 55%, (b) 2PCs, R2X = 92% and Q2 = 29.1%, (c) 2PCs, R2X = 93.8% and Q2 = 47.3%, and (d) 4PCs, R2X = 99% and Q2 = 74.4%.
Foods 15 00770 g005aFoods 15 00770 g005b
Figure 6. PCA score plot performed on milk organic extracts. In (a) samples are coloured according to the time of collection (purple pentagons for T0, and yellow hexagons for T1); in (b) samples collected at T1 are coloured according to the treatment (blue triangles for ASIG, pink dots for CTR, and green diamonds for SIG) and samples collected at T0 are represented with purple pentagons.
Foods 15 00770 g006
Figure 7. OPLS-DA score plot performed on organic milk extracts. Samples are colored according to the time of collection: purple pentagons for T0, and yellow hexagons for T1. R2X = 40.4%, R2Y = 84.2%, and Q2 = 62.6%. Permutation test resulted in Q2 < 0 and R2Y = 0.52.
Foods 15 00770 g007
Figure 8. PCA score plots performed on all (a), CTR and SIG (b), CTR and ASIG (c), and SIG and ASIG (d) of organic milk extracts collected a T1. Samples are coloured according to the treatment (pink dots for CTR, blue dots for ASIG, and green dots for SIG). (a) 4PCs, R2X = 53.2% and Q2 = 10.5%, (b) 4PCs, R2X = 58.6% and Q2 = negative, (c) 3PCs, R2X = 50.8% and Q2 = negative, and (d) 2PCs, R2X = 44.5% and Q2 = 14.7%.
Foods 15 00770 g008
Disclaimer/Publisher’s Note: The statements, opinions and data contained in all publications are solely those of the individual author(s) and contributor(s) and not of MDPI and/or the editor(s). MDPI and/or the editor(s) disclaim responsibility for any injury to people or property resulting from any ideas, methods, instructions or products referred to in the content.