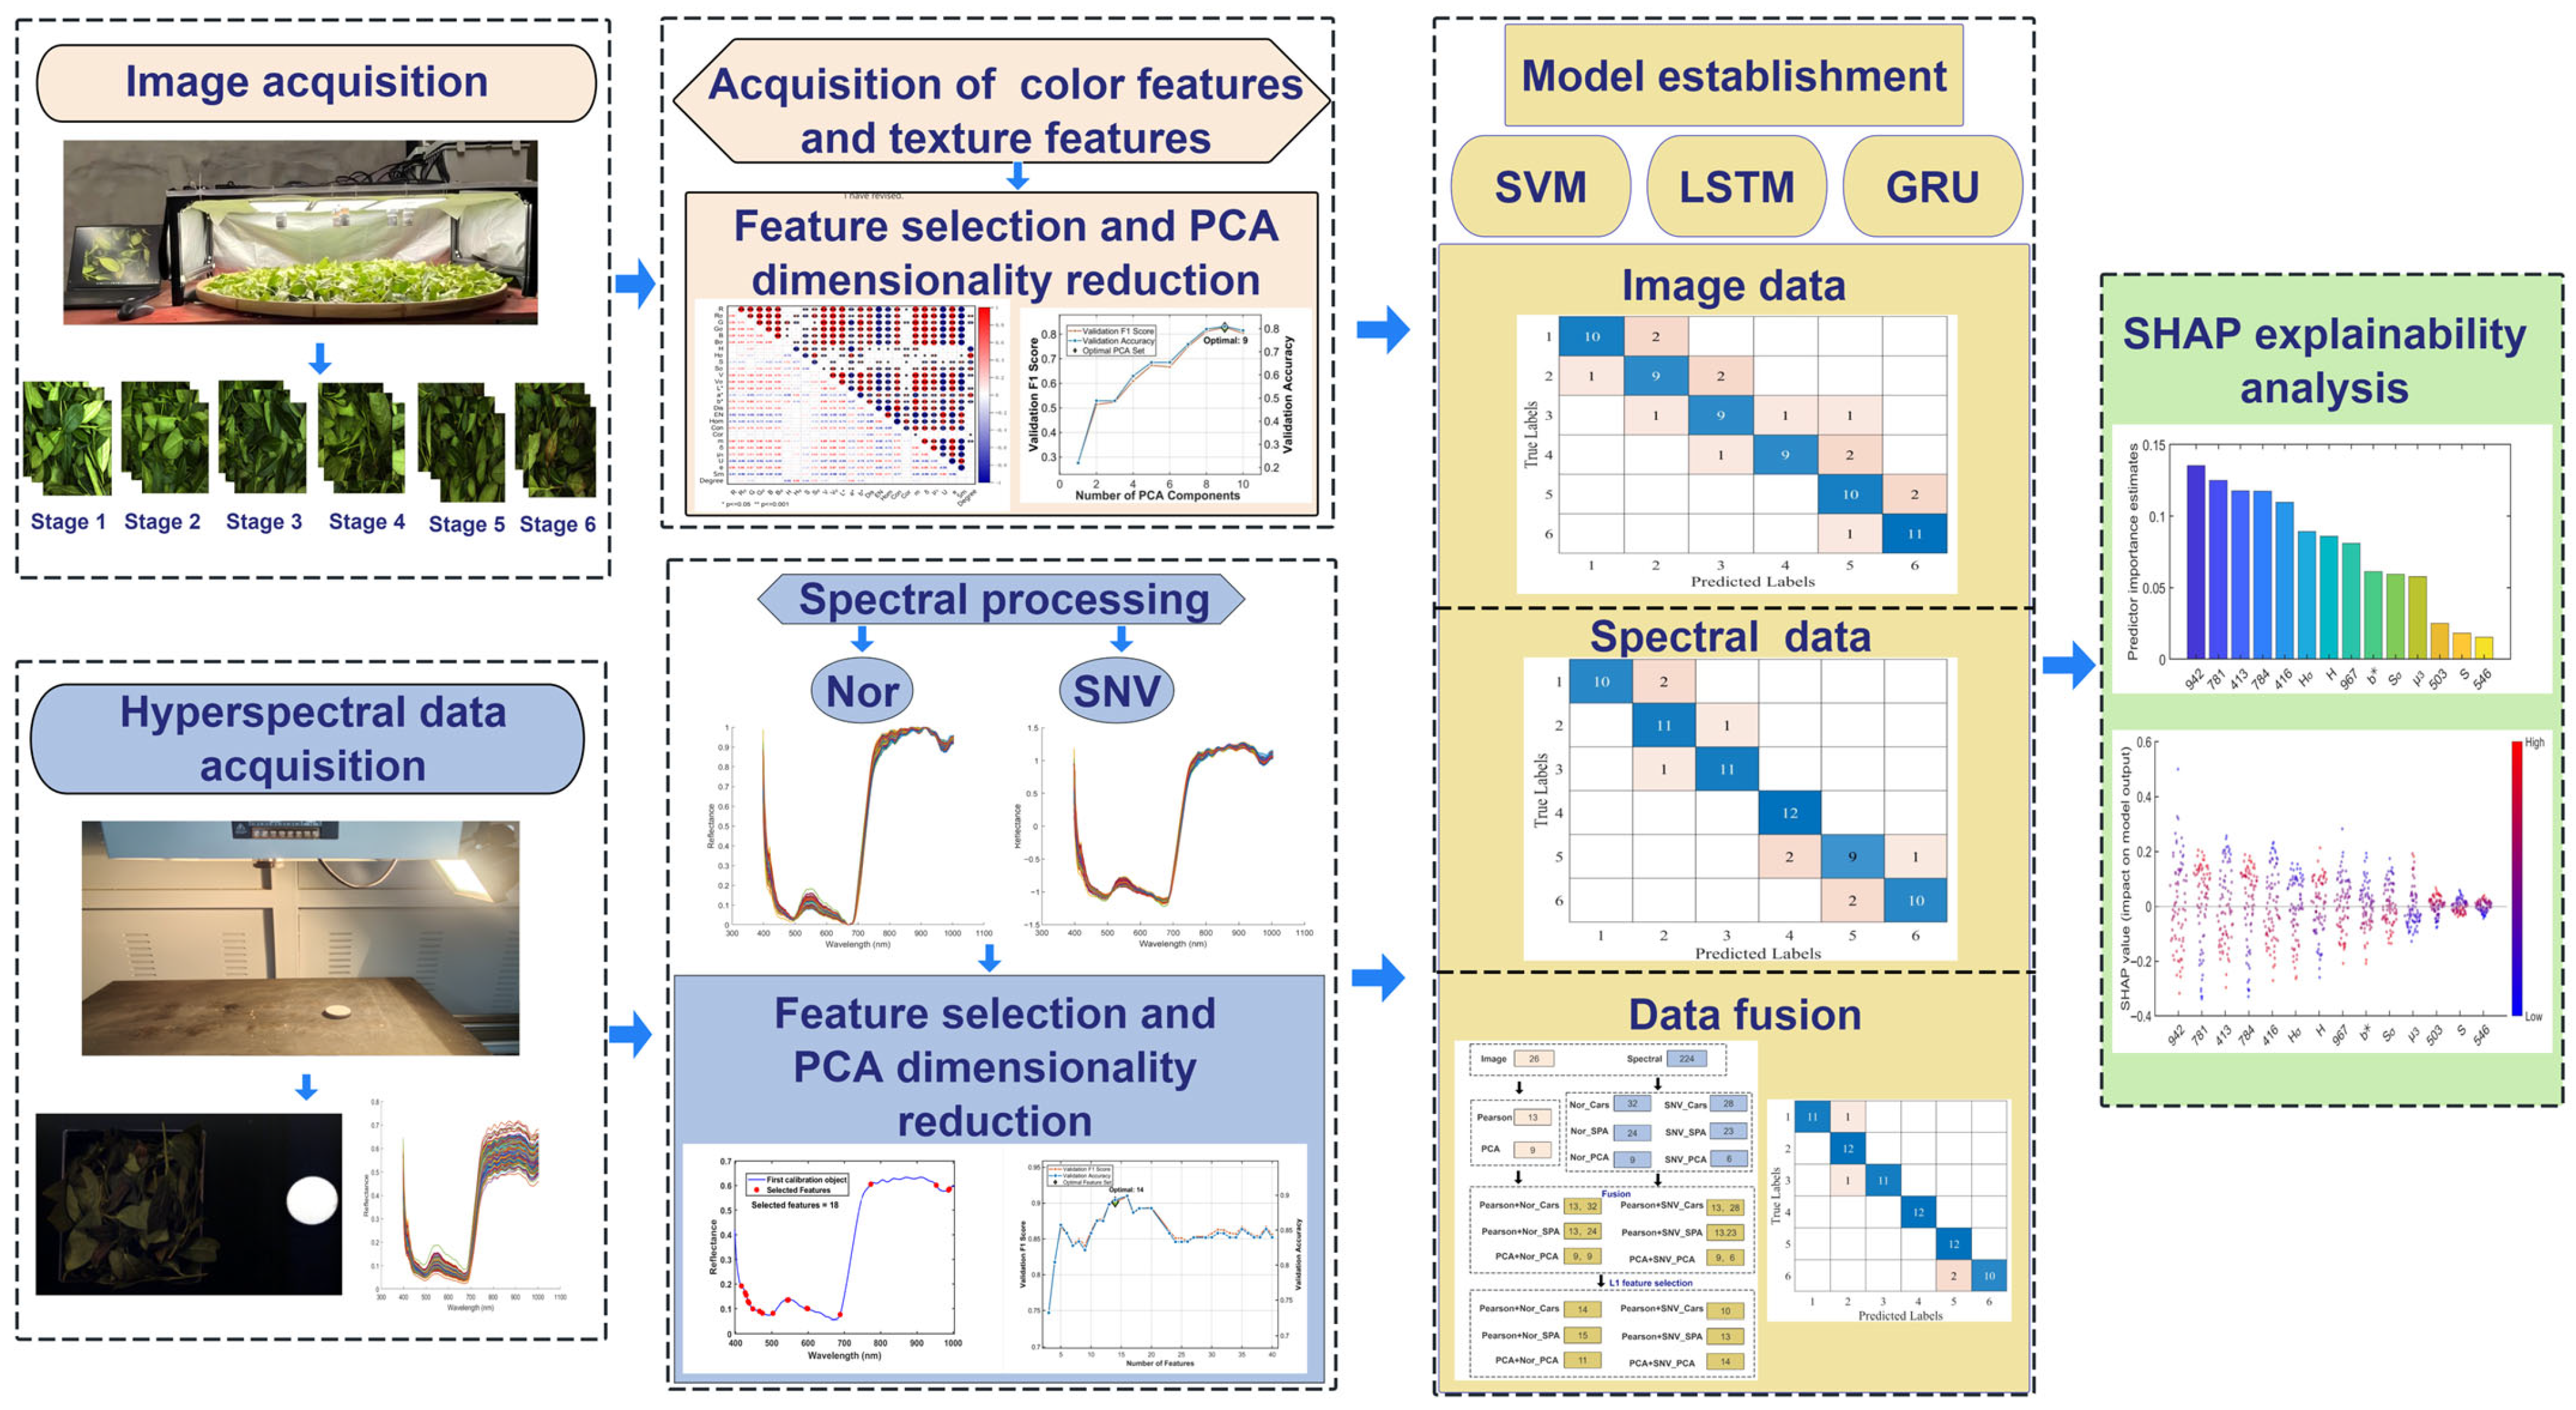
A Model for Identifying the Fermentation Degree of Tieguanyin Oolong Tea Based on RGB Image and Hyperspectral Data


Abstract
1. Introduction
2. Materials and Methods
2.1. Experimental Design and Sample Selection
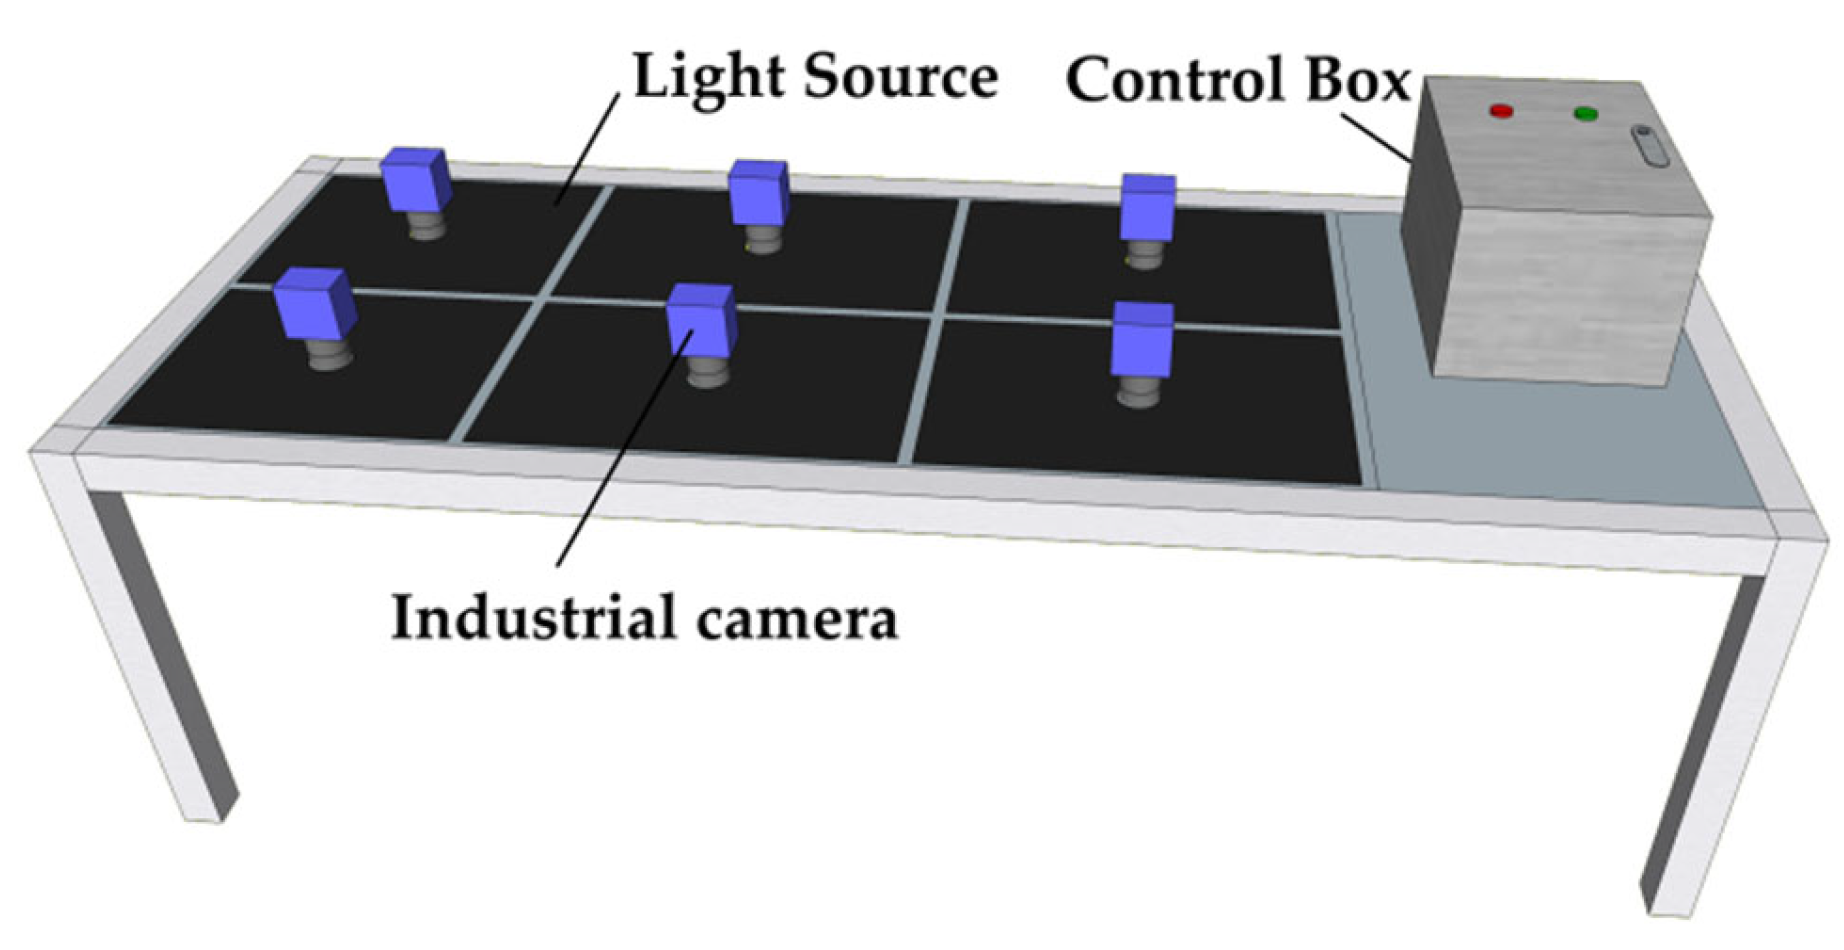
2.2. RGB Image Data Acquisition System
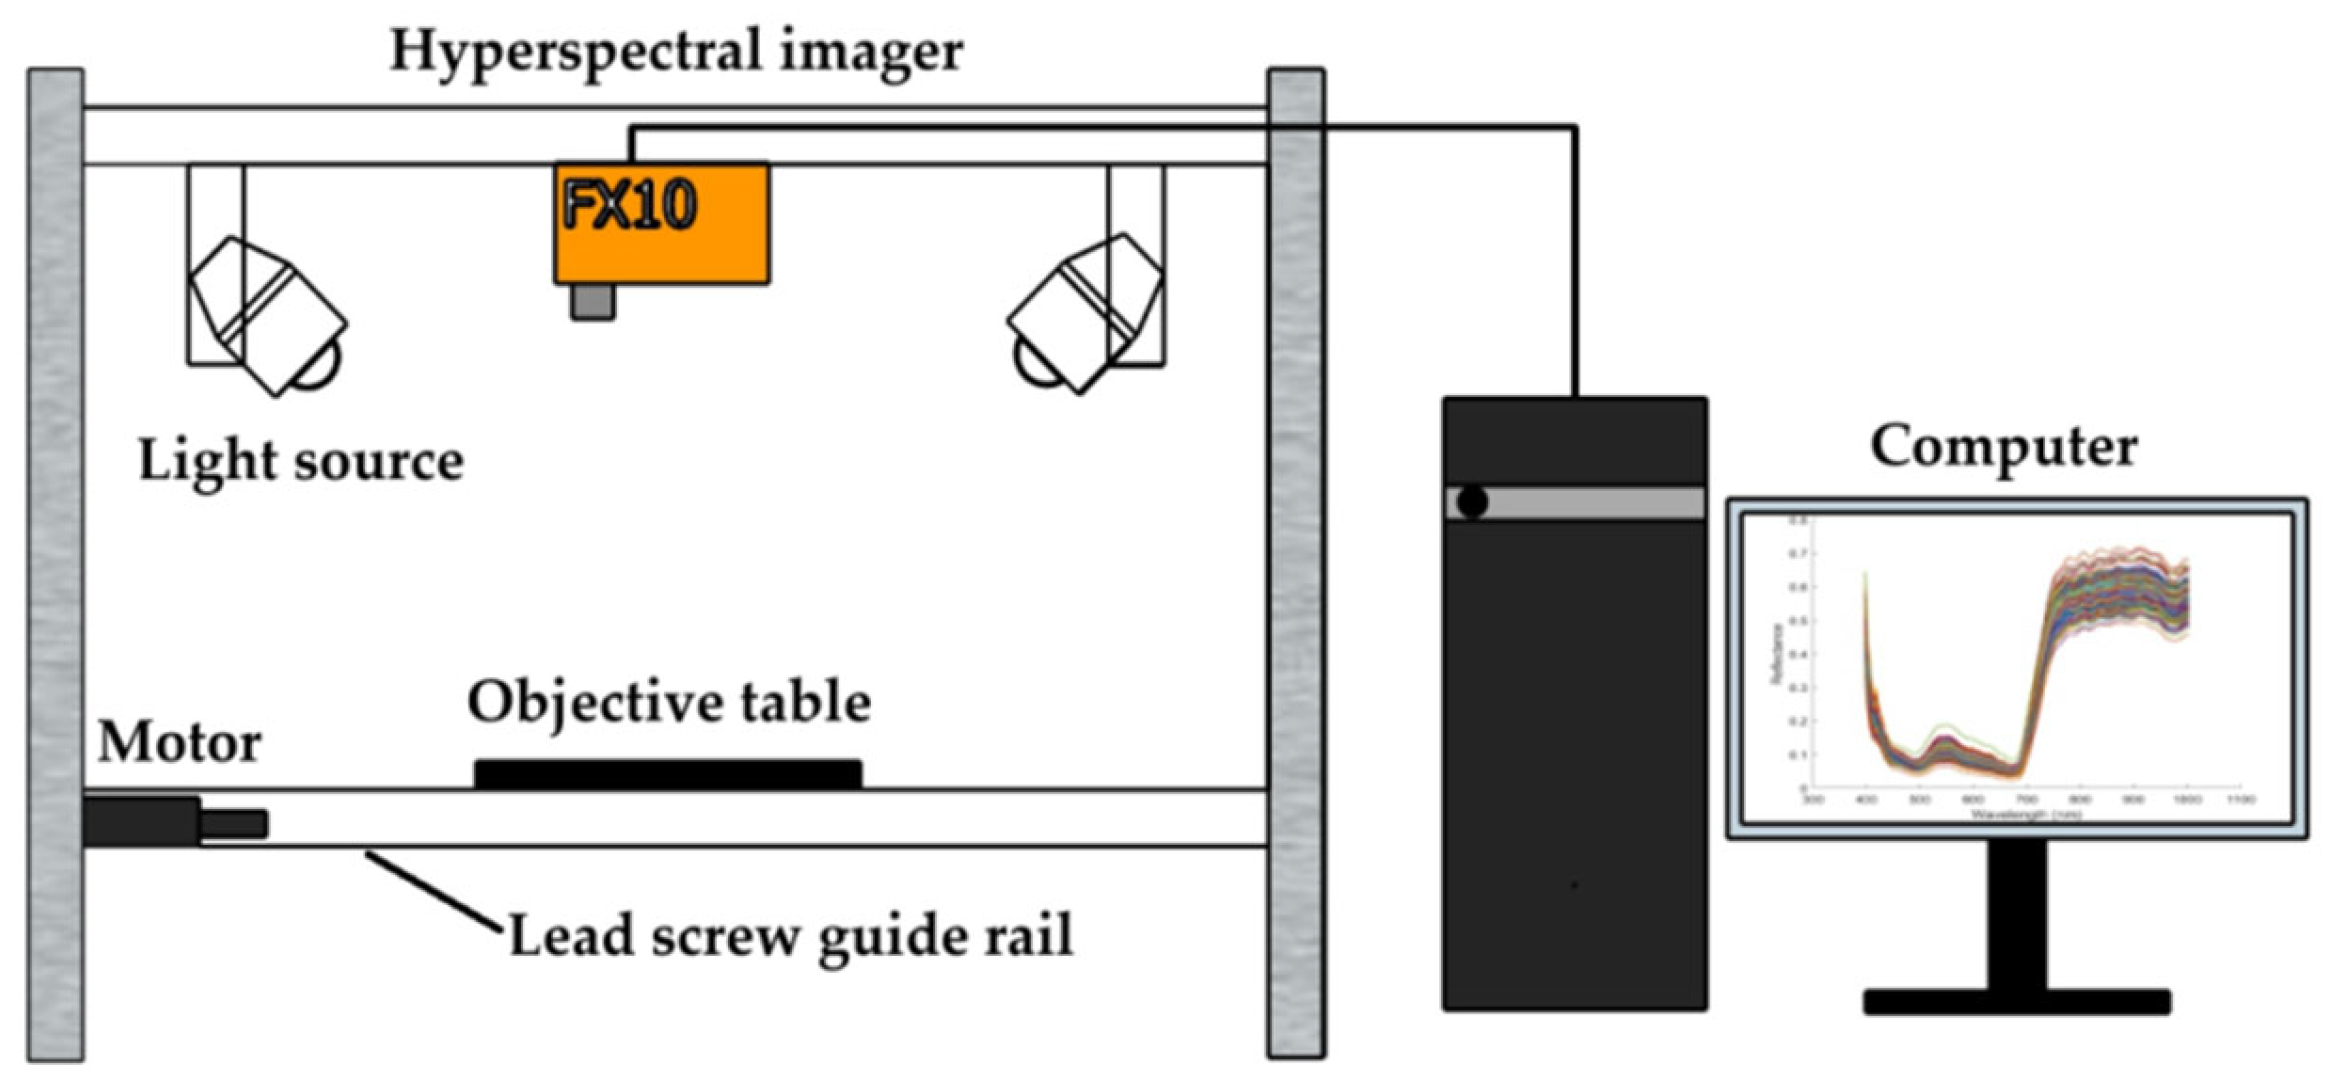
2.3. Hyperspectral Data Acquisition
2.4. Data Acquisition
2.4.1. RGB Image Feature Extraction
2.4.2. Hyperspectral Data Acquisition and Preprocessing Algorithm
2.5. Dimension Reduction and Feature Extraction Algorithms
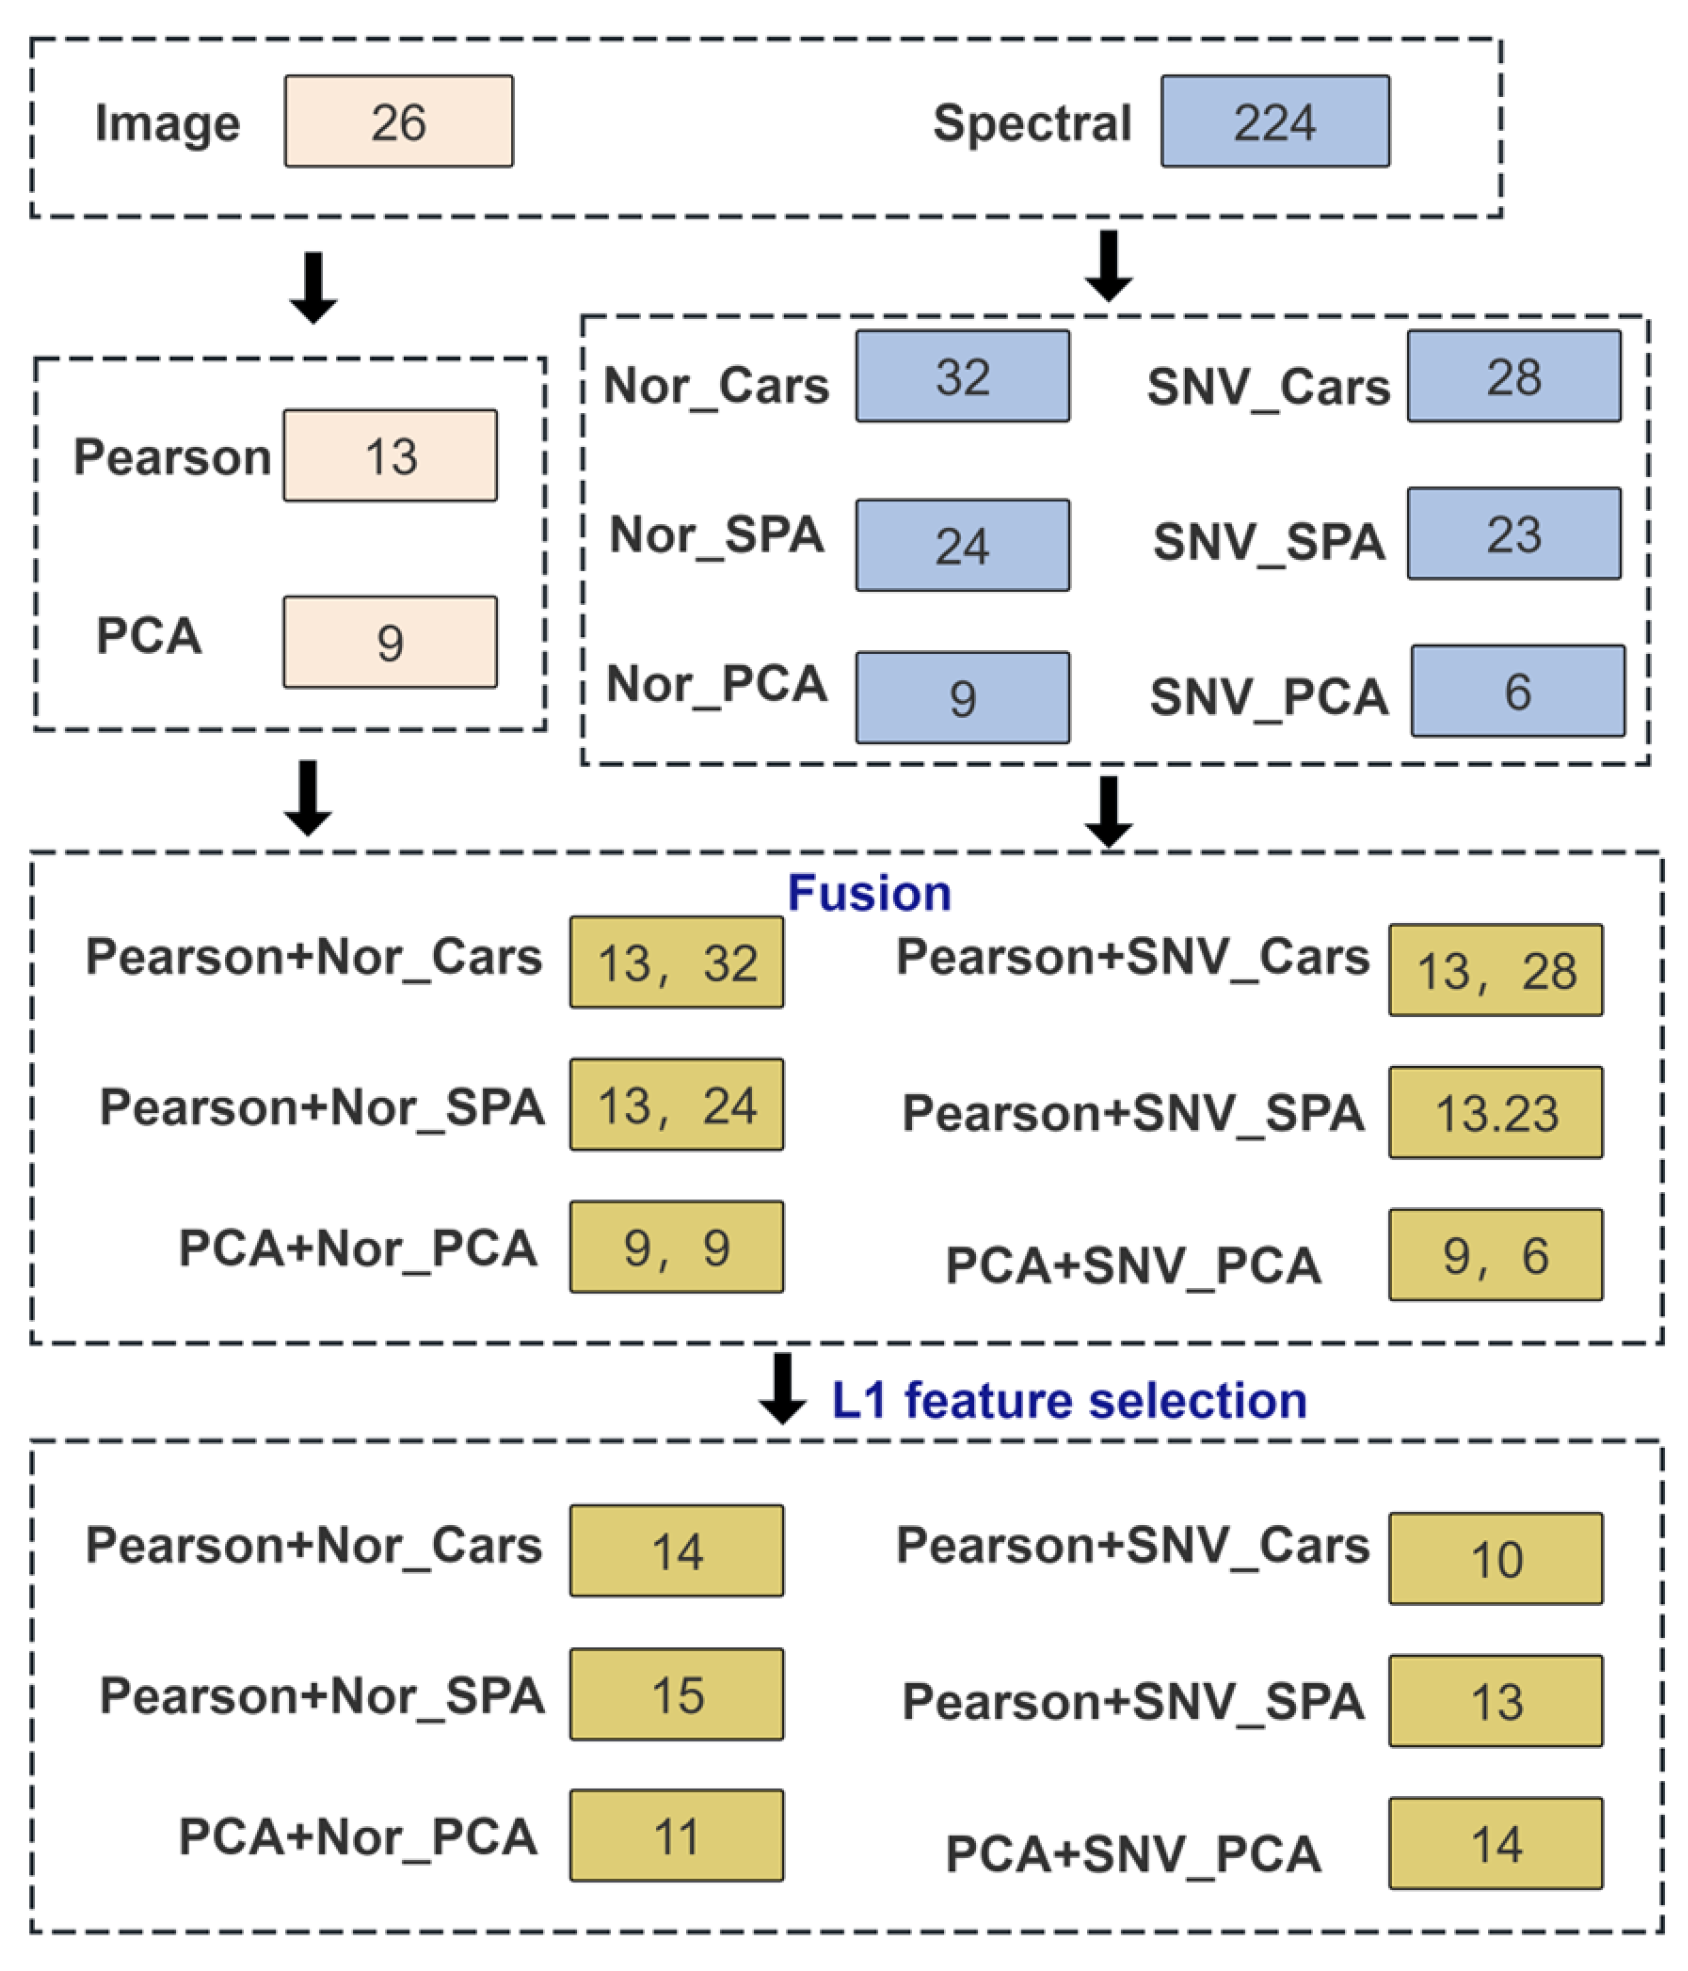
2.6. Data Fusion
2.7. SHAP Explainability Analysis
2.8. Models and Evaluation Metrics
2.8.1. Models
2.8.2. Model Hyperparameter Tuning and Validation Strategy
2.8.3. Model Evaluation Metrics
3. Experimental Results and Analysis
3.1. Fermentation Degree Model Based on Image Features
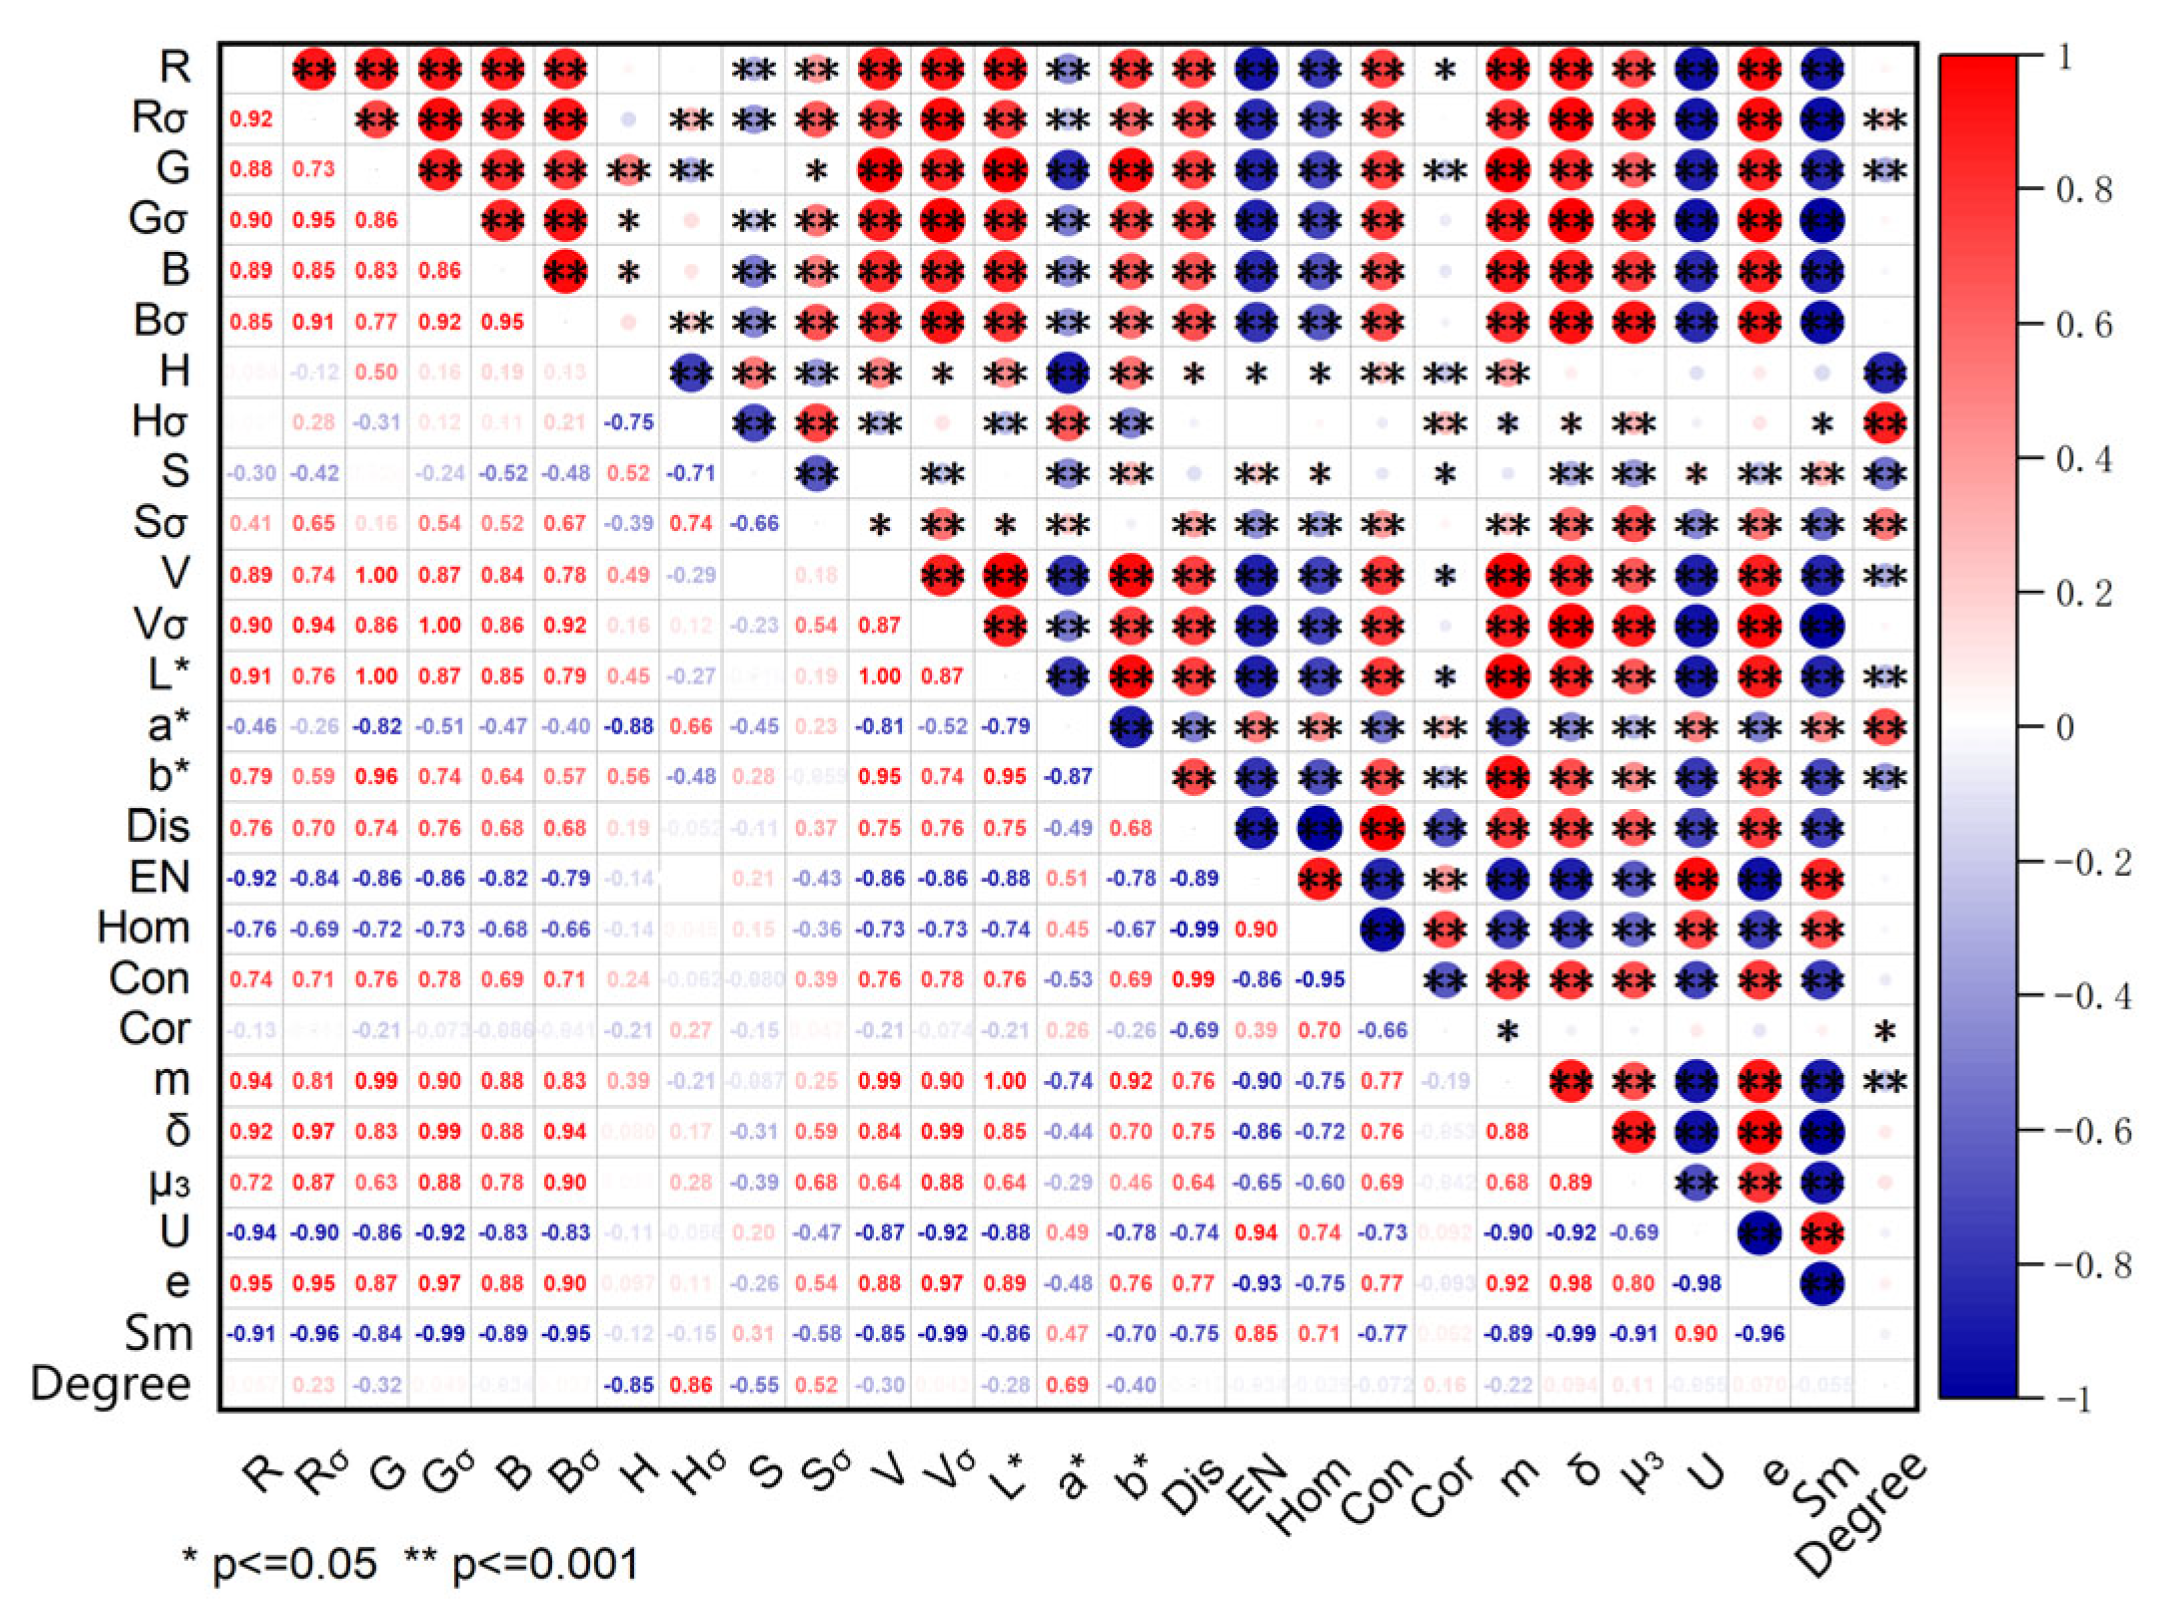
3.1.1. Image Feature Selection
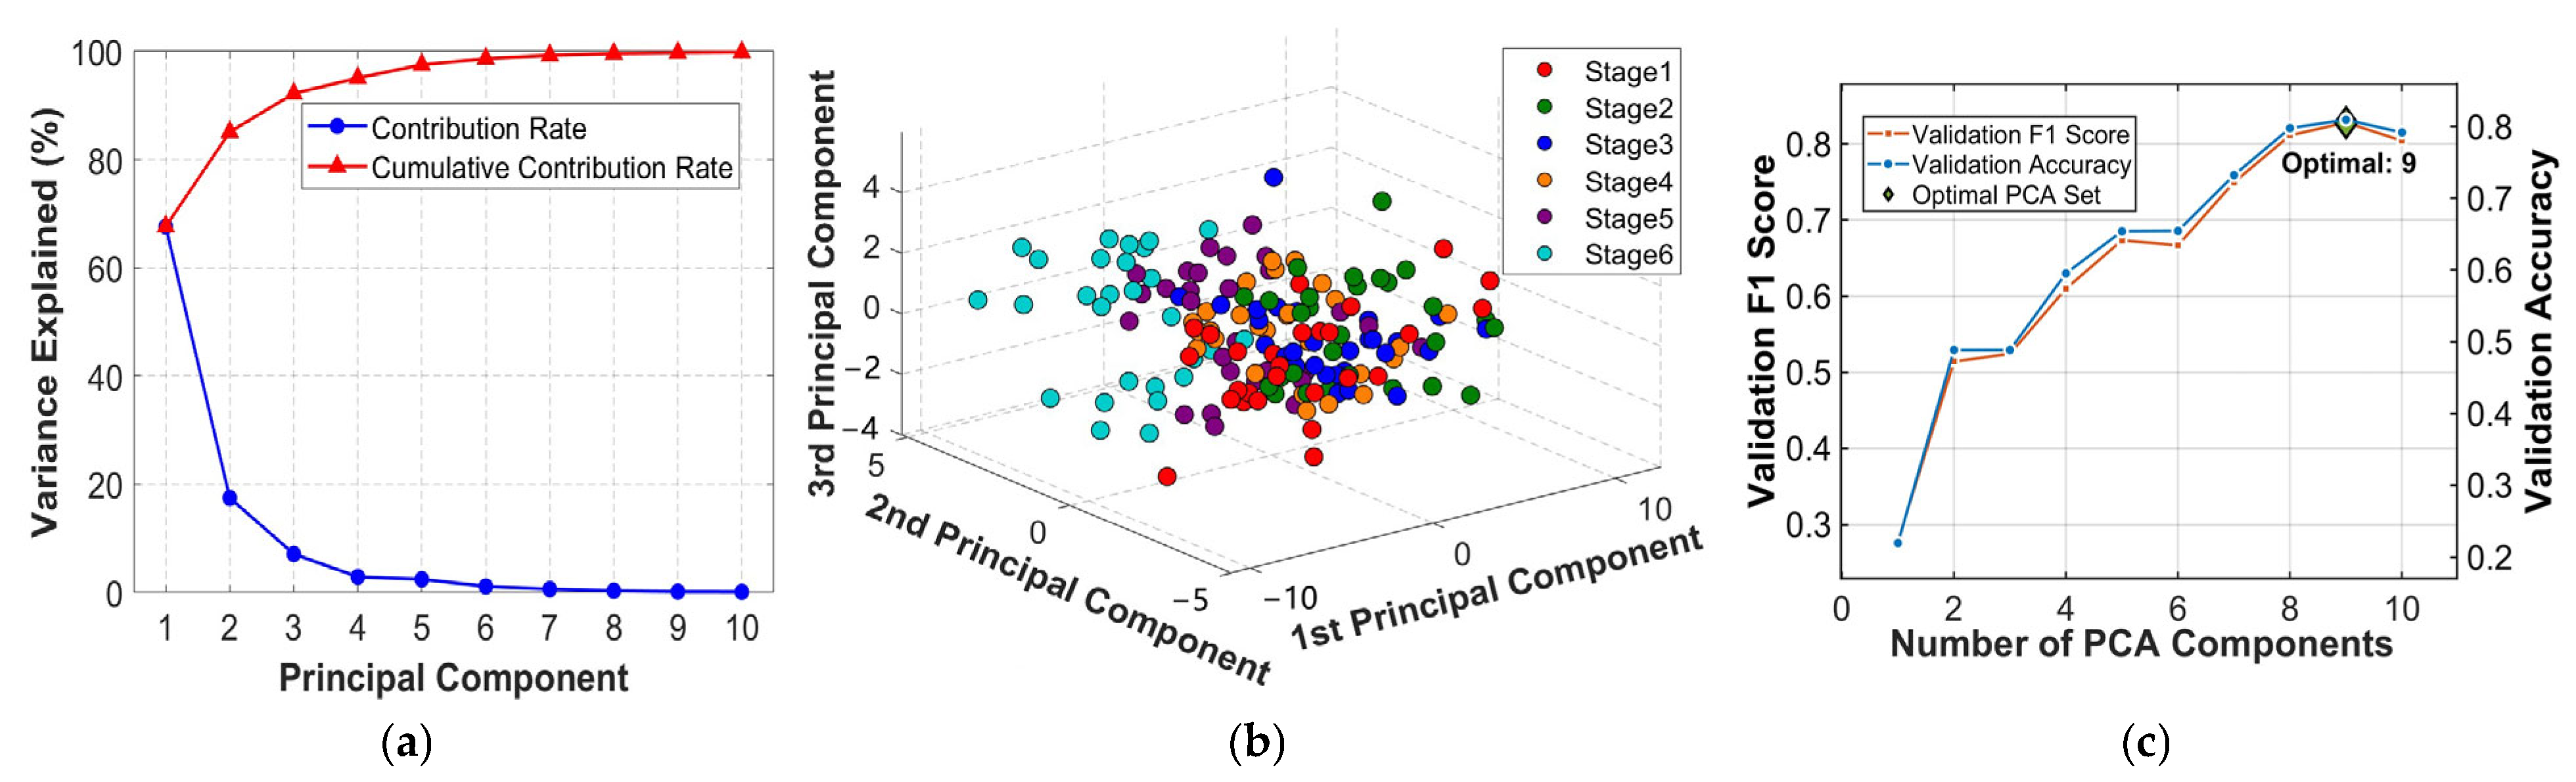
3.1.2. PCA Dimension Reduction in Image Features
3.1.3. Model Results Based on Image Features
3.2. Fermentation Degree Model Based on Hyperspectral Features
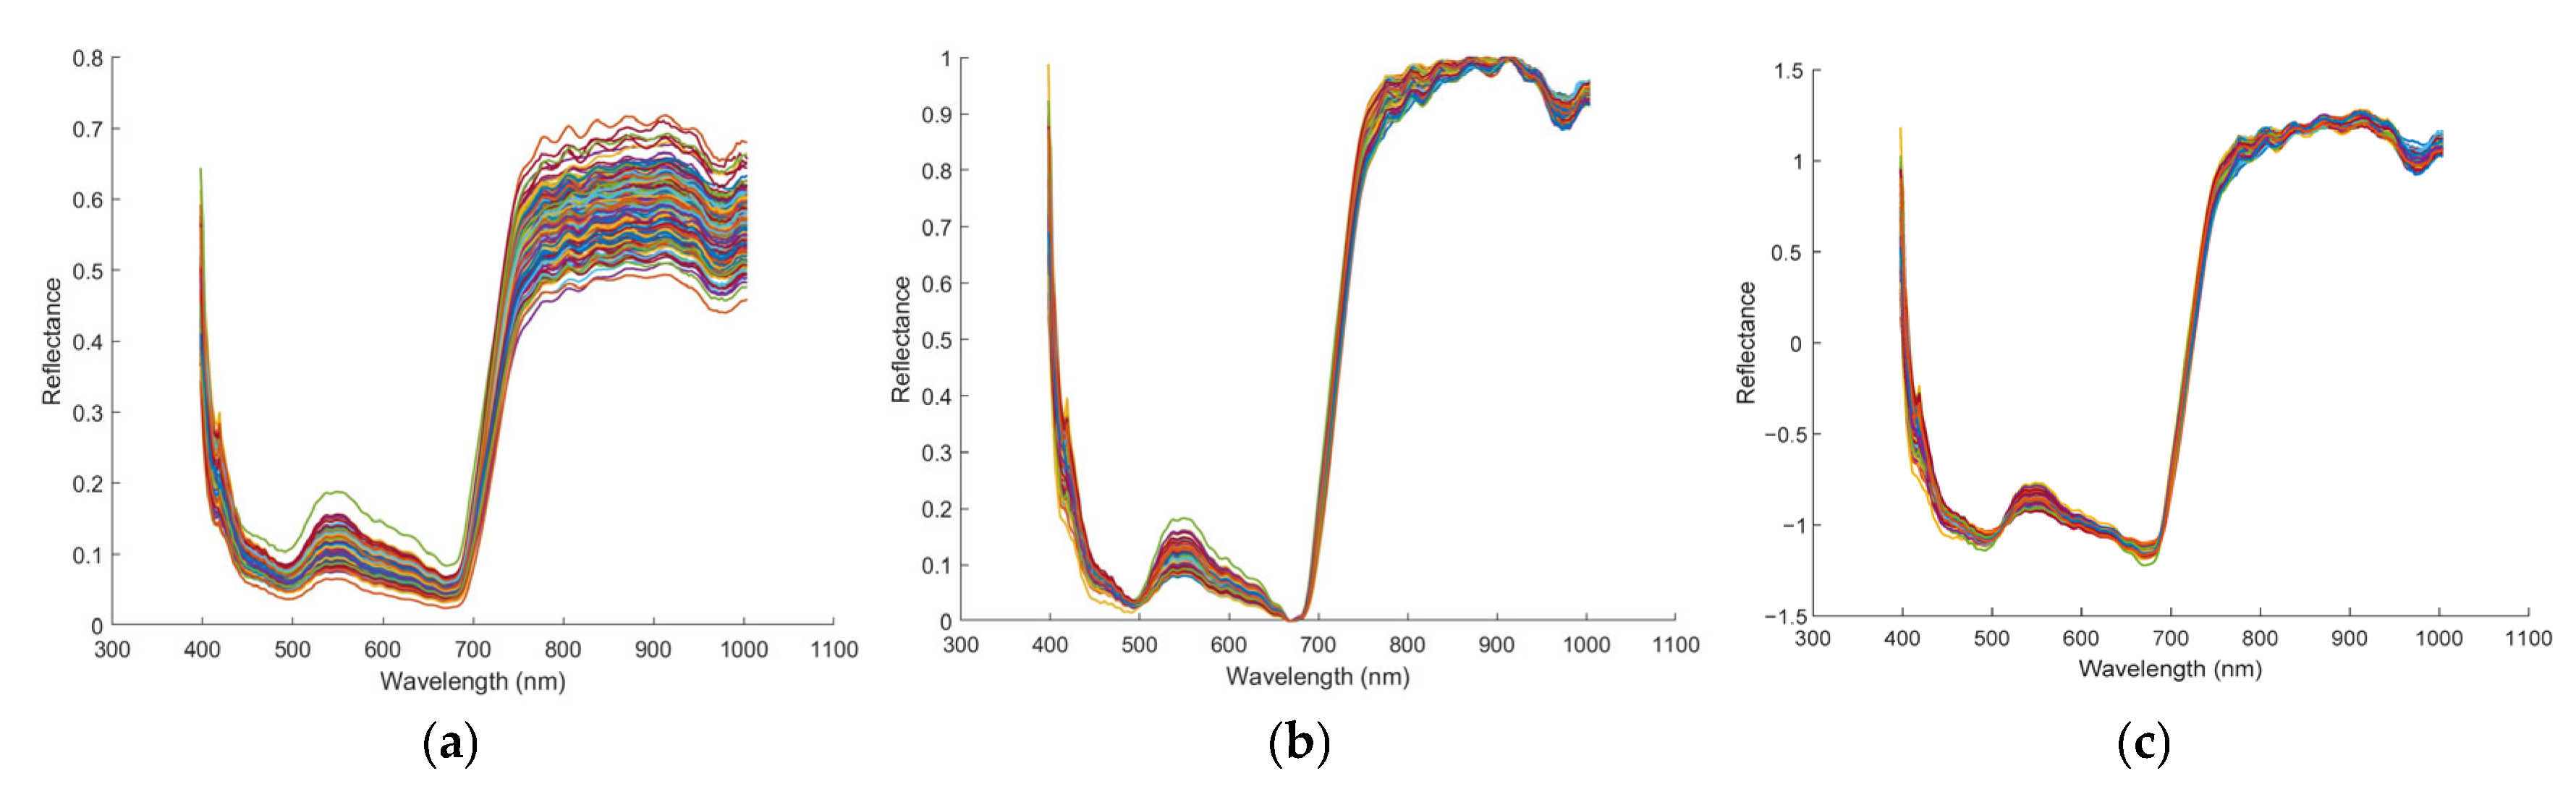
3.2.1. Hyperspectral Data Preprocessing Analysis
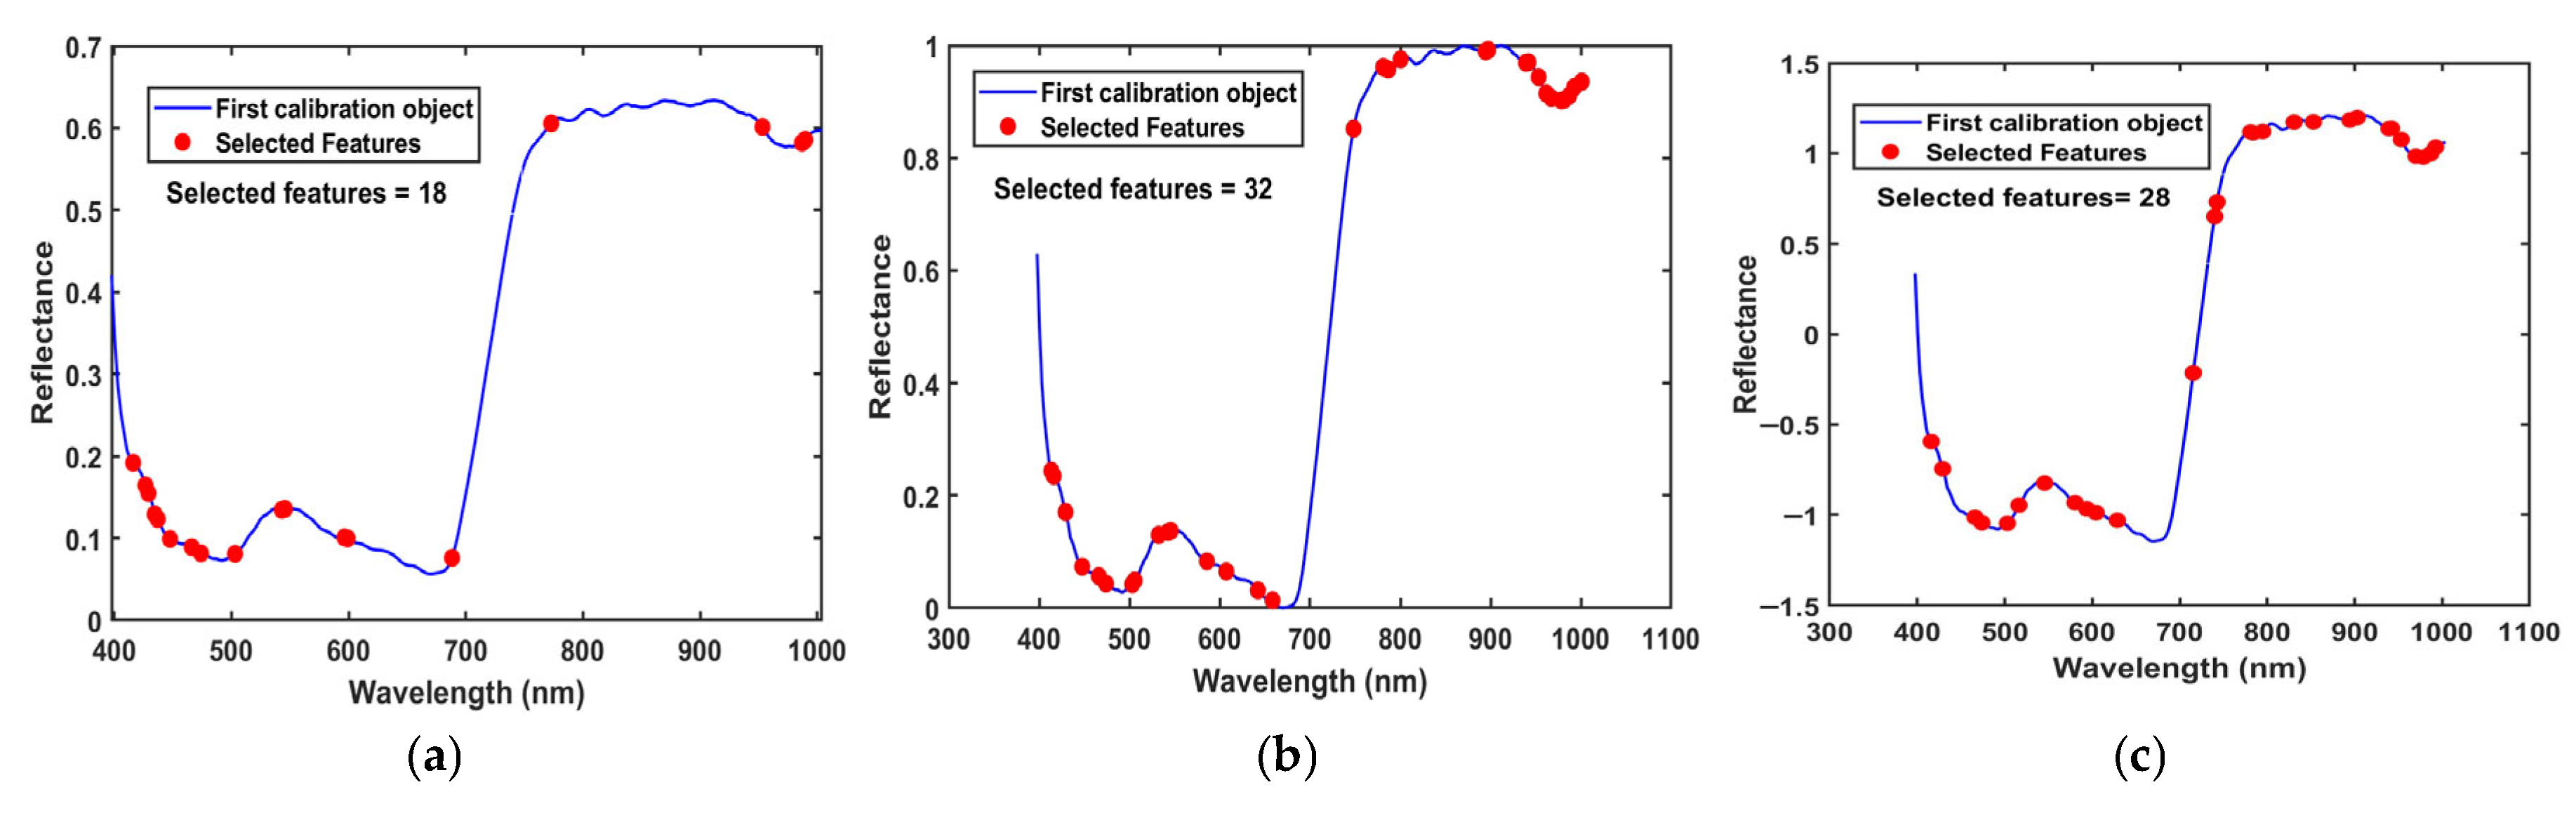
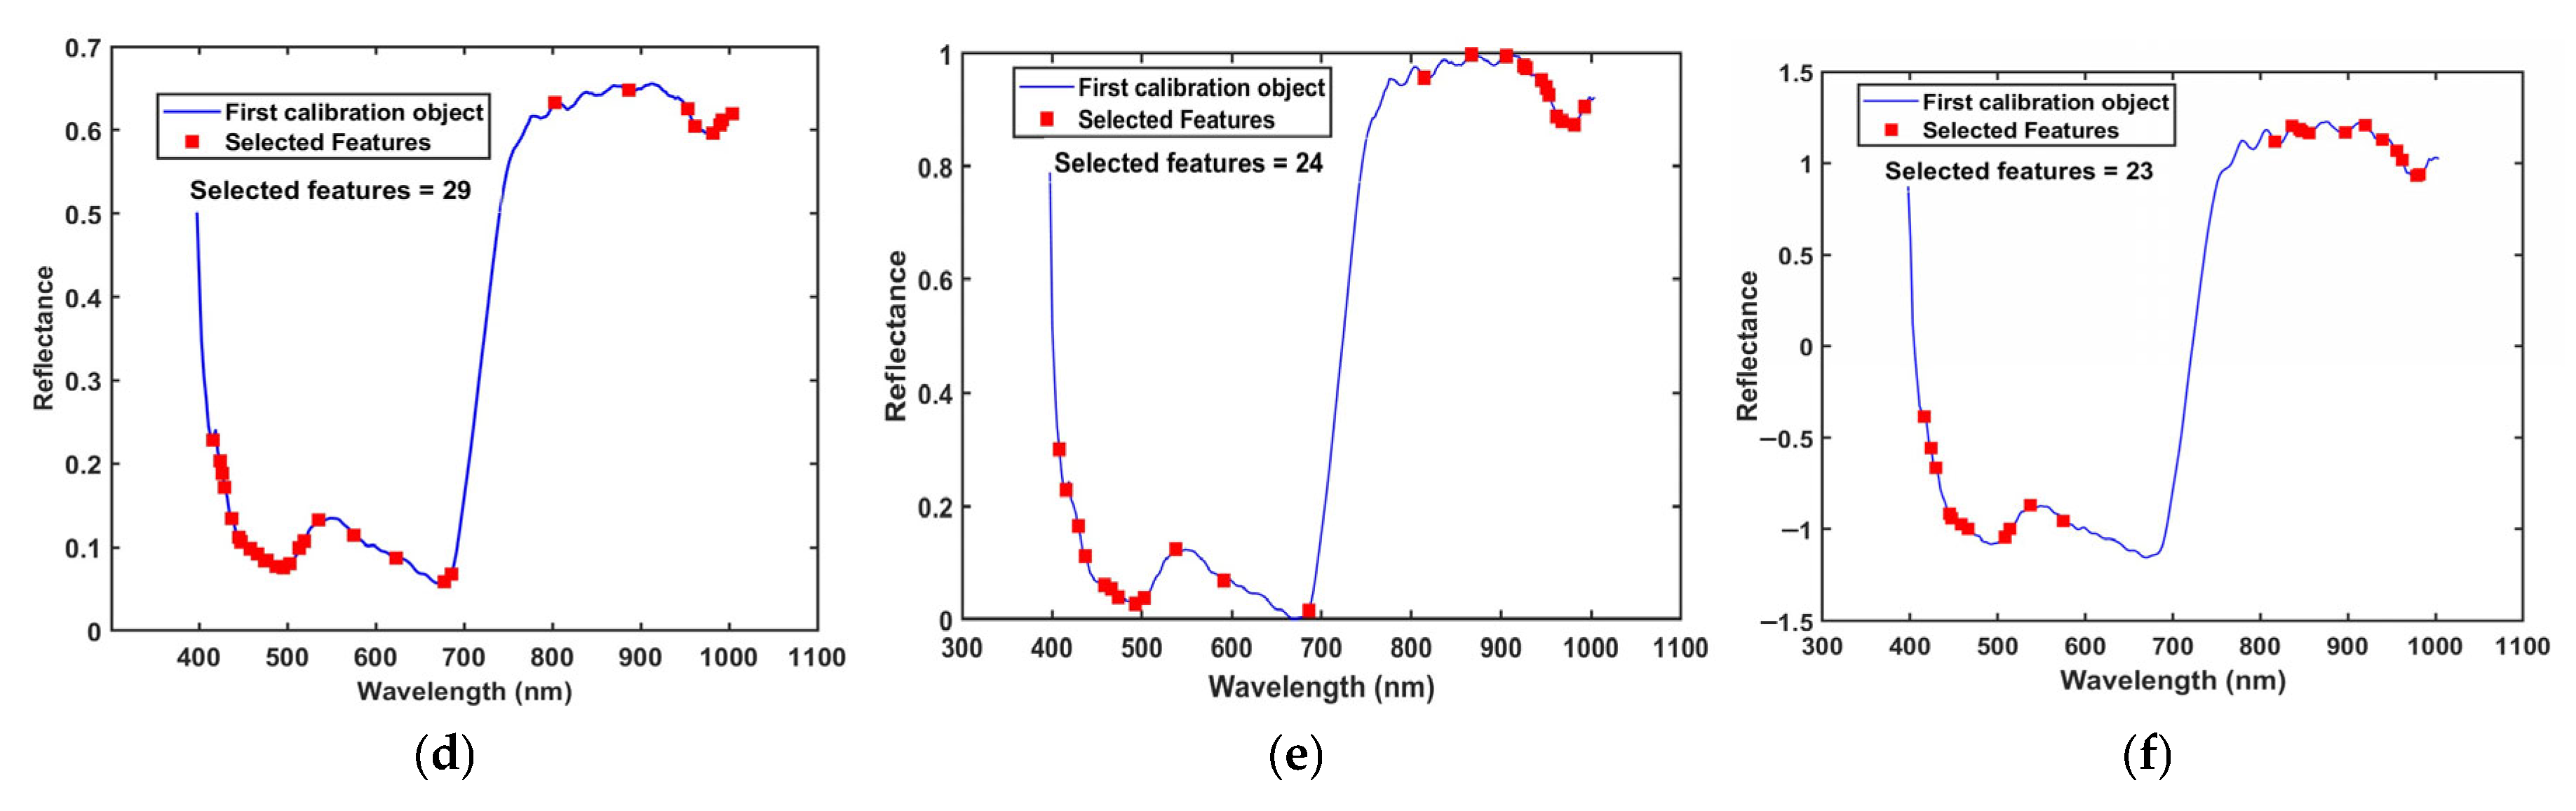
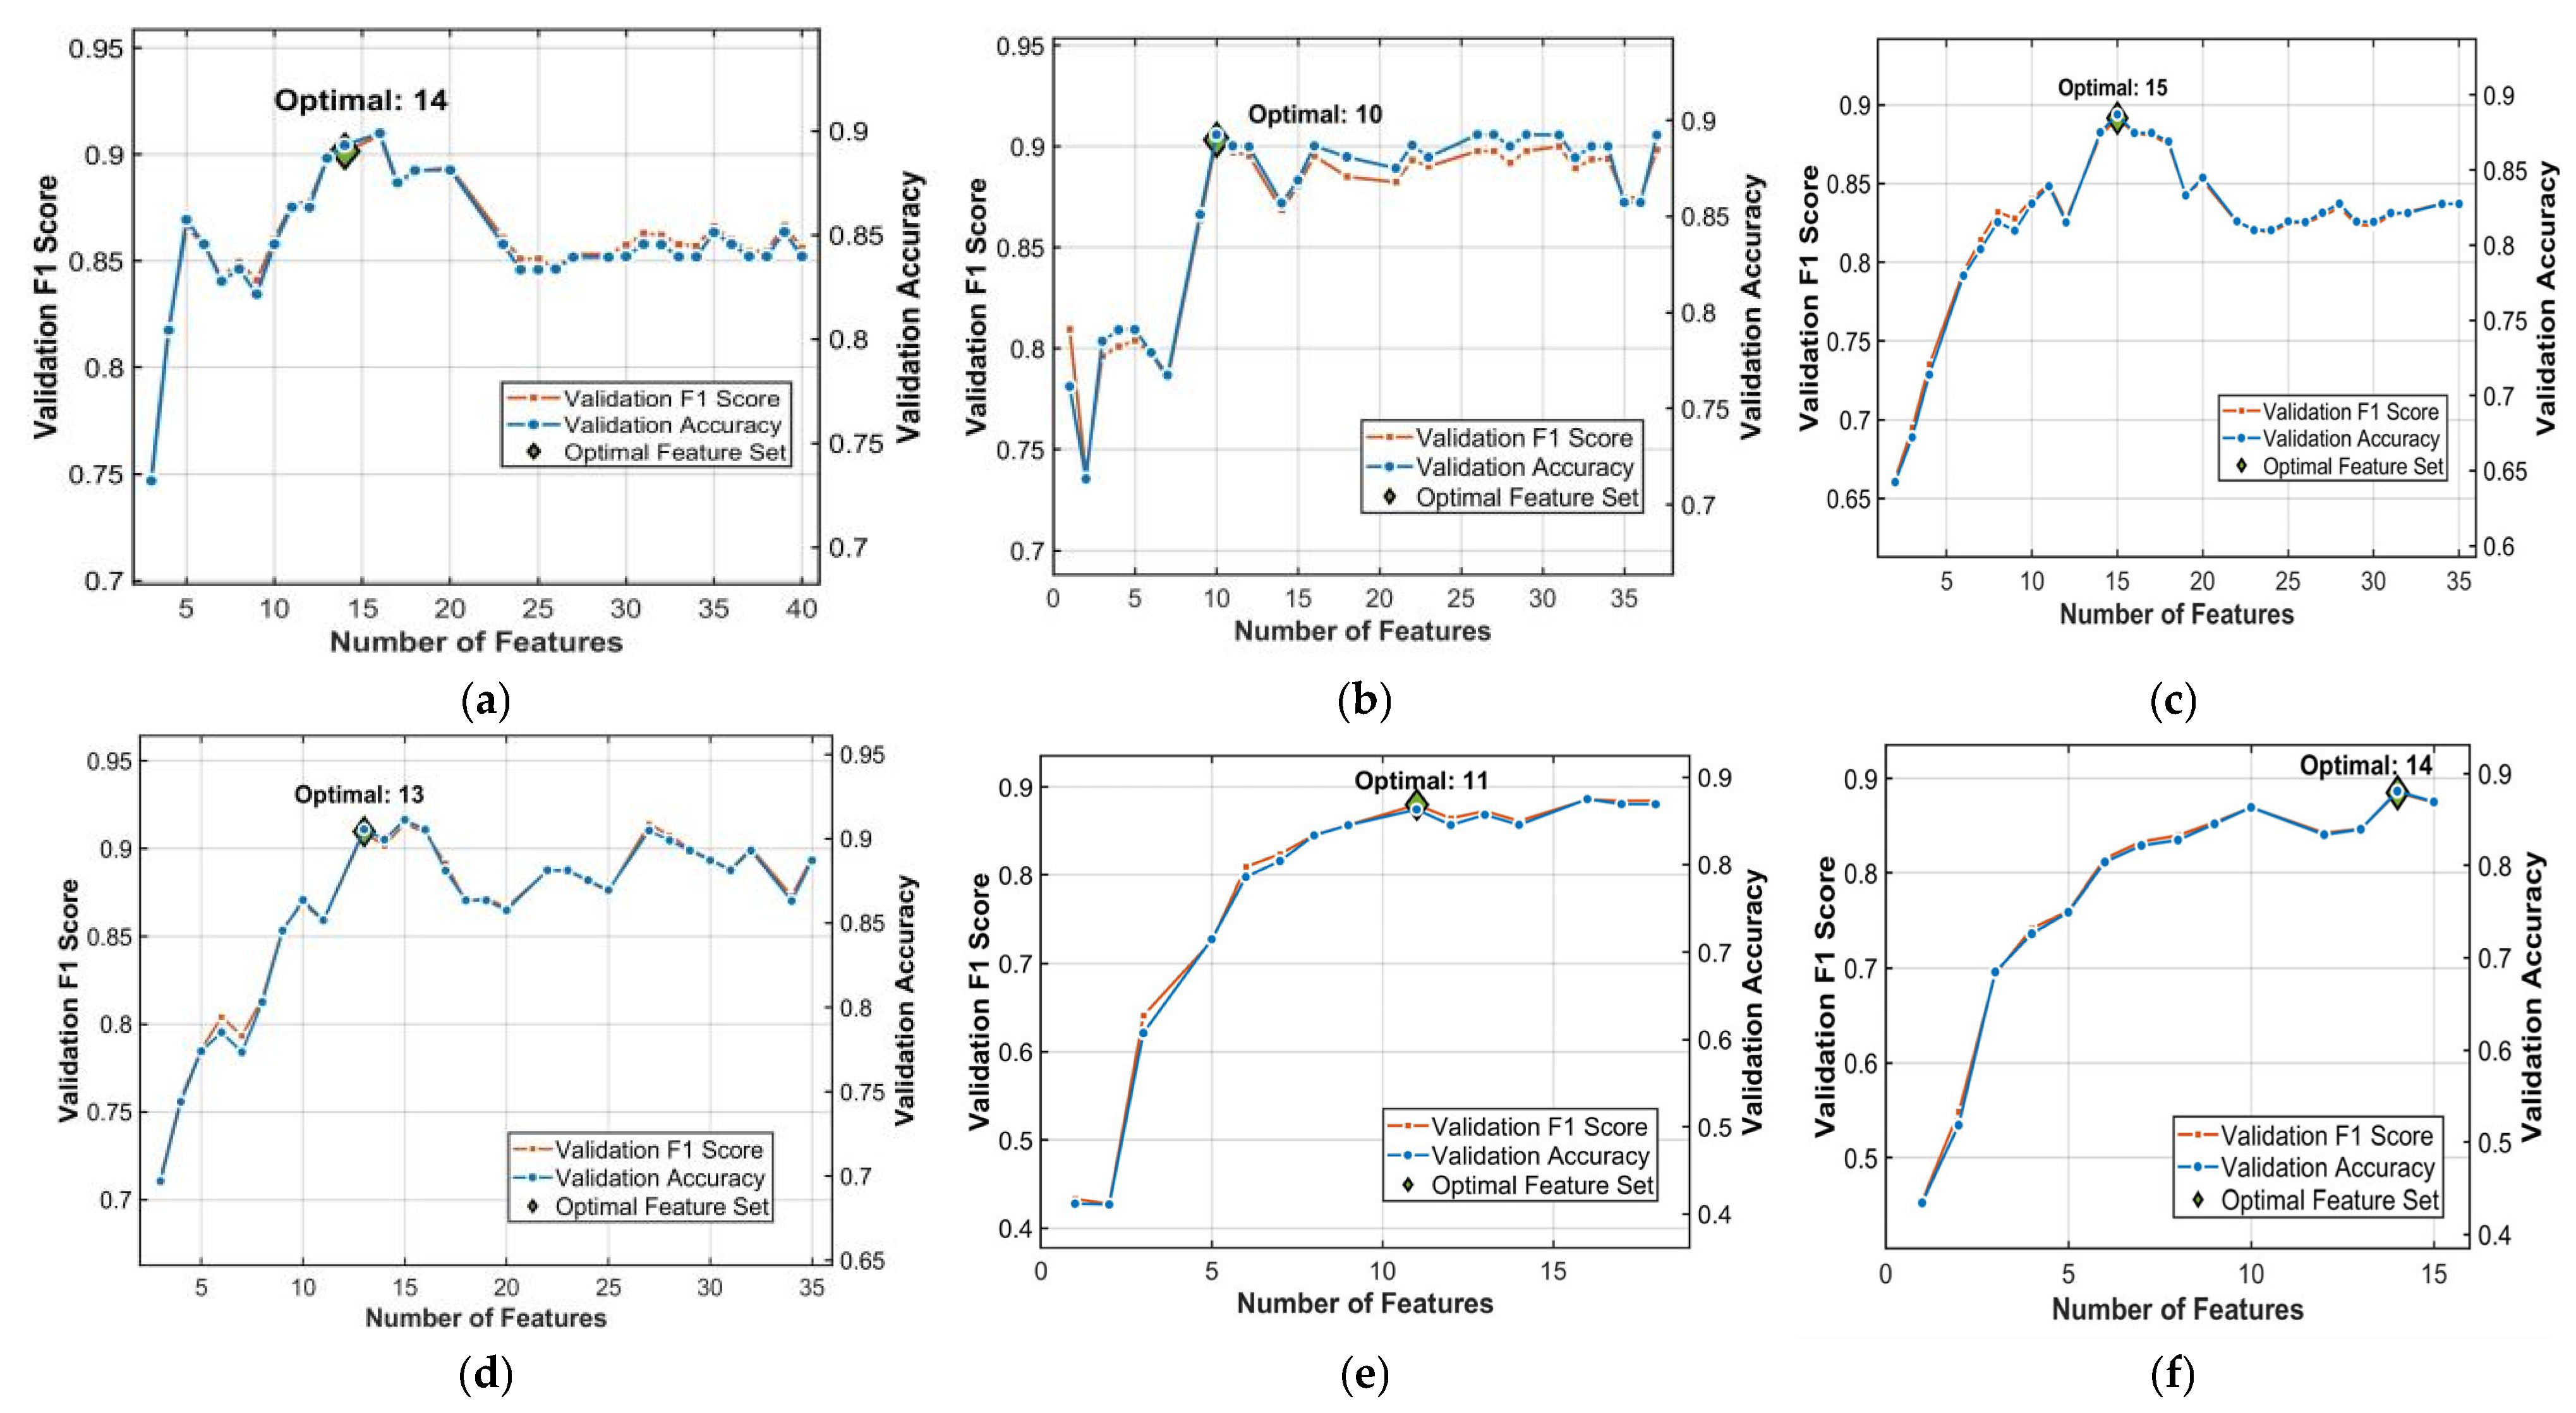
3.2.2. Extraction of Hyperspectral Feature Bands
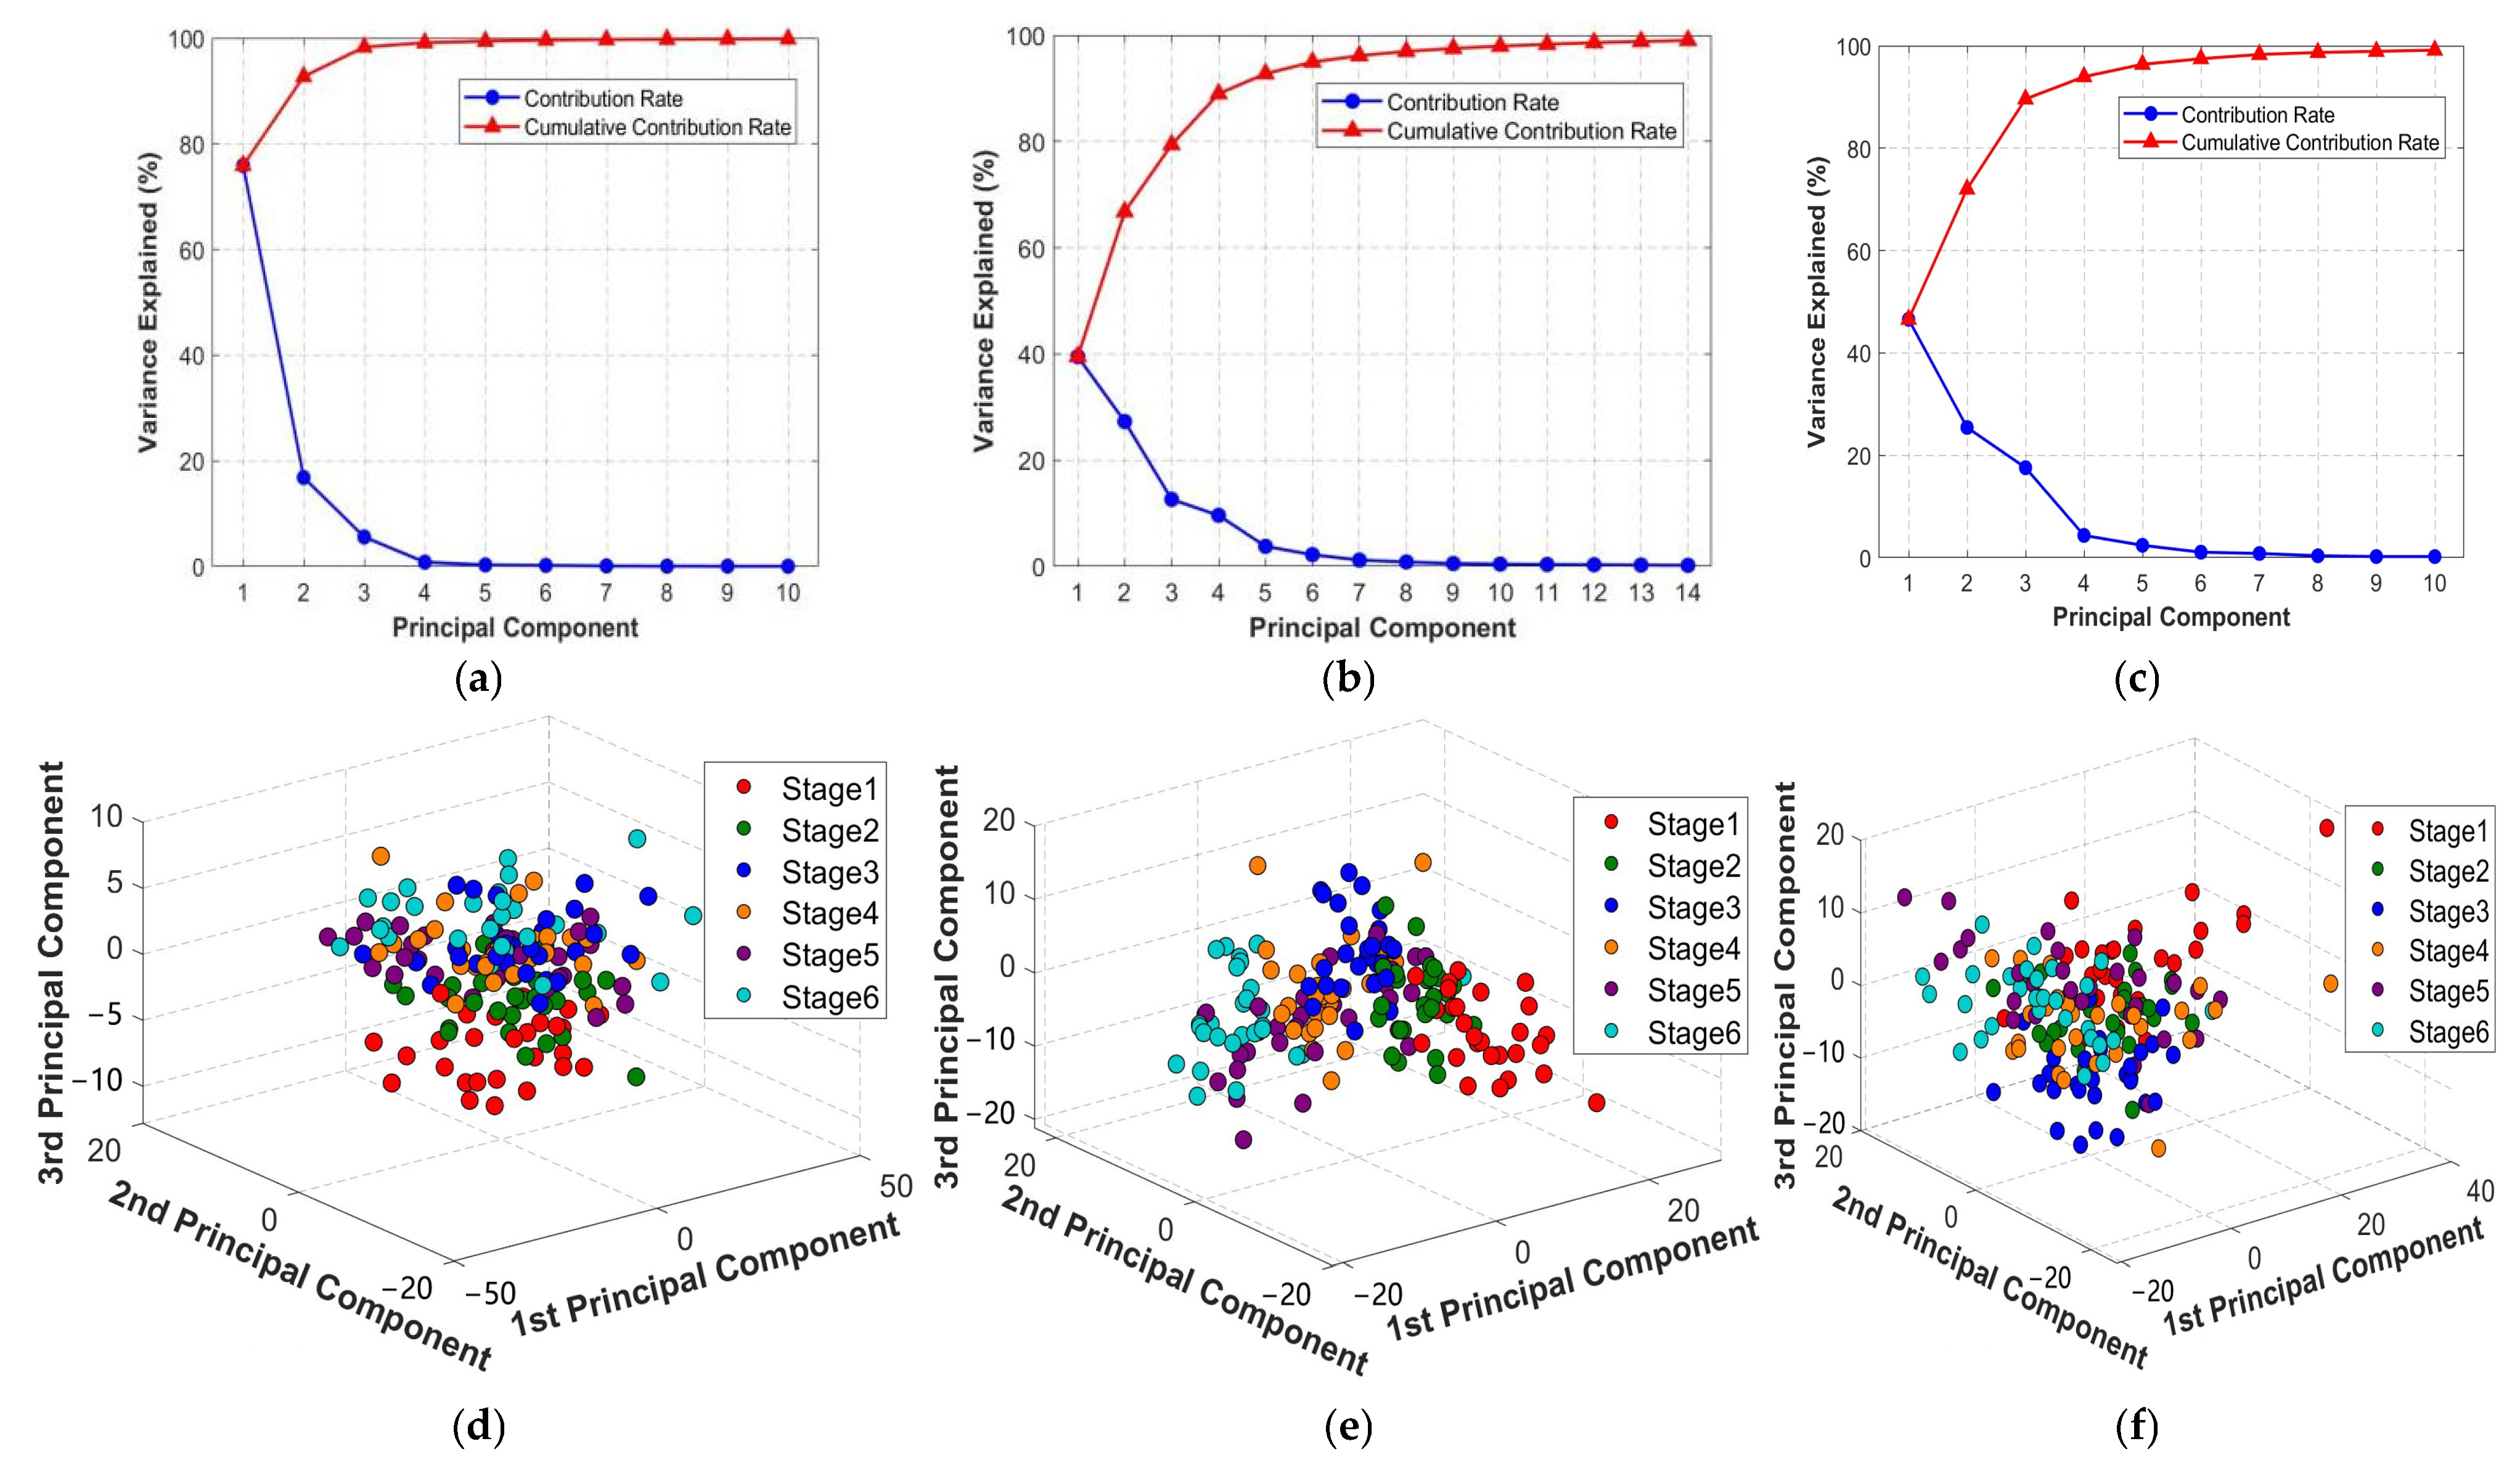
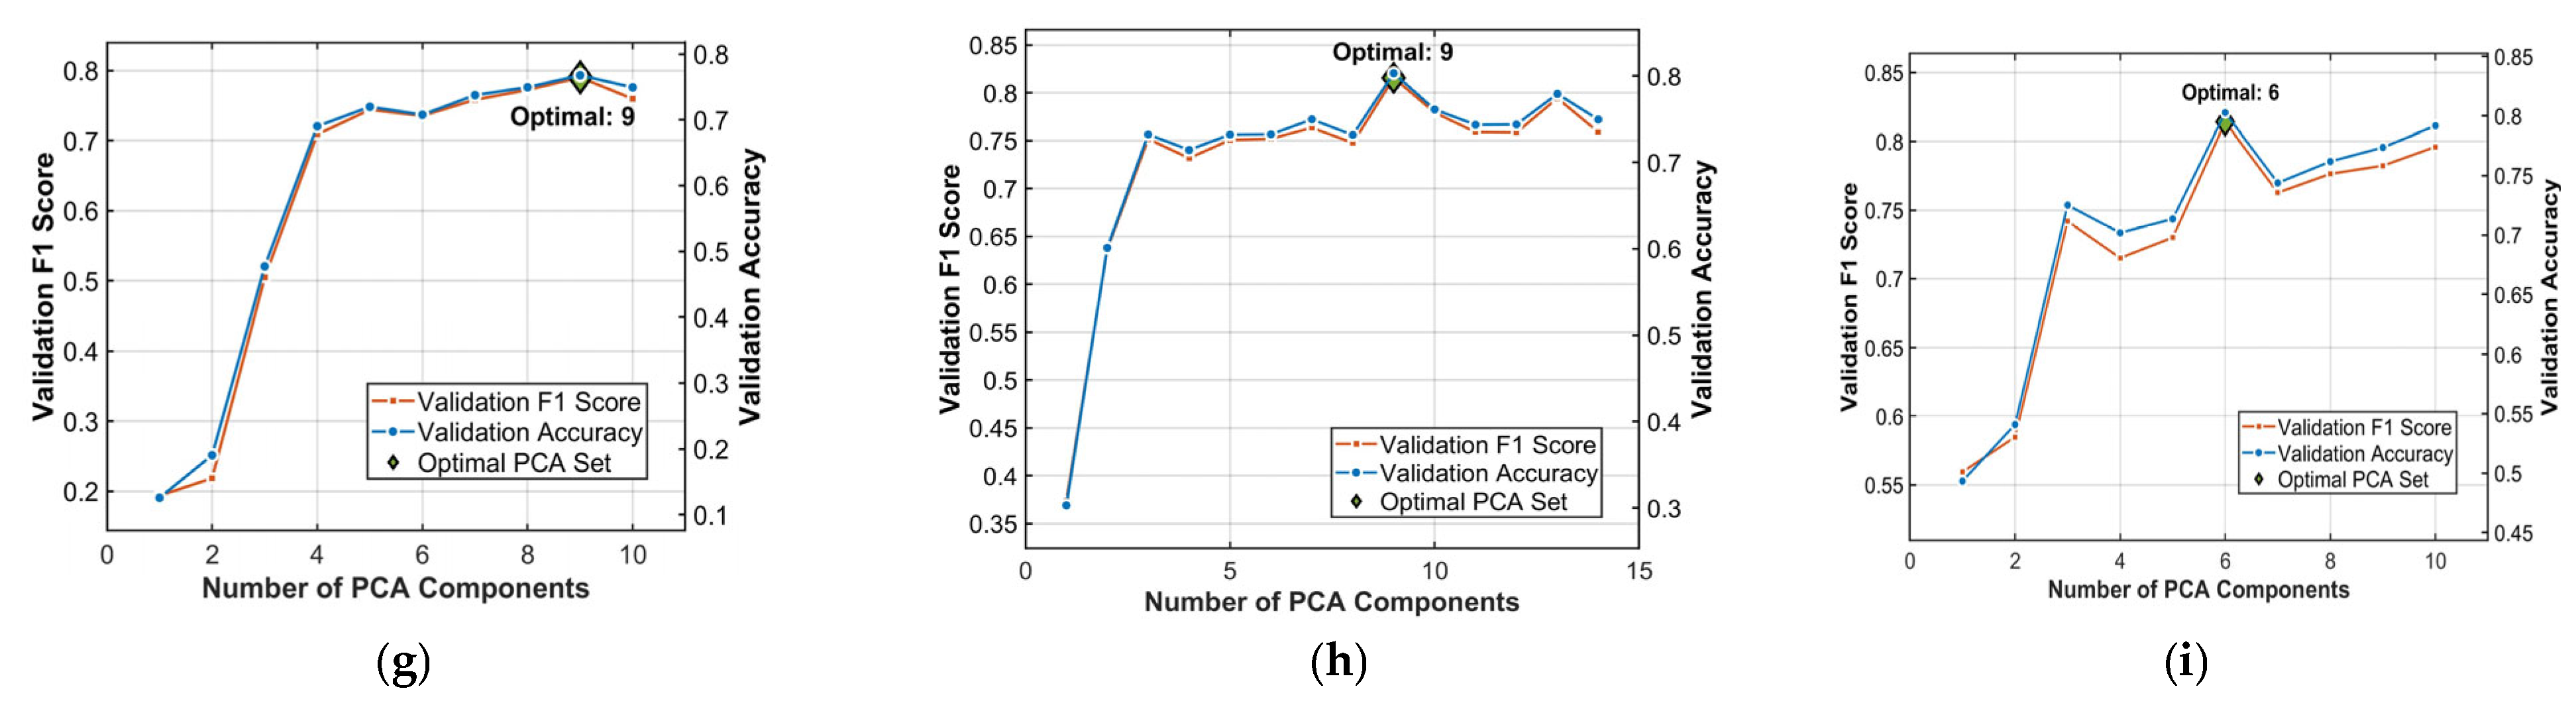
3.2.3. PCA Dimensionality Reduction in Hyperspectral Data
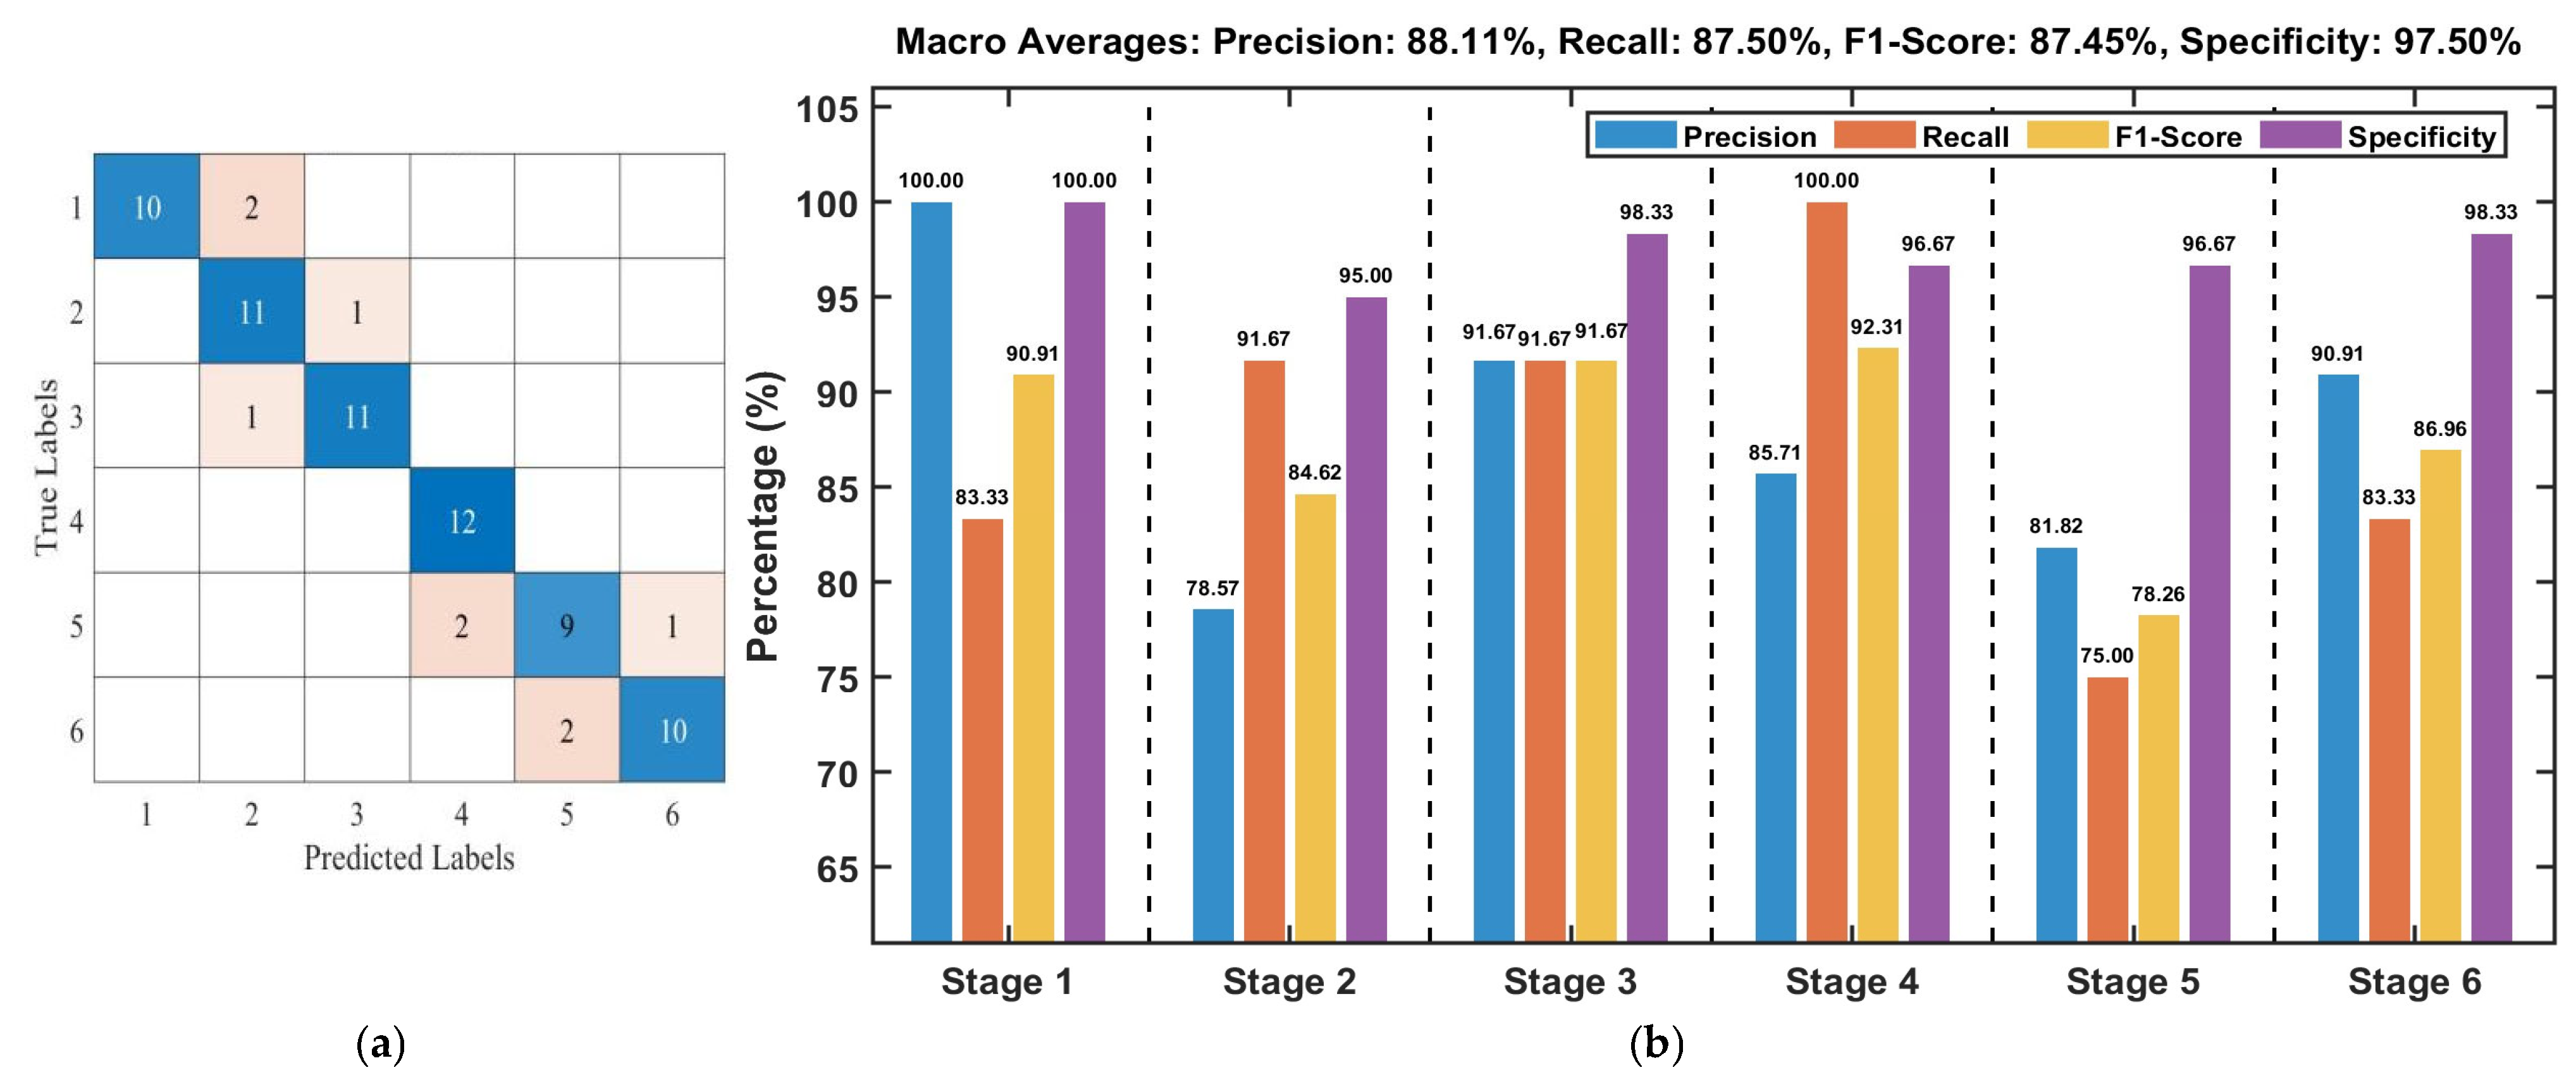
3.2.4. Hyperspectral Data Modeling
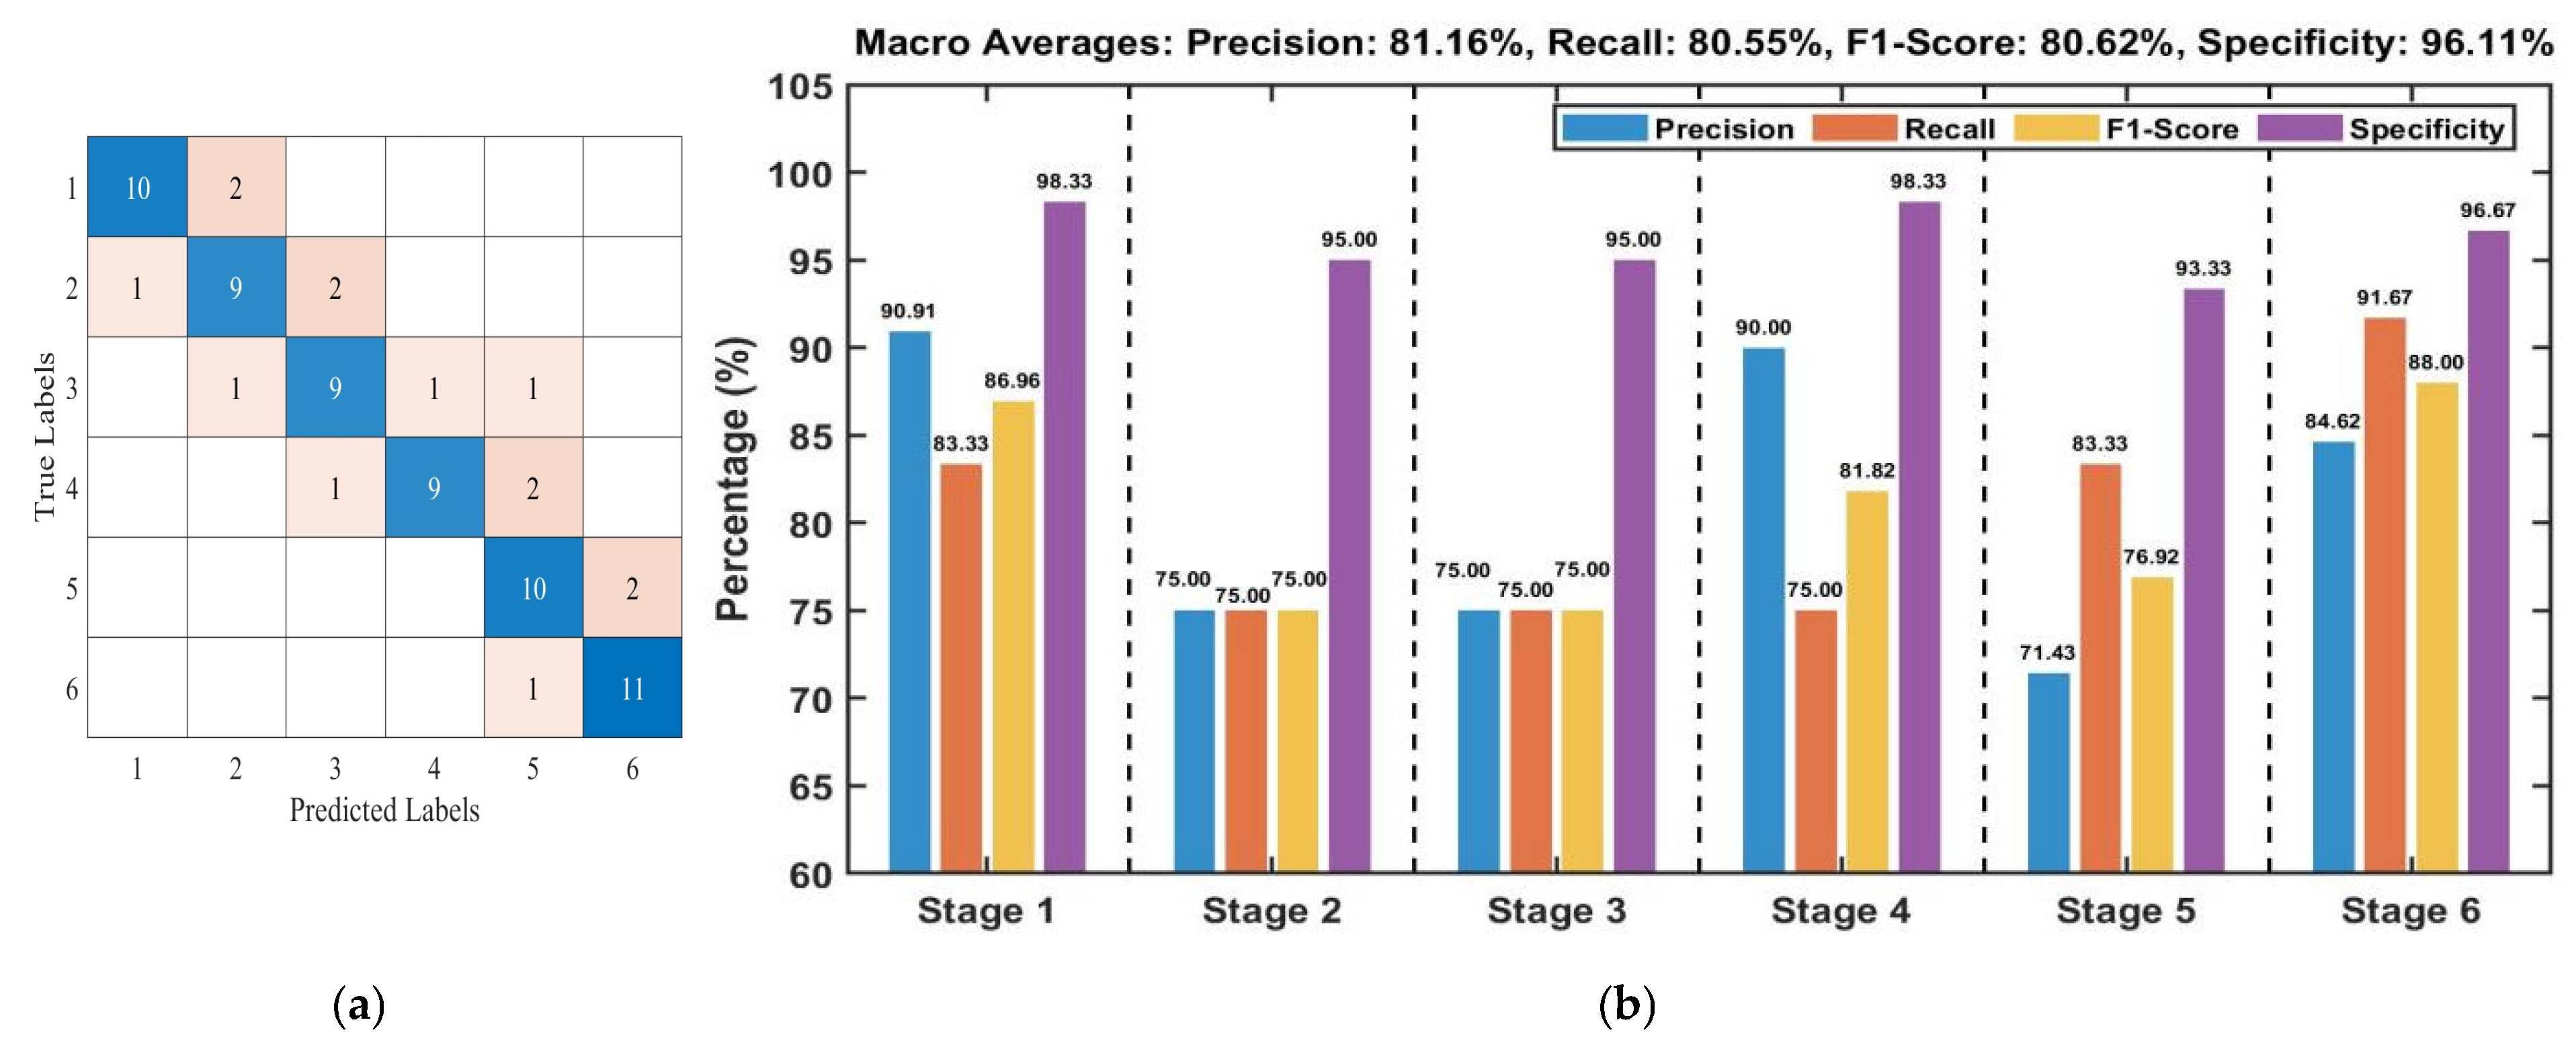
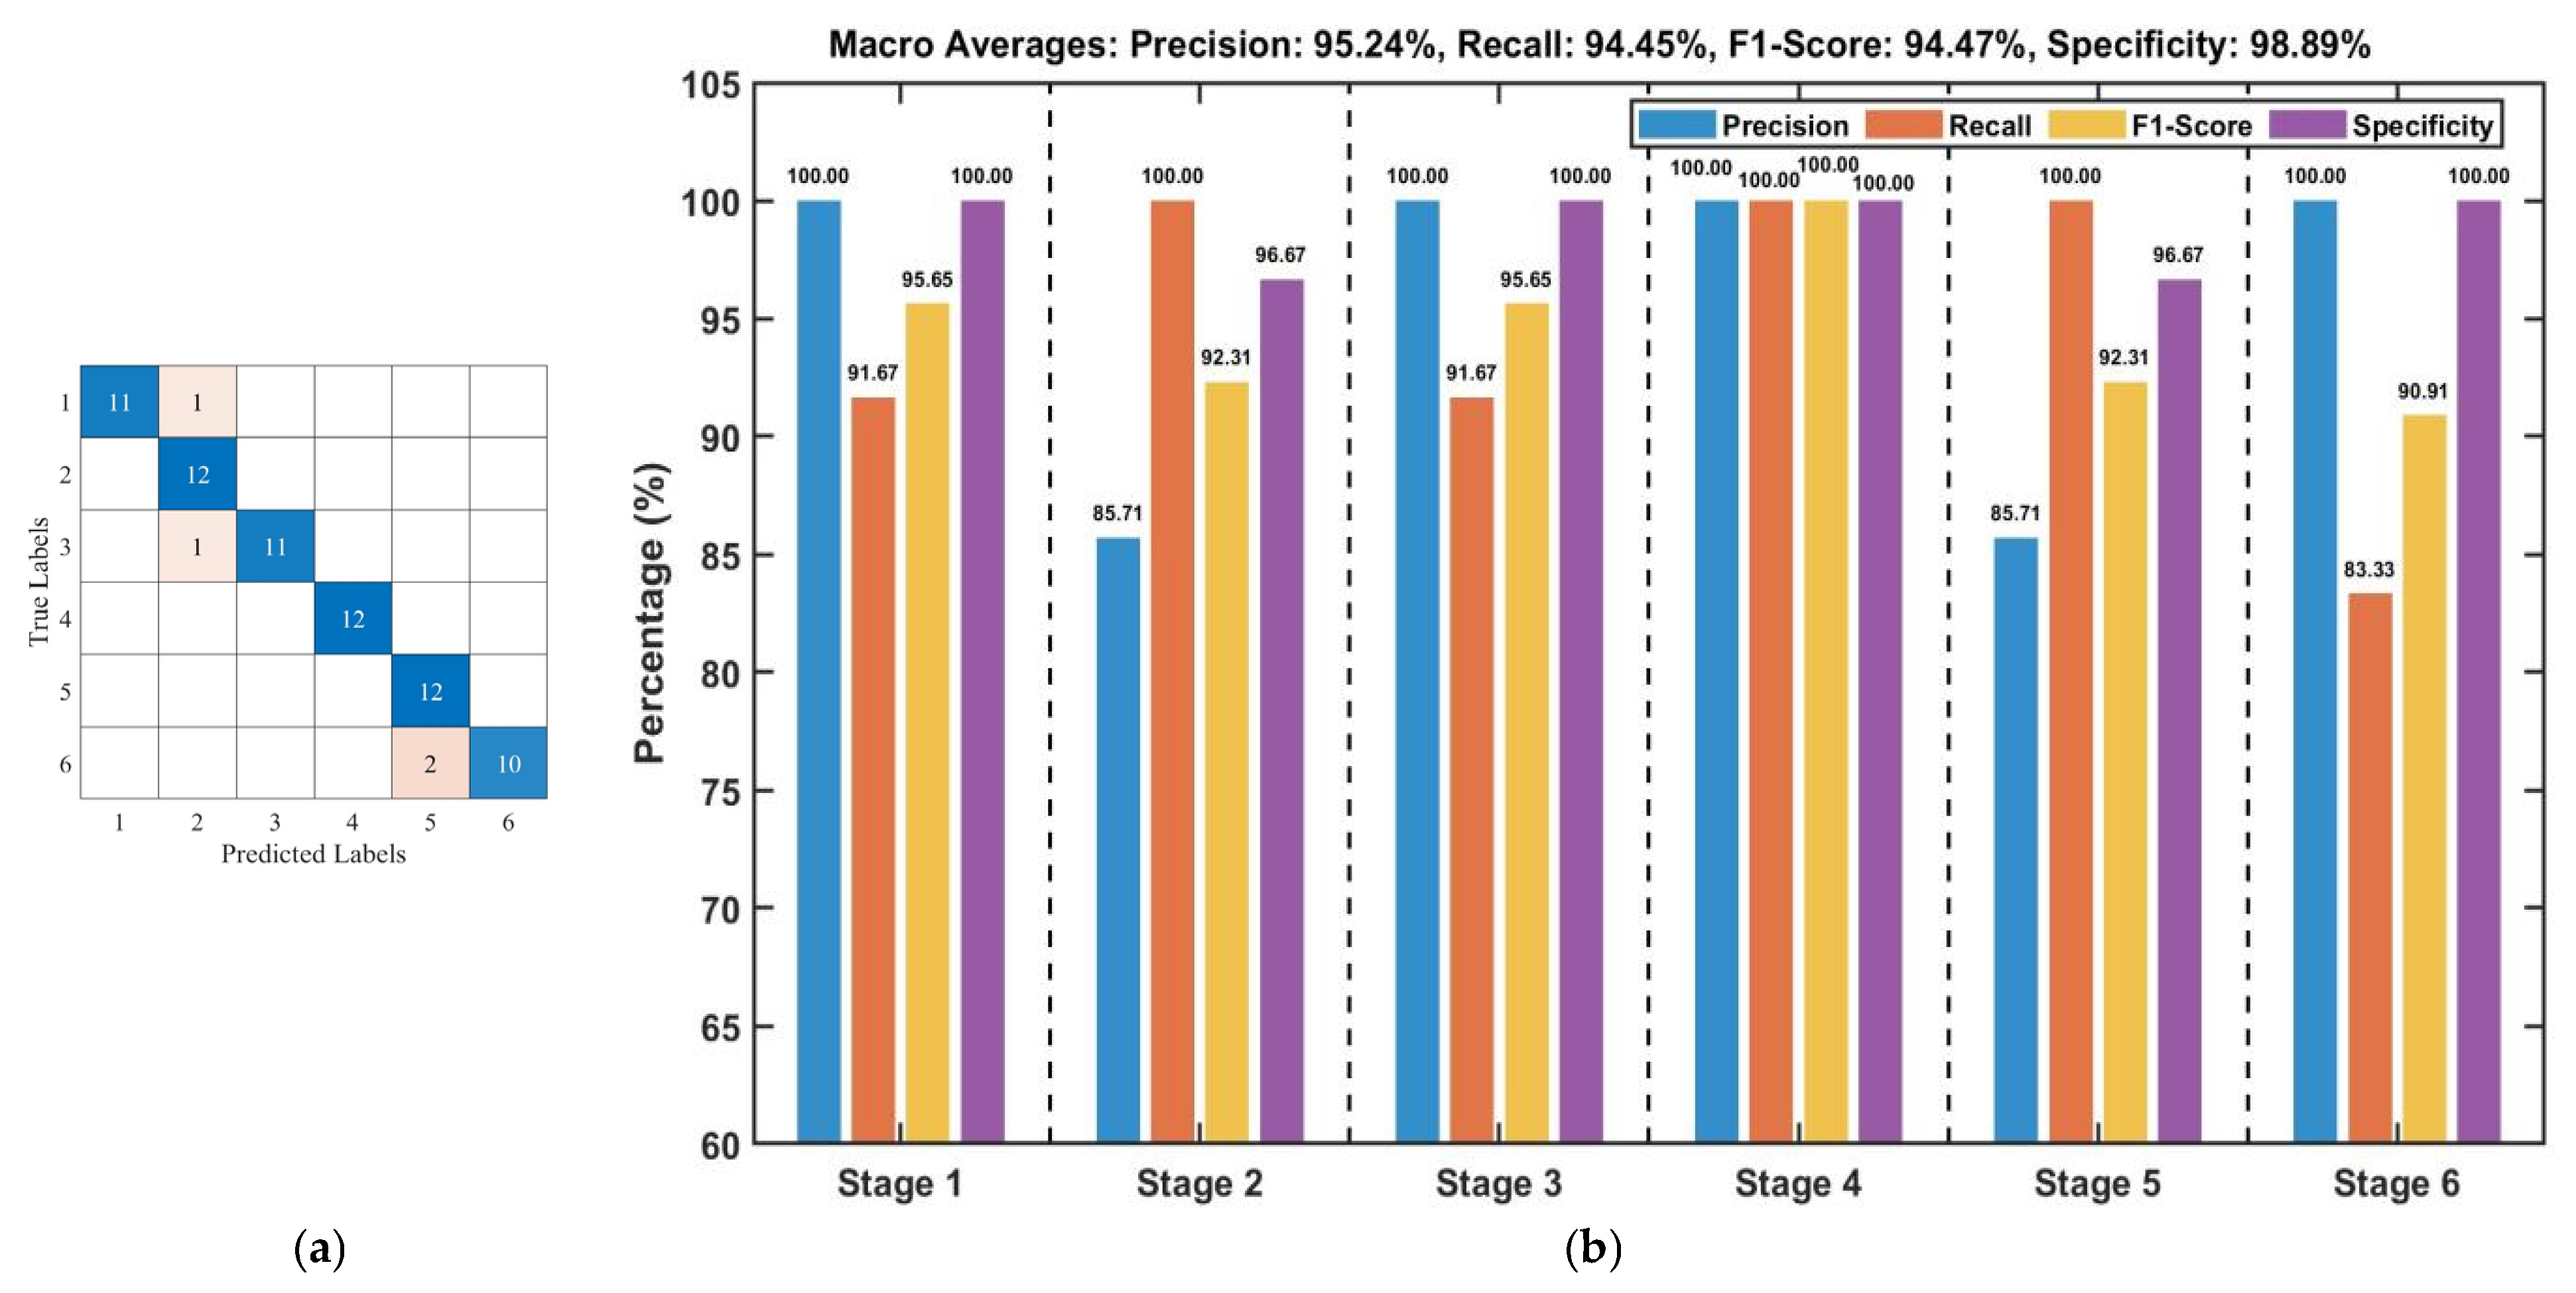
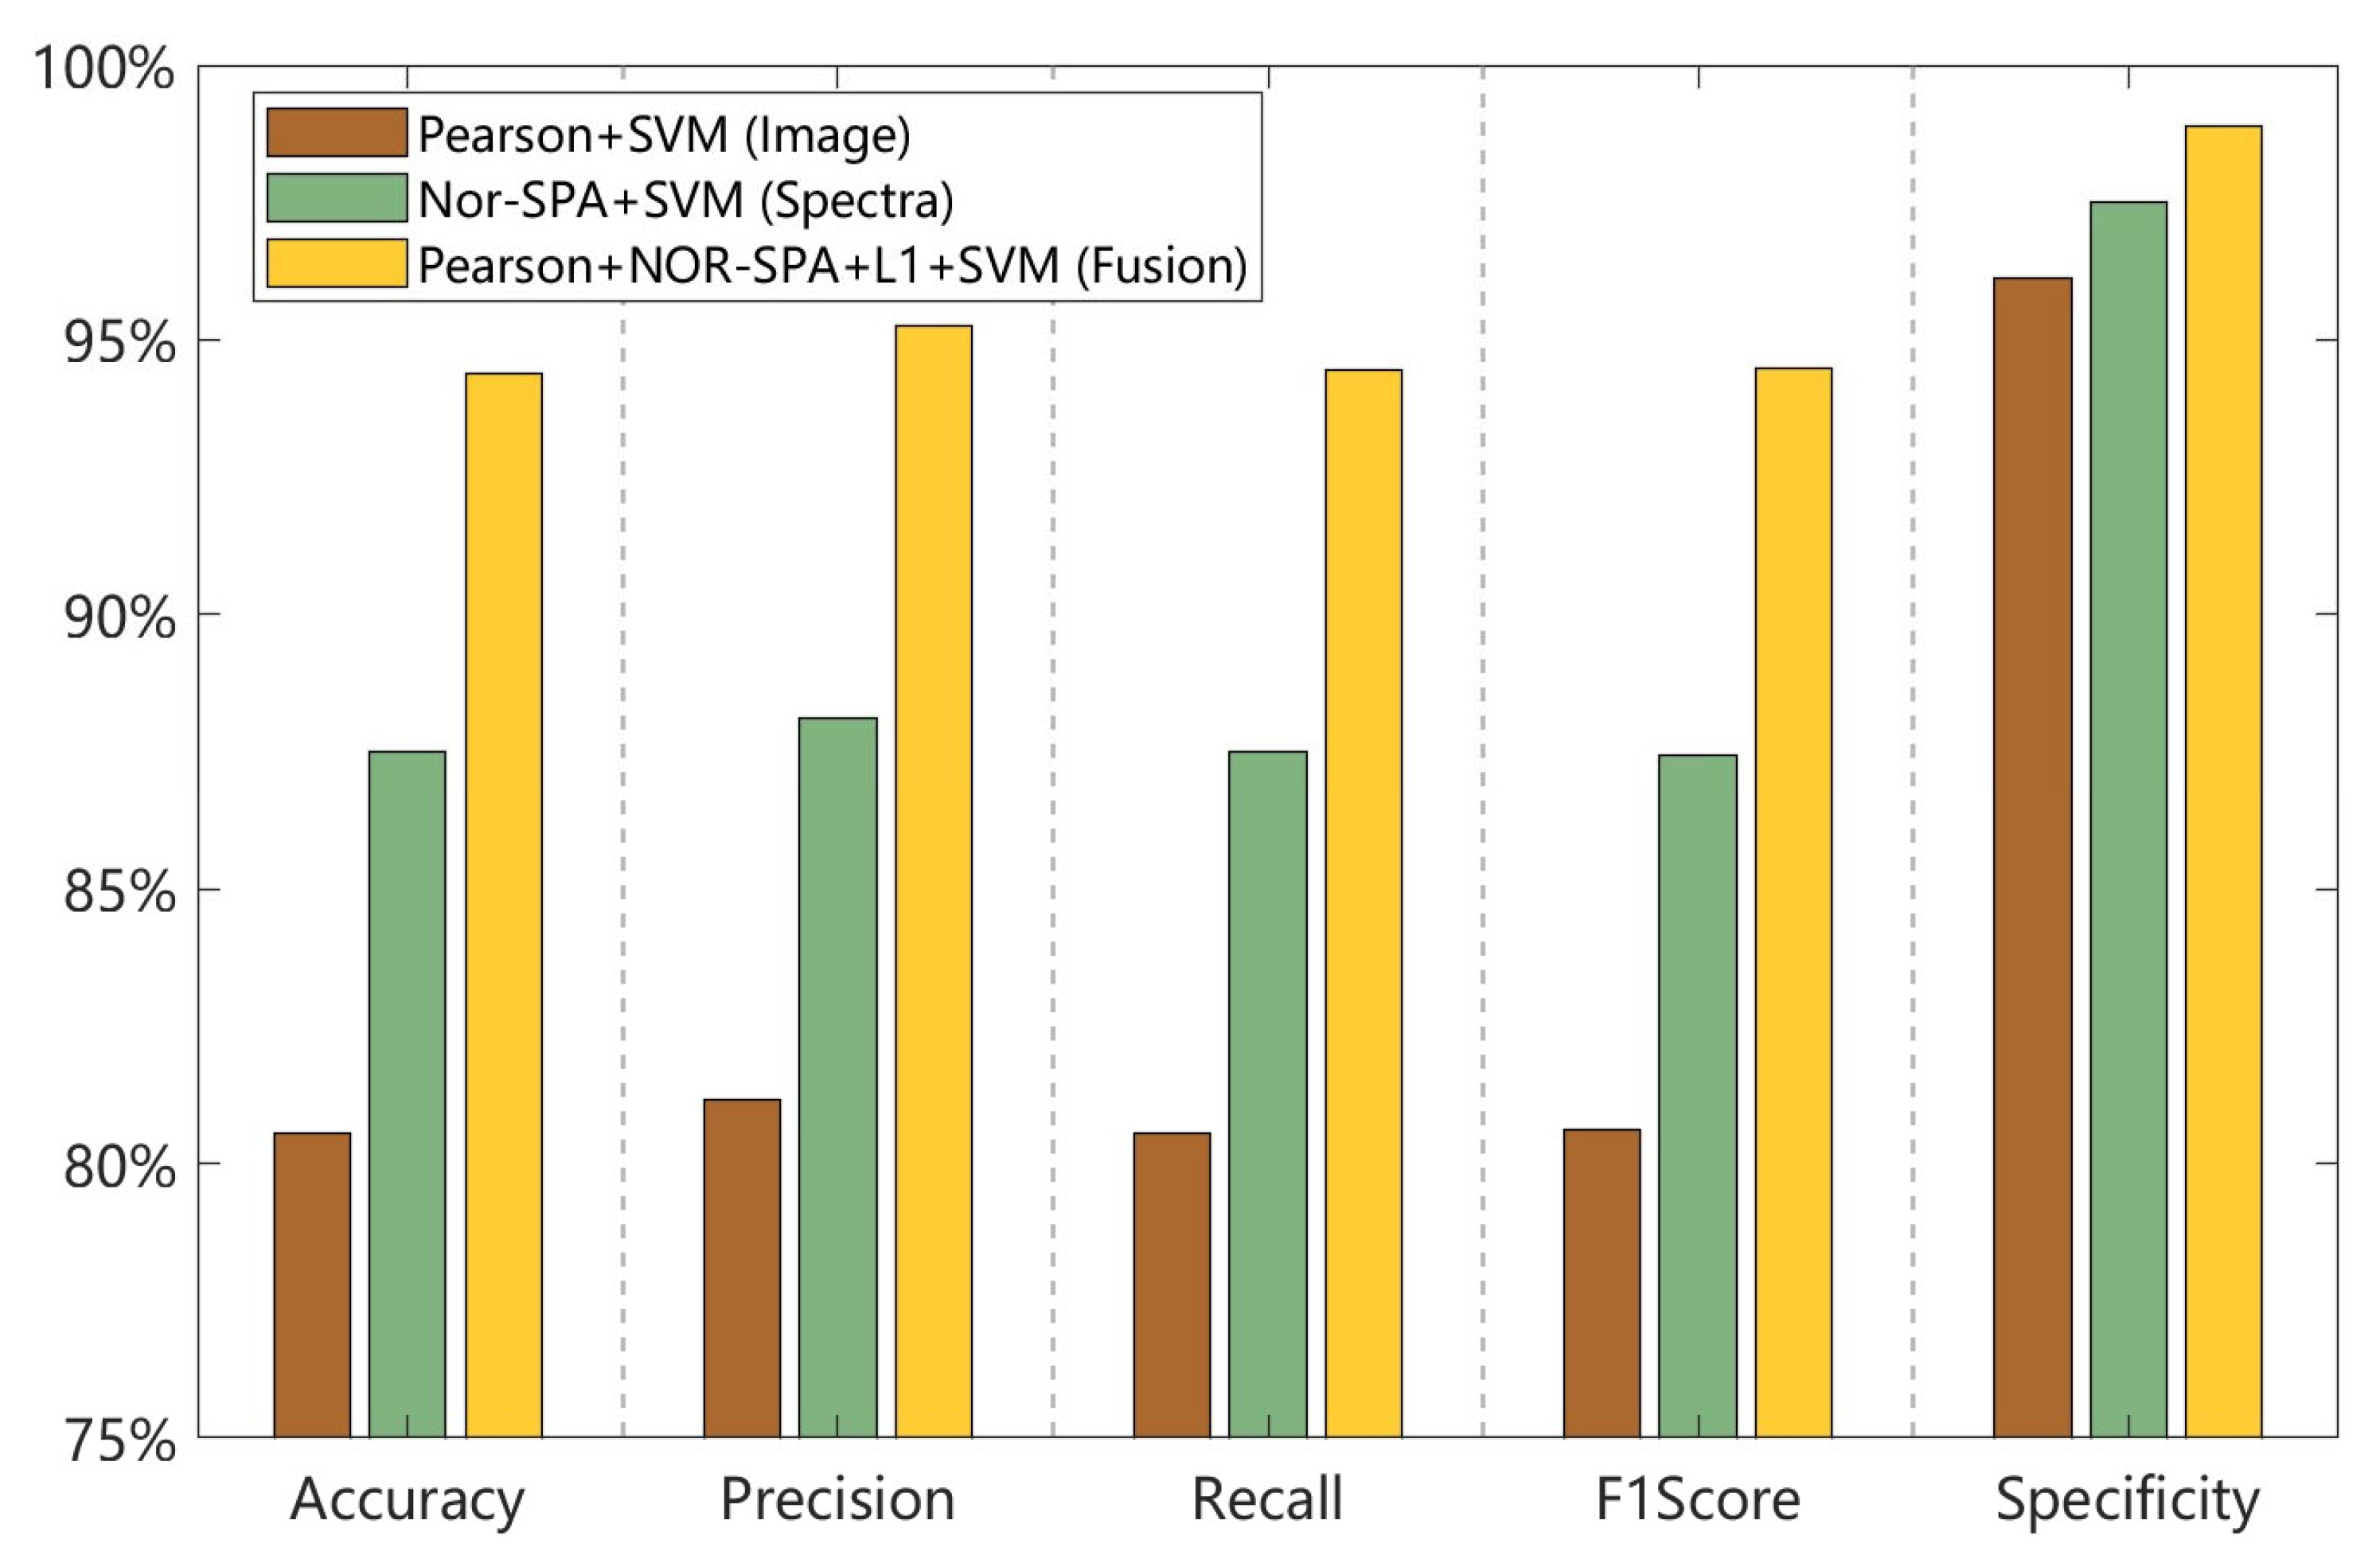
3.3. Fermentation Degree Model Based on Fusion Data
3.4. SHAP Interpretability Analysis
4. Conclusions
Author Contributions
Funding
Institutional Review Board Statement
Informed Consent Statement
Data Availability Statement
Acknowledgments
Conflicts of Interest
References
- Hu, Y.; Wu, Y.; Sun, J.; Geng, J.; Fan, R.; Kang, Z. Distinguishing Different Varieties of Oolong Tea by Fluorescence Hyperspectral Technology Combined with Chemometrics. Foods 2022, 11, 2344. [Google Scholar] [CrossRef] [Scilit]
- Li, C.; Lin, J.; Hu, Q.; Sun, Y.; Wu, L. An integrated metabolomic and transcriptomic analysis reveals the dynamic changes of key metabolites and flavor formation over Tieguanyin oolong tea production. Food Chem. X 2023, 20, 100952. [Google Scholar] [CrossRef] [Scilit]
- Han, Z.; Ahmad, W.; Rong, Y.; Chen, X.; Zhao, S.; Yu, J.; Zheng, P.; Huang, C.; Li, H. A Gas Sensors Detection System for Real-Time Monitoring of Changes in Volatile Organic Compounds during Oolong Tea Processing. Foods 2024, 13, 1721. [Google Scholar] [CrossRef] [Scilit] [PubMed]
- Tseng, T.-S.; Hsiao, M.-H.; Chen, P.-A.; Lin, S.-Y.; Chiu, S.-W.; Yao, D.-J. Utilization of a Gas-Sensing System to Discriminate Smell and to Monitor Fermentation during the Manufacture of Oolong Tea Leaves. Micromachines 2021, 12, 93. [Google Scholar] [CrossRef] [Scilit] [PubMed]
- Chen, Y.; Gao, R.; Xiang, J.; Lin, Z.; Chen, C.; Yu, W. Progress of near infrared spectroscopy in tea research. Food Chem. 2025, 487, 144691. [Google Scholar] [CrossRef] [Scilit] [PubMed]
- Chen, S.; Wang, C.-Y.; Tsai, C.-Y.; Yang, I.C.; Luo, S.-J.; Chuang, Y.-K. Fermentation quality evaluation of tea by estimating total catechins and theanine using near-infrared spectroscopy. Vib. Spectrosc. 2021, 115, 103278. [Google Scholar] [CrossRef] [Scilit]
- Li, L.; Li, M.; Liu, Y.; Cui, Q.; Bi, K.; Jin, S.; Wang, Y.; Ning, J.; Zhang, Z. High-sensitivity hyperspectral coupled self-assembled nanoporphyrin sensor for monitoring black tea fermentation. Sens. Actuators B Chem. 2021, 346, 130541. [Google Scholar] [CrossRef] [Scilit]
- Sheng, X.; Zan, J.; Jiang, Y.; Shen, S.; Li, L.; Yuan, H. Data fusion strategy for rapid prediction of moisture content during drying of black tea based on micro-NIR spectroscopy and machine vision. Optik 2023, 276, 170645. [Google Scholar] [CrossRef] [Scilit]
- Li, F.; Shen, J.; Yang, Q.; Wei, Y.; Zuo, Y.; Wang, Y.; Ning, J.; Li, L. Monitoring quality changes in green tea during storage: A hyperspectral imaging method. Food Chem. X 2024, 23, 101538. [Google Scholar] [CrossRef] [Scilit]
- Tang, T.; Luo, Q.; Yang, L.; Gao, C.; Ling, C.; Wu, W. Research Review on Quality Detection of Fresh Tea Leaves Based on Spectral Technology. Foods 2024, 13, 25. [Google Scholar] [CrossRef] [Scilit]
- Wang, Y.; Ren, Y.; Kang, S.; Yin, C.; Shi, Y.; Men, H. Identification of tea quality at different picking periods: A hyperspectral system coupled with a multibranch kernel attention network. Food Chem. 2024, 433, 137307. [Google Scholar] [CrossRef] [Scilit]
- Bi, C.; Zhang, S.; Chen, H.; Bi, X.; Liu, J.; Xie, H.; Yu, H.; Song, S.; Shi, L. Non-Destructive Classification of Maize Seeds Based on RGB and Hyperspectral Data with Improved Grey Wolf Optimization Algorithms. Agronomy 2024, 14, 645. [Google Scholar] [CrossRef] [Scilit]
- An, T.; Yang, C.; Zhang, J.; Wang, Z.; Fan, Y.; Fan, S.; Huang, W.; Qi, D.; Tian, X.; Yuan, C.; et al. Evaluation of the Black Tea Taste Quality during Fermentation Process Using Image and Spectral Fusion Features. Fermentation 2023, 9, 896. [Google Scholar] [CrossRef] [Scilit]
- Wang, Y.; Liu, Y.; Cui, Q.; Li, L.; Ning, J.; Zhang, Z. Monitoring the withering condition of leaves during black tea processing via the fusion of electronic eye (E-eye), colorimetric sensing array (CSA), and micro-near-infrared spectroscopy (NIRS). J. Food Eng. 2021, 300, 110534. [Google Scholar] [CrossRef] [Scilit]
- Jin, G.; Wang, Y.-j.; Li, M.; Li, T.; Huang, W.-j.; Li, L.; Deng, W.-W.; Ning, J. Rapid and real-time detection of black tea fermentation quality by using an inexpensive data fusion system. Food Chem. 2021, 358, 129815. [Google Scholar] [CrossRef] [Scilit]
- Jin, G.; Wang, Y.; Li, L.; Shen, S.; Deng, W.-W.; Zhang, Z.; Ning, J. Intelligent evaluation of black tea fermentation degree by FT-NIR and computer vision based on data fusion strategy. LWT 2020, 125, 109216. [Google Scholar] [CrossRef] [Scilit]
- Zheng, P.; Solomon Adade, S.Y.-S.; Rong, Y.; Zhao, S.; Han, Z.; Gong, Y.; Chen, X.; Yu, J.; Huang, C.; Lin, H. Online System for Monitoring the Degree of Fermentation of Oolong Tea Using Integrated Visible–Near-Infrared Spectroscopy and Image-Processing Technologies. Foods 2024, 13, 1708. [Google Scholar] [CrossRef] [Scilit] [PubMed]
- An, T.; Yu, S.; Huang, W.; Li, G.; Tian, X.; Fan, S.; Dong, C.; Zhao, C. Robustness and accuracy evaluation of moisture prediction model for black tea withering process using hyperspectral imaging. Spectrochim. Acta Part A Mol. Biomol. Spectrosc. 2022, 269, 120791. [Google Scholar] [CrossRef] [Scilit] [PubMed]
- Lan, T.; Shen, S.; Yuan, H.; Jiang, Y.; Tong, H.; Ye, Y. A Rapid Prediction Method of Moisture Content for Green Tea Fixation Based on WOA-Elman. Foods 2022, 11, 2928. [Google Scholar] [CrossRef] [Scilit] [PubMed]
- Liu, Z.; Zhang, R.; Yang, C.; Hu, B.; Luo, X.; Li, Y.; Dong, C. Research on moisture content detection method during green tea processing based on machine vision and near-infrared spectroscopy technology. Spectrochim. Acta Part A Mol. Biomol. Spectrosc. 2022, 271, 120921. [Google Scholar] [CrossRef] [Scilit]
- Wei, Y.; Wu, F.; Xu, J.; Sha, J.; Zhao, Z.; He, Y.; Li, X. Visual detection of the moisture content of tea leaves with hyperspectral imaging technology. J. Food Eng. 2019, 248, 89–96. [Google Scholar] [CrossRef] [Scilit]
- Chen, Q.; Zhao, J.; Cai, J.; Vittayapadung, S.; Saritporn, V. Evaluation of Tea Quality Using Multi-Information Fusion Technology Based on Near-Infrared Spectroscopy and Machine Vision. Trans. Chin. Soc. Agric. Eng. 2008, 4, 5–10. [Google Scholar]
- Abuhussein, M.; Robinson, A. Obscurant Segmentation in Long Wave Infrared Images Using GLCM Textures. J. Imaging 2022, 8, 266. [Google Scholar] [CrossRef] [Scilit]
- Oprisan, A.; Oprisan, S.A. Bounds for Haralick features in synthetic images with sinusoidal gradients. Front. Signal Process. 2023, 3, 1271769. [Google Scholar] [CrossRef] [Scilit]
- Wang, Z.; Huang, W.; Tian, X.; Long, Y.; Li, L.; Fan, S. Rapid and Non-destructive Classification of New and Aged Maize Seeds Using Hyperspectral Image and Chemometric Methods. Front. Plant Sci. 2022, 13, 849495. [Google Scholar] [CrossRef] [Scilit]
- Hu, Y.; Kang, Z. The Rapid Non-Destructive Detection of Adulteration and Its Degree of Tieguanyin by Fluorescence Hyperspectral Technology. Molecules 2022, 27, 1196. [Google Scholar] [CrossRef] [Scilit] [PubMed]
- Huang, P.; Yuan, J.; Yang, P.; Xiao, F.; Zhao, Y. Nondestructive Detection of Sunflower Seed Vigor and Moisture Content Based on Hyperspectral Imaging and Chemometrics. Foods 2024, 13, 1320. [Google Scholar] [CrossRef] [Scilit] [PubMed]
- An, T.; Huang, W.; Tian, X.; Fan, S.; Duan, D.; Dong, C.; Zhao, C.; Li, G. Hyperspectral imaging technology coupled with human sensory information to evaluate the fermentation degree of black tea. Sens. Actuators B Chem. 2022, 366, 131994. [Google Scholar] [CrossRef] [Scilit]
- Liang, G.; Dong, C.; Hu, B.; Zhu, H.; Yuan, H.; Jiang, Y.; Hao, G. Prediction of Moisture Content for Congou Black Tea Withering Leaves Using Image Features and Nonlinear Method. Sci. Rep. 2018, 8, 7854. [Google Scholar] [CrossRef] [Scilit]
- Gewers, F.L.; Ferreira, G.R.; Arruda, H.F.D.; Silva, F.N.; Comin, C.H.; Amancio, D.R.; Costa, L.D.F. Principal Component Analysis: A Natural Approach to Data Exploration. ACM Comput. Surv. 2021, 54, 70. [Google Scholar] [CrossRef] [Scilit]
- Gao, J.; Wang, Z.; Jin, T.; Cheng, J.; Lei, Z.; Gao, S. Information gain ratio-based subfeature grouping empowers particle swarm optimization for feature selection. Knowl. Based Syst. 2024, 286, 111380. [Google Scholar] [CrossRef] [Scilit]
- Song, X.-f.; Zhang, Y.; Gong, D.-w.; Sun, X.-y. Feature selection using bare-bones particle swarm optimization with mutual information. Pattern Recognit. 2021, 112, 107804. [Google Scholar] [CrossRef] [Scilit]
- Ahmad, H.; Sun, J.; Nirere, A.; Shaheen, N.; Zhou, X.; Yao, K. Classification of tea varieties based on fluorescence hyperspectral image technology and ABC-SVM algorithm. J. Food Process. Preserv. 2021, 45, e15241. [Google Scholar] [CrossRef] [Scilit]
- Rong, Y.; Riaz, T.; Lin, H.; Wang, Z.; Chen, Q.; Ouyang, Q. Application of visible near-infrared spectroscopy combined with colorimetric sensor array for the aroma quality evaluation in tencha drying process. Spectrochim. Acta Part A Mol. Biomol. Spectrosc. 2024, 304, 123385. [Google Scholar] [CrossRef] [Scilit]
- Lundberg, S.M.; Lee, S.-I. A unified approach to interpreting model predictions. arXiv 2017, arXiv:1705.07874. [Google Scholar] [CrossRef] [Scilit]
- Santos, C.E.d.S.; Sampaio, R.C.; Coelho, L.d.S.; Bestard, G.A.; Llanos, C.H. Multi-objective adaptive differential evolution for SVM/SVR hyperparameters selection. Pattern Recognit. 2021, 110, 107649. [Google Scholar] [CrossRef] [Scilit]
- Zou, H.; Shen, S.; Lan, T.; Sheng, X.; Zan, J.; Jiang, Y.; Du, Q.; Yuan, H. Prediction Method of the Moisture Content of Black Tea during Processing Based on the Miniaturized Near-Infrared Spectrometer. Horticulturae 2022, 8, 1170. [Google Scholar] [CrossRef] [Scilit]
- Xu, Q.; Zhou, Y.; Wu, L. Advancing tea detection with artificial intelligence: Strategies, progress, and future prospects. Trends Food Sci. Technol. 2024, 153, 104731. [Google Scholar] [CrossRef] [Scilit]
- Cho, K.; Van Merriënboer, B.; Gulcehre, C.; Bahdanau, D.; Bougares, F.; Schwenk, H.; Bengio, Y. Learning phrase representations using RNN encoder-decoder for statistical machine translation. arXiv 2014, arXiv:1406.1078. [Google Scholar] [CrossRef] [Scilit]
- Workman, J., Jr.; Weyer, L. Practical Guide to Interpretive Near-Infrared Spectroscopy; CRC Press: Boca Raton, FL, USA, 2007. [Google Scholar]
- Qin, J.; Lu, R. Measurement of the optical properties of fruits and vegetables using spatially resolved hyperspectral diffuse reflectance imaging technique. Postharvest Biol. Technol. 2008, 49, 355–365. [Google Scholar] [CrossRef] [Scilit]



| Data | Feature Selection or Dimensionality Reduction Methods | No. of Variables | Modeling Methods and Model Performance | ||||
|---|---|---|---|---|---|---|---|
| Model | Train Acc | Test Acc | Test Accuracy 95% CI | Optimal Configuration (C, γ) for SVM; Epochs for LSTM/GRU | |||
| Image | None | 26 | SVM | 89.29 | 76.39 | 66.67–84.72 | (512, 0.001) |
| LSTM | 92.26 | 79.17 | 69.44–87.50 | 225 | |||
| GRU | 90.48 | 77.78 | 68.06–87.50 | 250 | |||
| Pearson | 13 | SVM | 90.48 | 80.56 | 70.83–88.89 | (256, 0.004) | |
| LSTM | 86.90 | 80.56 | 70.83–90.28 | 225 | |||
| GRU | 88.10 | 80.56 | 71.53–90.28 | 250 | |||
| PCA | 9 | SVM | 94.05 | 77.78 | 68.06–87.50 | (512, 0.004) | |
| LSTM | 94.64 | 80.56 | 70.83–88.89 | 245 | |||
| GRU | 94.05 | 76.39 | 66.67–84.72 | 250 | |||
| Data | Feature Selection or Dimensionality Reduction Methods | No. of Variables | Data | Modeling Methods and Model Performance | ||||
|---|---|---|---|---|---|---|---|---|
| Model | Train Acc | Test Acc | Test Accuracy 95% CI | Optimal Configuration (C, γ) for SVM; Epochs for LSTM/GRU | ||||
| Spectra | Raw | CARS | 18 | SVM | 89.29 | 80.56 | 72.22–88.89 | (512, 0.002) |
| LSTM | 80.95 | 73.61 | 62.50–82.64 | 225 | ||||
| GRU | 82.14 | 75.00 | 65.28–84.72 | 200 | ||||
| Nor | 32 | SVM | 99.40 | 80.56 | 71.53–88.89 | (128, 0.004) | ||
| LSTM | 93.45 | 81.94 | 73.61–90.28 | 245 | ||||
| GRU | 97.02 | 80.56 | 70.83–88.89 | 250 | ||||
| SNV | 28 | SVM | 99.40 | 81.94 | 72.22–90.28 | (512, 0.002) | ||
| LSTM | 95.83 | 77.78 | 66.67–87.50 | 235 | ||||
| GRU | 97.62 | 80.56 | 70.83–88.89 | 250 | ||||
| Raw | SPA | 29 | SVM | 87.50 | 80.56 | 72.22–89.58 | (512, 0.002) | |
| LSTM | 79.17 | 70.83 | 61.11–80.56 | 240 | ||||
| GRU | 79.76 | 68.06 | 56.94–79.17 | 225 | ||||
| Nor | 24 | SVM | 99.40 | 87.50 | 79.17–94.44 | (256, 0.004) | ||
| LSTM | 94.05 | 79.17 | 69.44–87.50 | 250 | ||||
| GRU | 91.07 | 79.17 | 69.44–87.50 | 185 | ||||
| SNV | 23 | SVM | 98.81 | 81.94 | 72.22–90.28 | (256, 0.004) | ||
| LSTM | 93.45 | 81.94 | 72.22–90.28 | 245 | ||||
| GRU | 95.83 | 80.56 | 72.22–88.89 | 235 | ||||
| Raw | PCA | 9 | SVM | 93.45 | 79.17 | 69.44–87.50 | (128, 0.004) | |
| LSTM | 91.07 | 76.39 | 66.67–86.11 | 245 | ||||
| GRU | 88.10 | 75.00 | 65.28–84.72 | 240 | ||||
| Nor | 9 | SVM | 95.24 | 75.00 | 63.89–84.72 | (256, 0.002) | ||
| LSTM | 92.26 | 79.17 | 69.44–88.89 | 245 | ||||
| GRU | 92.26 | 69.44 | 58.33–79.17 | 250 | ||||
| SNV | 6 | SVM | 89.29 | 79.17 | 69.44–87.50 | (512, 0.002) | ||
| LSTM | 84.52 | 80.56 | 70.83–88.89 | 245 | ||||
| GRU | 86.90 | 79.17 | 69.44–88.89 | 245 | ||||
| Data | Feature Selection or Dimensionality Reduction Methods | No. of Variables | Data | Modeling Methods and Model Performance | ||||
|---|---|---|---|---|---|---|---|---|
| Model | Train Acc | Test Acc | Test Accuracy 95% CI | Optimal Configuration (C, γ) for SVM; Epochs for LSTM/GRU | ||||
| Fusion | Pearson+Nor-CARS | 45(13+32) | 14 | SVM | 95.24 | 93.06 | 87.50–97.92 | (32, 0.004) |
| LSTM | 98.81 | 86.11 | 77.78–93.06 | 245 | ||||
| GRU | 97.62 | 86.11 | 77.78–93.06 | 250 | ||||
| Pearson+SNV-CARS | 41(13+28) | 10 | SVM | 95.83 | 93.06 | 86.11–98.61 | (16, 0.016) | |
| LSTM | 97.62 | 90.28 | 83.33–97.22 | 250 | ||||
| GRU | 97.62 | 88.89 | 80.56–95.83 | 250 | ||||
| Pearson+Nor-SPA | 37(13+24) | 15 | SVM | 98.81 | 94.44 | 88.89–98.61 | (256, 0.004) | |
| LSTM | 98.21 | 86.11 | 77.78–93.06 | 210 | ||||
| GRU | 98.81 | 84.72 | 76.39–93.06 | 250 | ||||
| Pearson+SNV-SPA | 36(13+23) | 13 | SVM | 96.43 | 91.67 | 84.72–97.22 | (16, 0.016) | |
| LSTM | 98.81 | 84.72 | 76.39–93.06 | 250 | ||||
| GRU | 97.62 | 84.72 | 76.39–93.06 | 250 | ||||
| PCA+Nor-PCA | 18(9+9) | 11 | SVM | 96.43 | 84.72 | 76.39–91.67 | (128, 0.002) | |
| LSTM | 97.62 | 80.56 | 72.22–88.89 | 245 | ||||
| GRU | 97.62 | 80.56 | 70.83–88.89 | 245 | ||||
| PCA+SNV-PCA | 15(9+6) | 14 | SVM | 95.83 | 87.50 | 80.56–94.44 | (16, 0.004) | |
| LSTM | 100.00 | 84.72 | 76.39–93.06 | 245 | ||||
| GRU | 99.40 | 77.78 | 66.67–86.11 | 250 | ||||
Disclaimer/Publisher’s Note: The statements, opinions and data contained in all publications are solely those of the individual author(s) and contributor(s) and not of MDPI and/or the editor(s). MDPI and/or the editor(s) disclaim responsibility for any injury to people or property resulting from any ideas, methods, instructions or products referred to in the content. |
© 2026 by the authors. Licensee MDPI, Basel, Switzerland. This article is an open access article distributed under the terms and conditions of the Creative Commons Attribution (CC BY) license.
Share and Cite
Huang, Y.; Chen, Y.; Li, C.; Wang, T.; Zheng, C.; Zhao, J. A Model for Identifying the Fermentation Degree of Tieguanyin Oolong Tea Based on RGB Image and Hyperspectral Data. Foods 2026, 15, 280. https://doi.org/10.3390/foods15020280
Huang Y, Chen Y, Li C, Wang T, Zheng C, Zhao J. A Model for Identifying the Fermentation Degree of Tieguanyin Oolong Tea Based on RGB Image and Hyperspectral Data. Foods. 2026; 15(2):280. https://doi.org/10.3390/foods15020280
Chicago/Turabian StyleHuang, Yuyan, Yongkuai Chen, Chuanhui Li, Tao Wang, Chengxu Zheng, and Jian Zhao. 2026. "A Model for Identifying the Fermentation Degree of Tieguanyin Oolong Tea Based on RGB Image and Hyperspectral Data" Foods 15, no. 2: 280. https://doi.org/10.3390/foods15020280
APA StyleHuang, Y., Chen, Y., Li, C., Wang, T., Zheng, C., & Zhao, J. (2026). A Model for Identifying the Fermentation Degree of Tieguanyin Oolong Tea Based on RGB Image and Hyperspectral Data. Foods, 15(2), 280. https://doi.org/10.3390/foods15020280