Article

Correlation Analysis and Spiking Validation of Flavor Compounds Modulating Bitterness and Astringency in Jasmine Tea

1
Tea Research Institute, Zhejiang University, Hangzhou 310013, China
2
Zhejiang Huamingyuan Tea Co., Ltd., Jinhua 321000, China
3
Jinhua Department of Economic Specialty Technology Promotion, 828 Shuanglong South Road, Jinhua 321000, China
*
Authors to whom correspondence should be addressed.
Foods 2026, 15(17), 3047; https://doi.org/10.3390/foods15173047
Submission received: 21 July 2026 / Revised: 21 August 2026 / Accepted: 26 August 2026 / Published: 28 August 2026

Abstract

To elucidate the chemical basis underlying bitterness and astringency modulation in jasmine tea, four green tea bases and their corresponding jasmine teas were analyzed using weighted gene co-expression network analysis (WGCNA) combined with spiking validation experiments. WGCNA revealed that catechin, gallocatechin gallate, aspartic acid (Asp), glutamic acid (Glu), arginine (Arg), and alanine (Ala) were positively associated with sweetness and umami but negatively associated with bitterness and astringency. Spiking experiments showed that taste modulation was both concentration- and matrix-dependent. Glu and Asp effectively reduced bitterness at suitable concentrations, whereas the effects of theanine and Arg varied among tea matrices. Bitterness and astringency of jasmine tea infusion are modulated by the combined effects of the chemical matrix of tea base, providing a theoretical basis for tea-base selection and jasmine tea flavor optimization.

1. Introduction

Jasmine tea is a reprocessed tea produced by scenting a tea base with fresh jasmine flowers and is one of the most representative categories of traditional Chinese scented tea [1,2]. Jasmine flowers are particularly suitable for tea scenting because they are rich in aromatic compounds, including terpenes and indoles, which contribute to the characteristic floral aroma of jasmine tea [3,4]. However, the quality of jasmine tea is determined not only by its characteristic aroma but also by its taste, with the tea base serving as the primary source and foundation of its taste characteristics. Therefore, the balance among aroma, taste, and mouthfeel is a critical dimension of tea quality evaluation [5,6,7]. The bitterness and astringency of tea infusions are determined not only by the concentrations of caffeine, catechins, polyphenols, amino acids, and other taste-active compounds [8] but also by their complex interactions, which can modify taste perception and ultimately shape the overall flavor profile of the tea infusion [9]. The perceived intensities of these taste attributes depend on the molecular structures and concentrations of the contributing compounds, as well as on their interactions with other constituents in the complex chemical matrix of the tea infusion [10,11,12]. For jasmine green tea, the green tea base not only serves as the primary source of taste-active compounds but also provides a complex chemical matrix in which these compounds interact with constituents introduced during scenting [13], thereby strongly influencing the final taste profile of the scented tea.
Bitterness and astringency are key attributes determining the taste quality of jasmine tea, the perceived intensities of which are potentially modifiable [14]. Previous studies have shown that perceived bitterness and astringency can be modulated through multiple, partly distinct mechanisms, including inhibition of bitter-taste receptor signaling, physicochemical interactions among taste-active compounds and oral constituents, taste–taste mixture interactions, and cross-modal odor–taste effects [15,16,17]. For example, umami peptides can attenuate bitter compound-induced hT2R16-mediated Ca2+ signaling [18]. Polyphenols can interact with proteins and certain amino acids via non-covalent interactions, primarily hydrophobic interactions and hydrogen bonding. These interactions may reduce the availability of unbound polyphenols for oral perception and modulate their sensory expression, thereby altering the perceived bitterness and astringency of the system [15,19,20,21]. Glutamic acid has also been reported to suppress epigallocatechin gallate (EGCG) bitterness more effectively than theanine [16], whereas sucrose can reduce bitterness through mixture suppression effects [22,23]. These findings indicate that the effects of taste-modulating compounds depend on both their concentrations and the chemical matrix in which they occur.
Although bitterness and astringency in unscented tea infusions have been examined, regarding chemical composition, processing-induced changes, and taste interactions [8,24], the key compounds regulating these attributes in jasmine teas produced from different tea bases remain unclear. Differences in catechins, caffeine, flavonol glycosides, and free amino acids among green tea bases may influence not only the inherent bitterness and astringency of tea infusions but also the masking and modulatory effects of other taste-active compounds [21,25]. In this study, jasmine teas were prepared from four green tea bases under two scenting temperatures (30 °C and 35 °C). The compositions of major flavor compounds in different tea bases and jasmine tea samples were analyzed, and six sensory attributes, including smoothness, sweetness, umami, astringency, thickness, and bitterness, were assessed by quantitative descriptive analysis (QDA). Weighted correlation network analysis (WGCNA) was used for screening candidate compounds associated with six sensory attributes. Spiking experiments were performed to validate the sensory effects of selected candidate compounds within the tea infusion matrix. The study aimed to elucidate the chemical basis of bitterness and astringency modulation in jasmine tea and provide a theoretical basis for tea base selection and flavor optimization.

2. Materials and Methods

2.1. Materials and Chemicals

Tencha was supplied by Lanxi Chishan Lake Green Farm Co., Ltd. (Lanxi, China). The curved-strip Maofeng tea was supplied by Wuyi Tangji High Mountain Tea Industry Co., Ltd. (Wuyi, China). The orchid-shaped Maofeng tea was obtained from Lanxi Xiacen Maofeng Tea Factory (Lanxi, China), while the flat-shaped green tea was supplied by Wuyi Shushui Tea Industry Co., Ltd. (Wuyi, China). Jasmine teas prepared from the four green tea bases were manufactured by Zhejiang Wuzhou Tea Co., Ltd. (Jinhua, China), according to the Chinese national standard GB/T 34779-2017 [26] and the company’s standard processing procedures.
Individual catechins (all ≥98%), including epigallocatechin gallate (EGCG), epigallocatechin (EGC), epicatechin gallate (ECG), epicatechin (EC), gallocatechin gallate (GCG), gallocatechin (GC), catechin gallate (CG) and catechin (C), as well as caffeine (≥98%) were purchased from Sigma-Aldrich (Shanghai, China). Flavonol glycosides, including myricetin-3-O-galactosyl-rhamnosyl-glucoside (M-gal-rha-glu), myricetin 3-O-galactoside (M-gal), myricetin 3-O-glucoside (M-glu), quercetin-3-O-galactosyl-rhamnosyl-glucoside (Q-gal-rha-glu), quercetin-3-O-glucosyl-rhamnosyl-glucoside (Q-glu-rha-glu), quercetin-3-O-rhamnosyl-rhamnosyl-glucoside (Q-glu-rha-rha), quercetin 3-O-galactoside (Q-gal), quercetin 3-O-glucoside (Q-glu), kaempferol-3-O-glucosyl-rhamnosyl-glucoside (K-glu-rha-glu), kaempferol-3-O-galactoside (K-gal), kaempferol-3-O-rhamnosyl-glucoside (K-glu-rha), kaempferol 3-O-glucoside (K-glu) were prepared in our laboratory according to previously published methods [27]. Amino acid standards, including aspartic acid (Asp), L-glutamic acid (Glu), L-asparagine (Asn), L-serine (Ser), L-glutamine (Gln), L-histidine (His), glycine (Gly), threonine (Thr), arginine (Arg), L-alanine (Ala), γ-aminobutyric acid (GABA), L-theanine (Thea), L-tyrosine (Tyr), L-valine (Val), methionine (Met), L-norvaline (Nva), L-tryptophan (Trp), L-phenylalanine (Phe), L-isoleucine (Ile), L-leucine (Leu), and L-lysine (Lys), were purchased from Aladdin Reagent Co., Ltd. (Shanghai, China). HPLC-grade acetonitrile and methanol were purchased from Merck KGaA (Darmstadt, Germany). Ultrapure water was prepared using an EASY Pure II UV water purification system (Barnstead International, Dubuque, IA, USA).

2.2. Preparation of Jasmine Teas from Different Tea Bases

Jasmine tea samples were prepared from each of the four tea bases through three consecutive scenting rounds at 30 or 35 °C. For each tea base, the jasmine tea samples produced at 30 and 35 °C were designated S30 and S35, respectively. Each round was conducted for 16 h, using a green tea-to-fresh jasmine flower mass ratio of 10:7. Apart from scenting temperature, all processing parameters were kept consistent among the tea bases and treatments. After the third round, the jasmine flowers were removed by sieving, and the scented tea leaves were dried. The dried jasmine tea samples were stored at −20 °C prior to analysis.

2.3. Tea Infusion Preparation

Tea infusions were prepared according to the Chinese national standard for sensory evaluation of tea (GB/T 23776-2018) [28]. Briefly, 3 g of each tea sample was infused with 150 mL of boiling water for 4 min.

2.4. Sensory Evaluation

QDA was conducted to evaluate the sensory attributes of each sample, focusing on smoothness, sweetness, umami, astringency, thickness, and bitterness. Sensory evaluation was performed by a trained panel of six tea tasters (Occupational Code: 6-02-06-11). Before the formal evaluation, panelists underwent multiple training sessions to familiarize themselves with the attribute definitions, reference standards, and scoring procedures. To improve sensory reliability, standard solutions with different concentration levels were prepared for calibration of taste intensities, enabling panelists to establish consistent sensory references for sweetness, umami, bitterness, astringency, thickness, and smoothness. Additional calibration sessions were conducted until the panel reached stable evaluations and acceptable agreement among assessors.
Sensory evaluations were performed in a sensory evaluation room under the conditions of 25 ± 2 °C, relative humidity 50–60%, and neutral lighting. For tea infusion evaluation, 30 mL of each tea infusion was served in odorless cups labeled with randomly assigned three-digit codes. Samples were presented in a randomized order for each assessor, and the evaluation was conducted under blinded conditions. Water was provided for palate cleansing. Each taste attribute was rated by the panelists on an 11-point intensity scale, with 0 indicating absence and 10 indicating extremely high intensity. Selected samples were evaluated repeatedly in independent sessions to ensure measurement repeatability, and the final sensory scores were calculated as the average values across all assessors.
For the spiking experiments, the spiked tea infusion samples were evaluated using the same blinded, randomized, and calibrated sensory procedure. The sensory scores obtained from the panel were analyzed to determine the potential contribution of individual compounds to the overall flavor characteristics of tea infusions. The mean score for each attribute was calculated and used for subsequent statistical analysis and radar-chart visualization.

2.5. Determination of Flavonoids and Caffeine

The tea infusion prepared as described above was centrifuged at 12,000 rpm and 4 °C for 20 min, and the supernatant was collected for analysis. The concentrations of catechins, flavonol glycosides, and caffeine were determined by an Ultra-performance liquid chromatography coupled with diode-array detection and tandem mass spectrometry (UHPLC-DAD-MS/MS) system, according to our previously published method [24]. Flavonol glycosides, catechins, and caffeine were quantified using their respective authentic standards and an external standard calibration method. Detection wavelengths were set at 360 nm for flavonol glycosides and 280 nm for catechins and caffeine.

2.6. Determination of Amino Acids

Amino acids were determined according to a previously reported method [27], with minor modifications. Briefly, the sample solution was mixed sequentially with 1 mL of borate buffer (0.4 mol/L, pH 10.2), 200 μL of o-phthalaldehyde (OPA) derivatization reagent, 780 μL of ultrapure water, and 10 μL of norvaline as the internal standard. The OPA reagent was prepared by dissolving 0.01 g of OPA in a mixture of 1 mL of acetonitrile, 9 mL of borate buffer (0.4 mol/L), and 100 μL of 3-mercaptopropionic acid. The mixture was filtered through a 0.22 μm membrane, and then submitted to HPLC analysis using following conditions: ZORBAX Eclipse AAA column (4.6 × 150 mm, 3.5 μm), column temperature 40 °C, injection volume 10 μL, mobile phase A: 40 mmol/L sodium hydrogen phosphate buffer (pH 7.8), mobile phase B: acetonitrile/methanol/water (45:45:10, v/v/v; solvent B), flow rate 1.0 mL/min. The gradient elution program was as follows: 0–35 min, 5–60% B; 35–40 min, 60–100% B; 40–45 min, 100% B; 45–50 min, 5% B for column re-equilibration. Amino acids were detected by fluorescence at excitation and emission wavelengths of 340 and 450 nm, respectively, and quantified using the external standard method with the corresponding authentic standards.

2.7. Correlation of Flavor Components and Taste Attributes via WGCNA

The concentrations of major flavor compounds and the corresponding sensory scores of the 36 tea samples, including the four tea bases and their respective jasmine teas, were integrated to evaluate the associations between chemical constituents and sensory attributes. WGCNA was performed to construct the coexpression network of flavor compounds using the WGCNA package in R (version 4.2.2) according to the reported method [29]. Pairwise Pearson correlations among flavor compounds were used to generate the adjacency matrix, which was converted into a weighted adjacency matrix using a soft-thresholding power (β) of 14. The topological overlap matrix (TOM)-based dissimilarity was then used for hierarchical clustering, and modules were identified using the DynamicTreeCut algorithm. Module eigengenes were correlated with sensory scores.

2.8. Spiking Experiment

Jasmine tea samples prepared from strip-shaped Maofeng and Tencha through three scenting rounds at 35 °C were used for the spiking experiments. Each sample (3.0 g) was infused with 150 mL of boiling water for 4 min and then filtered. For each treatment, 28.5 mL of tea infusion was mixed with 1.5 mL of the corresponding standard solution. The compounds were added to the tea infusions at the following final concentrations: 0.01, 0.02, 0.03, and 0.04 mg/mL for Glu; 0.10, 0.20, 0.30, 0.40, and 0.50 mg/mL for Thea; 0.03, 0.06, 0.09, 0.12, and 0.15 mg/mL for Asp; 0.01, 0.03, 0.06, 0.09, and 0.12 mg/mL for Arg. The spiked tea infusions were evaluated by QDA under blinded conditions.

2.9. Statistics

All the experiments were conducted in triplicate, and the results were expressed as mean ± standard deviation (SD). Statistical analyses were conducted using IBM SPSS Statistics version 27.0 (SPSS Inc., Chicago, IL, USA). Normality and homogeneity of variance were checked before one-way ANOVA. For each tea base, the three samples subjected to different treatments were compared pairwise using Tukey’s HSD test following ANOVA. Significance was set at p < 0.05.

3. Results and Discussion

3.1. Correlation of Flavor Compounds and Taste Traits via WGCNA

Table 1 shows the concentrations of major flavor compounds in tea infusions prepared from different tea samples. Compared with their corresponding tea bases, the jasmine tea infusions showed compound-specific changes in chemical composition after scenting. The contents of total catechins (TC) and caffeine remained stable across the four tea types, suggesting that these compounds were hardly affected by scenting. The concentration of total flavonol glycosides (TFG) significantly increased after scenting, from 25.78–35.93 μg/mL in tea bases to 27.90–39.12 μg/mL in the corresponding jasmine teas. This increase was particularly pronounced in tencha and flat-shaped tea, which was mainly attributed to the elevated level of Q-glu-rha-rha (Table 1).
By contrast, total amino acids (TAA) content decreased greatly after scenting, from 621.17–904.26 μg/mL in the tea bases to 454.09–725.78 μg/mL in the scented teas. The reduction in TAA content was mainly attributed to decreases in theanine, aspartic acid, and glutamic acid levels. Amino acid degradation was generally more pronounced at 35 °C than at 30 °C, particularly in orchid-shaped Maofeng and Tencha.
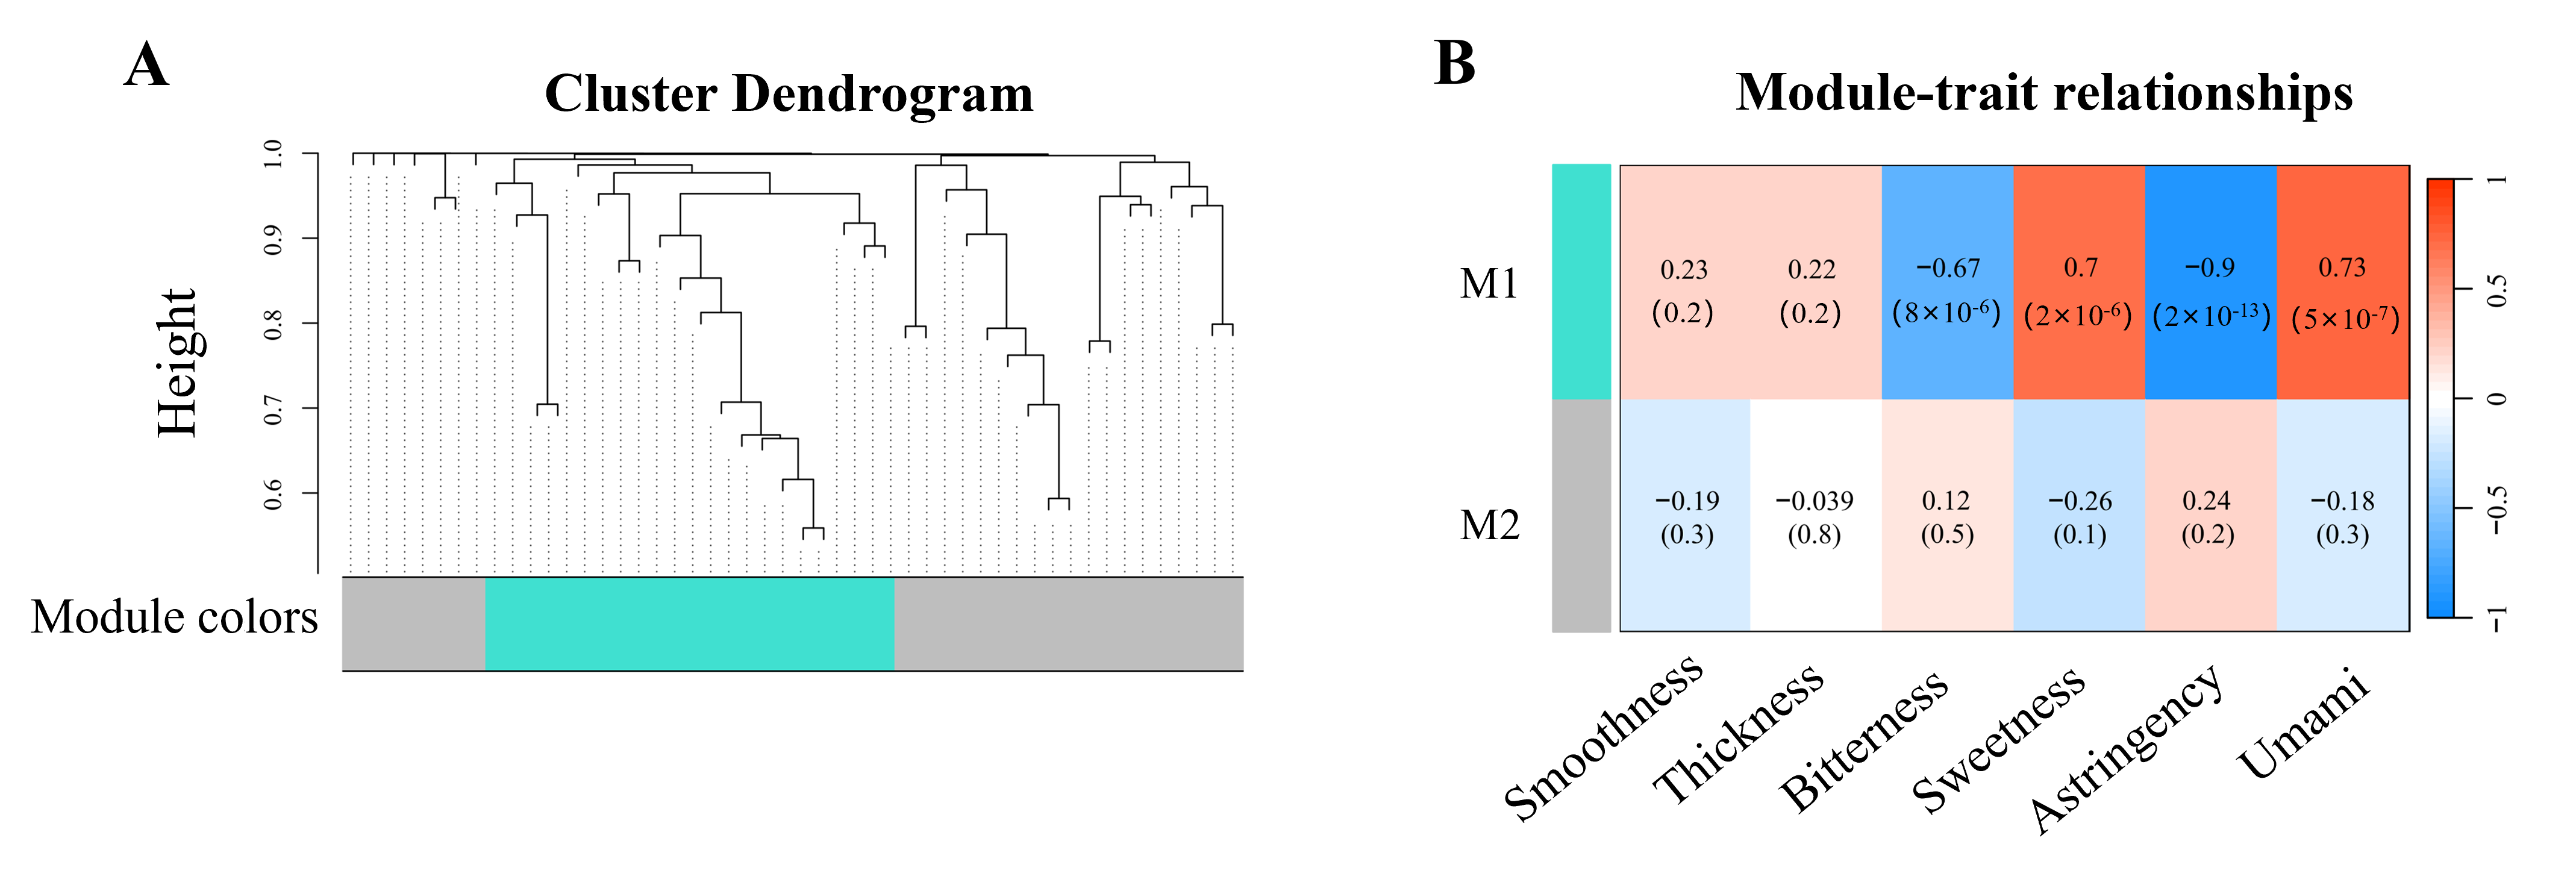
WGCNA was used to explore the associations between flavor compounds and sensory traits. As shown in Figure 1, two modules (M1 and M2) were identified by hierarchical clustering. Module–trait relationship analysis revealed that the M1 module exhibited strong associations with multiple sensory quality traits. Specifically, M1 showed a significant negative correlation with bitterness (r = −0.67, p < 0.05) and astringency (r = −0.90, p < 0.05), while displaying significant positive correlations with sweetness (r = 0.70, p < 0.05) and umami (r = 0.73, p < 0.05). In contrast, the M2 module showed no significant correlations with any evaluated traits (p > 0.05). These results indicate that the M1 module represents a key co-expression module potentially associated with the modulation of tea sensory quality, particularly taste-related characteristics. Based on the thresholds of GS > 0.2 and MM > 0.8 [30], C, GCG, Asp, Glu, Arg, and Ala were identified as potential taste-related compounds, exhibiting positive correlations with sweetness and umami intensities and negative correlations with bitterness and astringency intensities. These statistical associations suggest their possible roles in shaping tea taste characteristics, although their sensory contributions require further confirmation.
The positive associations of Asp and Glu with umami are consistent with previous reports showing that free amino acids, particularly Asp and Glu, are important contributors to the umami quality of tea infusions. Ala may further contribute to a sweet or mellow taste impression, thereby enhancing the overall sweetness–umami profile [31]. These amino acids may reduce bitterness and astringency through interactions with bitter compounds like catechins [16]. Although Arg is generally considered as a bitter amino acid, its concentration in the tea infusions was far below the reported bitterness threshold of 0.21 mg/mL, suggesting that it likely makes a negligible direct contribution to bitterness perception [32]. Nevertheless, Arg may indirectly influence sensory quality by modulating bitter taste perception through the attenuation of bitter receptor-mediated Ca2+ signaling [32], and by serving as a precursor for aroma-active compounds generated during Maillard reactions [33]. Therefore, spiking experiments are warranted to further elucidate the contribution of Arg to tea flavor. Regarding catechin compounds, the negative associations of C and GCG with bitterness and astringency are more likely to reflect the overall sensory profile of the tea infusion matrix rather than the intrinsic taste properties of these individual catechins. It has been acknowledged that fresh tea leaves contained substantially lower levels of C and GCG than the processed or dried tea samples, since C and GCG can be formed through thermally induced epimerization of EC and EGCG during tea processing [34,35]. Since EC and EGCG generally show stronger astringency than their corresponding epimers C and GCG [36]. Thermally induced epimerization of EC and EGCG to C and GCG may improve the taste profile of processed green tea. This partly explains the negative associations of C and GCG with bitterness and astringency revealed by WGCNA.

3.2. Validation of the Taste-Modulating Effects of Glu

Based on the WGCNA results, Glu, Thea, Asp, and Arg were selected for spiking experiments to evaluate their effects on bitterness and astringency of tea infusion. Ala was excluded from further validation because its concentration in tea infusions (7.93–24.01 μg/mL) was substantially lower than its reported sweetness threshold (1.44 mg/mL), suggesting that it was unlikely to directly contribute to sweetness perception under the tested conditions. In addition, Ala accounted for less than 5% of the total amino acid content (TAA) [37]. Maofeng and Tencha were selected as representative tea matrices due to their distinct yet typical chemical profiles, particularly in terms of flavonoid and free amino acid compositions, which are closely associated with differences in bitterness and astringency.
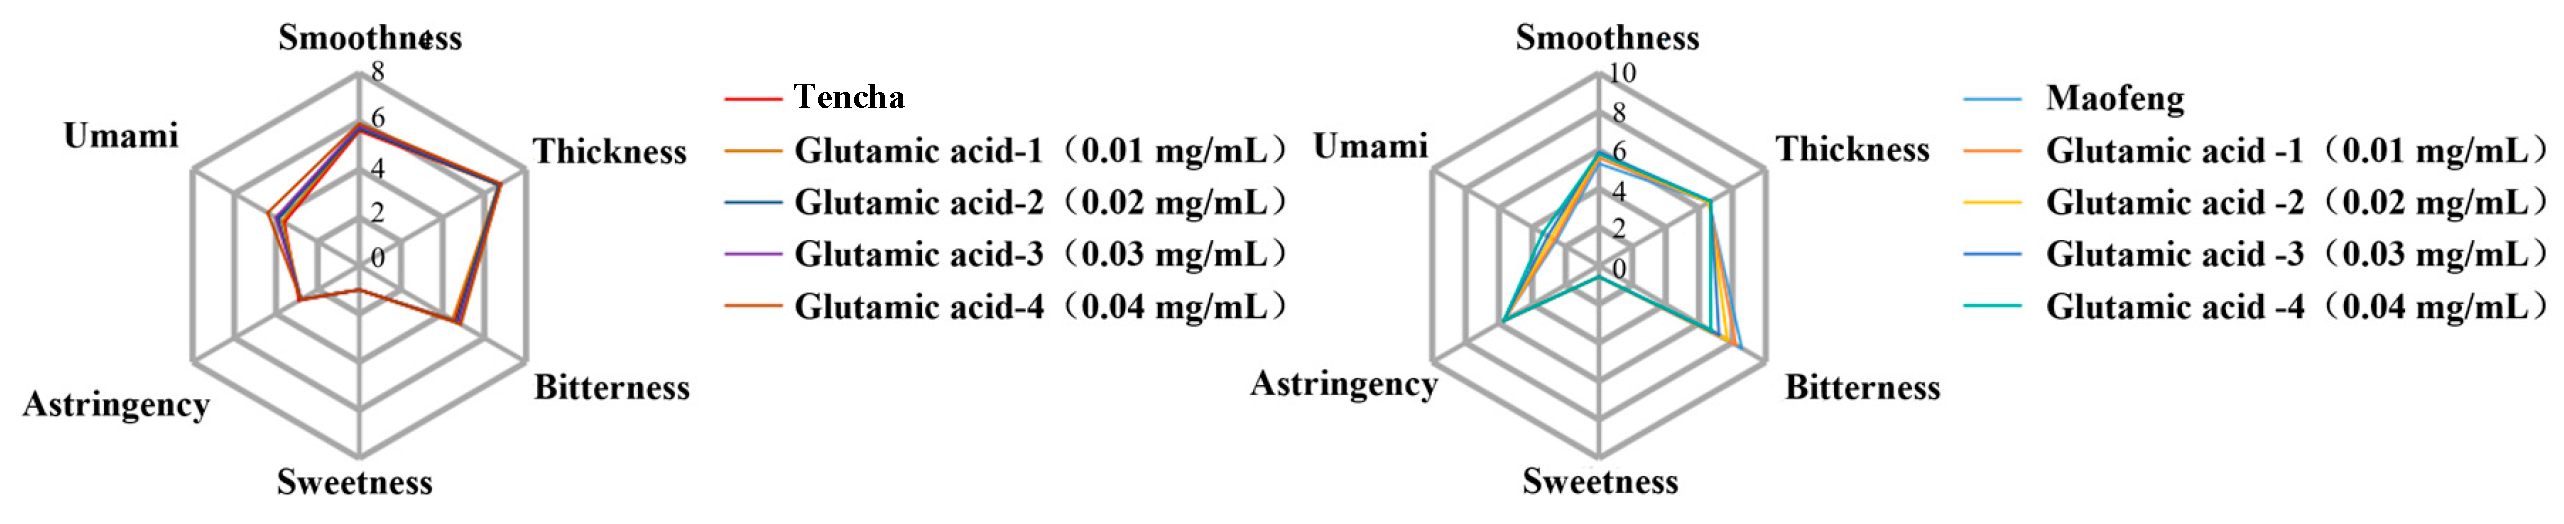
Figure 2 shows Glu exhibited matrix-dependent effects on bitterness. In Maofeng infusion, supplementation with 0–0.04 mg/mL Glu progressively reduced the bitterness score from 8.6 (control) to 6.8. By contrast, no bitterness-suppressing effect was observed in Tencha infusion, with the score slightly increasing from 4.6 to 4.9. Glu has a low umami threshold of approximately 0.01 mg/mL [38], indicating that small changes in its concentration may markedly affect taste perception. The different performances of these two tea infusions may be related to their chemical matrices. Glu has been reported to suppress the bitterness of EGCG more effectively when EGCG is present at 0.17 mg/mL, whereas its inhibitory effect is weaker at lower EGCG concentrations [16]. Based on calculation, the EGCG concentration in the spiked Maofeng infusion was higher than 0.17 mg/mL, whereas that in the spiked Tencha infusion was slightly below 0.17 mg/mL. This difference may partly explain why the bitterness score of the Maofeng infusion decreased markedly after the addition of Glu. The higher level of gallated catechins and lower level of amino acids in Maofeng may further enhance its responsiveness to Glu supplementation.

3.3. Validation of the Taste-Modulating Effects of Thea

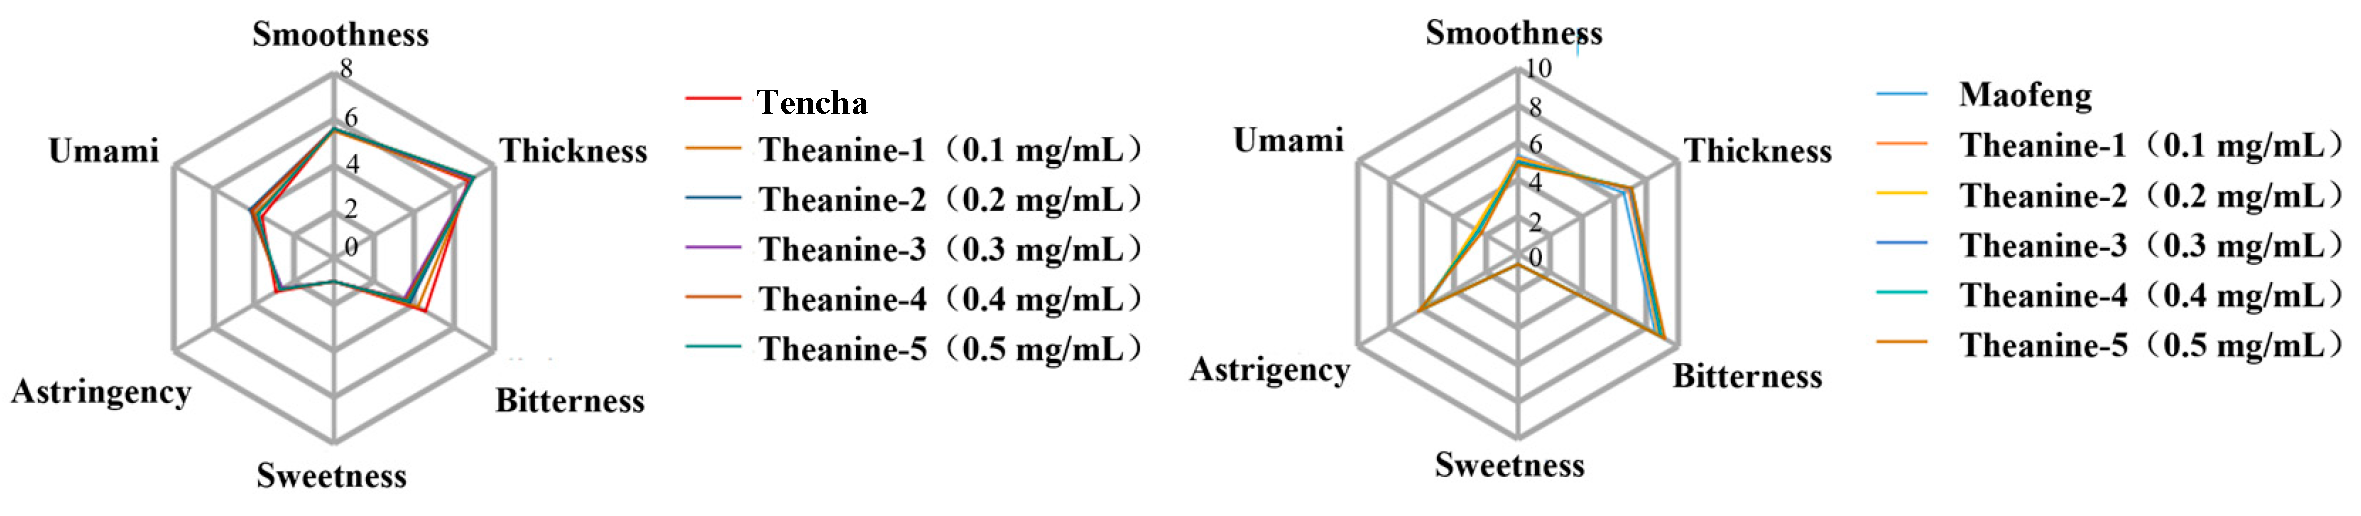
Thea is the most abundant amino acid in tea, but its umami threshold of approximately 1.05 mg/mL generally higher than its concentration in tea infusions, suggesting a limited direct contribution to umami. In addition, Thea exhibits a mixed taste profile rather than a pure umami sensation at higher concentrations [39], which may explain why it was not identified by WGCNA as a key umami-associated compound. In our study, Thea showed distinct matrix-dependent effects in the two tea infusions (Figure 3). Thea may enhance umami through interactions with Glu and other taste-active compounds [40]. In Maofeng infusion, supplementation with 0.3 and 0.5 mg/mL Thea increased the bitterness score from 8.6 (control) to 8.9 and 9.2, respectively. By contrast, in Tencha infusion, 0.3 mg/mL Thea significantly decreased the bitterness score from 4.6 to 3.5, while a further increase to 0.5 mg/mL slightly raised the score to 3.7. This difference may be associated with the higher Glu level in Tencha infusion (125.45 μg/mL) than in Maofeng infusion (83.41 μg/mL), which may facilitate the interaction between Glu and Thea and contribute to bitterness suppression. Kaneko et al. reported that increasing the level of theanine enhanced the umami intensity of L-glutamate, suggesting that the sensory effect of theanine depends on its interaction with an umami-active matrix rather than on its intrinsic taste alone [41]. The higher Glu concentration in Tencha may therefore provide a more favorable background for the taste-modulating effect of added theanine.

3.4. Validation of the Taste-Modulating Effects of Asp

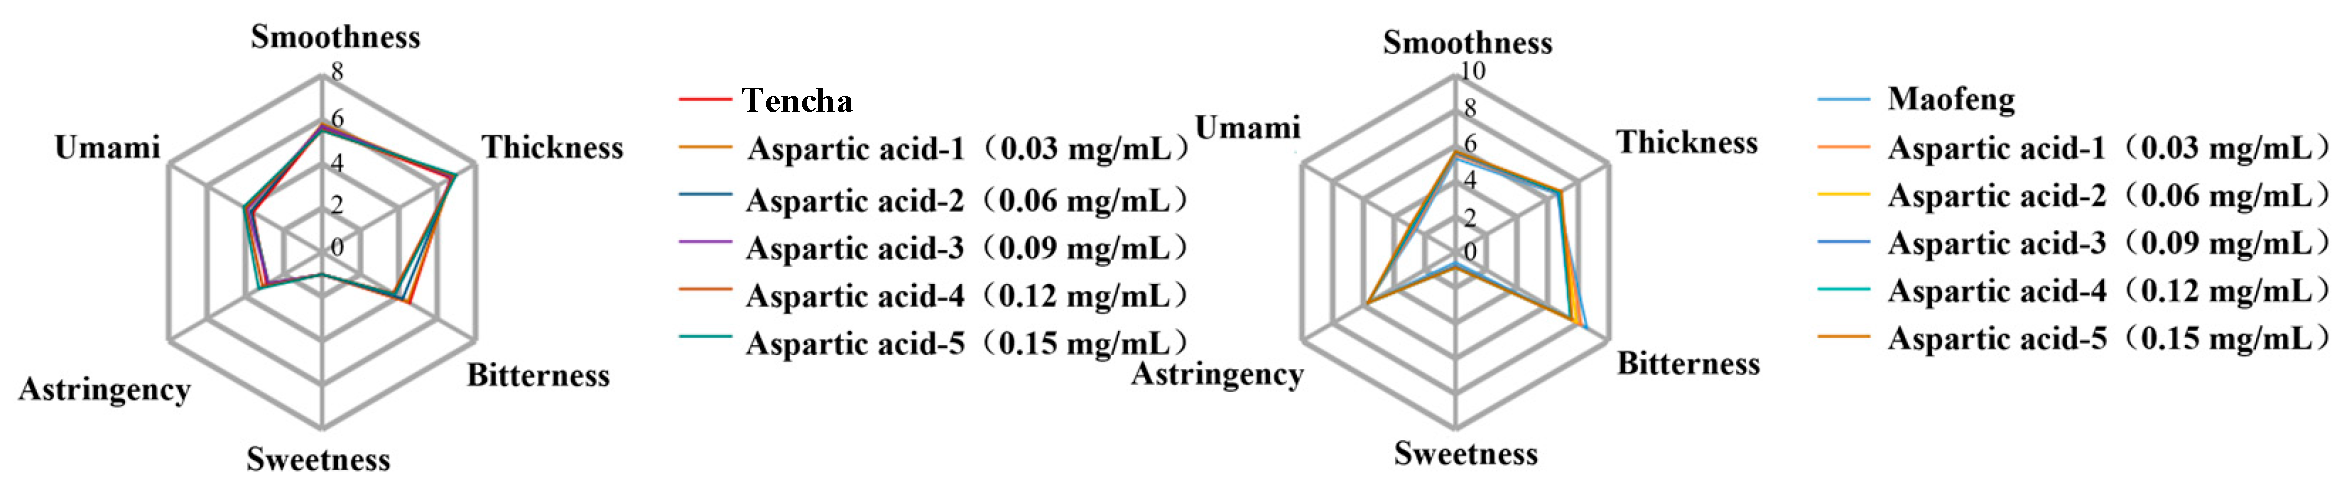
Figure 4 illustrates the effect of Asp addition on the sensory attributes of Maofeng and Tencha infusions. Asp decreased bitterness in both tea matrices, and the maximum reduction was observed at 0.12 mg/mL. At this concentration, the bitterness scores decreased from 8.6 to 7.5 in Maofeng and from 4.6 to 3.7 in Tencha. However, further increasing Asp to 0.15 mg/mL resulted in a weakened bitterness-reducing effect, although the scores remained below the control levels. These results suggest that Asp-mediated bitterness modulation was concentration-dependent and exhibited an optimal effective concentration range. Asp is an umami-active amino acid with a low sensory threshold of approximately 0.02 mg/mL, which may contribute to its bitterness-masking effect [42]. Asp (0.13–0.50 mg/mL) significantly reduced the bitterness of EGCG and ECG, whereas it enhanced the bitterness of GCG at high GCG concentrations, although this enhancement weakened as Asp concentration increased [16]. Tencha contained substantially more Asp but markedly less EGCG than Maofeng, which may partly explain the different changes in bitterness observed after Asp spiking.

3.5. Validation of the Taste-Modulating Effects of Arg

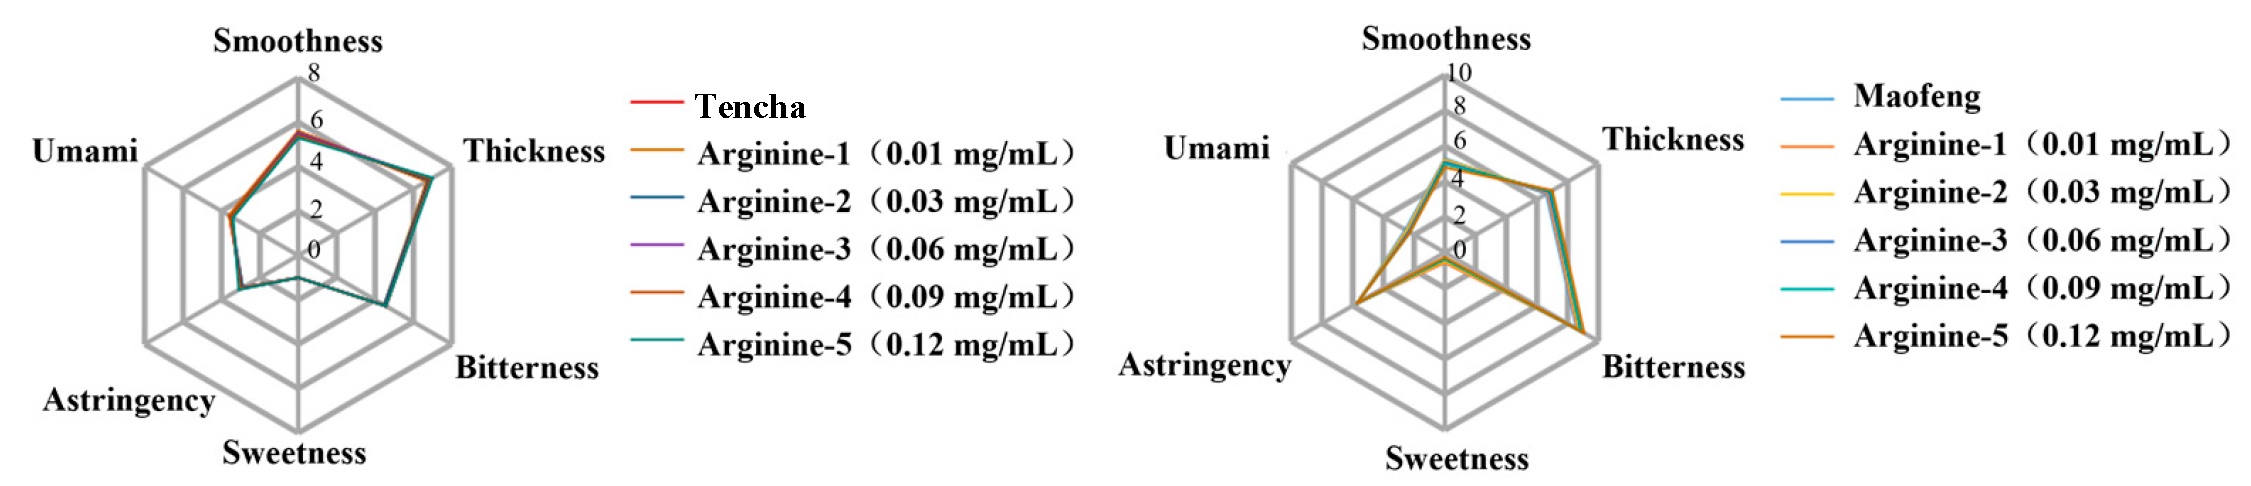
Figure 5 shows the effects of Arg supplementation on the sensory evaluation scores of Maofeng and Tencha infusions. Arg exerted a limited effect on bitterness, particularly in Tencha. At the concentration of 0.01 and 0.03 mg/mL, Arg slightly increased the bitterness scores of Maofeng to 8.7 and 8.8, while the score of Tencha remained unchanged at 4.5. Even at 0.12 mg/mL, the bitterness scores increased only modestly to 9.1 in Maofeng and 4.6 in Tencha. These small changes indicate that Arg contributed little to bitterness under the tested conditions. This may be attributed to its relatively high bitterness threshold.
The matrix-dependent effects observed in this study indicate that bitterness and astringency modulation in jasmine tea is influenced by the compositional background of the tea base, particularly the relative levels of catechins and free amino acids. In complex tea infusions, exogenous sweet- and umami-active compounds may interact with endogenous taste constituents, resulting in compound-dependent and matrix-specific sensory responses. These findings suggest that the regulation of jasmine tea taste is governed by both the intrinsic chemical composition of the tea base and inter-component interactions within the infusion matrix.

4. Conclusions

This study combined WGCNA and spiking experiments to identify potential taste-active compounds involved in bitterness and astringency modulation in jasmine green tea. C, GCG, Asp, Glu, Arg, and Ala were associated with higher sweetness and umami and lower bitterness and astringency, while the spiking experiments confirmed that these effects were concentration- and matrix-dependent. Overall, jasmine tea taste appears to be regulated by the combined effects of multiple compounds rather than by individual constituents alone. These findings may provide a basis for tea-base selection and taste optimization. However, the spiking experiments were performed using only two representative tea matrices and a limited sensory panel size (six assessors), which may somehow limit the generalizability of the findings across different tea bases. Further investigations involving a broader selection of tea matrices and targeted mechanistic studies are needed to confirm the applicability of these taste-modulating effects and clarify the molecular interactions underlying bitterness and astringency regulation.

Author Contributions

Y.-J.L.: Writing—original draft and Data curation. J.-Y.C.: Trial implementation and Data curation. M.-J.H.: Trial implementation. J.-H.Y.: Revision. W.-W.L.: Project administration, Conceptualization and Trial implementation. All authors have read and agreed to the published version of the manuscript.

Funding

This research was funded by the Project 2022XTTGCY02-06, Zhejiang Major Agricultural Technology Collaborative Extension Program (2022): Innovation, Integration and Demonstration of Key Industrialization Technologies for Scented Tea; Sub-project: Development, Demonstration and Application of New Special Jasmine Tea Products.

Institutional Review Board Statement

This study involved a sensory evaluation of tea samples supplemented with exogenous compounds. The evaluation was conducted with reference to GB/T 23776, Methodology of Sensory Evaluation of Tea, and constituted a routine quality assessment with no potential risks to the participants. It falls within the scope of food sensory evaluation and does not involve life-science or medical research activities. The study posed no risk to the participants’ health or rights and did not involve the collection of any sensitive personal data. According to Article 2 of the Measures for Ethical Review of Life Sciences and Medical Research Involving Human Participants (National Health Commission of China [2023] No. 4), this study falls outside the scope of life-science and medical research activities covered by the Measures and therefore does not require ethical review.

Informed Consent Statement

Informed consent was obtained from all subjects involved in the study.

Data Availability Statement

The original contributions presented in this study are included in the article. Further inquiries can be directed to the corresponding authors.

Conflicts of Interest

Author Mei-Juan Hu was employed by the company Zhejiang Huamingyuan Tea Co., Ltd. She participated in Legal Representative in the study. The role of the company was to implement the trial. The remaining authors declare that the research was conducted in the absence of any commercial or financial relationships that could be construed, as a potential conflict of interest.

Abbreviations

The following abbreviations are used in this manuscript:
WGCNAWeighted gene co-expression network analysis
EGCGEpigallocatechin gallate
EGCEpigallocatechin
ECGEpicatechin gallate
ECEpicatechin
GCGGallocatechin gallate
GCGallocatechin
CGCatechin gallate
CCatechin
M-gal-rha-gluMyricetin-3-O-galactosyl-rhamnosyl-glucoside
M-galMyricetin 3-O-galactoside
M-gluMyricetin 3-O-glucoside
Q-gal-rha-gluQuercetin-3-O-glucosyl-rhamnosyl-galactoside
Q-glu-rha-gluQuercetin-3-O-glucosyl-rhamnosyl-glucoside
Q-glu-rha-rhaQuercetin-3-O-rhamnosyl-rhamnosyl-glucoside
Q-galQuercetin 3-O-galactoside
Q-gluQuercetin 3-O-glucoside
K-glu-rha-gluKaempferol-3-O-glucosyl-rhamnosyl-glucoside
K-galKaempferol-3-O-galactoside
K-glu-rhaKaempferol-3-O-rhamnosyl-glucoside
K-gluKaempferol 3-O-glucoside
AspAspartic acid
GluGlutamic acid
AsnAsparagine
SerSerine
GlnGlutamine
HisHistidine
GlyGlycine
ThrThreonine
ArgArginine
AlaAlanine
GABAγ-aminobutyric acid
TheaTheanine
TyrTyrosine
ValValine
MetMethionine
TrpTryptophan
PhePhenylalanine
IleIsoleucine
LeuLeucine
LysLysine
OPAO-phthalaldehyde
QDAQuantitative descriptive analysis
TCTotal catechins
TFGTotal flavonol glycosides
TAATotal amino acids

References

  1. Chen, H.Y.; Jiang, R.G.; An, H.M.; Xu, H.; Ou, X.C.; Wang, K.F.; Chen, Y.; Jiang, Y.C.; Li, S.; Huang, J.N.; et al. Characterization of key odor-active volatiles in jasmine green tea by sensomics and chemometrics. Food Chem. X 2026, 34, 103695. [Google Scholar] [CrossRef] [Scilit] [PubMed]
  2. Yang, Y.; Dong, Y.; Song, Z.M.; Zou, J.F.; Huang, X.Q.; Mao, D.Z.; He, C.L.; Lin, L. Aroma Characteristics and Volatile Compound Transfer in Jasmine Tea During Scenting. Foods 2026, 15, 1403. [Google Scholar] [CrossRef] [Scilit] [PubMed]
  3. Hou, Z.W.; Chen, Z.Y.; Li, L.; Chen, H.P.; Zhang, H.Y.; Liu, S.T.; Zhang, R.; Song, Q.Y.; Chen, Y.X.; Su, Z.C.; et al. Comparison of volatile compounds in jingshan green tea scented with different flowers using GC-IMS and GC-MS analyses. Foods 2024, 13, 2653. [Google Scholar] [CrossRef] [Scilit] [PubMed]
  4. Hussain, N.; Ishak, I.; Harith, N.M.; Kuan, G.L.P. Comparison of bioactive compounds and sensory evaluation on edible flowers tea infusion. Ital. J. Food Sci. 2019, 31, 264–273. [Google Scholar] [CrossRef] [Scilit]
  5. Deng, S.J.; Zhang, G.; Aluko, O.O.; Mo, Z.J.; Mao, J.J.; Zhang, H.B.; Liu, X.H.; Ma, M.; Wang, Q.; Liu, H.B. Bitter and astringent substances in green tea: Composition, human perception mechanisms, evaluation methods and factors influencing their formation. Food Res. Int. 2022, 157, 111262. [Google Scholar] [CrossRef] [Scilit] [PubMed]
  6. Liang, G.Q.; Liao, K.L.; Zhou, J.T.; Wu, Y.; Wang, Y.P.; Zhang, D.; Yu, Z.; Chen, Y.Q.; Ni, D.J. Formation mechanism analysis of bitterness and astringency during Enshi Yulu green tea processing by metabolomics and sensomics. Food Chem. 2026, 500, 147422. [Google Scholar] [CrossRef] [Scilit] [PubMed]
  7. Liou, B.K.; Jaw, Y.M.; Chuang, G.C.C.; Yau, N.N.J.; Zhuang, Z.Y.; Wang, L.F. Important Sensory, Association, and Postprandial Perception Attributes Influencing Young Taiwanese Consumers’ Acceptance for Taiwanese Specialty Teas. Foods 2020, 9, 100. [Google Scholar] [CrossRef] [Scilit] [PubMed]
  8. Ye, J.H.; Ye, Y.; Yin, J.F.; Jin, J.; Liang, Y.R.; Liu, R.Y.; Tang, P.; Xu, Y.Q. Bitterness and astringency of tea leaves and products: Formation mechanism and reducing strategies. Trends Food Sci. Technol. 2022, 123, 130–143. [Google Scholar] [CrossRef] [Scilit]
  9. Scharbert, S.; Hofmann, T. Molecular Definition of Black Tea Taste by Means of Quantitative Studies, Taste Reconstitution, and Omission Experiments. J. Agric. Food Chem. 2005, 53, 5377–5384. [Google Scholar] [CrossRef] [Scilit] [PubMed]
  10. Xu, Y.Q.; Zou, C.; Gao, Y.; Chen, J.X.; Wang, F.; Chen, G.S.; Yin, J.F. Effect of the type of brewing water on the chemical composition, sensory quality and antioxidant capacity of Chinese teas. Food Chem. 2017, 236, 142–151. [Google Scholar] [CrossRef] [Scilit] [PubMed]
  11. Bandyopadhyay, P.; Ghosh, A.K.; Ghosh, C. Recent developments on polyphenol-protein interactions: Effects on tea and coffee taste, antioxidant properties and the digestive system. Food Funct. 2012, 3, 592–605. [Google Scholar] [CrossRef] [Scilit] [PubMed]
  12. Sun, H.W.; Zhang, J.Y.; Shi, Y.; Cui, H.C.; Wang, W.W.; Chen, J.X.; Wang, F.; Gao, H.B.; Wang, J.D.; Zhao, L.; et al. Research Progress on Evaluation Methods, Chemical Composition, and Interaction Effects Regarding the Thick and Mellow Flavor of Green Tea. Beverage 2026, 12, 85. [Google Scholar] [CrossRef] [Scilit]
  13. Chen, J.Y.; Luo, W.W.; Li, W.X.; Zheng, Y.N.; Zheng, X.Q.; Lu, J.L.; Liang, Y.R.; Ye, J.H. Effect of scenting process on the taste profile of jasmine green tea and the potent bitterness-enhancing compound in jasmine flowers. Food Res. Int. 2025, 204, 115927. [Google Scholar] [CrossRef] [Scilit] [PubMed]
  14. Ley, J.P. Masking bitter taste by molecules. Chemosens. Percept. 2008, 1, 58–77. [Google Scholar] [CrossRef] [Scilit]
  15. Zhou, Z.; Ou, M.; Shen, W.; Jin, W.; Yang, G.; Huang, W.; Guo, C. Caffeine weakens the astringency of epigallocatechin gallate by inhibiting its interaction with salivary proteins. Food Chem. 2024, 460, 140753. [Google Scholar] [CrossRef] [Scilit] [PubMed]
  16. Liu, Z.Y.; Ran, Q.S.; Li, Q.; Yang, T.; Dai, Y.Q.; Zhang, T.; Fang, S.M.; Pan, K.; Long, L. Interaction between major catechins and umami amino acids in green tea based on electronic tongue technology. J. Food Sci. 2023, 88, 2339–2352. [Google Scholar] [CrossRef] [Scilit] [PubMed]
  17. Wei, Y.M.; Yin, X.C.; Wu, H.T.; Zhao, M.J.; Huang, J.H.; Zhang, J.X.; Li, T.H.; Ning, J.M. Improving the flavor of summer green tea (Camellia sinensis L.) using the yellowing process. Food Chem. 2022, 388, 132982. [Google Scholar] [CrossRef] [Scilit] [PubMed]
  18. Kim, M.J.; Son, H.J.; Kim, Y.; Misaka, T.; Rhyu, M.R. Umami-bitter interactions: The suppression of bitterness by umami peptides via human bitter taste receptor. Biochem. Biophys. Res. Commun. 2015, 456, 586–590. [Google Scholar] [CrossRef] [Scilit] [PubMed]
  19. Guerreiro, C.; Brandão, E.; de Jesus, M.; Gonçalves, L.; Pérez-Gregório, R.; Mateus, N.; Freitas, V.d.; Soares, S. New insights into the oral interactions of different families of phenolic compounds: Deepening the astringency mouthfeels. Food Chem. 2022, 375, 131642. [Google Scholar] [CrossRef] [Scilit] [PubMed]
  20. Zhang, K.Y.; Huang, J.B.; Wang, D.X.; Wan, X.C.; Wang, Y.J. Covalent polyphenols-proteins interactions in food processing: Formation mechanisms, quantification methods, bioactive effects, and applications. Front. Nutr. 2024, 11, 1371401. [Google Scholar] [CrossRef] [Scilit] [PubMed]
  21. Xie, J.; Shi, Y.; Luo, W.; Fang, W.; Luo, L.; Zeng, L. Effects of theacrine on the astringency of EGCG by affecting salivary protein-EGCG interactions through different molecular mechanisms. Food Chem. X 2024, 22, 101474. [Google Scholar] [CrossRef] [Scilit] [PubMed]
  22. Hopfer, H.; Riak, A.C.; Roberts, R.F.; Hayes, J.E.; Ziegler, G.R. Synergistic and antagonistic ingredient interactions as a sugar reduction strategy in chocolate milk. J. Sens. Stud. 2022, 37, e12770. [Google Scholar] [CrossRef] [Scilit]
  23. Breslin, P.A.S.; Keast, R.S.J. An overview of binary taste–taste interactions. Food Qual. Prefer. 2002, 14, 111–124. [Google Scholar] [CrossRef] [Scilit]
  24. Zheng, X.Q.; Nie, Y.; Gao, Y.; Huang, B.; Ye, J.H.; Lu, J.L.; Liang, Y.R. Screening the cultivar and processing factors based on the flavonoid profiles of dry teas using principal component analysis. J. Food Compos. Anal. 2018, 67, 29–37. [Google Scholar] [CrossRef] [Scilit]
  25. Xu, L.J.; Ye, Q.Q.; Cao, Q.Q.; Liu, Y.Y.; Li, X.H.; Liu, Z.Q.; Gong, Y.S.; Zhang, S.; Yin, J.F.; Xu, Y.Q. Effects of the Taste Substances and Metal Cations in Green Tea Infusion on the Turbidity of EGCG-Mucin Mixtures. Foods 2024, 13, 1172. [Google Scholar] [CrossRef] [Scilit] [PubMed]
  26. GB/T 34779-2017; Technical Specification for Jasmine Tea Processing. Standards Press of China: Beijing, China, 2017.
  27. Huang, R.; Wang, Z.H.; Wen, W.W.; Yao, M.Z.; Liu, H.R.; Li, F.; Zhang, S.R.; Ni, D.J.; Chen, L. Comprehensive dissection of variation and accumulation of free amino acids in tea accessions. Hortic. Res. 2024, 11, uhad263. [Google Scholar] [CrossRef] [Scilit] [PubMed]
  28. GB/T 23776-2018; Methodology of Sensory Evaluation of Tea. Standards Press of China: Beijing, China, 2018.
  29. Zhu, Y.M.; Dong, J.J.; Jin, J.; Liu, J.J.; Zheng, X.Q.; Lu, J.L.; Liang, Y.R.; Ye, J.H. Roasting process shaping the chemical profile of roasted green tea and the association with aroma features. Food Chem. 2021, 353, 129428. [Google Scholar] [CrossRef] [Scilit] [PubMed]
  30. Cui, M.; Wu, H.; An, Y.J.; Liu, Y.; Wei, L.P.; Qi, X. Identification of important modules and biomarkers in diabetic cardiomyopathy based on WGCNA and LASSO analysis. Front. Endocrinol. 2024, 15, 1185062. [Google Scholar] [CrossRef] [Scilit] [PubMed]
  31. Ruan, L.; Wei, K.; Wang, L.Y.; Cheng, H.; Wu, L.Y.; Li, H.L. Characteristics of Free Amino Acids (the Quality Chemical Components of Tea) under Spatial Heterogeneity of Different Nitrogen Forms in Tea (Camellia sinensis) Plants. Molecules 2019, 24, 415. [Google Scholar] [CrossRef] [Scilit] [PubMed]
  32. Li, X.X.; Zhang, X.; Tong, L.; Zhang, S.W.; Ye, D.L.; Wu, L.Q. Summary of free amino acids to improve crop flavor quality. J. China Agric. Univ. 2022, 27, 73–81. [Google Scholar] [CrossRef]
  33. Wong, K.H.; Aziz, S.A.; Mohamed, S. Sensory aroma from Maillard reaction of individual and combinations of amino acids with glucose in acidic conditions. Int. J. Food Sci. Technol. 2008, 43, 1512–1519. [Google Scholar] [CrossRef] [Scilit]
  34. Ananingsih, V.K.; Sharma, A.; Zhou, W. Green tea catechins during food processing and storage: A review on stability and detection. Food Res. Int. 2013, 50, 469–479. [Google Scholar] [CrossRef] [Scilit]
  35. Xie, L.W.; Guo, Y.P.; Cai, B.; Yang, J.Y. Epimerization of epigallocatechin gallate to gallocatechin gallate and its anti-diabetic activity. Med. Chem. Res. 2013, 22, 3372–3378. [Google Scholar] [CrossRef] [Scilit]
  36. Liu, C.T.; Tzen, J.T.C. Exploring the relative astringency of tea catechins and distinct astringent sensation of catechins and flavonol glycosides via an in vitro assay composed of artificial oil bodies. Molecules 2022, 27, 5679. [Google Scholar] [CrossRef] [Scilit] [PubMed]
  37. Schiffman, S.S.; Sennewald, K.; Gagnon, J. Comparison of taste qualities and thresholds of D- and L-amino acids. Physiol. Behav. 1981, 27, 51–59. [Google Scholar] [CrossRef] [Scilit] [PubMed]
  38. Chen, D.W.; Zhang, M. Non-volatile taste active compounds in the meat of Chinese mitten crab. Food Chem. 2007, 104, 1200–1205. [Google Scholar] [CrossRef] [Scilit]
  39. Yin, X.; Huang, J.A.; Zhang, S.G.; Liu, Z.H. Research progress of chemical components deciding the green tea taste. J. Tea Commun. 2018, 45, 9–13+19. [Google Scholar]
  40. Wang, W.L.; Zhou, X.R.; Liu, Y. Characterization and evaluation of umami taste: A review. Trends Anal. Chem. 2020, 127, 115876. [Google Scholar] [CrossRef] [Scilit]
  41. Kaneko, S.; Kumazawa, K.; Masuda, H.; Henze, A.; Hofmann, T. Molecular and sensory studies on the umami taste of Japanese green tea. J. Agric. Food Chem. 2006, 54, 2688–2694. [Google Scholar] [CrossRef] [Scilit] [PubMed]
  42. Yamaguchi, S.; Yoshikawa, T.; Ikeda, S.; Ninomiya, T. Measurement of the relative taste intensity of some L-α-amino acids and 5’-nucleotides. J. Food Sci. 1971, 36, 846–849. [Google Scholar] [CrossRef] [Scilit]
Figure 1. Association of chemical compounds with sensory traits via WGCNA. (A) Hierarchical clustering dendrogram and (B) Module-trait relationships.
Foods 15 03047 g001
Figure 2. The effect of glutamic acid addition on the infusion taste of Tencha and Maofeng.
Foods 15 03047 g002
Figure 3. The effect of theanine addition on the infusion taste of Tencha and Maofeng.
Foods 15 03047 g003
Figure 4. The effect of aspartic acid addition on the infusion taste of Tencha and Maofeng.
Foods 15 03047 g004
Figure 5. The effect of arginine addition on the infusion taste of Tencha and Maofeng.
Foods 15 03047 g005
Table 1. The concentrations of major flavor compounds in the infusions of four tea bases and the corresponding jasmine teas.
Compounds Curly-Strip Maofeng Orchid-Shaped Type Maofeng Flat-Shaped Tea Tencha
(µg/mL)Tea BaseS30S35TEA BASES30S35Tea BaseS30S35Tea BaseS30S35
Catechin compounds
GC10.21 ± 1.88a10.55 ± 0.84a11.56 ± 1.11a10.28 ± 0.55a9.71 ± 0.49a10.57 ± 0.81a16.16 ± 1.47a14.91 ± 0.60a14.97 ± 1.45a11.67 ± 0.80a11.97 ± 0.53a12.31 ± 0.89a
EGC92.65 ± 1.72ab94.05 ± 3.16ab105.71 ± 14.87a83.40 ± 1.55ab91.98 ± 4.91a78.31 ± 7.27b97.72 ± 7.39a98.79 ± 3.73a100.46 ± 7.39a126.80 ± 2.62a124.45 ± 1.08a124.36 ± 4.70a
C13.30 ± 0.29a13.34 ± 0.52a12.78 ± 1.37a14.35 ± 0.62a14.52 ± 0.96a13.88 ± 0.35a13.77 ± 1.01a13.70 ± 1.14a15.08 ± 1.21a7.23 ± 0.37a7.16 ± 0.50a6.53 ± 0.84a
EC33.00 ± 2.69a31.49 ± 2.06ab34.24 ± 4.87a27.96 ± 1.08a28.69 ± 1.65a29.20 ± 1.18a33.42 ± 2.49a35.51 ± 1.79a34.24 ± 1.95a36.28 ± 0.46a37.14 ± 0.59a36.89 ± 0.74a
EGCG39.11 ± 3.25a35.93 ± 3.37ab35.19 ± 1.37ab46.63 ± 3.43a46.10 ± 1.99a45.49 ± 1.28a89.61 ± 0.99a89.72 ± 2.29a88.26 ± 2.61a17.44 ± 1.47a17.44 ± 1.32a16.76 ± 1.52ab
GCG9.70 ± 1.11a10.19 ± 0.14a10.40 ± 0.53a10.54 ± 0.16a9.71 ± 0.28a10.46 ± 0.23a11.33 ± 0.86a10.58 ± 0.78a11.71 ± 0.87a4.19 ± 0.58a4.05 ± 0.18a4.33 ± 0.36a
ECG10.08 ± 0.60a9.75 ± 0.68a9.15 ± 0.24a9.94 ± 0.55a9.77 ± 0.63a10.24 ± 0.20a13.42 ± 0.99a13.52 ± 0.93a12.83 ± 1.20a8.23 ± 1.32ab9.32 ± 0.92a9.06 ± 0.33a
CG1.56 ± 0.12a1.63 ± 0.09a1.51 ± 0.08a1.45 ± 0.09a1.57 ± 0.07a1.60 ± 0.11a3.12 ± 0.26a3.00 ± 0.13a3.04 ± 0.14a1.25 ± 0.05a1.15 ± 0.09a1.20 ± 0.06a
TC209.62 ± 1.42a206.94 ± 2.12a220.55 ± 16.52a204.55 ± 3.83a212.03 ± 5.17a199.75 ± 7.93a278.53 ± 7.26a279.75 ± 6.09a280.59 ± 8.42a213.09 ± 0.76a212.68 ± 0.73a211.44 ± 3.82a
Flavonol glycosides
M-gal-rha-glu0.57 ± 0.01a0.56 ± 0.06a0.53 ± 0.07a0.50 ± 0.04ab0.52 ± 0.01a0.52 ± 0.04a0.65 ± 0.04a0.64 ± 0.02a0.66 ± 0.03a0.63 ± 0.12a0.59 ± 0.08ab0.48 ± 0.05ab
M-gal0.37 ± 0.03a0.34 ± 0.02a0.33 ± 0.04a0.31 ± 0.03a0.32 ± 0.03a0.30 ± 0.02a0.40 ± 0.02a0.44 ± 0.03a0.42 ± 0.01a0.49 ± 0.03a0.48 ± 0.04a0.47 ± 0.03a
M-glu0.48 ± 0.09a0.46 ± 0.11ab0.46 ± 0.13ab0.39 ± 0.05a0.41 ± 0.04a0.40 ± 0.02a0.50 ± 0.01a0.52 ± 0.02a0.51 ± 0.02a0.61 ± 0.06a0.59 ± 0.05a0.62 ± 0.07a
Q-gal-rha-glu3.37 ± 0.10a3.45 ± 0.20a3.43 ± 0.21a3.24 ± 0.25a3.19 ± 0.28a3.32 ± 0.30a3.40 ± 0.21a3.53 ± 0.17a3.51 ± 0.29a4.45 ± 0.16a4.38 ± 0.38a4.55 ± 0.12a
Q-glu-rha-glu5.14 ± 0.23a5.47 ± 0.47a5.55 ± 0.33a3.28 ± 0.20a3.44 ± 0.19a3.41 ± 0.35a5.86 ± 0.29a5.81 ± 0.27a5.74 ± 0.33a5.98 ± 0.11a6.06 ± 0.24a5.82 ± 0.25a
Q-glu-rha-rha7.24 ± 0.08c8.14 ± 0.11a8.15 ± 0.12a6.58 ± 0.07b8.53 ± 0.61a8.38 ± 0.53a5.94 ± 0.19b7.41 ± 0.17a7.56 ± 0.33a10.12 ± 0.42b13.24 ± 0.64a12.96 ± 1.21a
Q-gal0.85 ± 0.14a0.94 ± 0.05a0.95 ± 0.01a0.81 ± 0.07a0.84 ± 0.04a0.82 ± 0.05a0.85 ± 0.01a0.88 ± 0.06a0.88 ± 0.04a0.99 ± 0.13a0.90 ± 0.05a0.80 ± 0.14a
Q-glu0.20 ± 0.04a0.24 ± 0.02a0.24 ± 0.02a0.12 ± 0.01a0.12 ± 0.00a0.12 ± 0.01a0.32 ± 0.02a0.33 ± 0.02a0.34 ± 0.03a0.14 ± 0.01a0.14 ± 0.01a0.13 ± 0.01a
K-glu-rha-glu10.60 ± 0.28a10.86 ± 0.74a11.19 ± 0.48a7.06 ± 0.57a7.08 ± 0.63a7.03 ± 0.23a11.16 ± 0.86a11.45 ± 0.72a11.35 ± 0.45a10.78 ± 0.31a11.08 ± 0.99a11.08 ± 0.32a
K-gal1.55 ± 0.23a1.54 ± 0.09a1.69 ± 0.23a1.44 ± 0.15a1.49 ± 0.11a1.47 ± 0.13a0.76 ± 0.05a0.78 ± 0.07a0.78 ± 0.03a0.73 ± 0.11a0.77 ± 0.02a0.73 ± 0.08a
K-glu-rha1.92 ± 0.19a2.08 ± 0.11a2.11 ± 0.17a1.95 ± 0.17a1.99 ± 0.07a2.01 ± 0.03a1.43 ± 0.14a1.47 ± 0.08a1.46 ± 0.04a0.90 ± 0.15a0.79 ± 0.07a0.84 ± 0.11a
K-glu0.10 ± 0.01a0.11 ± 0.01a0.10 ± 0.01a0.11 ± 0.01a0.11 ± 0.01a0.11 ± 0.01a0.15 ± 0.01a0.15 ± 0.02a0.15 ± 0.00a0.10 ± 0.01a0.10 ± 0.01a0.09 ± 0.02a
TFG32.41 ± 0.61b34.19 ± 1.02a34.75 ± 0.72a25.78 ± 0.24b28.04 ± 0.22a27.90 ± 0.45a31.42 ± 0.75b33.40 ± 0.68a33.35 ± 0.82a35.93 ± 1.33b39.12 ± 0.43a38.57 ± 0.38a
Amino acids
Asp47.29 ± 2.15a39.81 ± 2.37b44.96 ± 1.99ab46.78 ± 3.83a41.01 ± 2.98a33.72 ± 1.11b55.81 ± 0.91a42.54 ± 1.60b45.21 ± 1.82b110.53 ± 2.62a101.60 ± 1.32b95.82 ± 1.41c
Glu83.41 ± 4.03a66.89 ± 4.02b68.95 ± 3.56b64.12 ± 2.26a57.88 ± 3.44a46.82 ± 2.79b60.13 ± 1.55a42.52 ± 1.39b40.76 ± 1.44b125.45 ± 9.13a116.73 ± 1.65ab106.40 ± 1.06b
Asn13.92 ± 0.76a13.66 ± 0.66a12.96 ± 0.80a31.25 ± 2.63a22.21 ± 1.38b21.70 ± 0.61b46.28 ± 0.81ab46.22 ± 2.11a29.96 ± 0.76b36.64 ± 0.80a24.90 ± 0.34d34.34 ± 0.31b
Ser22.03 ± 0.48a20.58 ± 2.04a20.98 ± 1.91a20.71 ± 1.62a13.64 ± 0.19bc11.69 ± 0.95c17.08 ± 1.11a20.01 ± 2.06a16.87 ± 1.65ab26.60 ± 1.61a20.98 ± 0.54b20.60 ± 0.08b
Gln77.12 ± 3.88a80.00 ± 7.46a51.13 ± 2.14b42.40 ± 1.69a44.18 ± 0.93a28.29 ± 0.70b71.82 ± 1.44a53.58 ± 1.42b55.86 ± 2.41b42.03 ± 0.62a26.62 ± 0.32c28.42 ± 0.18c
His3.78 ± 0.47a4.24 ± 1.02a4.40 ± 0.41a5.86 ± 0.37a4.32 ± 0.29b3.74 ± 0.28b7.28 ± 0.64a6.00 ± 0.33b6.09 ± 0.57b7.40 ± 0.65a5.99 ± 0.14b6.29 ± 0.51b
Gly4.62 ± 0.41a5.68 ± 0.54a4.69 ± 0.42a8.33 ± 0.75a3.96 ± 0.35c4.19 ± 0.38c6.92 ± 0.69a6.92 ± 0.62a5.20 ± 0.42b4.35 ± 0.17a2.58 ± 0.18c3.18 ± 0.22b
Thr9.41 ± 0.41a8.01 ± 0.23b8.30 ± 0.11b10.15 ± 0.74a7.16 ± 0.14b6.30 ± 0.43b10.06 ± 0.54a9.07 ± 0.42ab8.28 ± 0.74b13.24 ± 0.19a9.16 ± 0.10c9.86 ± 0.10b
Arg24.80 ± 2.36ab28.76 ± 1.69a24.87 ± 1.06ab23.86 ± 2.04a21.81 ± 2.08a12.16 ± 0.43c31.03 ± 2.02a33.89 ± 1.27a22.15 ± 0.90b86.68 ± 4.14a81.06 ± 4.99a70.72 ± 0.93b
Ala10.46 ± 0.63a9.94 ± 0.84a11.22 ± 0.33a9.83 ± 0.95a8.01 ± 0.77b8.44 ± 0.69ab8.53 ± 0.50a8.50 ± 0.82a8.30 ± 0.78a24.01 ± 0.33a17.54 ± 0.21c18.47 ± 0.05b
GABA8.75 ± 0.29a7.11 ± 0.29bc6.51 ± 0.51c4.60 ± 0.41a3.03 ± 0.07b3.63 ± 0.14b4.04 ± 0.26a3.46 ± 0.13b3.26 ± 0.07b6.53 ± 0.53a4.12 ± 0.07b4.02 ± 0.17b
Thea378.68 ± 17.70a271.56 ± 15.98b298.90 ± 10.26b274.13 ± 12.89ab276.88 ± 24.51a231.20 ± 5.52b238.24 ± 7.64ab208.76 ± 7.77b229.48 ± 2.82a358.21 ± 9.45a271.34 ± 3.92b237.64 ± 6.37c
Tyr7.21 ± 0.32a4.08 ± 0.21c5.31 ± 0.52b9.67 ± 0.41a4.55 ± 0.40c3.10 ± 0.21d7.63 ± 0.72a7.88 ± 0.11a7.48 ± 0.51a7.89 ± 0.19a4.62 ± 0.05d4.99 ± 0.09c
Val4.72 ± 0.13ab3.99 ± 0.26c5.23 ± 0.35a10.41 ± 0.89a6.60 ± 0.55b5.17 ± 0.36b11.24 ± 0.90a11.04 ± 0.16a9.09 ± 0.50b6.70 ± 0.35a4.38 ± 0.05c5.83 ± 0.50b
Met2.69 ± 0.09a2.10 ± 0.10b1.47 ± 0.12c1.92 ± 0.36a1.99 ± 0.20a0.09 ± 0.01c1.58 ± 0.60a0.96 ± 0.04a1.09 ± 0.15a1.43 ± 0.37a1.07 ± 0.06a1.42 ± 0.19a
Trp7.35 ± 0.25a4.15 ± 0.34bc3.75 ± 0.30c9.23 ± 0.50a3.84 ± 0.36b4.46 ± 0.42b9.40 ± 0.63a6.57 ± 0.50c7.62 ± 0.35b9.03 ± 0.62a6.19 ± 0.05bc7.26 ± 0.52b
Phe10.12 ± 0.38a6.69 ± 0.06b9.17 ± 1.57a12.66 ± 1.02a9.87 ± 0.72b10.46 ± 0.81b14.16 ± 1.40a13.57 ± 0.57a13.04 ± 0.53a10.60 ± 0.80a6.94 ± 0.12c8.80 ± 0.62b
Ile5.83 ± 0.11a3.86 ± 0.24c4.57 ± 0.42b8.46 ± 0.46a4.69 ± 0.29b4.64 ± 0.41b8.87 ± 0.66a8.13 ± 0.49ab7.36 ± 0.54b8.34 ± 0.12a6.35 ± 0.04c6.75 ± 0.19b
Leu9.19 ± 0.32a7.53 ± 0.25b7.33 ± 0.66b13.42 ± 0.96a6.60 ± 0.07b6.18 ± 0.48b10.57 ± 0.97a9.69 ± 0.26ab8.55 ± 0.75b8.08 ± 0.80a5.70 ± 0.34b6.34 ± 0.55b
Lys9.25 ± 0.68a7.23 ± 0.45b7.67 ± 0.49b13.38 ± 0.89a8.43 ± 1.60b8.12 ± 0.75b10.09 ± 0.68a9.85 ± 0.82a9.15 ± 0.83a10.54 ± 0.93a7.91 ± 0.02b8.08 ± 0.71b
TAA740.61 ± 29.68a595.88 ± 15.72b602.38 ± 6.71b621.17 ± 24.76a550.66 ± 33.27b454.09 ± 15.19c630.77 ± 16.72a549.16 ± 14.98b534.79 ± 17.75b904.26 ± 9.02a725.78 ± 11.01b685.22 ± 5.41c
Caffeine213.84 ± 3.77a205.42 ± 14.32a208.73 ± 9.56a211.46 ± 6.84a212.90 ± 7.46a201.14 ± 18.34a217.39 ± 1.53a214.74 ± 9.43a207.43 ± 6.46a223.92 ± 1.14a224.76 ± 16.85a223.24 ± 2.37a
Note: GC, gallocatechin; EGC, epigallocatechin; C, catechin; EC, epicatechin; EGCG, epigallocatechin gallate; GCG, gallocatechin gallate; ECG, epicatechin gallate; CG, catechin gallate; TC, total catechins; Asp, aspartic acid; Glu, glutamic acid; Asn, asparagine; Ser, serine; Gln, glutamine; His, histidine; Gly, glycine; Thr, threonine; Arg, arginine; Ala, alanine; GABA, γ-aminobutyric acid; Thea, theanine; Tyr, tyrosine; Val, valine; Met, methionine; Trp, tryptophan; Phe, phenylalanine; Ile, isoleucine; Leu, leucine; Lys, lysine; TAA, total amino acids; M-gal-rha-glu, myricetin-3-O-galactosyl-rhamnosyl-glucoside; M-gal, myricetin-3-O-galactoside; M-glu, myricetin-3-O-glucoside; Q-gal-rha-glu, quercetin-3-O-galactosyl-rhamnosyl-glucoside; Q-glu-rha-glu, quercetin-3-O-glucosyl-rhamnosyl-glucoside; Q-glu-rha-rha, quercetin-3-O-rhamnosyl-rhamnosyl-glucoside; Q-glu, quercetin-3-O-glucoside; Q-gal, quercetin-3-O-galactoside; K-glu-rha-glu, kaempferol-3-O-glucosyl-rhamnosyl-glucoside; K-glu, kaempferol-3-O-glucoside; K-gal, kaempferol-3-O-galactoside; K-glu-rha, kaempferol-3-O-rhamnosyl-glucoside; TFG, total flavonol glycosides. Data are expressed as the mean ± SD. Within the same row, different letters indicate significant differences among the differently treated samples from the same tea base (p < 0.05).
Disclaimer/Publisher’s Note: The statements, opinions and data contained in all publications are solely those of the individual author(s) and contributor(s) and not of MDPI and/or the editor(s). MDPI and/or the editor(s) disclaim responsibility for any injury to people or property resulting from any ideas, methods, instructions or products referred to in the content.