

Combining Feature Extraction Methods and Categorical Boosting to Discriminate the Lettuce Storage Time Using Near-Infrared Spectroscopy


Abstract
1. Introduction
2. Materials and Methods
2.1. Sample Cultivation and Preservation
2.2. NIR Spectrum Collection and Software Tools
2.3. Preprocessing Methods
2.4. Feature Extraction Algorithms
2.4.1. Approximate Linear Discriminant Analysis
- Step 1: Preprocessing: Perform singular value decomposition on the matrix to obtain the eigenvectors , and then project the data sample onto the range space of to achieve dimensionality reduction, that is .
- Step 2: Calculate and , and obtain the eigenvector and the square root of the eigenvalue of through singular value decomposition.
- Step 3: Calculate the maximum value of the square root of the eigenvalue of , and define the approximate matrix to replace .
- Step 4: Solve the eigenvalue problem to obtain the optimal projection direction matrix .
2.4.2. Common-Vector Linear Discriminant Analysis
- Step 1: Calculate the , and then calculate the non-zero eigenvalues and corresponding eigenvectors of through matrix . These eigenvectors constitute the projection vectors of the range space.
- Step 2: Select the sample from each category and project it onto the null space of to obtain .
- Step 3: Calculate and matrix to obtain the non-zero eigenvalues and corresponding eigenvectors of . These eigenvectors are then used as the optimal projection vector , which serves as the discriminant common vector.
2.4.3. Maximum-Uncertainty Linear Discriminant Analysis
- Step 1: Calculate and , and obtain the eigenvalues and eigenvectors of .
- Step 2: Calculate through the eigenvalue calculation.
- Step 3: Compare the original eigenvalue with . If it is greater than , it will be retained; if it is less than , it will be replaced by to form a new diagonal matrix .
- Step 4: Construct using the diagonal matrix of the new eigenvalues, and replace with . Then, substitute this into the Fisher criterion of LDA [48] to obtain the optimal projection direction.
2.4.4. Null-Space Linear Discriminant Analysis
2.5. Classifiers
2.5.1. Classification and Regression Trees
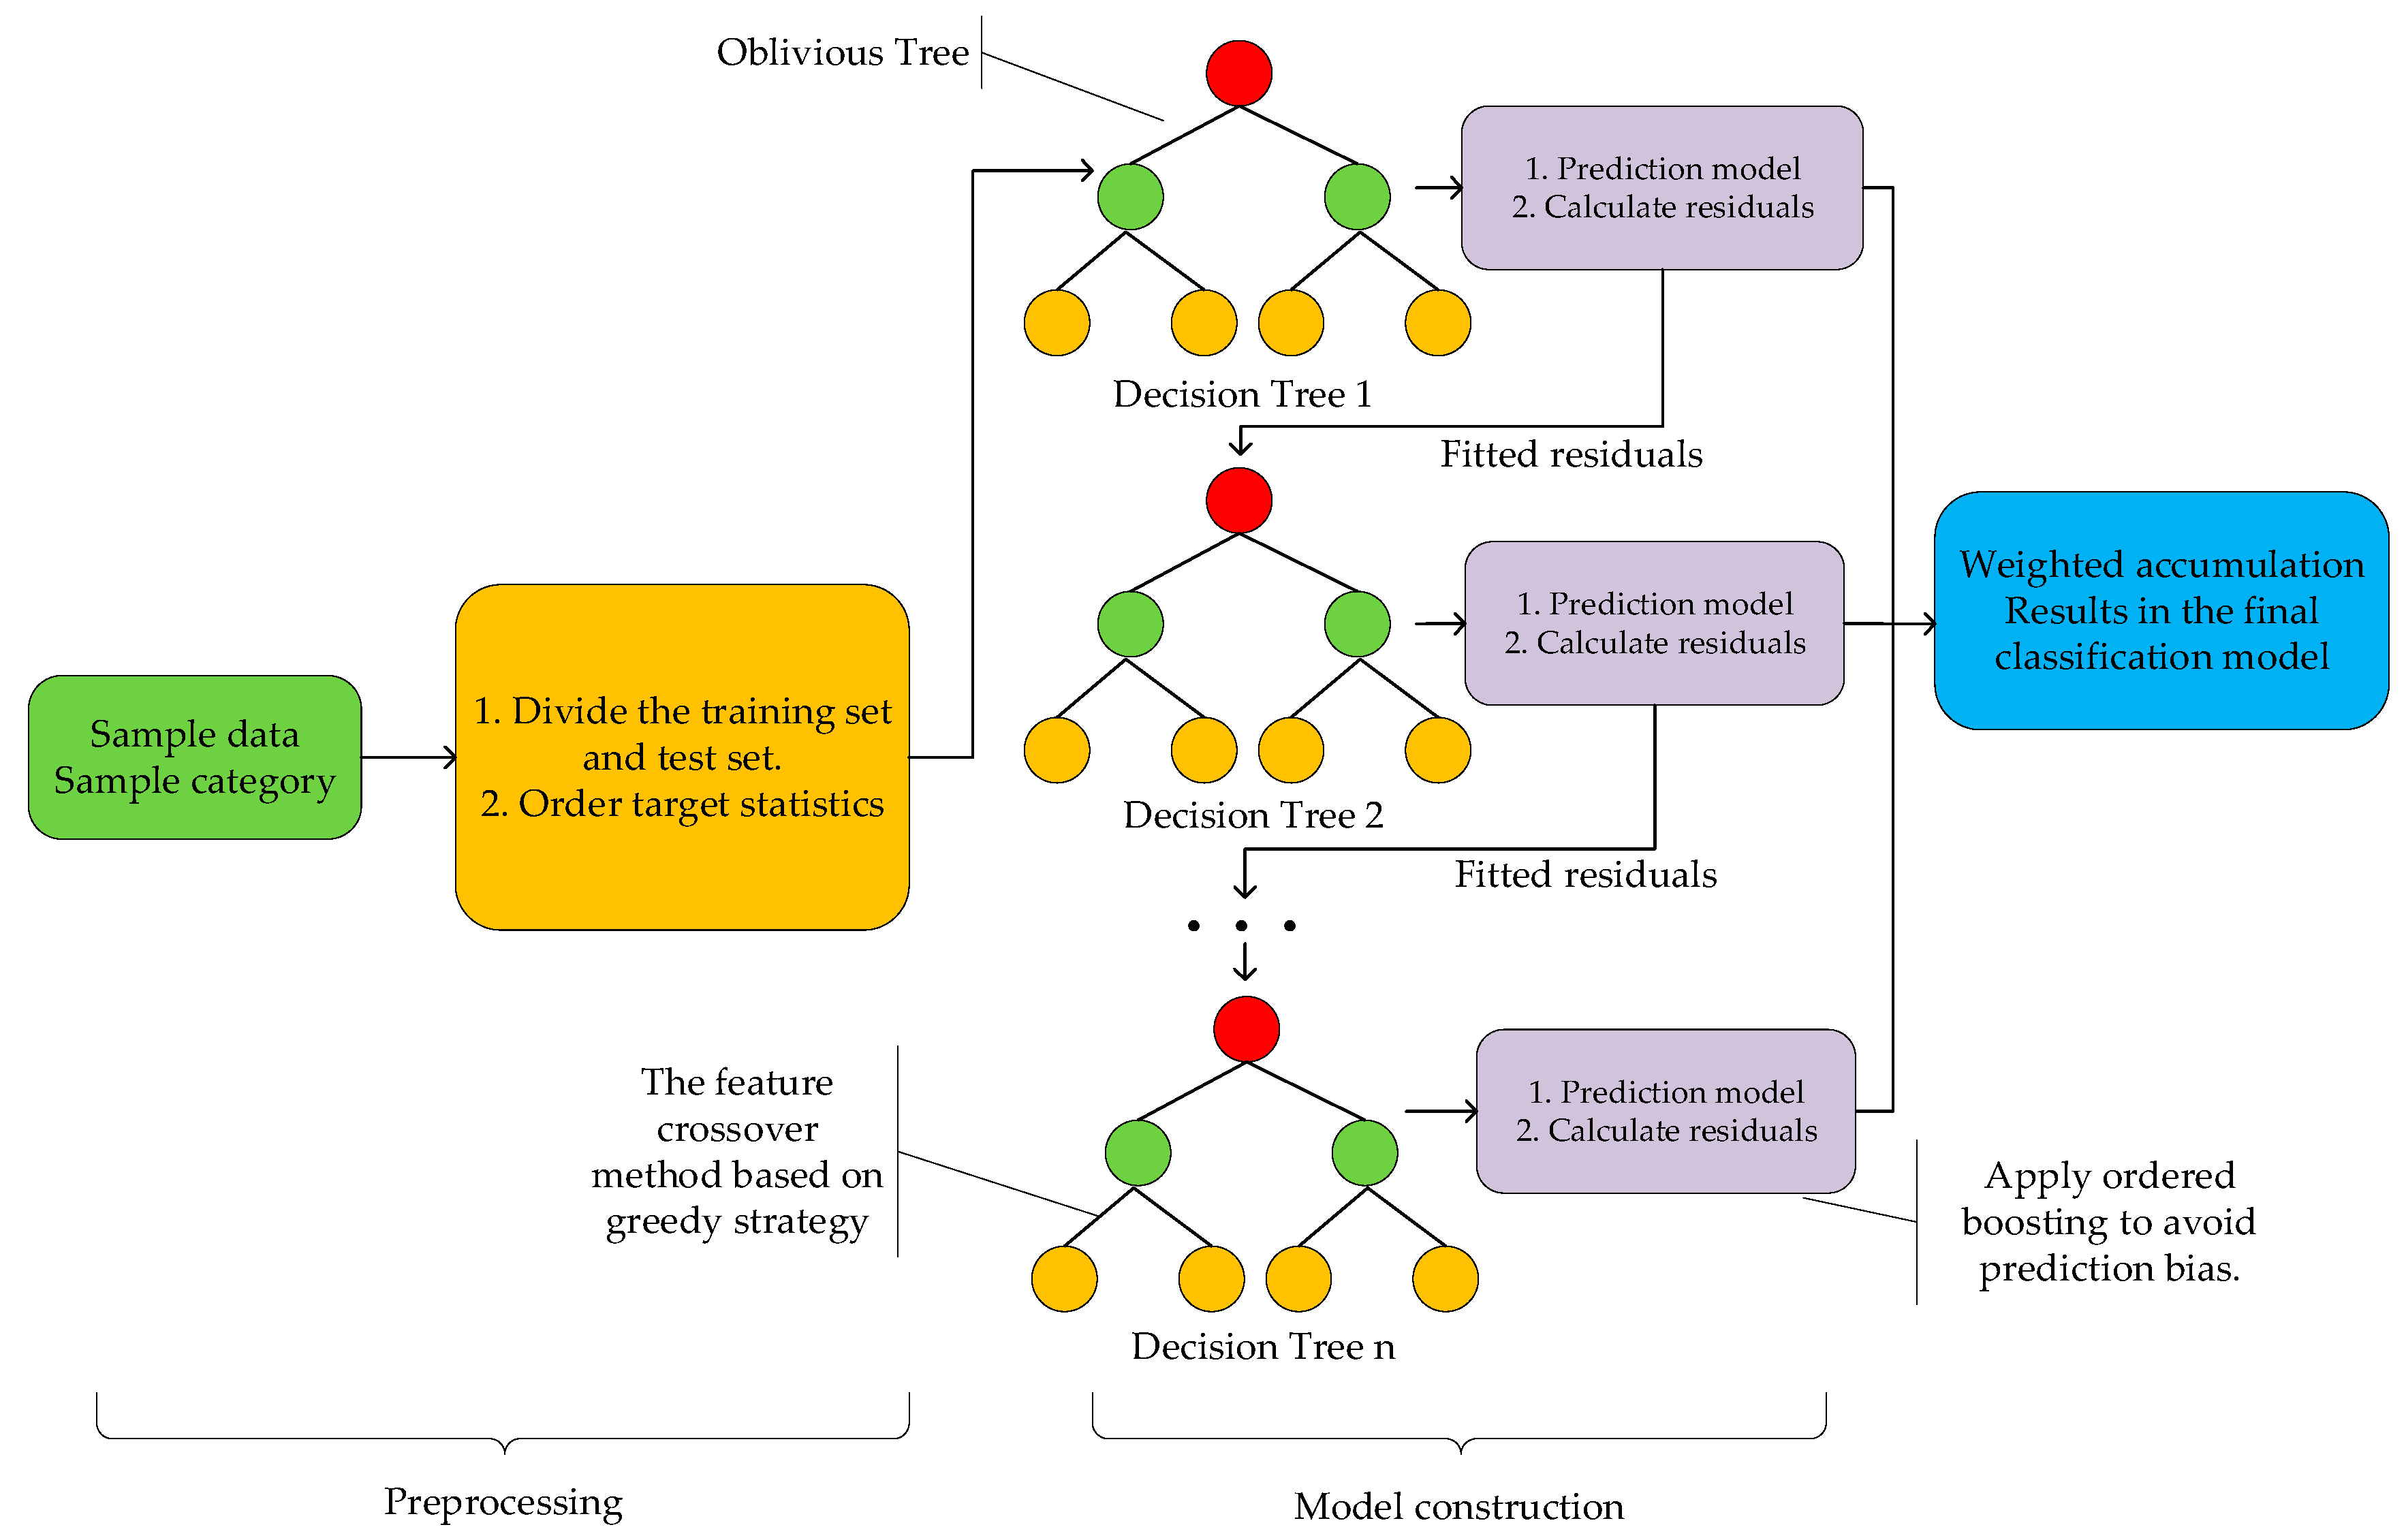
2.5.2. Categorical Boosting
3. Results
3.1. NIR Spectral Analysis
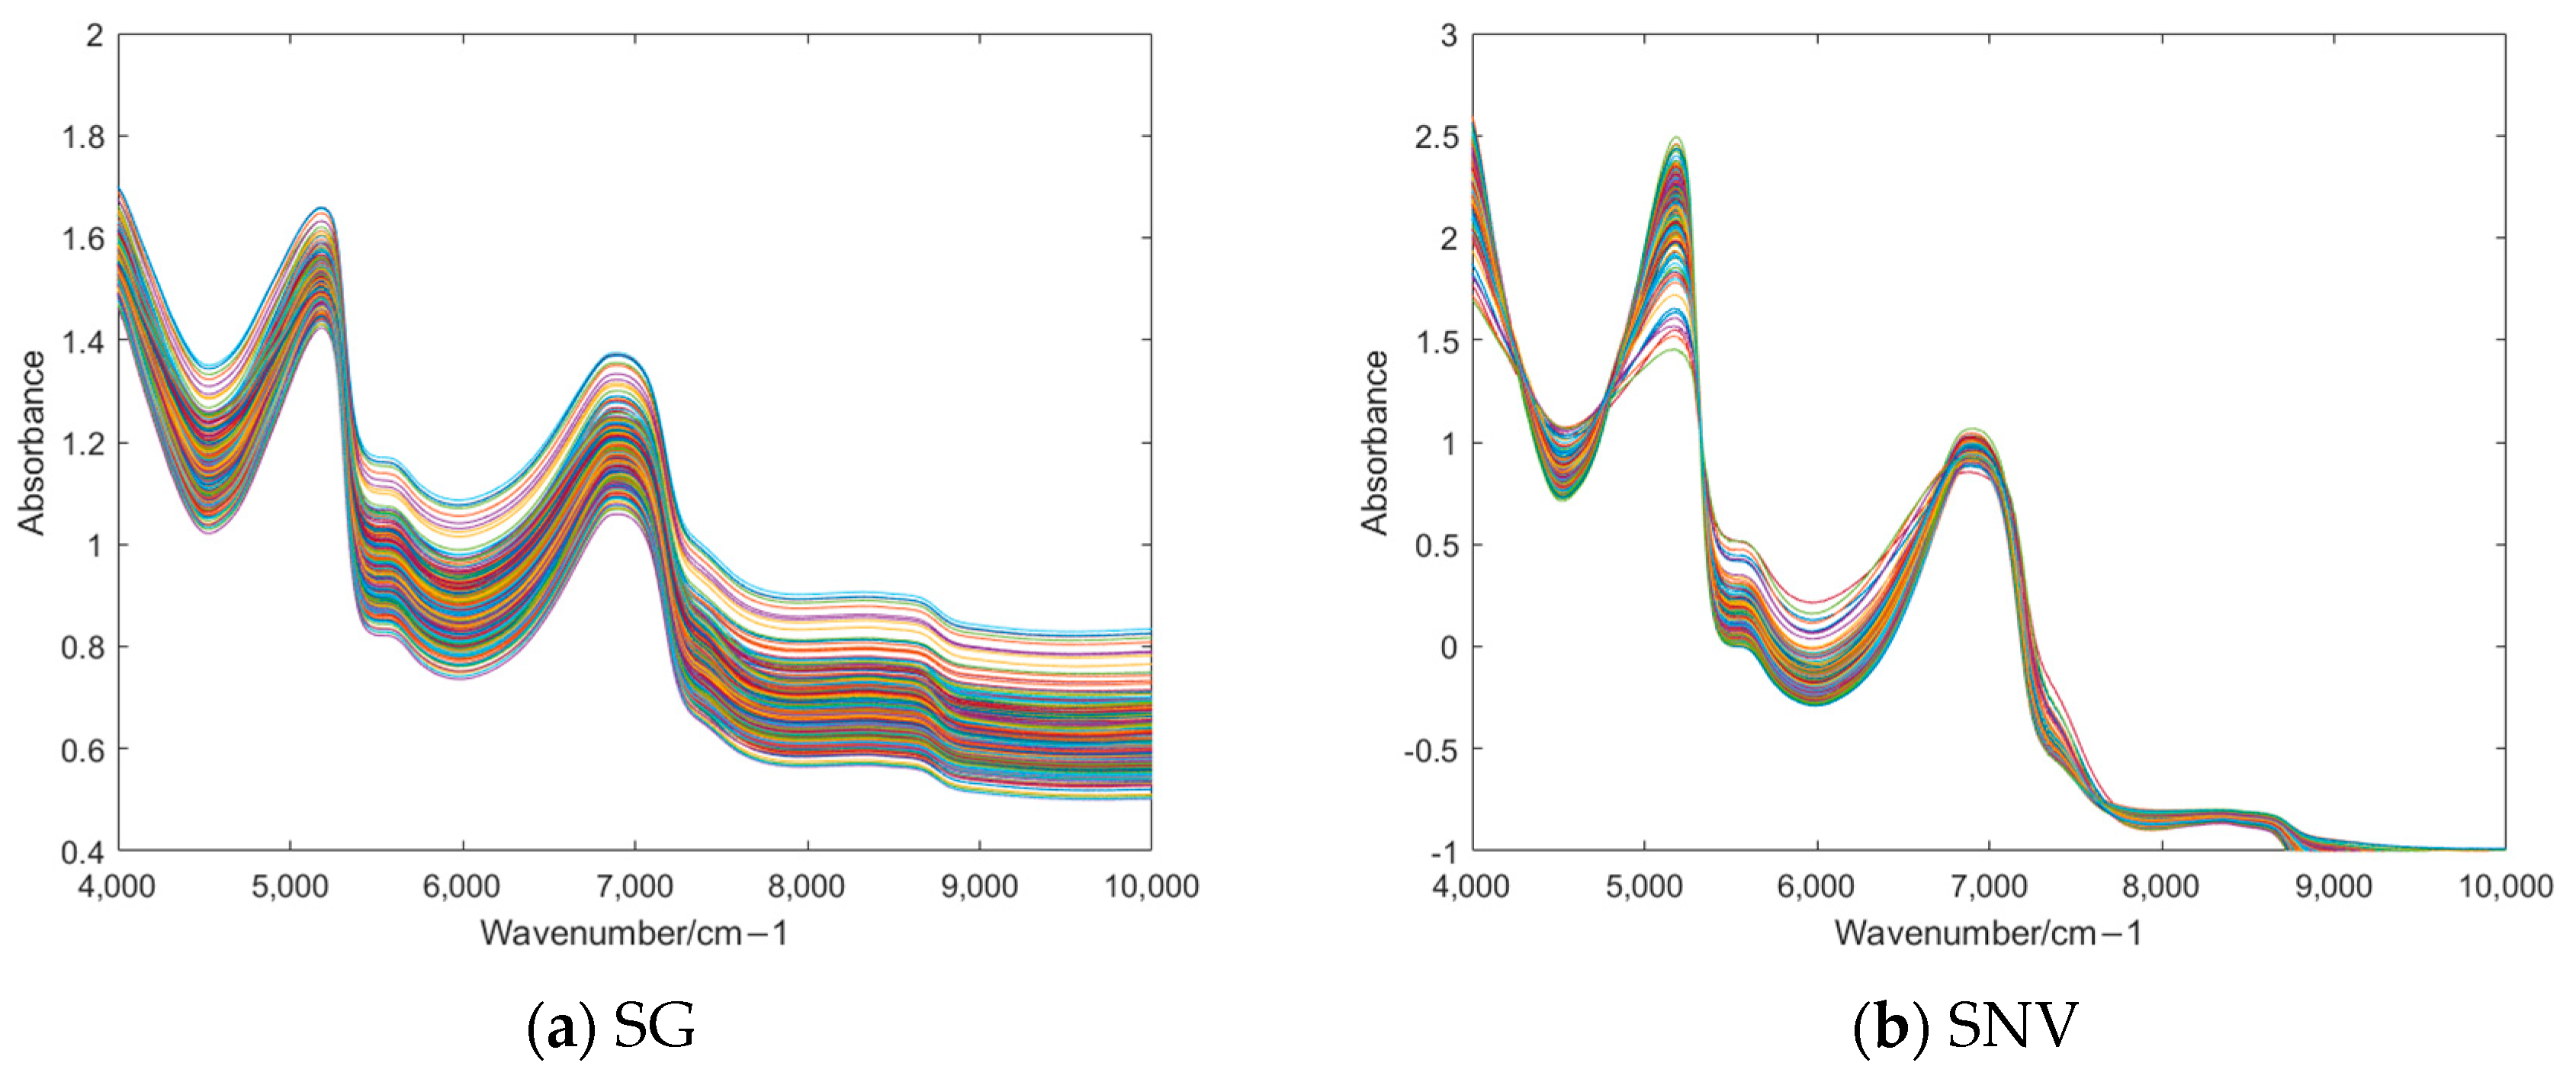
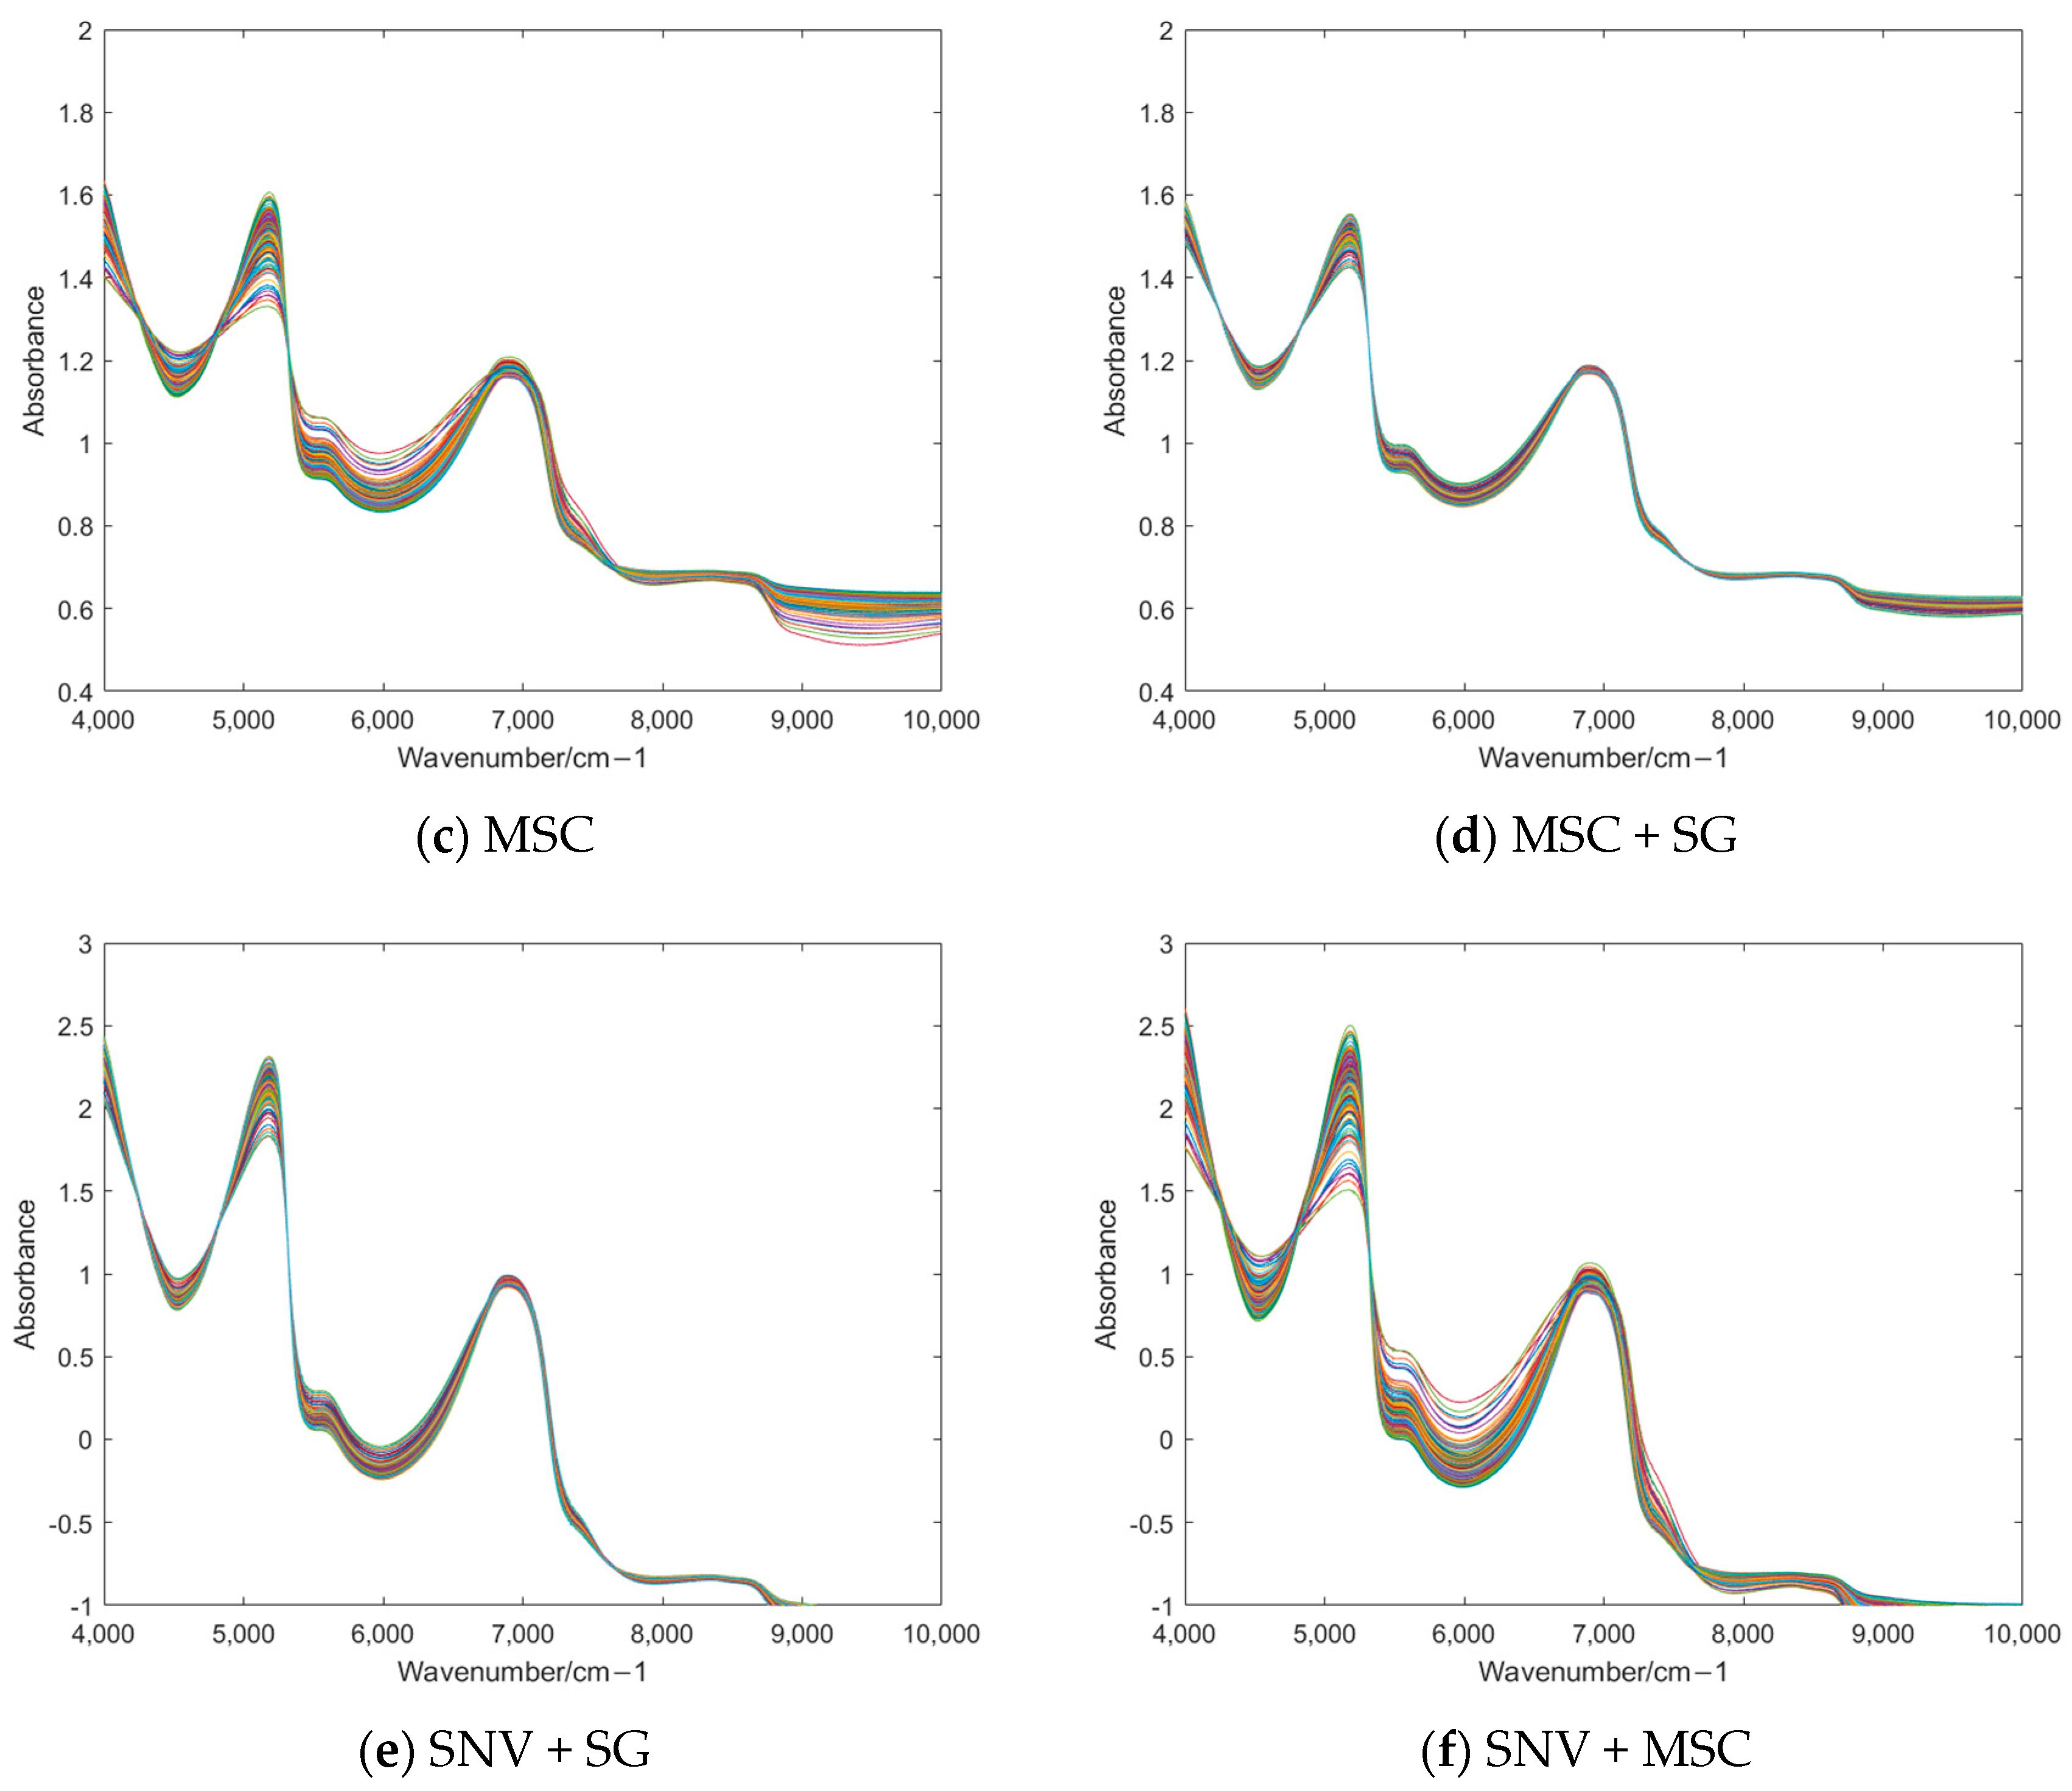
3.2. Preprocessing of NIR Spectra
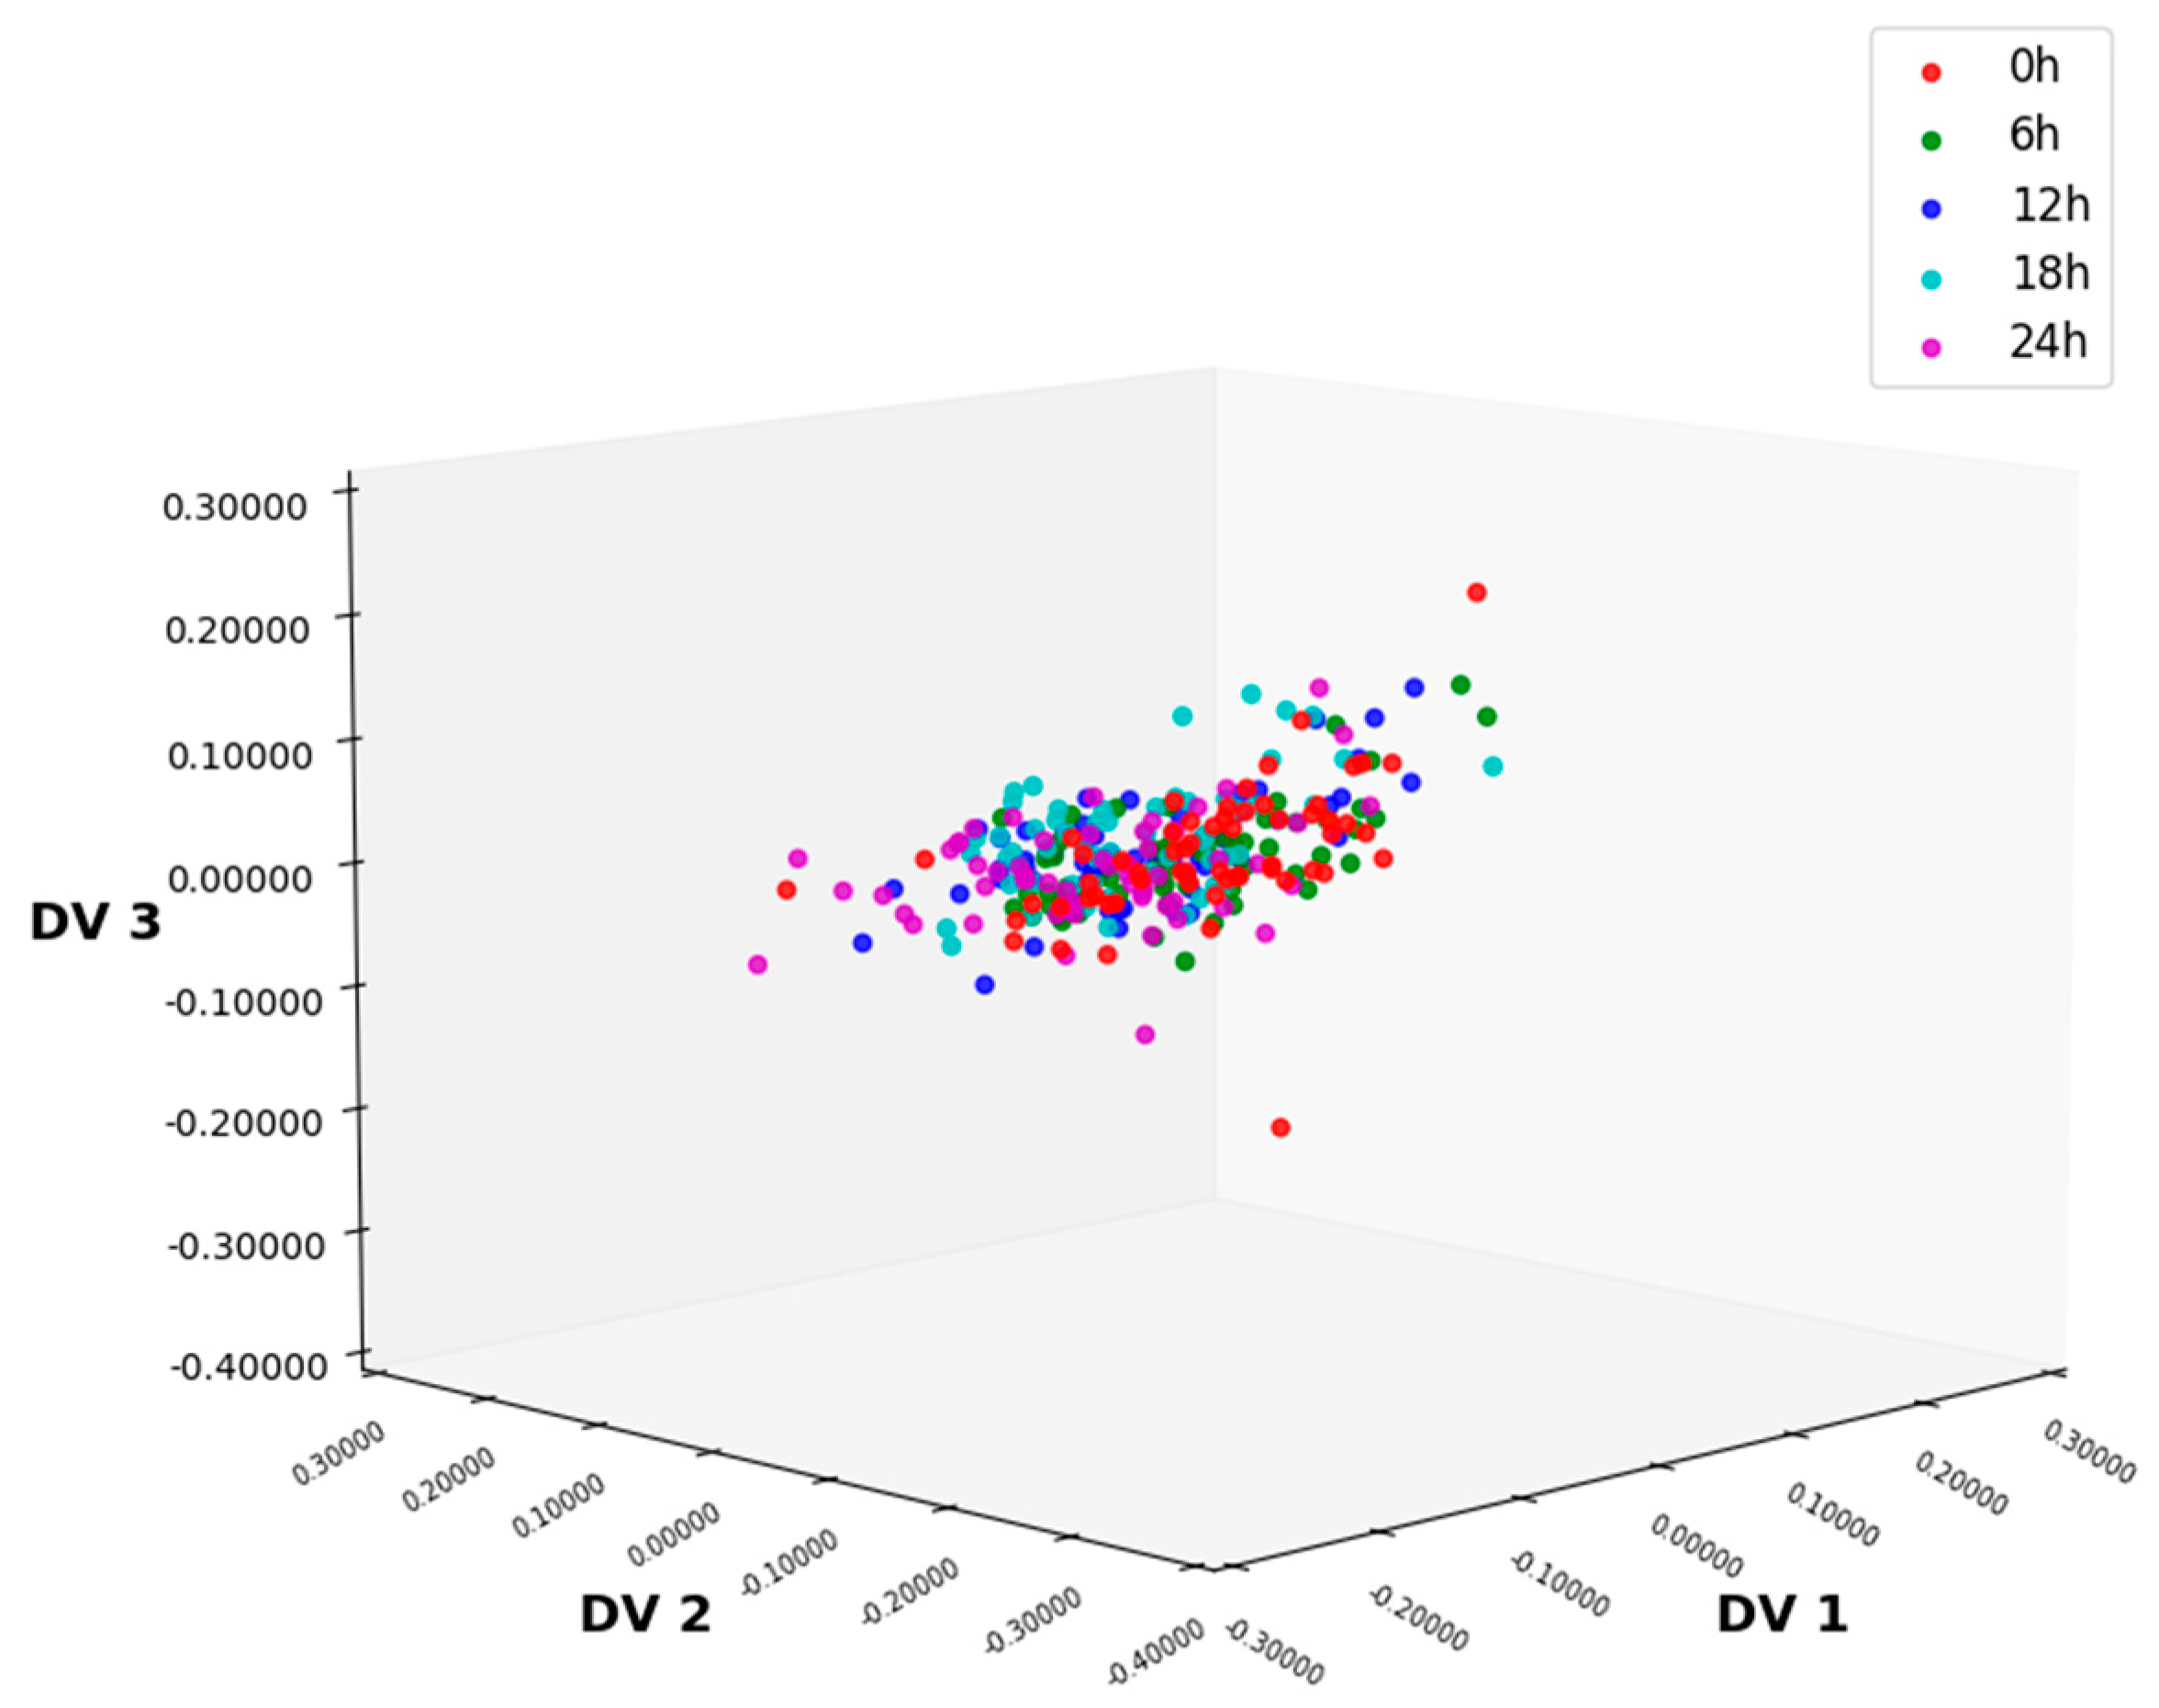
3.3. Feature Extraction
3.3.1. Feature Extraction Using ALDA
3.3.2. Feature Extraction Using CLDA
3.3.3. Feature Extraction Using MLDA
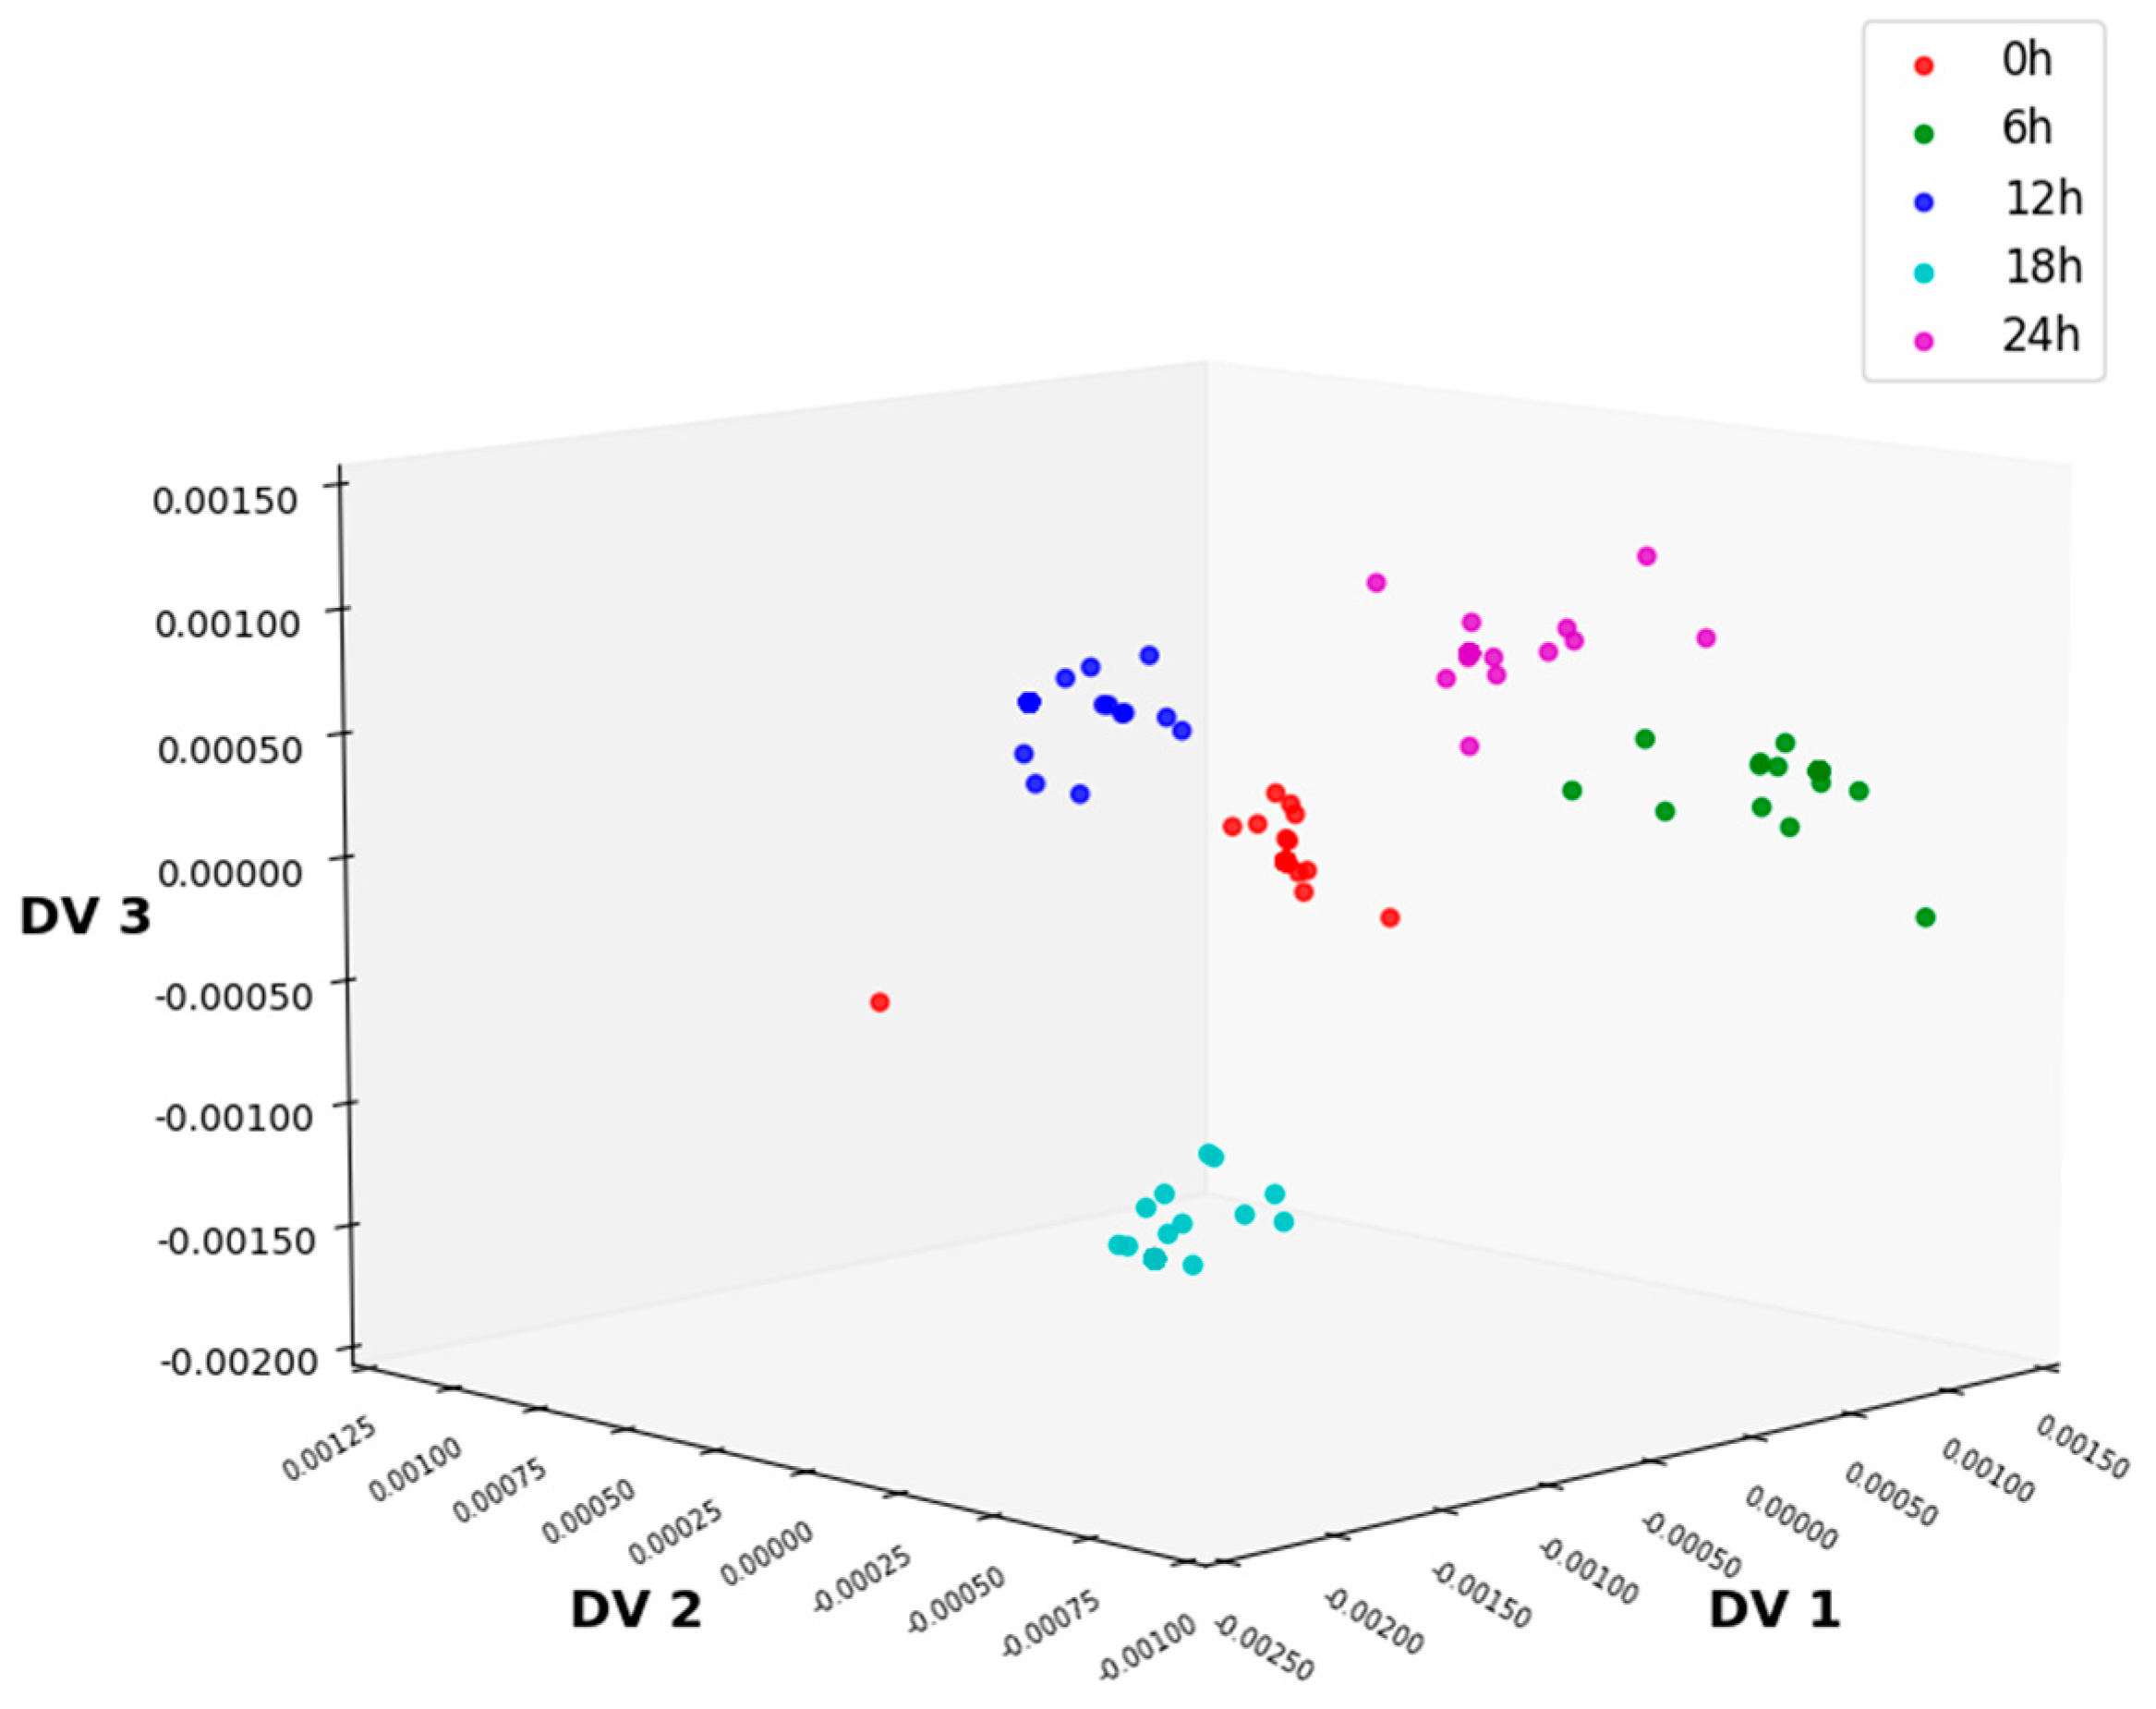
3.3.4. Feature Extraction Using NLDA
3.4. Classification Results
3.4.1. Classification Using CART
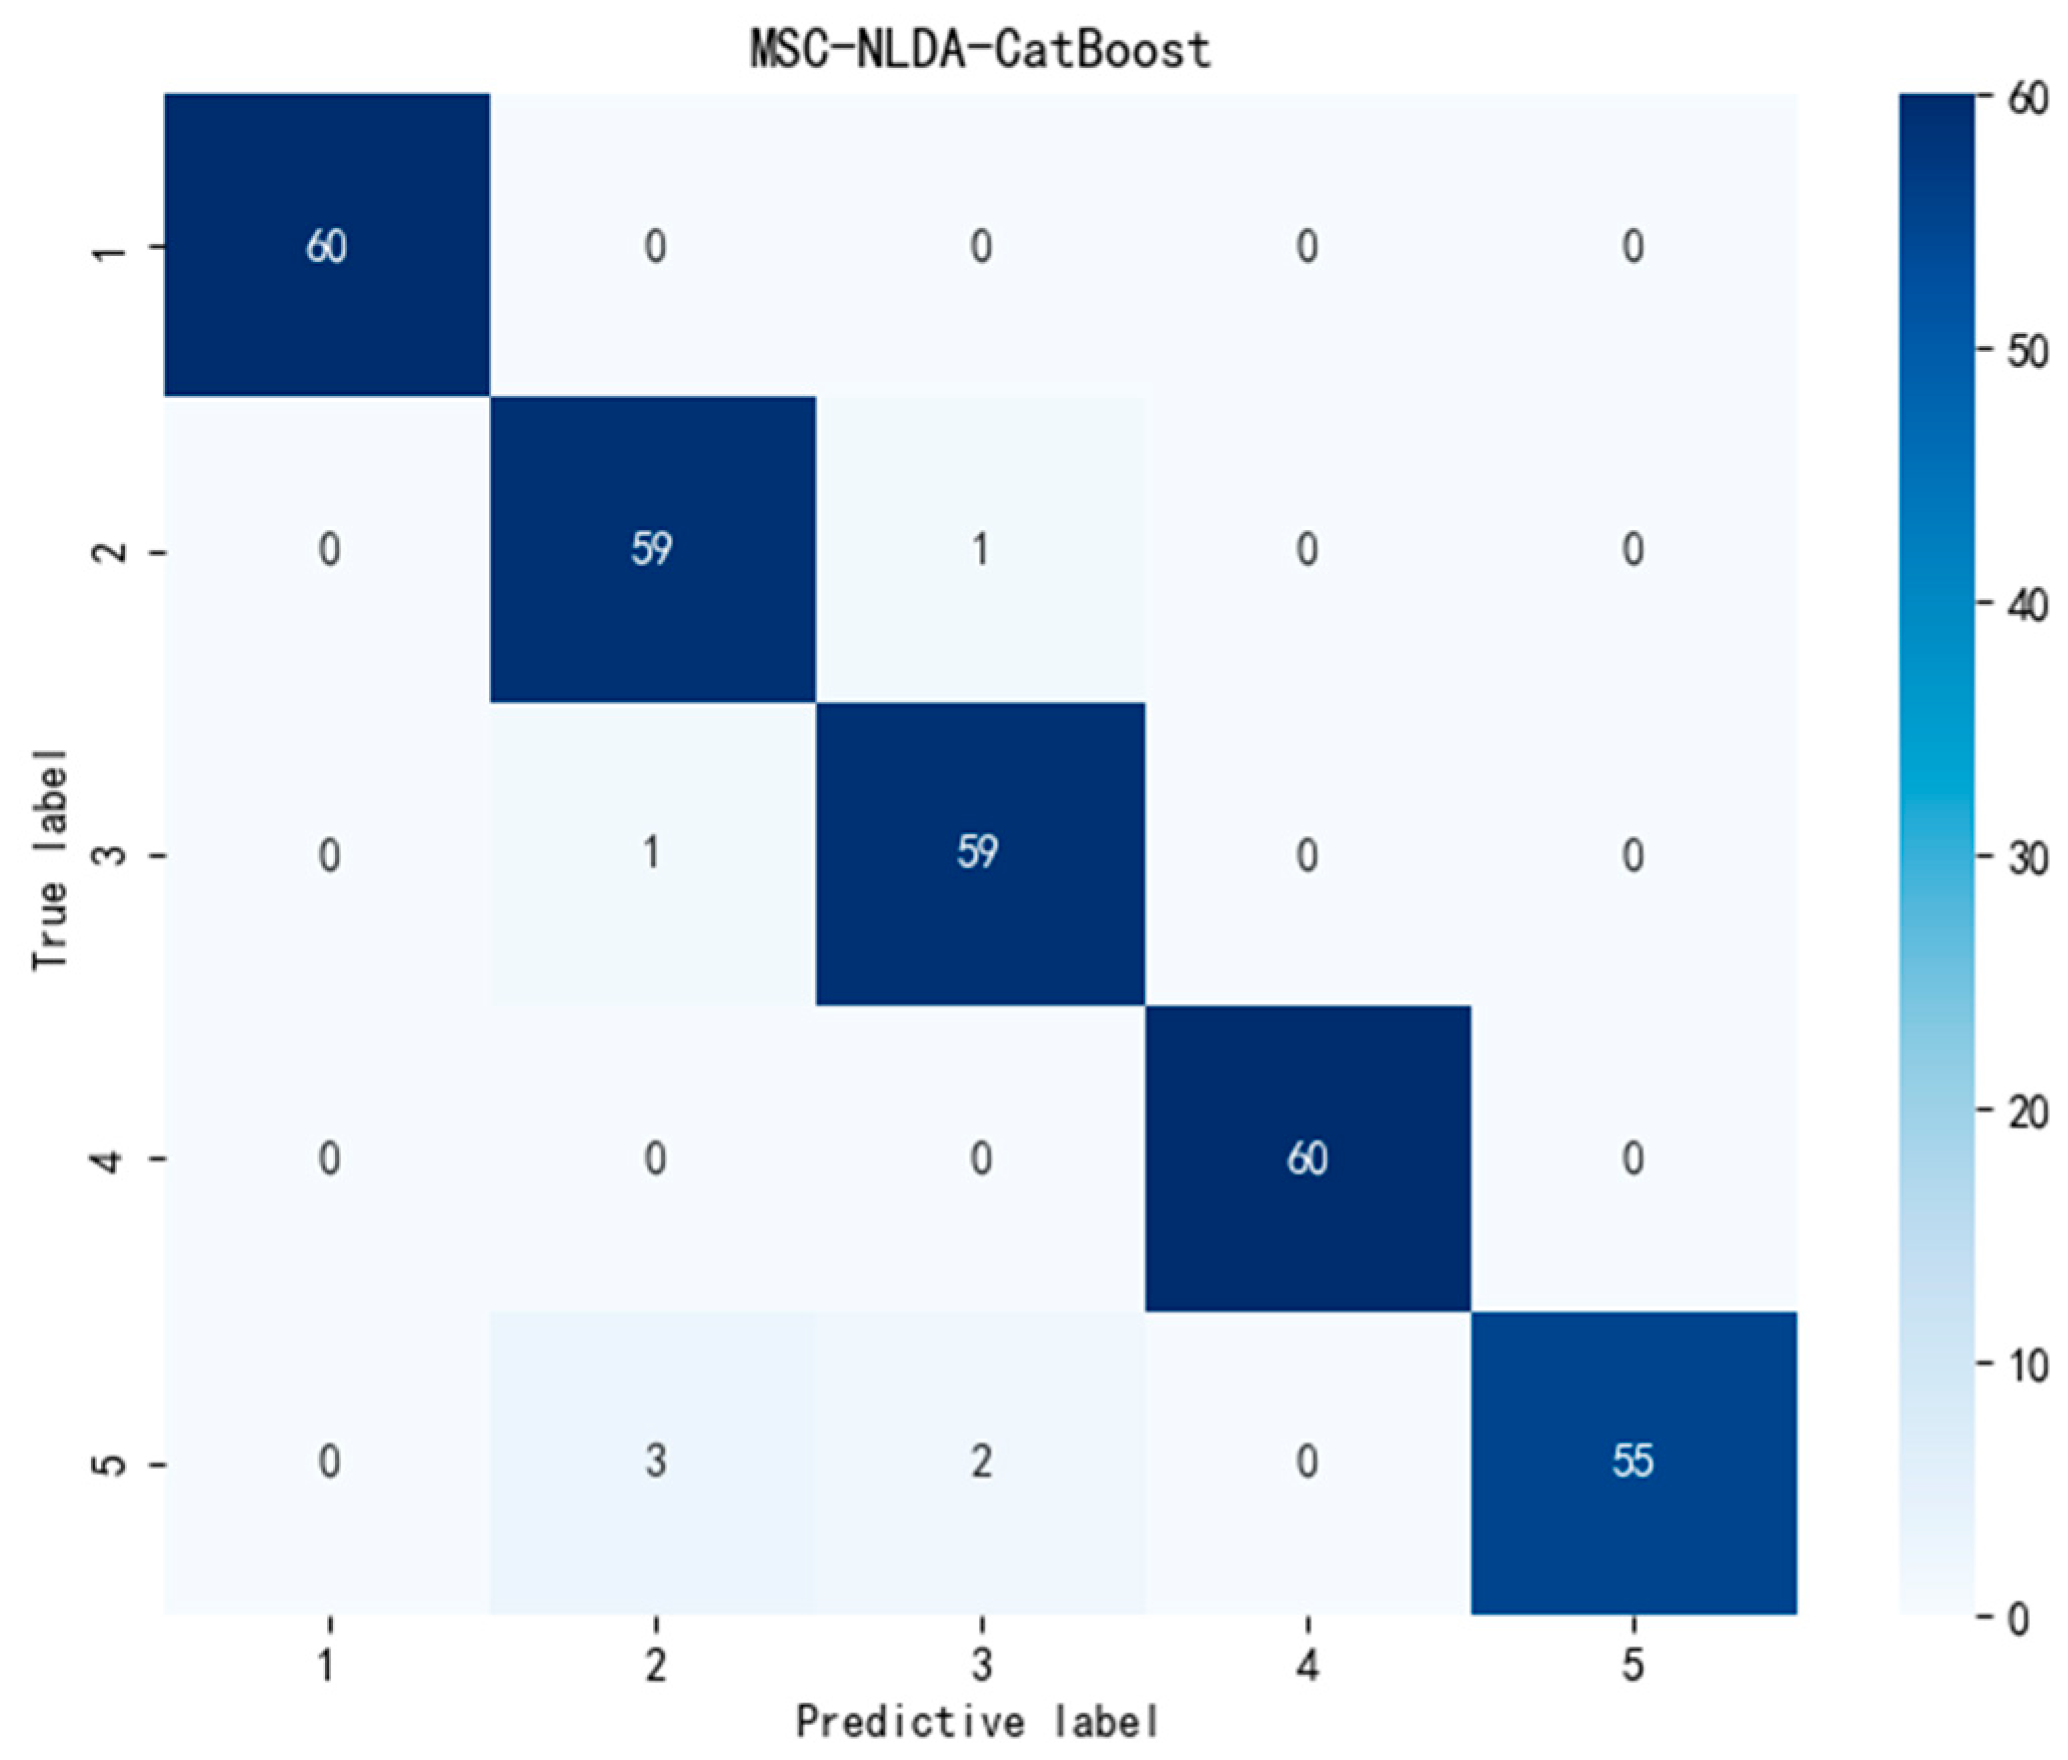
3.4.2. Classification Using CatBoost
4. Discussion
5. Conclusions
Author Contributions
Funding
Institutional Review Board Statement
Informed Consent Statement
Data Availability Statement
Conflicts of Interest
References
- Kim, M.J.; Moon, Y.Y.; Tou, J.C.; Mou, B.Q.; Waterland, N.L. Nutritional value, bioactive compounds and health benefits of lettuce (Lactuca sativa L.). J. Food Compos. Anal. 2016, 49, 19–34. [Google Scholar] [CrossRef]
- Shi, M.; Gu, J.Y.; Wu, H.J.; Rauf, A.; Emran, T.B.; Khan, Z.; Mitra, S.; Aljohani, A.S.M.; Alhumaydhi, F.A.; AlAwthan, Y.S.; et al. Phytochemicals, nutrition, metabolism, bioavailability, and health benefits in lettuce—A comprehensive review. Antioxidants 2022, 11, 1158. [Google Scholar] [CrossRef]
- Vitalis, F.; Muncan, J.; Anantawittayanon, S.; Kovacs, Z.; Tsenkova, R. Aquaphotomics monitoring of lettuce freshness during cold storage. Foods 2023, 12, 258. [Google Scholar] [CrossRef]
- Widjaja, F.; Steensma, P.; Annala, L.; Klami, A.; Kangasjärvi, S.; Lehtonen, M.; Mikkonen, K.S. Non-targeted LC-MS metabolomics reveal shifts from wound-induced enzymatic browning to lignification during extended storage of fresh-cut lettuce in modified atmosphere packaging. Curr. Res. Food Sci. 2025, 10, 100959. [Google Scholar] [CrossRef] [PubMed]
- Meng, Z.X.; Zhang, H.C.; Wang, J.; Ai, L.F.; Kang, W.J. Exploration of freshness identification method for refrigerated vegetables based on metabolomics. Metabolites 2024, 14, 665. [Google Scholar] [CrossRef] [PubMed]
- Wu, X.H.; Pan, M.H.; Wu, B.; Ji, G.; Sun, J. Discrimination of lettuce storage time using near infrared spectroscopy based on generalized fuzzy k-harmonic means clustering. Spectrosc. Spectr. Anal. 2016, 36, 1721–1725. [Google Scholar]
- Hu, C.P.; Fu, Z.M.; Xu, H.J.; Wu, B.; Sun, J. Discrimination of lettuce storage time based on near-infrared spectroscopy combined with fuzzy uncorrelated QR analysis. Spectrosc. Spectr. Anal. 2024, 44, 2268–2272. [Google Scholar]
- Zhou, Q.; Gao, Q.X.; Wang, Q.Q.; Yang, M.; Gao, X.B. Sparse discriminant PCA based on contrastive learning and class-specificity distribution. Neural Netw. 2023, 167, 775–786. [Google Scholar] [CrossRef]
- Wang, B.; Deng, J.H.; Jiang, H. Markov transition field combined with convolutional neural network improved the predictive performance of near-infrared spectroscopy models for determination of aflatoxin B1 in maize. Foods 2022, 11, 2210. [Google Scholar] [CrossRef]
- Liu, T.; He, J.R.; Yao, W.Z.; Jiang, H.; Chen, Q.S. Determination of aflatoxin B1 value in corn based on Fourier transform near-infrared spectroscopy: Comparison of optimization effect of characteristic wavelengths. LWT-Food Sci. Technol. 2022, 164, 113657. [Google Scholar] [CrossRef]
- Zhao, Y.Q.; Deng, J.H.; Chen, Q.S.; Jiang, H. Near-infrared spectroscopy based on colorimetric sensor array coupled with convolutional neural network detecting zearalenone in wheat. Food Chem. X 2024, 22, 101322. [Google Scholar] [CrossRef]
- Deng, J.H.; Chen, Z.Y.; Jiang, H.; Chen, Q.S. High-precision detection of dibutyl hydroxytoluene in edible oil via convolutional autoencoder compressed Fourier-transform near-infrared spectroscopy. Food Control 2025, 167, 110808. [Google Scholar] [CrossRef]
- Cheng, J.H.; Sun, J.; Yao, K.S.; Xu, M.; Wang, S.M.; Fu, L.H. Hyperspectral technique combined with stacking and blending ensemble learning method for detection of cadmium content in oilseed rape leaves. J. Sci. Food Agric. 2023, 103, 2690–2699. [Google Scholar] [CrossRef] [PubMed]
- Sun, J.; Yang, F.Y.; Chen, J.H.; Wang, S.M.; Fu, L.H. Nondestructive identification of soybean protein in minced chicken meat based on hyperspectral imaging and VGG16-SVM. J. Food Compos. Anal. 2024, 125, 105713. [Google Scholar] [CrossRef]
- Cheng, J.H.; Sun, J.; Yao, K.S.; Dai, C.X. Generalized and hetero two-dimensional correlation analysis of hyperspectral imaging combined with three-dimensional convolutional neural network for evaluating lipid oxidation in pork. Food Control 2023, 153, 109940. [Google Scholar] [CrossRef]
- Fu, L.H.; Sun, J.; Wang, S.M.; Xu, M.; Yao, K.S.; Cao, Y.; Tang, N.Q. Identification of maize seed varieties based on stacked sparse autoencoder and near-infrared hyperspectral imaging technology. J. Food Process Eng. 2022, 45, e14120. [Google Scholar] [CrossRef]
- Wang, K.; Wang, Z.; Xu, H.M.; Lan, Z.P.; Lin, X.Y.; Ren, J.B.; Kong, S.T. Experimental study on online detection of near-infrared spectroscopy suitable for continuous drug production. J. Drug Deliv. Sci. Technol. 2025, 104, 106528. [Google Scholar] [CrossRef]
- Vitorino, R.; Barros, A.S.; Guedes, S.; Caixeta, D.C.; Sabino-Silva, R. Diagnostic and monitoring applications using near infrared (NIR) spectroscopy in cancer and other diseases. Photodiagn. Photodyn. Ther. 2023, 42, 103633. [Google Scholar] [CrossRef] [PubMed]
- Yu, Y.F.; Wang, Z.; Gao, S.Q.; Wu, Y.F.; Yu, A.X.; Wu, F. Real-time visualization of skeletal muscle necrosis in mice and swine through NIR-II/I fluorescence imaging. J. Biophotonics 2024, 17, e202300225. [Google Scholar] [CrossRef]
- Sitnikova, M.A.; Malykh, S.B. Functional near-infrared spectroscopy applications in developmental cognitive neuroscience. Zh. Vyssh. Nerv. Deyat. 2021, 71, 485–499. [Google Scholar] [CrossRef]
- Nadimi, M.; Paliwal, J. Recent applications of near-infrared spectroscopy in food quality analysis. Foods 2024, 13, 2633. [Google Scholar] [CrossRef]
- Fodor, M.; Matkovits, A.; Benes, E.L.; Jókai, Z. The role of near-infrared spectroscopy in food quality assurance: A review of the past two decades. Foods 2024, 13, 3501. [Google Scholar] [CrossRef] [PubMed]
- Sun, J.; Nirere, A.; Dusabe, K.D.; Zhong, Y.H.; Adrien, G. Rapid and nondestructive watermelon (Citrullus lanatus) seed viability detection based on visible near-infrared hyperspectral imaging technology and machine learning algorithms. J. Food Sci. 2024, 89, 4403–4418. [Google Scholar] [CrossRef] [PubMed]
- Sun, J.; Cheng, J.H.; Xu, M.; Yao, K.S. A method for freshness detection of pork using two-dimensional correlation spectroscopy images combined with dual-branch deep learning. J. Food Compos. Anal. 2024, 129, 106144. [Google Scholar] [CrossRef]
- Cheng, J.H.; Sun, J.; Yao, K.S.; Xu, M.; Dai, C.X. Multi-task convolutional neural network for simultaneous monitoring of lipid and protein oxidative damage in frozen-thawed pork using hyperspectral imaging. Meat Sci. 2023, 201, 109196. [Google Scholar] [CrossRef]
- Neto, A.J.S.; de Lima, J.L.M.P.; Jardim, A.M.D.F.; Lopes, D.D.; da Silva, T.G.F. Discrimination of fungicide-contaminated lettuces based on maximum residue limits using spectroscopy and chemometrics. Horticulturae 2024, 10, 828. [Google Scholar] [CrossRef]
- Kasampalis, D.S.; Tsouvaltzis, P.I.; Siomos, A.S. Non-destructive detection of pesticide-treated baby leaf lettuce during production and post-harvest storage using visible and near-infrared spectroscopy. Sensors 2024, 24, 7547. [Google Scholar] [CrossRef]
- Shi, L.; Sun, J.; Zhang, B.; Wu, Z.Q.; Jia, Y.L.; Yao, K.S.; Zhou, X. Simultaneous detection for storage condition and storage time of yellow peach under different storage conditions using hyperspectral imaging with multi-target characteristic selection and multi-task mode. J. Food Compos. Anal. 2024, 135, 106647. [Google Scholar] [CrossRef]
- Yao, K.S.; Sun, J.; Cheng, J.H.; Xu, M.; Chen, C.; Zhou, X. Nondestructive detection of S-ovalbumin content in eggs using portable NIR spectrometer and MPA-CARS. J. Food Process Eng. 2023, 46, e14186. [Google Scholar] [CrossRef]
- Ding, Y.H.; Yan, Y.L.; Li, J.; Chen, X.; Jiang, H. Classification of tea quality levels using near-infrared spectroscopy based on CLPSO-SVM. Foods 2022, 11, 1658. [Google Scholar] [CrossRef]
- Lanjewar, M.G.; Morajkar, P.P.; Parab, J.S. Portable system to detect starch adulteration in turmeric using NIR spectroscopy. Food Control 2024, 155, 110095. [Google Scholar] [CrossRef]
- Jiang, H.; Wang, Z.Y.; Deng, J.H.; Ding, Z.D.; Chen, Q.S. Quantitative detection of heavy metal Cd in vegetable oils: A nondestructive method based on Raman spectroscopy combined with chemometrics. J. Food Sci. 2024, 89, 8054–8065. [Google Scholar] [CrossRef]
- Zhou, X.; Zhao, C.J.; Sun, J.; Cao, Y.; Yao, K.S.; Xu, M. A deep learning method for predicting lead content in oilseed rape leaves using fluorescence hyperspectral imaging. Food Chem. 2023, 409, 135251. [Google Scholar] [CrossRef] [PubMed]
- Nirere, A.; Sun, J.; Kama, R.; Atindana, V.A.; Nikubwimana, F.D.; Dusabe, K.D.; Zhong, Y.H. Nondestructive detection of adulterated wolfberry (Lycium Chinense) fruits based on hyperspectral imaging technology. J. Food Process Eng. 2023, 46, e14293. [Google Scholar] [CrossRef]
- Kong, L.F.; Wu, C.Z.; Li, H.L.; Yuan, M.A.; Sun, T. Discrimination of tea seed oil adulteration based on near-infrared spectroscopy and combined preprocessing method. J. Food Compos. Anal. 2024, 134, 106560. [Google Scholar] [CrossRef]
- Huang, H.W.; Fang, Z.L.; Xu, Y.L.; Lu, G.S.; Feng, C.; Zeng, M.; Tian, J.J.; Ping, Y.F.; Han, Z.L.; Zhao, Z.G. Stacking and ridge regression-based spectral ensemble preprocessing method and its application in near-infrared spectral analysis. Talanta 2024, 276, 126242. [Google Scholar] [CrossRef]
- Zhong, Y.H.; Sun, J.; Yao, K.S.; Cheng, J.H.; Du, X.J. Detection of rice (with husk) moisture content based on hyperspectral imaging technology combined with MSLPP-ESMA-SVR model. J. Food Saf. 2024, 44, e13112. [Google Scholar] [CrossRef]
- Tangorra, F.M.; Lopez, A.; Ighina, E.; Bellagamba, F.; Moretti, V.M. Handheld NIR spectroscopy combined with a hybrid LDA-SVM model for fast classification of retail milk. Foods 2024, 13, 3577. [Google Scholar] [CrossRef]
- Sharma, A.; Paliwal, K.K. Linear discriminant analysis for the small sample size problem: An overview. Int. J. Mach. Learn. Cybern. 2015, 6, 443–454. [Google Scholar] [CrossRef]
- Paliwal, K.K.; Sharma, A. Approximate LDA technique for dimensionality reduction in the small sample size case. J. Pattern Recognit. Res. 2011, 6, 298–306. [Google Scholar]
- Wu, X.H.; Yang, Z.T.; Yang, Y.L.; Wu, B.; Sun, J. Geographical origin identification of Chinese red jujube using near-infrared spectroscopy and Adaboost-CLDA. Foods 2025, 14, 803. [Google Scholar] [CrossRef] [PubMed]
- Zhu, R.; Wu, X.H.; Wu, B.; Gao, J.X. High-accuracy classification and origin traceability of peanut kernels based on near-infrared (NIR) spectroscopy using Adaboost—Maximum uncertainty linear discriminant analysis. Curr. Res. Food Sci. 2024, 8, 100766. [Google Scholar] [CrossRef] [PubMed]
- Chen, L.F.; Liao, H.Y.M.; Ko, M.T.; Lin, J.C.; Yu, G.J. A new LDA—Based face recognition system which can solve the small sample size problem. Pattern Recognit. 2000, 33, 1713–1726. [Google Scholar] [CrossRef]
- Hansen, L.; Ferrao, M.F. Classification of milk samples using CART. Food Anal. Methods 2020, 13, 13–20. [Google Scholar] [CrossRef]
- Gao, L.T.; Zhang, L.L.; Chen, J.; Peng, L.; Guo, L.J.L.; Yang, L.N. Autoencoder-CatBoost model for accurate hyperspectral quality assessment of yunling snowflake beef. IEEE Access 2024, 12, 184701–184713. [Google Scholar] [CrossRef]
- Torniainen, J.; Afara, I.O.; Prakash, M.; Sarin, J.K.; Stenroth, L.; Töyräs, J. Open-source python module for automated preprocessing of near infrared spectroscopic data. Anal. Chim. Acta. 2020, 1108, 1–9. [Google Scholar] [CrossRef]
- Zhang, Y.Z.; Wang, Y.A.; Zhao, Z.; Zhang, L.; Xiao, H. Improved prediction of oxide content in cement raw meal by near-infrared spectroscopy using sequential preprocessing through orthogonalization (SPORT). Anal. Lett. 2024, 57, 1678–1688. [Google Scholar] [CrossRef]
- de Almeida, V.E.; Fernandes, D.D.D.; Diniz, P.H.G.D.; Gomes, A.D.; Véras, G.; Galvao, R.K.H.; Araujo, M.C.U. Scores selection via Fisher’s discriminant power in PCA-LDA to improve the classification of food data. Food Chem. 2021, 363, 130296. [Google Scholar] [CrossRef]
- Huang, N.T.; Peng, H.; Cai, G.W.; Chen, J.K. Power quality disturbances feature selection and recognition using optimal multi-resolution fast S-transform and CART algorithm. Energies 2016, 9, 927. [Google Scholar] [CrossRef]
- Hancock, J.T.; Khoshgoftaar, T.M. CatBoost for big data: An interdisciplinary review. J. Big Data 2020, 7, 94. [Google Scholar] [CrossRef]
- Castro, R.C.; Ribeiro, D.S.M.; Santos, J.L.M.; Páscoa, R.N.M.J. Near infrared spectroscopy coupled to MCR-ALS for the identification and quantification of saffron adulterants: Application to complex mixtures. Food Control 2020, 123, 107776. [Google Scholar] [CrossRef]
- Wang, Q.Y.; Li, F.S.; Xu, M.Q.; Zhang, L.J. Research on geological mineral identification based on near infrared spectroscopy. Fresenius Environ. Bull. 2021, 29, 6936–6943. [Google Scholar]
- Pu, Y.Y.; O’Donnell, C.; Tobin, J.T.; O’Shea, N. Review of near-infrared spectroscopy as a process analytical technology for real-time product monitoring in dairy processing. Int. Dairy J. 2020, 103, 104623. [Google Scholar] [CrossRef]
- Tusek, A.J.; Benkovic, M.; Malesic, E.; Maric, L.; Jurina, T.; Kljusuric, J.G.; Valinger, D. Rapid quantification of dissolved solids and bioactives in dried root vegetable extracts using near infrared spectroscopy. Spectrochim. Acta Part A 2021, 261, 120074. [Google Scholar] [CrossRef]
- Kim, N.; Jang, M.; Jo, J.; Park, J.; Kim, A.; Hwang, I. Application of energy dispersive X-ray fluorescence spectrometry and near-infrared reflectance spectroscopy combined with multivariate statistical analysis for discriminating the geographical origin of soybeans. Food Control 2022, 140, 109140. [Google Scholar] [CrossRef]


| Feature Processing | SG | SNV | MSC | MSC + SG | SNV + SG | SNV + MSC |
|---|---|---|---|---|---|---|
| ALDA | 54 | 33.67 | 35.67 | 54 | 56.33 | 35.67 |
| CLDA | 47.67 | 83 | 82.33 | 47.67 | 48.67 | 82.33 |
| MLDA | 46 | 36 | 37.33 | 60.33 | 60 | 37.33 |
| NLDA | 89.67 | 91 | 88 | 74.67 | 75.33 | 89.67 |
| Average accuracy rate | 59.34 | 60.92 | 60.83 | 59.17 | 60.08 | 61.25 |
| Feature Processing | SG | SNV | MSC | MSC + SG | SNV + SG | SNV + MSC |
|---|---|---|---|---|---|---|
| ALDA | 56.33 | 37.33 | 38.67 | 58.33 | 55.67 | 38.67 |
| CLDA | 59 | 95.67 | 96.67 | 62.33 | 60.33 | 95.33 |
| MLDA | 53 | 51.33 | 46.67 | 64.67 | 63 | 46.33 |
| NLDA | 95.33 | 96 | 97.67 | 86.67 | 86 | 95.33 |
| Average accuracy rate | 65.92 | 70.08 | 69.92 | 68 | 66.25 | 68.92 |
| Evaluation Indicators | Accuracy Rate (%) | Precision (%) | Recall (%) | F1 Score | Standard Deviation |
|---|---|---|---|---|---|
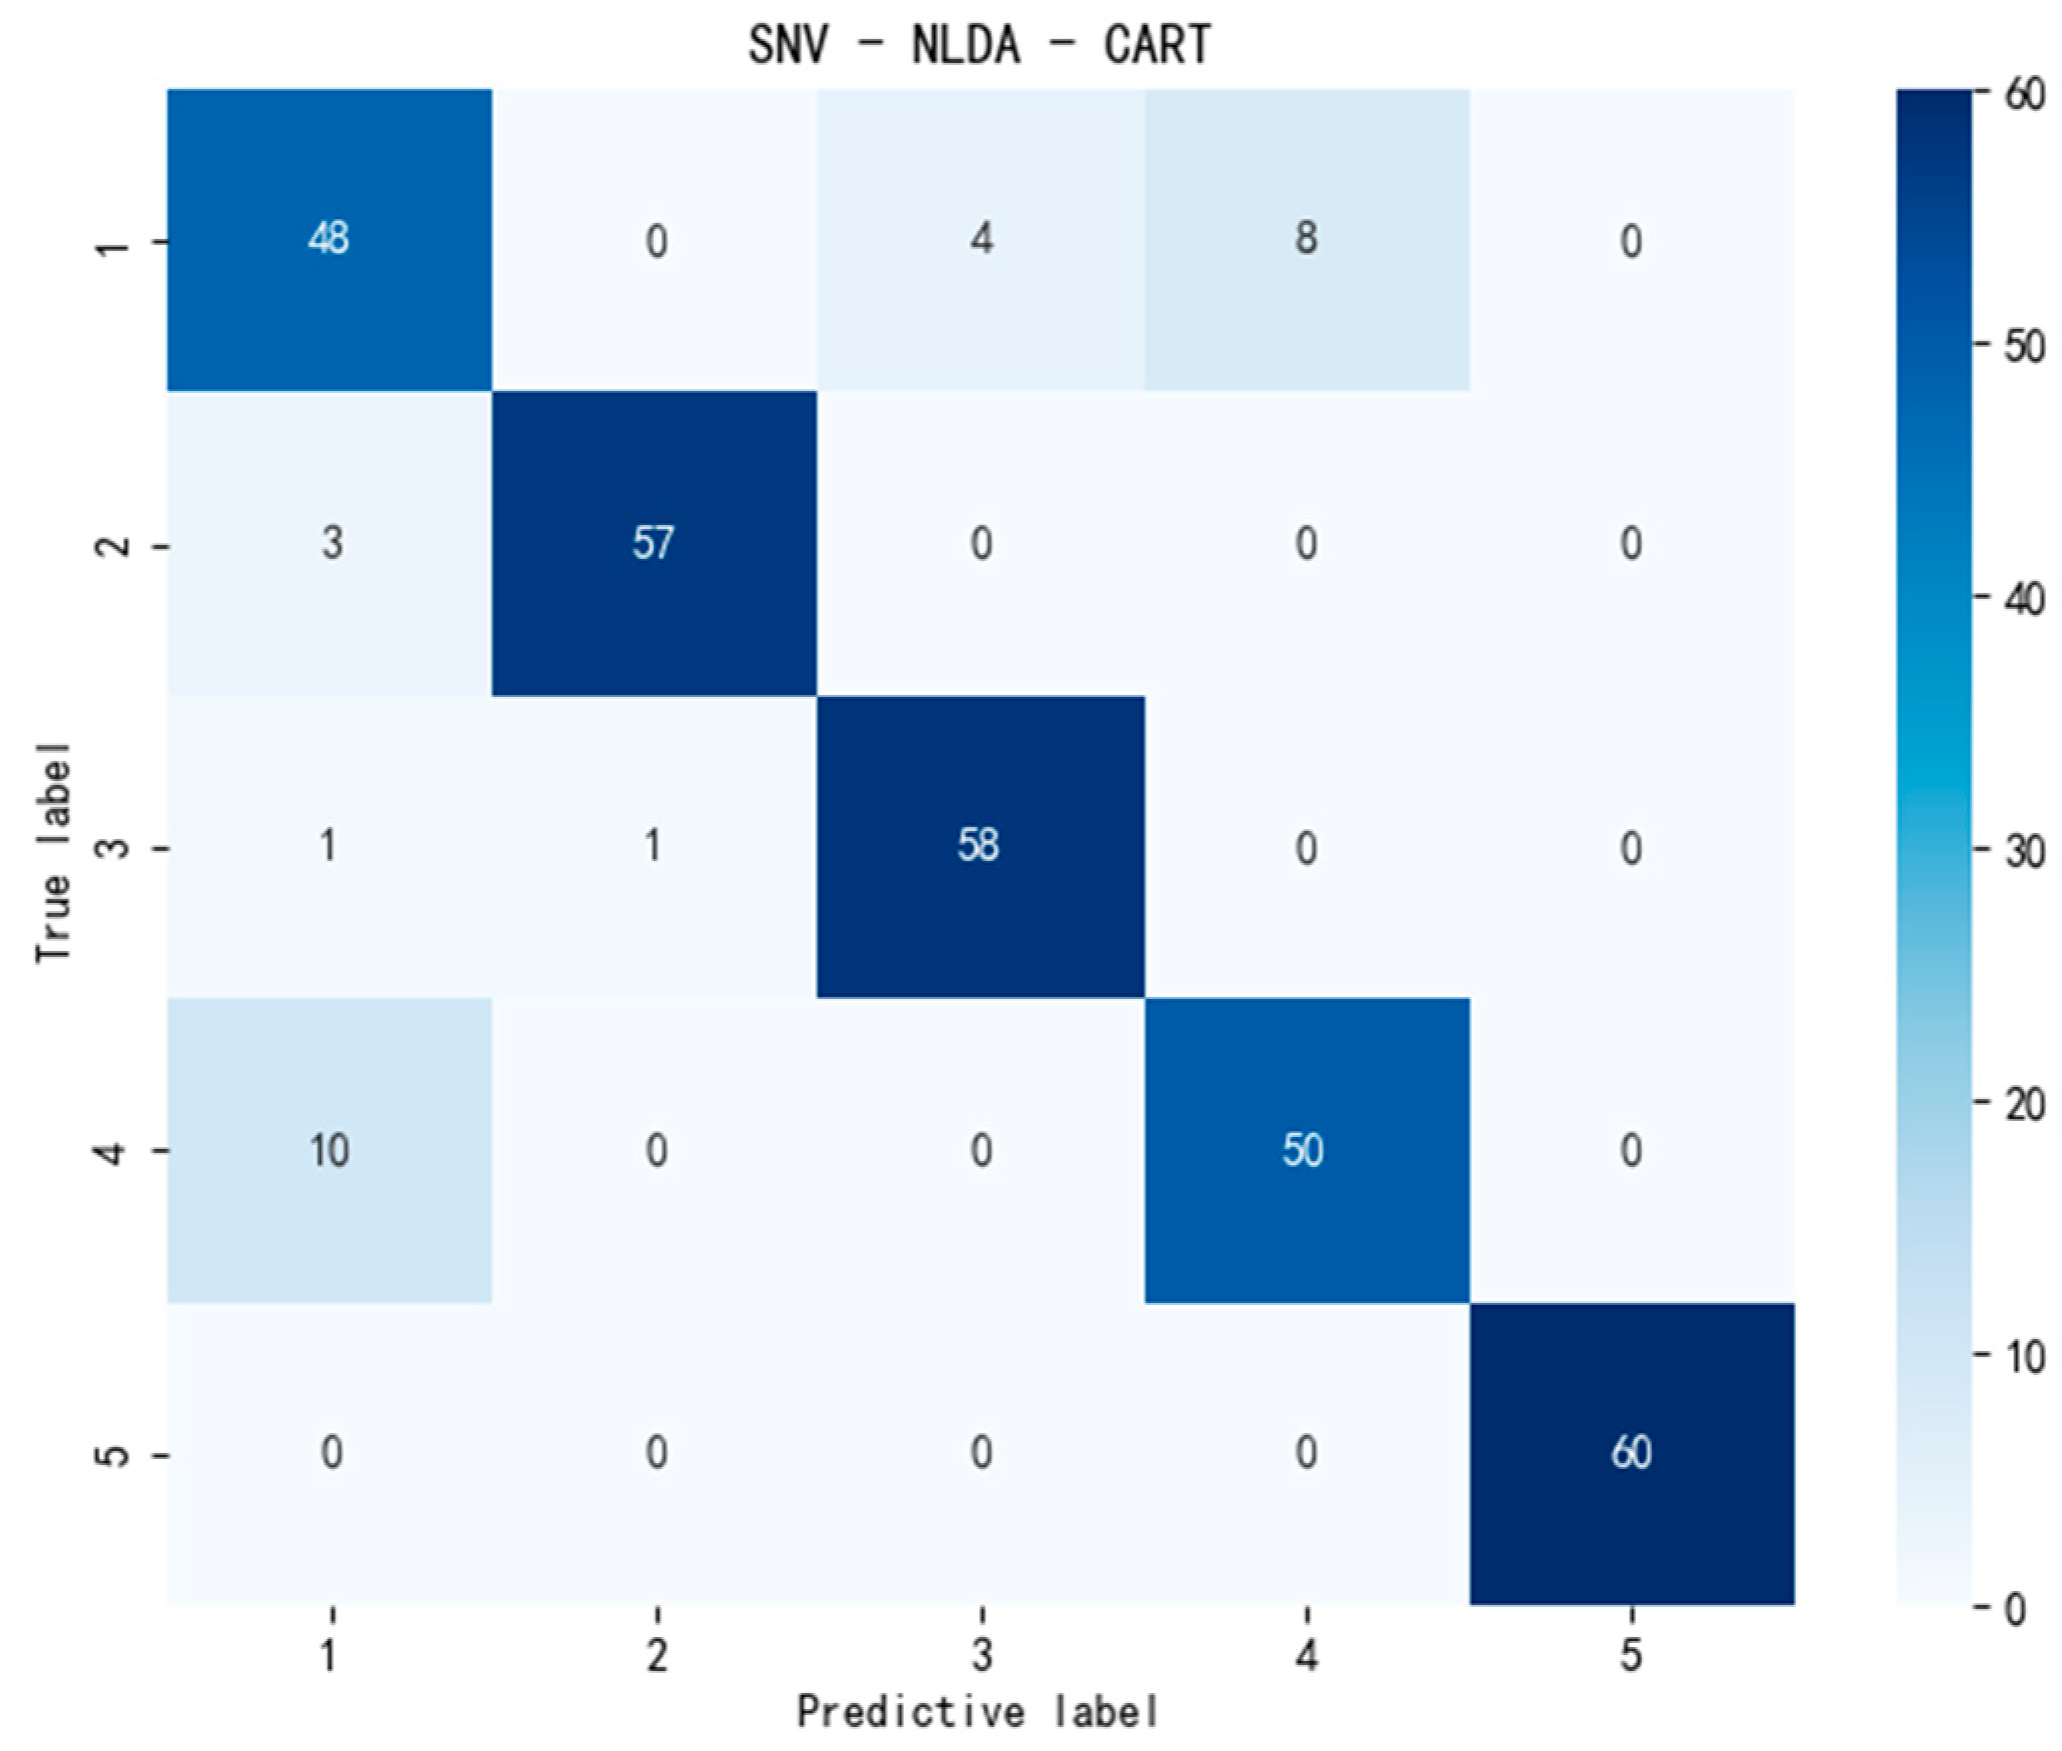
| SNV-NLDA-CART | 91 | 91.74 | 91 | 0.9088 | 0.0389 |
| MSC-NLDA-CatBoost | 97.67 | 97.84 | 97.67 | 0.9766 | 0.017 |
| Stage | Method |
|---|---|
| Preprocessing | multiplicative scatter correction |
| Feature extraction | null-space linear discriminant analysis |
| Classification | categorical boosting |
| Feature Processing | SG | SNV | MSC | MSC + SG | SNV + SG | SNV + MSC |
|---|---|---|---|---|---|---|
| ALDA | 53.67 | 45 | 45 | 71 | 64.67 | 39.33 |
| CLDA | 41.67 | 27 | 26.33 | 48.33 | 43.67 | 31.67 |
| MLDA | 50.67 | 39.33 | 38.33 | 72 | 65.33 | 36.67 |
| NLDA | 0 | 0 | 0 | 0 | 0 | 0 |
| Average accuracy rate | 36.5 | 27.83 | 27.42 | 47.83 | 43.42 | 26.92 |
Disclaimer/Publisher’s Note: The statements, opinions and data contained in all publications are solely those of the individual author(s) and contributor(s) and not of MDPI and/or the editor(s). MDPI and/or the editor(s) disclaim responsibility for any injury to people or property resulting from any ideas, methods, instructions or products referred to in the content. |
© 2025 by the authors. Licensee MDPI, Basel, Switzerland. This article is an open access article distributed under the terms and conditions of the Creative Commons Attribution (CC BY) license (https://creativecommons.org/licenses/by/4.0/).
Share and Cite
Zhou, X.; Wu, X.; Cao, Z.; Wu, B. Combining Feature Extraction Methods and Categorical Boosting to Discriminate the Lettuce Storage Time Using Near-Infrared Spectroscopy. Foods 2025, 14, 1601. https://doi.org/10.3390/foods14091601
Zhou X, Wu X, Cao Z, Wu B. Combining Feature Extraction Methods and Categorical Boosting to Discriminate the Lettuce Storage Time Using Near-Infrared Spectroscopy. Foods. 2025; 14(9):1601. https://doi.org/10.3390/foods14091601
Chicago/Turabian StyleZhou, Xuan, Xiaohong Wu, Zhihang Cao, and Bin Wu. 2025. "Combining Feature Extraction Methods and Categorical Boosting to Discriminate the Lettuce Storage Time Using Near-Infrared Spectroscopy" Foods 14, no. 9: 1601. https://doi.org/10.3390/foods14091601
APA StyleZhou, X., Wu, X., Cao, Z., & Wu, B. (2025). Combining Feature Extraction Methods and Categorical Boosting to Discriminate the Lettuce Storage Time Using Near-Infrared Spectroscopy. Foods, 14(9), 1601. https://doi.org/10.3390/foods14091601