
Effect of Elaeagnus angustifolia Honey in the Protection Against Ethanol-Induced Chronic Gastric Injury via Counteracting Oxidative Stress, Interfering with Inflammation and Regulating Gut Microbiota in Mice

 , and
, and
Abstract
1. Introduction
2. Materials and Methods
2.1. Chemicals and Materials
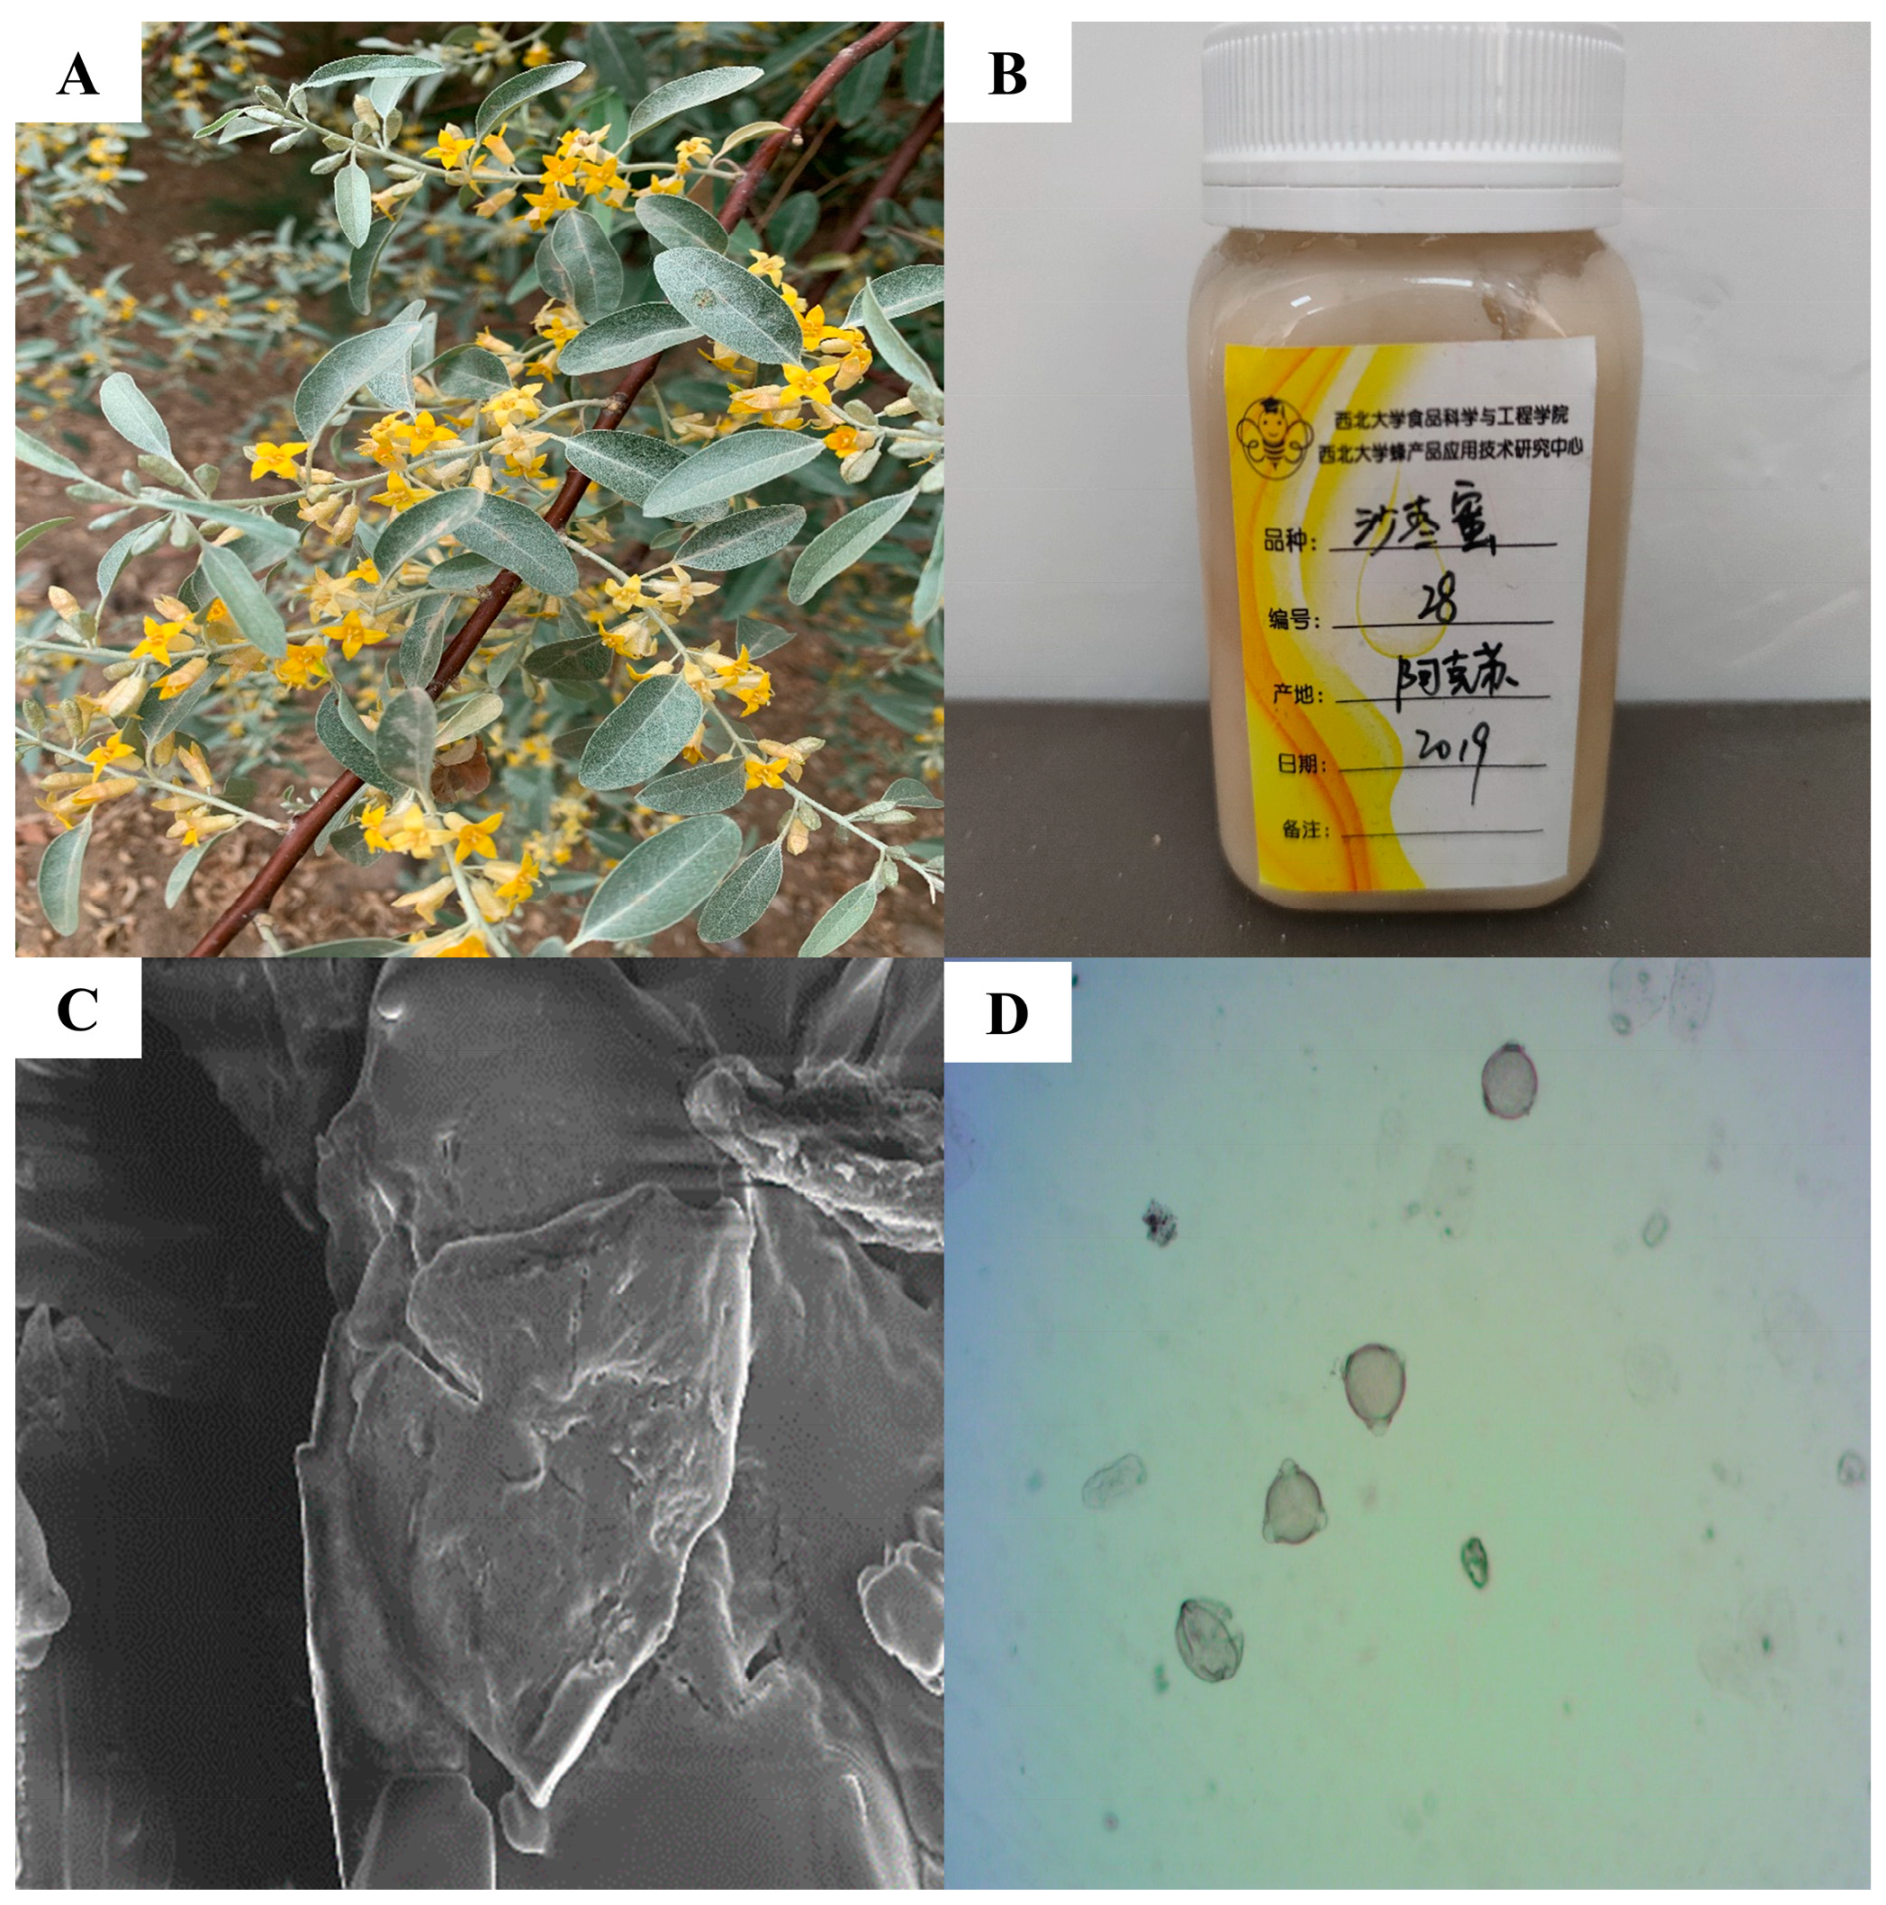
2.2. Physicochemical Parameters of EAH
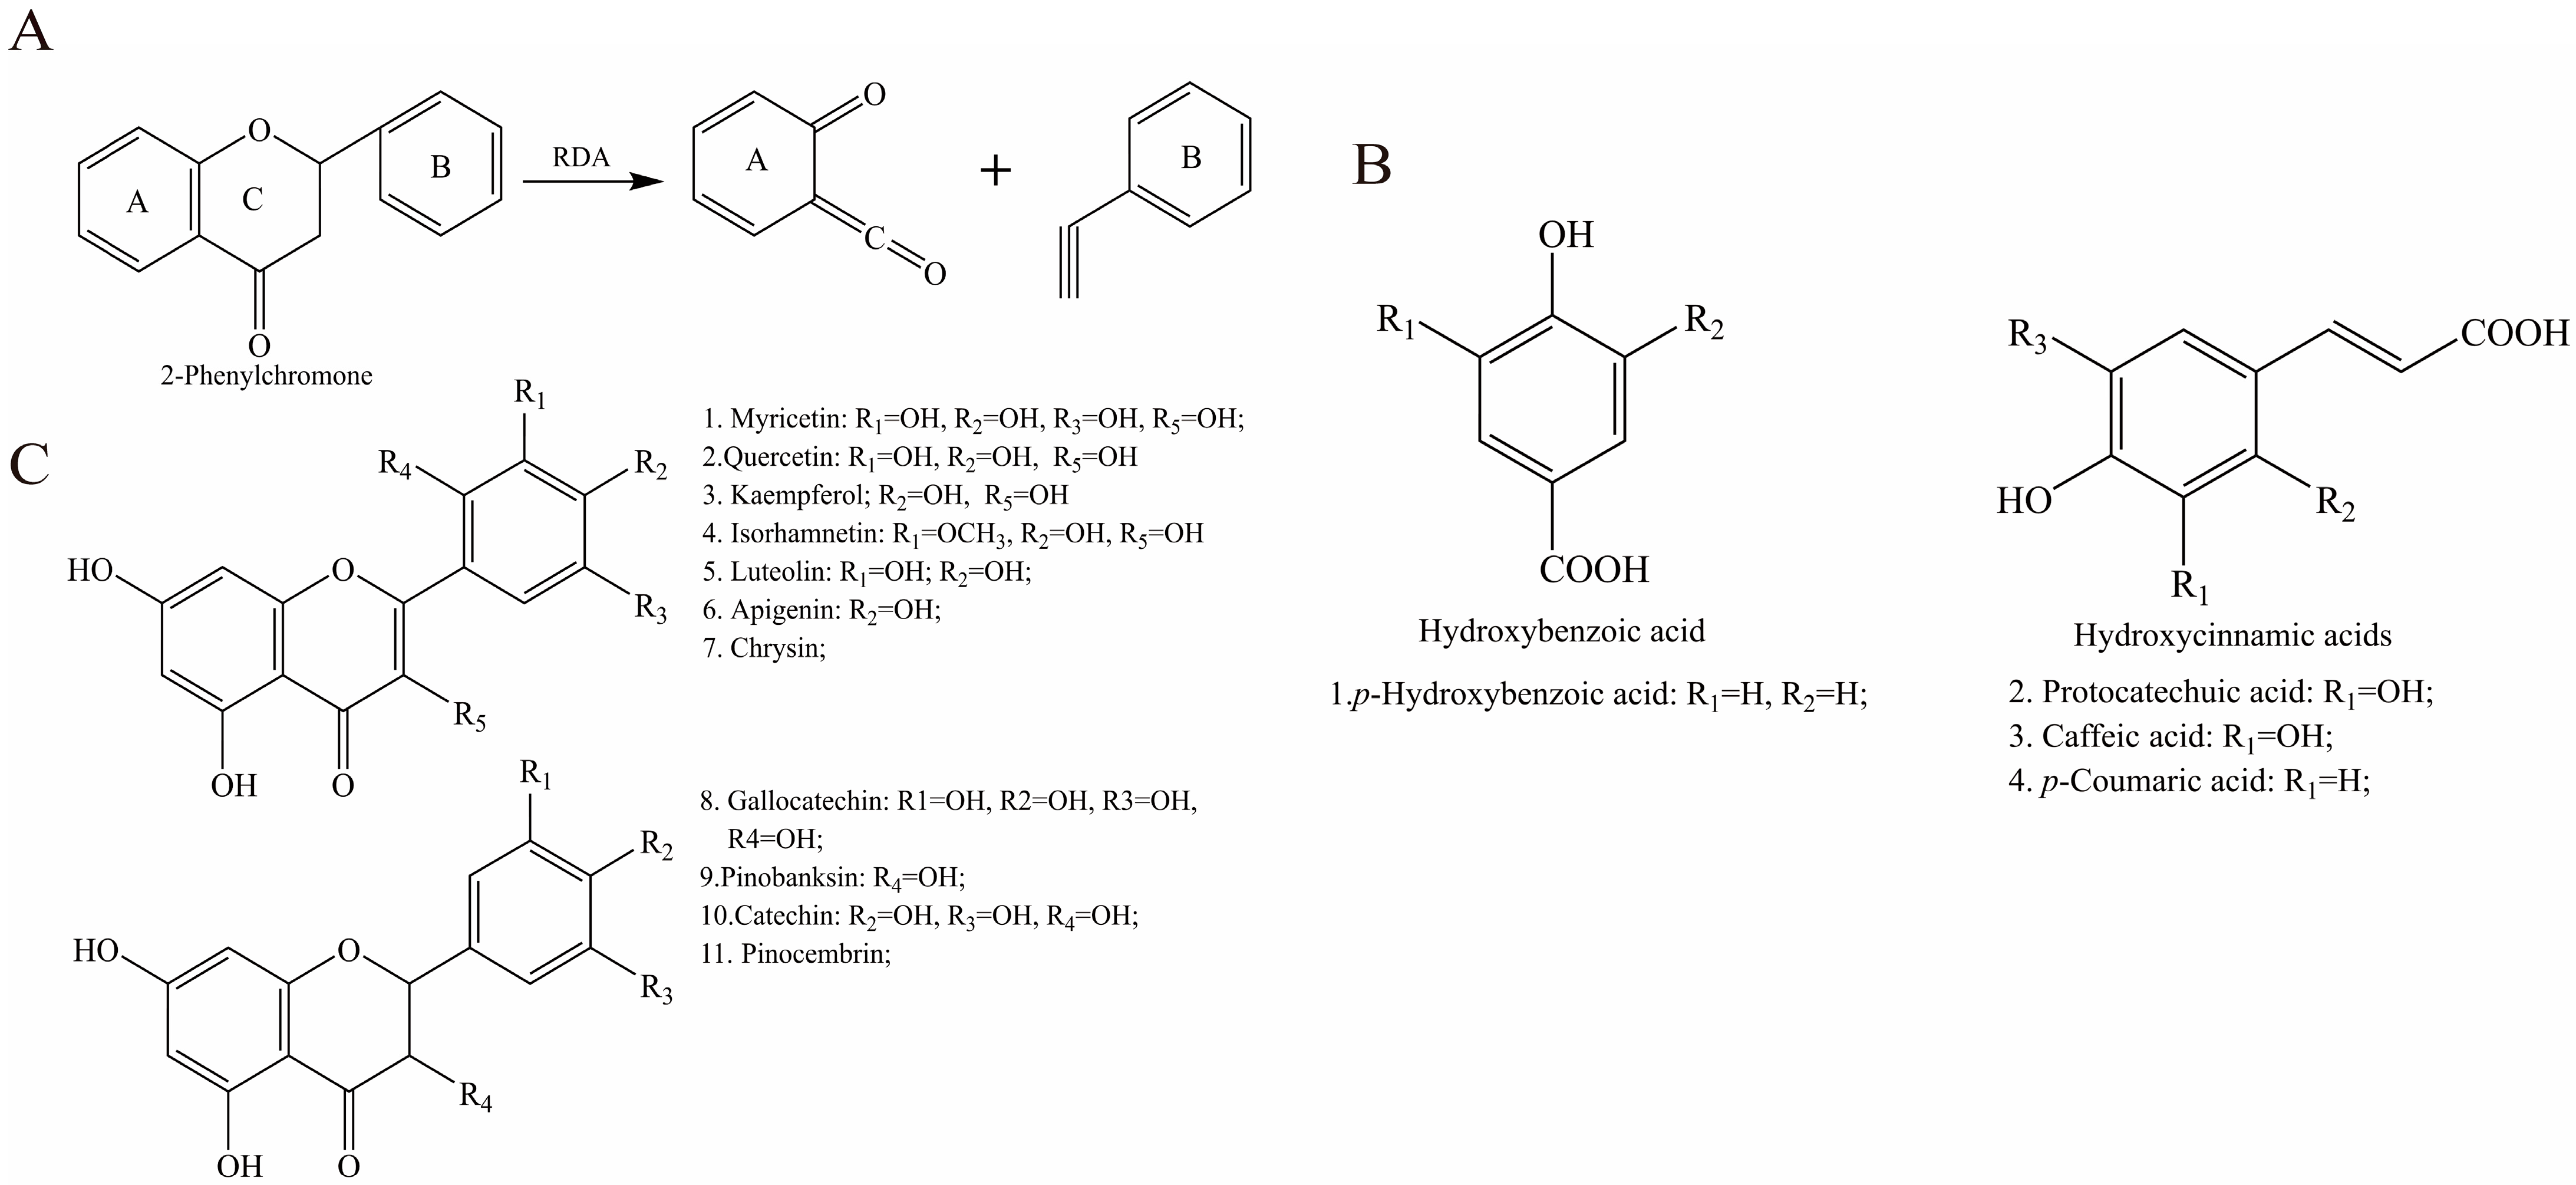
2.3. Characterization and Quantification of Phenolic Compounds in EAH
2.4. Animal Experiments
2.5. Histopathological Analysis of Gastric Tissue
2.6. Measurement of Inflammatory Mediators and Gene Expression Analysis
2.7. Western Blot Analysis
2.8. Gut Microbiota Analysis via 16S Sequencing
2.9. Statistical Analysis
3. Results
3.1. Characteristic Bioactive Components in EAH
3.2. Effect of EAH on Gastric Histological Status
3.2.1. Macroscopic Evaluation of Gastric Lesions
3.2.2. Histological Assessment of Gastric Lesions
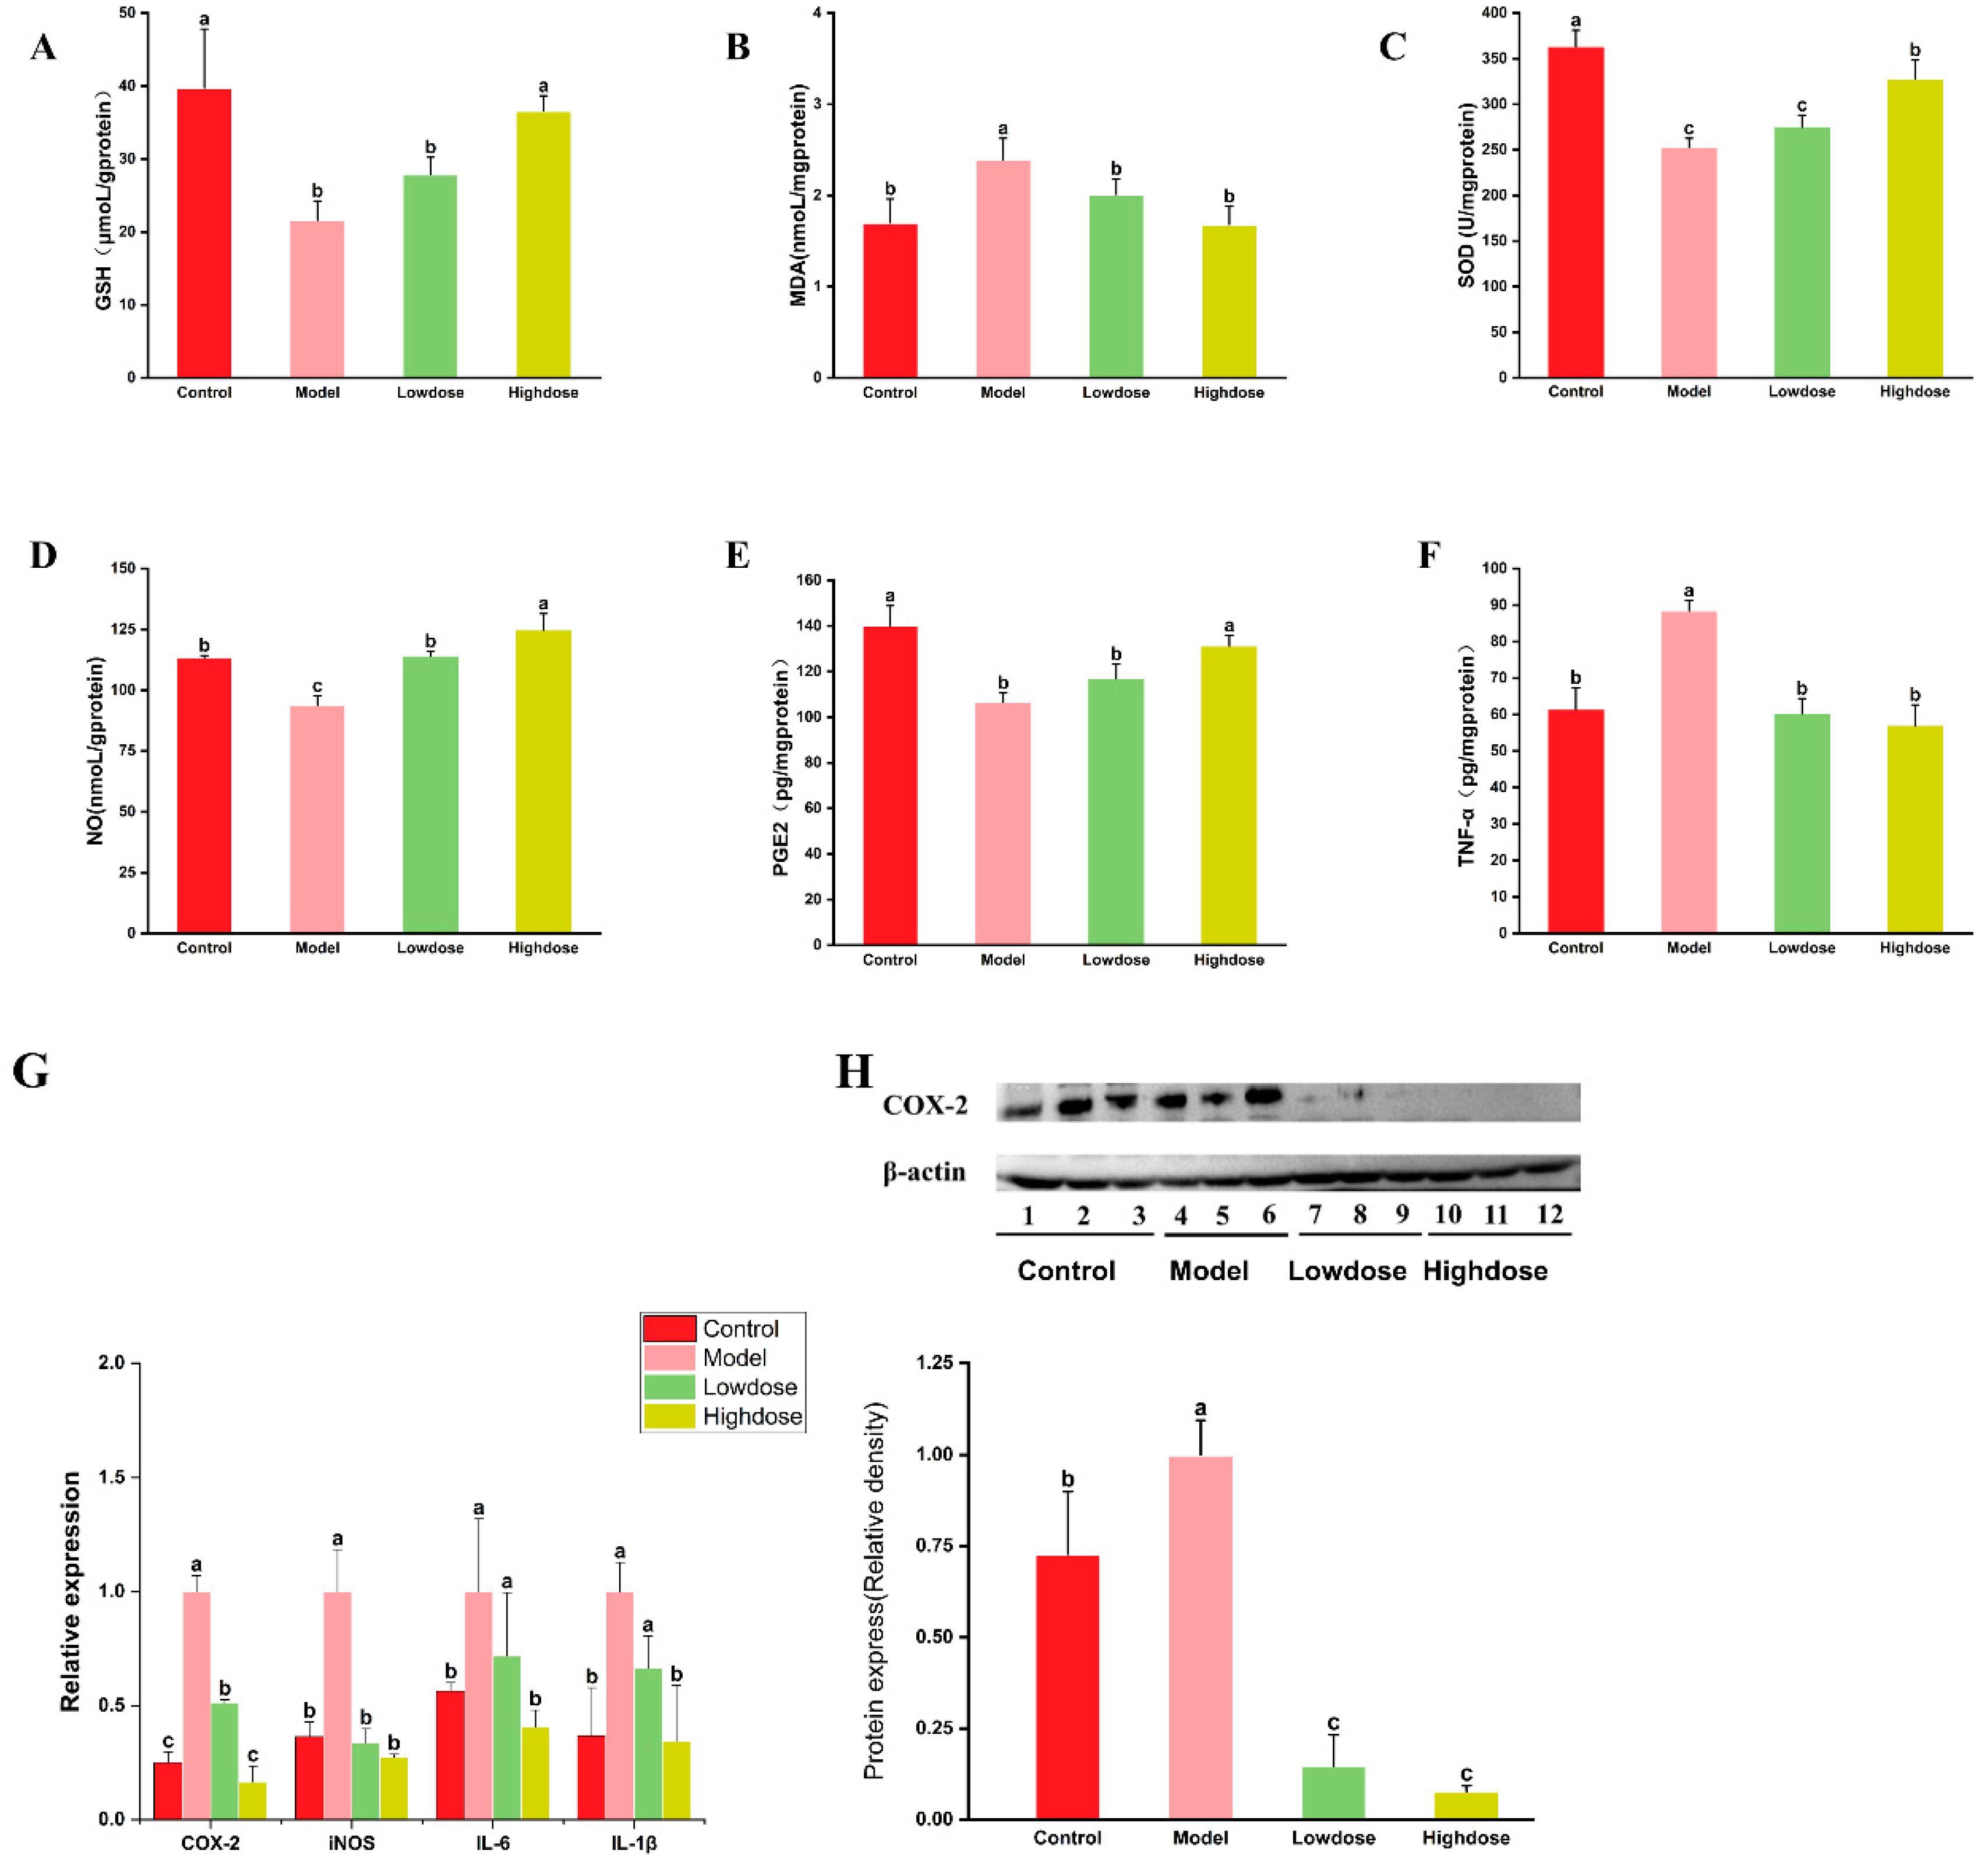
3.3. Effects of EAH on Antioxidant Enzyme Activity and Oxidative Stress
3.4. Effects of EAH on Inflammatory Markers Levels and Inflammatory Cytokine Expression
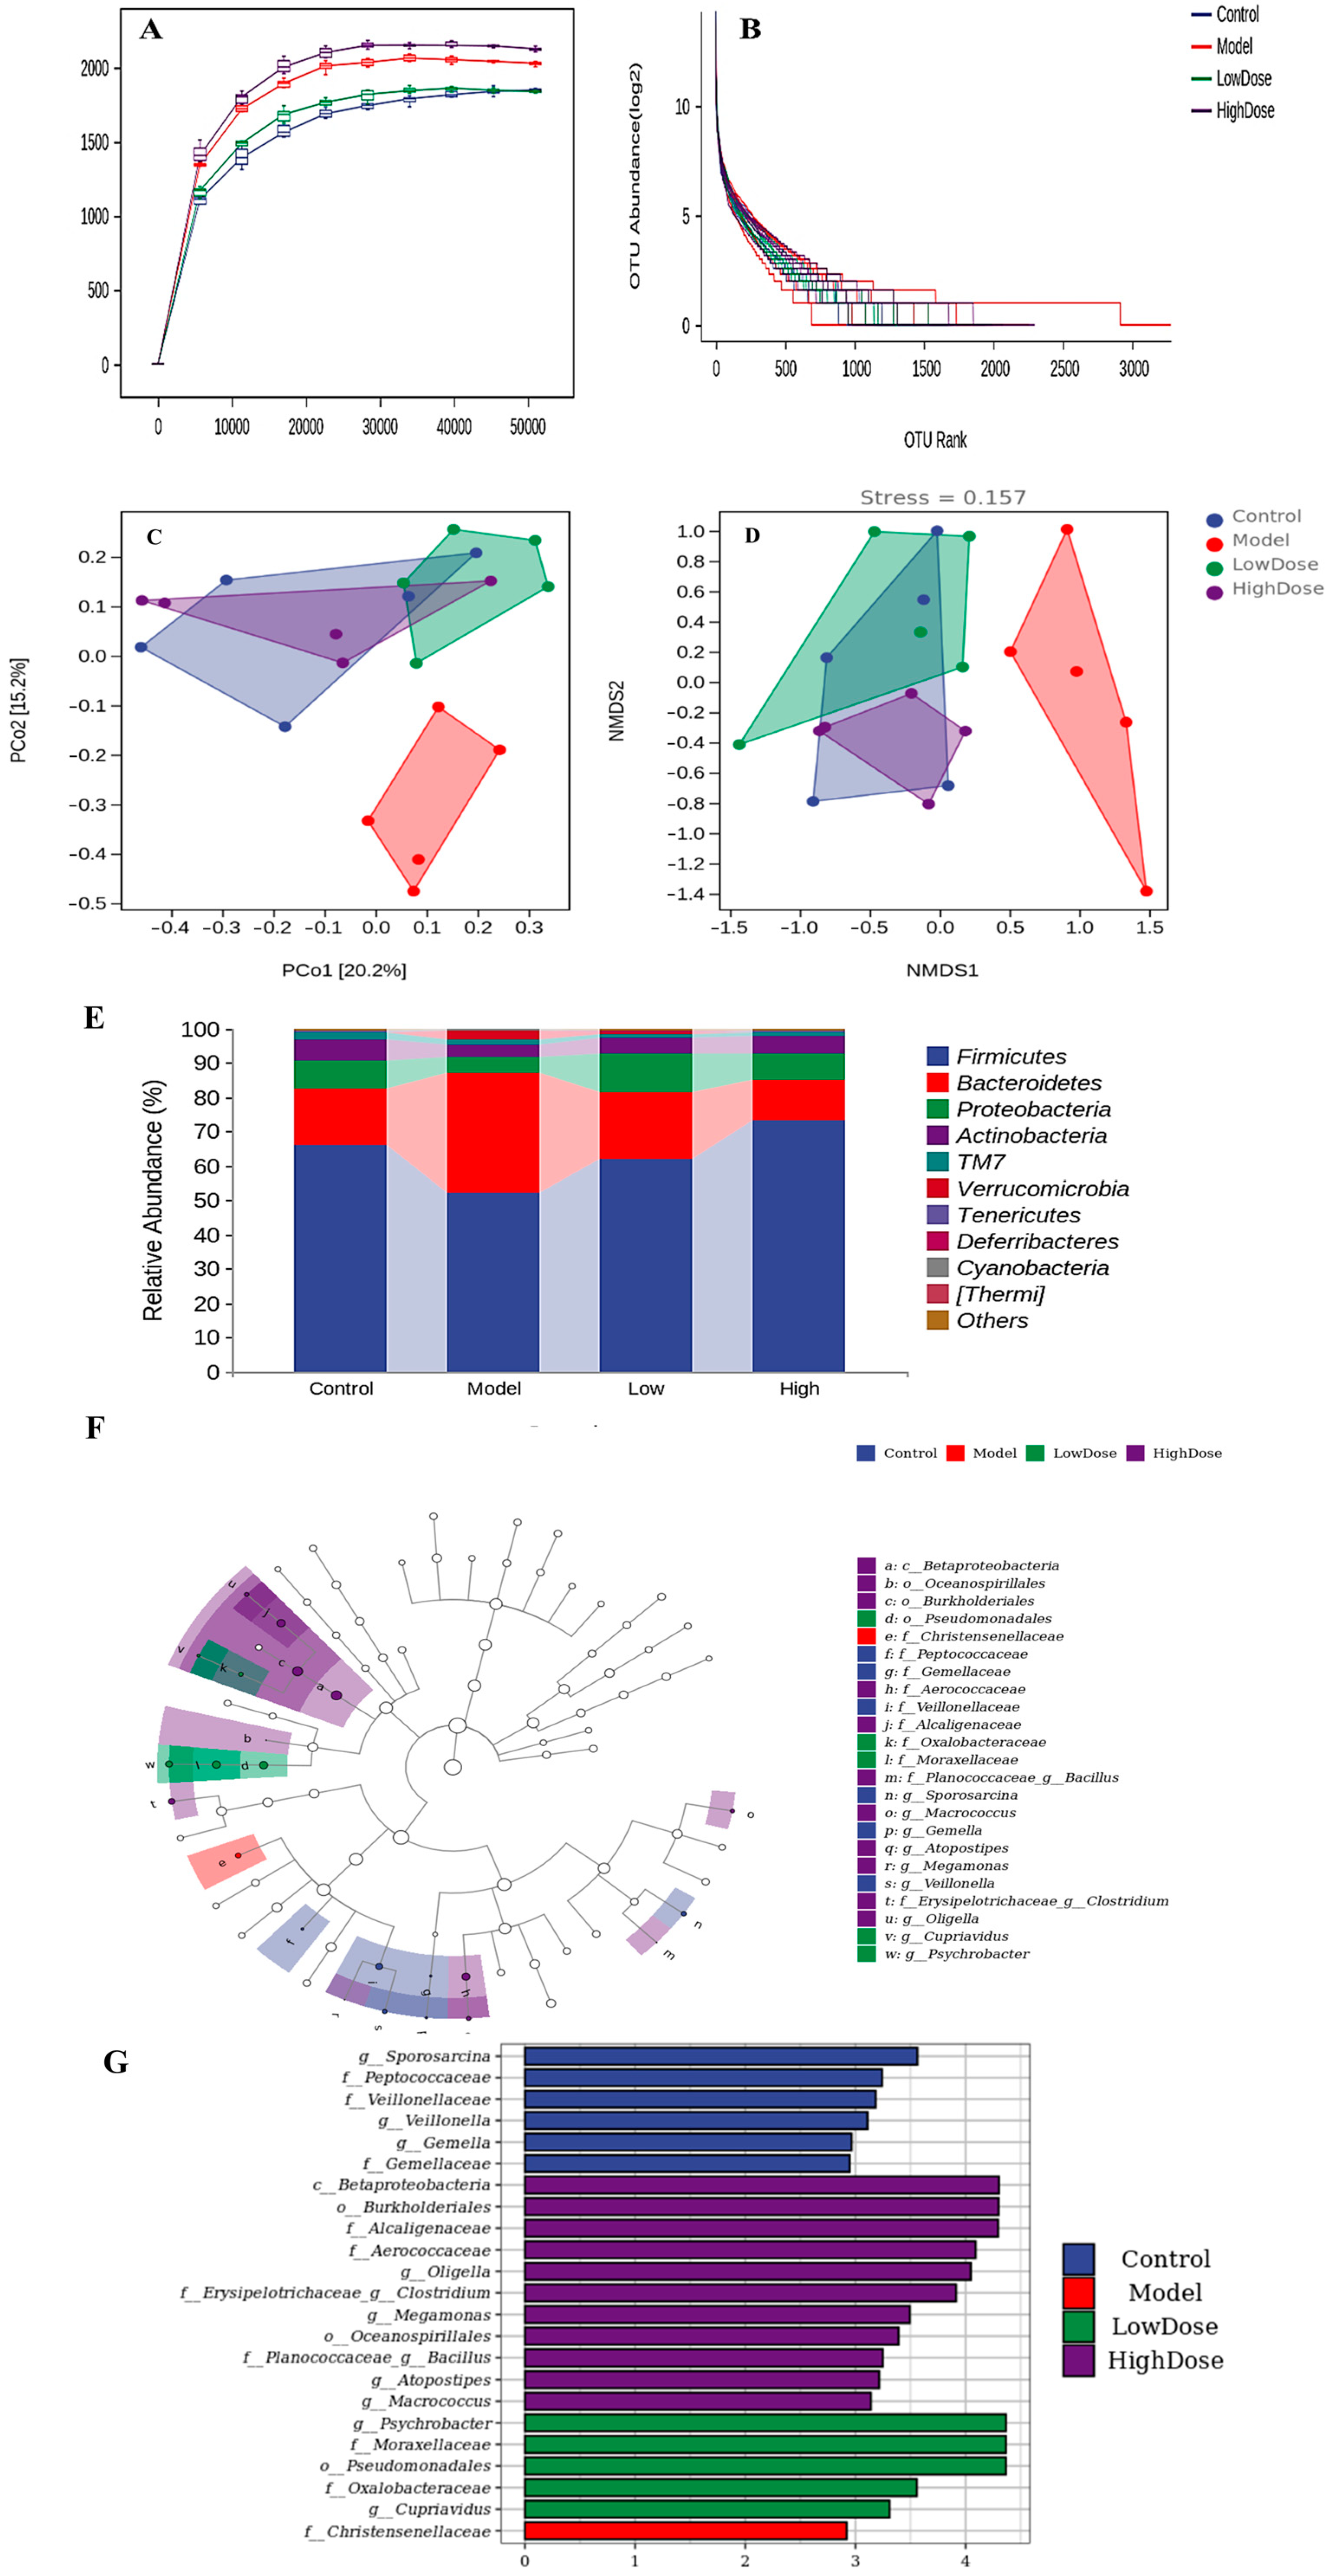
3.5. Effects of EAH on Gut Microbiota Composition
3.5.1. Alpha Diversity Analysis
3.5.2. Beta Diversity Analysis
3.5.3. Taxonomic Composition Analysis
4. Discussion
4.1. Characterization and Quantification of Composition in EAH
4.2. EAH Enhances Gastric Mucosal Defense for Ethanol Damage
4.3. EAH Attenuates Oxidative Stress in Chronic Ethanol-Induced Gastric Damage
4.4. EAH Regulates Inflammatory Factor Levels and Inflammatory Cytokine Expression in Chronic Ethanol-Induced Gastric Damage
4.5. EAH Alters the Gut Microbial Structure in Chronic Ethanol-Induced Gastric Damage
5. Conclusions
Supplementary Materials
Author Contributions
Funding
Institutional Review Board Statement
Informed Consent Statement
Data Availability Statement
Conflicts of Interest
References
- Eyer, M.; Neumann, P.; Dietemann, V. A Look into the Cell: Honey Storage in Honey Bees, Apis Mellifera. PLoS ONE 2016, 11, e0161059. [Google Scholar] [CrossRef] [PubMed]
- Da Silva, P.M.; Gauche, C.; Gonzaga, L.V.; Costa, A.C.O.; Fett, R. Honey: Chemical Composition, Stability and Authenticity. Food Chem. 2016, 196, 309–323. [Google Scholar] [CrossRef] [PubMed]
- Nooh, H.Z.; Nour-Eldien, N.M. The Dual Anti-Inflammatory and Antioxidant Activities of Natural Honey Promote Cell Proliferation and Neural Regeneration in a Rat Model of Colitis. Acta Histochem. 2016, 118, 588–595. [Google Scholar] [CrossRef] [PubMed]
- Sahin, H.; Kaltalioglu, K.; Erisgin, Z.; Coskun-Cevher, S.; Kolayli, S. Protective Effects of Aqueous Extracts of Some Honeys against HCl/Ethanol-Induced Gastric Ulceration in Rats. J. Food Biochem. 2019, 43, e13054. [Google Scholar] [CrossRef]
- Hossen, M.S.; Ali, M.Y.; Jahurul, M.H.A.; Abdel-Daim, M.M.; Gan, S.H.; Khalil, M.I. Beneficial Roles of Honey Polyphenols against Some Human Degenerative Diseases: A Review. Pharmacol. Rep. 2017, 69, 1194–1205. [Google Scholar] [CrossRef]
- Almasaudi, S.B.; El-Shitany, N.A.; Abbas, A.T.; Abdel-dayem, U.A.; Ali, S.S.; Al Jaouni, S.K.; Harakeh, S. Antioxidant, Anti-Inflammatory, and Antiulcer Potential of Manuka Honey against Gastric Ulcer in Rats. Oxid. Med. Cell Longev. 2016, 2016, 3643824. [Google Scholar] [CrossRef]
- Shamshuddin, N.S.S.; Mohd Zohdi, R. Gelam Honey Attenuates Ovalbumin-Induced Airway Inflammation in a Mice Model of Allergic Asthma. J. Tradit. Complement. Med. 2018, 8, 39–45. [Google Scholar] [CrossRef]
- Wang, K.; Wan, Z.; Ou, A.; Liang, X.; Guo, X.; Zhang, Z.; Wu, L.; Xue, X. Monofloral Honey from a Medical Plant, Prunella Vulgaris, Protected against Dextran Sulfate Sodium-Induced Ulcerative Colitis via Modulating Gut Microbial Populations in Rats. Food Funct. 2019, 10, 3828–3838. [Google Scholar] [CrossRef]
- Sun, L.-P.; Shi, F.-F.; Zhang, W.-W.; Zhang, Z.-H.; Wang, K. Antioxidant and Anti-Inflammatory Activities of Safflower (Carthamus Tinctorius L.). Honey Extract. Foods 2020, 9, 1039. [Google Scholar] [CrossRef]
- Ahmadiani, A.; Hosseiny, J.; Semnanian, S.; Javan, M.; Saeedi, F.; Kamalinejad, M.; Saremi, S. Antinociceptive and Anti-Inflammatory Effects of Elaeagnus Angustifolia Fruit Extract. J. Ethnopharmacol. 2000, 72, 287–292. [Google Scholar] [CrossRef]
- Chen, X.; Liu, Y.; Chen, G.; Gong, C.; Li, S.; Hua, H.; Yuan, T. Angustifolinoid A, a Macrocyclic Flavonoid Glycoside from Elaeagnus Angustifolia Flowers. Tetrahedron Lett. 2018, 59, 2610–2613. [Google Scholar] [CrossRef]
- State Administration of Traditional Chinese Medicine of the People’s Republic of China. Zhonghuabencao-Uygur Medicine; Shanghai Science and Technology Press: Shanghai, China, 2005; Volume 2, p. 183. [Google Scholar]
- Hamidpour, R.; Hamidpour, S.; Hamidpour, M.; Shahlari, M.; Sohraby, M.; Shahlari, N.; Hamidpour, R. Russian Olive (Elaeagnus Angustifolia L.): From a Variety of Traditional Medicinal Applications to Its Novel Roles as Active Antioxidant, Anti-Inflammatory, Anti-Mutagenic and Analgesic Agent. J. Tradit. Complement. Med. 2017, 7, 24–29. [Google Scholar] [CrossRef]
- Wang, Y.; Guo, T.; Li, J.Y.; Zhou, S.Z.; Zhao, P.; Fan, M.T. Four flavonoid glycosides from the pulps of Elaeagnus angustifolia and their antioxidant activities. Adv. Mater. Res. 2013, 756–759, 16–20. [Google Scholar] [CrossRef]
- Ayaz, F.A.; Bertoft, E. Sugar and Phenolic Acid Composition of Stored Commercial Oleaster Fruits. J. Food Compos. Anal. 2001, 14, 505–511. [Google Scholar] [CrossRef]
- Okmen, G.; Turkcan, O. A Study on Antimicrobial, Antioxidant and Antimutagenic Activities of Elaeagnus Angustifolia L. Leaves. Afr. J. Tradit. Complement. Altern. Med. 2014, 11, 116–120. [Google Scholar] [CrossRef]
- Louveaux, J.; Anna, M.; Vorwohl, G. Methods of melissopalynology. Bee World 1978, 59, 139–157. [Google Scholar] [CrossRef]
- AOAC International. Official Methods of Analysis of AOAC International; AOAC International: Gaithersburg, MD, USA, 2005. [Google Scholar]
- GB/T 18932.22-2003; Determination of Fructose, Glucose, Sucrose, and Maltose Contents in Honey—High Performance Liquid Chromatography with Refractive Index Detection. General Administration of Quality Supervision, Inspection and Quarantine of the People’s Republic of China (AQSIQ): Beijing, China, 2003.
- Araya, M.; García, S.; Rengel, J.; Pizarro, S.; Álvarez, G. Determination of Free and Protein Amino Acid Content in Microalgae by HPLC-DAD with Pre-Column Derivatization and Pressure Hydrolysis. Mar. Chem. 2021, 234, 103999. [Google Scholar] [CrossRef]
- Khalil, I.; Moniruzzaman, M.; Boukraâ, L.; Benhanifia, M.; Islam, A.; Islam, N.; Sulaiman, S.A.; Gan, S.H. Physicochemical and Antioxidant Properties of Algerian Honey. Molecules 2012, 17, 11199–11215. [Google Scholar] [CrossRef]
- Chen, H.; Fan, C.; Wang, Z.; Chang, Q.; Pang, G. Uncertainties Estimation for Determination of 10 Elements in Northeastern China Black Bee Honey by ICP-MS. Anal. Methods 2013, 5, 3291. [Google Scholar] [CrossRef]
- Wang, Q.; Zhao, H.; Zhu, M.; Zhang, J.; Cheng, N.; Cao, W. Method for Identifying Acacia Honey Adulterated by Resin Absorption: HPLC-ECD Coupled with Chemometrics. LWT 2020, 118, 108863. [Google Scholar] [CrossRef]
- Jin, X.-L.; Wang, K.; Li, Q.-Q.; Tian, W.-L.; Xue, X.-F.; Wu, L.-M.; Hu, F.-L. Antioxidant and Anti-Inflammatory Effects of Chinese Propolis during Palmitic Acid-Induced Lipotoxicity in Cultured Hepatocytes. J. Funct. Foods 2017, 34, 216–223. [Google Scholar] [CrossRef]
- Park, J.-H.; Jang, K.-J.; Kim, C.-H.; Kim, J.-H.; Kim, Y.-K.; Yoon, H.-M. Ganoderma Lucidum Pharmacopuncture for Teating Ethanol-Induced Chronic Gastric Ulcers in Rats. J. Pharmacopunct. 2015, 18, 72–78. [Google Scholar] [CrossRef]
- Liu, X. Intervention Effects of Chicoric Acid on Neuroinflammation and Cognitive Dysfunction and Its Molecular Mechanisms. Ph.D. Thesis, Northwest A&F University, Yangling, China, 2017. [Google Scholar]
- Tahashi, Y.; Matsuzaki, K.; Date, M.; Yoshida, K.; Furukawa, F.; Sugano, Y.; Matsushita, M.; Himeno, Y.; Inagaki, Y.; Inoue, K. Differential Regulation of TGF-β Signal in Hepatic Stellate Cells between Acute and Chronic Rat Liver Injury. Hepatology 2002, 35, 49–61. [Google Scholar] [CrossRef]
- Rognes, T.; Flouri, T.; Nichols, B.; Quince, C.; Mahé, F. VSEARCH: A Versatile Open Source Tool for Metagenomics. PeerJ 2016, 4, e2584. [Google Scholar] [CrossRef] [PubMed]
- Segata, N.; Izard, J.; Waldron, L.; Gevers, D.; Miropolsky, L.; Garrett, W.S.; Huttenhower, C. Metagenomic Biomarker Discovery and Explanation. Genome Biol. 2011, 12, R60. [Google Scholar] [CrossRef] [PubMed]
- Codex Alimentarius Commission. Codex Standard for Honey (CODEX STAN 12-1981, Rev. 2001); Codex Alimentarius Commission: Rome, Italy, 2001. [Google Scholar]
- Patrignani, M.; Fagúndez, G.A.; Tananaki, C.; Thrasyvoulou, A.; Lupano, C.E. Volatile Compounds of Argentinean Honeys: Correlation with Floral and Geographical Origin. Food Chem. 2018, 246, 32–40. [Google Scholar] [CrossRef]
- Chen, H.; Nie, Q.; Xie, M.; Yao, H.; Zhang, K.; Yin, J.; Nie, S. Protective Effects of β-Glucan Isolated from Highland Barley on Ethanol-Induced Gastric Damage in Rats and Its Benefits to Mice Gut Conditions. Food Res. Int. 2019, 122, 157–166. [Google Scholar] [CrossRef] [PubMed]
- Xue, Z.; Shi, G.; Fang, Y.; Liu, X.; Zhou, X.; Feng, S.; Zhao, L. Protective Effect of Polysaccharides from Radix Hedysari on Gastric Ulcers Induced by Acetic Acid in Rats. Food Funct. 2019, 10, 3965–3976. [Google Scholar] [CrossRef]
- Falcão, S.I.; Vale, N.; Gomes, P.; Domingues, M.R.M.; Freire, C.; Cardoso, S.M.; Vilas-Boas, M. Phenolic Profiling of Portuguese Propolis by LC-MS Spectrometry: Uncommon Propolis Rich in Flavonoid Glycosides. Phytochem. Anal. 2013, 24, 309–318. [Google Scholar] [CrossRef]
- Yang, H.J.; Kim, M.J.; Kwon, D.Y.; Kang, E.S.; Kang, S.; Park, S. Gastroprotective Actions of Taraxacum Coreanum Nakai Water Extracts in Ethanol-Induced Rat Models of Acute and Chronic Gastritis. J. Ethnopharmacol. 2017, 208, 84–93. [Google Scholar] [CrossRef]
- Zhao, Z.; Gong, S.; Wang, S.; Ma, C. Effect and Mechanism of Evodiamine against Ethanol-Induced Gastric Ulcer in Mice by Suppressing Rho/NF-кB Pathway. Int. Immunopharmacol. 2015, 28, 588–595. [Google Scholar] [CrossRef] [PubMed]
- Chen, S.; Zhao, H.; Cheng, N.; Cao, W. Rape Bee Pollen Alleviates Dextran Sulfate Sodium (DSS)-Induced Colitis by Neutralizing IL-1β and Regulating the Gut Microbiota in Mice. Food Res. Int. 2019, 122, 241–251. [Google Scholar] [CrossRef]
- Chen, Y.-L.; Shirakawa, H.; Lu, N.-S.; Peng, H.-C.; Xiao, Q.; Yang, S.-C. Impacts of Fish Oil on the Gut Microbiota of Rats with Alcoholic Liver Damage. J. Nutr. Biochem. 2020, 86, 108491. [Google Scholar] [CrossRef] [PubMed]
- Lee, D.-Y.; Song, M.-Y.; Hong, K.-S.; Yun, S.-M.; Han, Y.-M.; Kim, E.-H. Low Dose Administration of Mature Silkworm Powder Induces Gastric Mucosal Defense Factors in Ethanol-Induced Gastric Injury Rat Model. Food Sci. Biotechnol. 2023, 32, 1551–1559. [Google Scholar] [CrossRef]
- Razika, L.; Thanina, A.C.; Nadjiba, C.-M.; Narimen, B.; Mahdi, D.M.; Karim, A. Antioxidant and Wound Healing Potential of Saponins Extracted from the Leaves of Algerian Urtica dioica L. Pak. J. Pharm. Sci. 2017, 30, 1023–1029. [Google Scholar] [PubMed]
- Vasconcelos, P.C.P.; Andreo, M.A.; Vilegas, W.; Hiruma-Lima, C.A.; Pellizzon, C.H. Effect of Mouriri Pusa Tannins and Flavonoids on Prevention and Treatment against Experimental Gastric Ulcer. J. Ethnopharmacol. 2010, 131, 146–153. [Google Scholar] [CrossRef]
- Li, W.; Wang, X.; Zhang, H.; He, Z.; Zhi, W.; Liu, F.; Wang, Y.; Niu, X. Anti-ulcerogenic effect of cavidine against ethanol-induced acute gastric ulcer in mice and possible underlying mechanism. Int. Immunopharmacol. 2016, 38, 450–459. [Google Scholar] [CrossRef]
- Ben Barka, Z.; Tlili, M.; Alimi, H.; Ben Miled, H.; Ben Rhouma, K.; Sakly, M.; Ksouri, R.; Schneider, Y.J.; Tebourbi, O. Protective Effects of Edible Rhus Tripartita (Ucria) Stem Extract against Ethanol-Induced Gastric Ulcer in Rats. J. Funct. Foods 2017, 30, 260–269. [Google Scholar] [CrossRef]
- Song, S.H.; Kim, J.E.; Sung, J.E.; Lee, H.A.; Yun, W.B.; Lee, Y.H.; Song, H.; Hwang, D. Anti-Ulcer Effect of Gallarhois Extract with Anti-Oxidant Activity in an ICR Model of Ethanol/Hydrochloride Acid-Induced Gastric Injury. J. Tradit. Complement. Med. 2019, 9, 372–382. [Google Scholar] [CrossRef]
- Xie, L.; Guo, Y.-L.; Chen, Y.-R.; Zhang, L.-Y.; Wang, Z.-C.; Zhang, T.; Wang, B. A Potential Drug Combination of Omeprazole and Patchouli Alcohol Significantly Normalizes Oxidative Stress and Inflammatory Responses against Gastric Ulcer in Ethanol-Induced Rat Model. Int. Immunopharmacol. 2020, 85, 106660. [Google Scholar] [CrossRef]
- Abizov, E.A.; Tolkachev, O.N.; Mal’Tsev, S.D.; Abizova, E.V. Composition of Biologically Active Substances Isolated from the Fruits of Russian Olive (Elaeagnus angustifolia) Introduced in the European Part of Russia. Pharm. Chem. J. 2008, 42, 696–698. [Google Scholar] [CrossRef]
- Fahmy, N.M.; Al-Sayed, E.; Michel, H.E.; El-Shazly, M.; Singab, A.N.B. Gastroprotective Effects of Erythrina Speciosa (Fabaceae) Leaves Cultivated in Egypt against Ethanol-Induced Gastric Ulcer in Rats. J. Ethnopharmacol. 2020, 248, 112297. [Google Scholar] [CrossRef] [PubMed]
- Alves Júnior, E.B.; de Oliveira Formiga, R.; de Lima Serafim, C.A.; Cristina Araruna, M.E.; de Souza Pessoa, M.L.; Vasconcelos, R.C.; de Carvalho, T.G.; de Jesus, T.G.; Araújo, A.A.; de Araujo Junior, R.F.; et al. Estragole Prevents Gastric Ulcers via Cytoprotective, Antioxidant and Immunoregulatory Mechanisms in Animal Models. Biomed. Pharmacother. 2020, 130, 110578. [Google Scholar] [CrossRef] [PubMed]
- Sibilia, V.; Pagani, F.; Rindi, G.; Lattuada, N.; Rapetti, D.; De Luca, V.; Campanini, N.; Bulgarelli, I.; Locatelli, V.; Guidobono, F.; et al. Central Ghrelin Gastroprotection Involves Nitric Oxide/Prostaglandin Cross-Talk. Br. J. Pharmacol. 2008, 154, 688–697. [Google Scholar] [CrossRef]
- Li, W.; Huang, H.; Niu, X.; Fan, T.; Mu, Q.; Li, H. Protective Effect of Tetrahydrocoptisine against Ethanol-Induced Gastric Ulcer in Mice. Toxicol. Appl. Pharmacol. 2013, 272, 21–29. [Google Scholar] [CrossRef]
- Zheng, H.; Chen, Y.; Zhang, J.; Wang, L.; Jin, Z.; Huang, H.; Man, S.; Gao, W. Evaluation of Protective Effects of Costunolide and Dehydrocostuslactone on Ethanol-Induced Gastric Ulcer in Mice Based on Multi-Pathway Regulation. Chem. Biol. Interact. 2016, 250, 68–77. [Google Scholar] [CrossRef]
- Zhao, W.; Zhu, F.; Shen, W.; Fu, A.; Zheng, L.; Yan, Z.; Zhao, L.; Fu, G. Protective Effects of DIDS against Ethanol-Induced Gastric Mucosal Injury in Rats. Acta Biochim. Biophys. Sin. 2009, 41, 301–308. [Google Scholar] [CrossRef]
- Peskar, B.M. Role of Cyclooxygenase Isoforms in Gastric Mucosal Defence. J. Physiol. Paris 2001, 95, 3–9. [Google Scholar] [CrossRef]
- Al-Quraishy, S.; Othman, M.S.; Dkhil, M.A.; Abdel Moneim, A.E. Olive (Olea Europaea) Leaf Methanolic Extract Prevents HCl/Ethanol-Induced Gastritis in Rats by Attenuating Inflammation and Augmenting Antioxidant Enzyme Activities. Biomed. Pharmacother. 2017, 91, 338–349. [Google Scholar] [CrossRef]
- El-Maraghy, S.A.; Rizk, S.M.; Shahin, N.N. Gastroprotective Effect of Crocin in Ethanol-Induced Gastric Injury in Rats. Chem. Biol. Interact. 2015, 229, 26–35. [Google Scholar] [CrossRef]
- Li, W.-F.; Hao, D.-J.; Fan, T.; Huang, H.-M.; Yao, H.; Niu, X.-F. Protective Effect of Chelerythrine against Ethanol-Induced Gastric Ulcer in Mice. Chem. Biol. Interact. 2014, 208, 18–27. [Google Scholar] [CrossRef]
- Lebda, M.A.; El-Far, A.H.; Noreldin, A.E.; Elewa, Y.H.A.; Al Jaouni, S.K.; Mousa, S.A. Protective Effects of Miswak (Salvadora Persica) against Experimentally Induced Gastric Ulcers in Rats. Oxid. Med. Cell. Longev. 2018, 2018, 6703296. [Google Scholar] [CrossRef] [PubMed]
- Chakraborty, S.; Yadav, S.K.; Subramanian, M.; Iwaoka, M.; Chattopadhyay, S. Dl-Trans-3,4-Dihydroxy-1-Selenolane (DHSred) Heals Indomethacin-Mediated Gastric Ulcer in Mice by Modulating Arginine Metabolism. Biochim. Biophys. Acta 2014, 1840, 3385–3392. [Google Scholar] [CrossRef]
- Akanda, M.R.; Park, B.-Y. Involvement of MAPK/NF-κB Signal Transduction Pathways: Camellia Japonica Mitigates Inflammation and Gastric Ulcer. Biomed. Pharmacother. 2017, 95, 1139–1146. [Google Scholar] [CrossRef] [PubMed]
- Li, W.; Yao, H.; Niu, X.; Wang, Y.; Zhang, H.; Li, H.; Mu, Q. Protective Effect of δ-Amyrone against Ethanol-Induced Gastric Ulcer in Mice. Immunobiology 2015, 220, 798–806. [Google Scholar] [CrossRef]
- Hui, S.; Fangyu, W. Protective Effects of Bilobalide against Ethanol-Induced Gastric Ulcer in Vivo/Vitro. Biomed. Pharmacother. 2017, 85, 592–600. [Google Scholar] [CrossRef] [PubMed]
- Mohammed, F.I.; Al-Essa, M.K.; Shafagoj, Y.A.; Afifi, F.U. Investigation of the Direct Effects of the Alcoholic Extract of Elaeagnus angustifolia L. (Elaeagnaceae) on Dispersed Intestinal Smooth Muscle Cells of Guinea Pig. Sci. Pharm. 2006, 74, 21–30. [Google Scholar] [CrossRef]
- Farahbakhsh, S.; Arbabian, S.; Emami, F.; Moghadam, B.R.; Ghoshooni, H.; Noroozzadeh, A.; Sahraei, H.; Golmanesh, L.; Jalili, C.; Zrdooz, H. Inhibition of Cyclooxygenase Type 1 and 2 Enzyme by Aqueous Extract of Elaeagnus angustifolia in Mice. Basic Clin. Neurosci. 2011, 2, 31–37. [Google Scholar]
- Gong, G.; Guan, Y.-Y.; Zhang, Z.-L.; Rahman, K.; Wang, S.-J.; Zhou, S.; Luan, X.; Zhang, H. Isorhamnetin: A Review of Pharmacological Effects. Biomed. Pharmacother. 2020, 128, 110301. [Google Scholar] [CrossRef]
- Middleton, E.; Kandaswami, C.; Theoharides, T.C. The Effects of Plant Flavonoids on Mammalian Cells: Implications for Inflammation, Heart Disease, and Cancer. Pharmacol. Rev. 2000, 52, 673–751. [Google Scholar] [CrossRef]
- Raso, G.M.; Meli, R.; Di Carlo, G.; Pacilio, M.; Di Carlo, R. Inhibition of Inducible Nitric Oxide Synthase and Cyclooxygenase-2 Expression by Flavonoids in Macrophage J774A.1. Life Sci. 2001, 68, 921–931. [Google Scholar] [CrossRef]
- Hougee, S.; Sanders, A.; Faber, J.; Graus, Y.M.F.; van den Berg, W.B.; Garssen, J.; Smit, H.F.; Hoijer, M.A. Decreased Pro-Inflammatory Cytokine Production by LPS-Stimulated PBMC upon in Vitro Incubation with the Flavonoids Apigenin, Luteolin or Chrysin, Due to Selective Elimination of Monocytes/Macrophages. Biochem. Pharmacol. 2005, 69, 241–248. [Google Scholar] [CrossRef]
- Salonen, A.; de Vos, W.M. Impact of Diet on Human Intestinal Microbiota and Health. Annu. Rev. Food Sci. Technol. 2014, 5, 239–262. [Google Scholar] [CrossRef]
- Engen, P.A.; Green, S.J.; Voigt, R.M.; Forsyth, C.B.; Keshavarzian, A. The Gastrointestinal Microbiome: Alcohol Effects on the Composition of Intestinal Microbiota. Alcohol Res. 2015, 37, 223–236. [Google Scholar] [PubMed]
- Zhao, H.; Cheng, N.; Zhou, W.; Chen, S.; Wang, Q.; Gao, H.; Xue, X.; Wu, L.; Cao, W. Honey Polyphenols Ameliorate DSS-Induced Ulcerative Colitis via Modulating Gut Microbiota in Rats. Mol. Nutr. Food Res. 2019, 63, e1900638. [Google Scholar] [CrossRef] [PubMed]
- Krasowska, A.; Sigler, K. How Microorganisms Use Hydrophobicity and What Does This Mean for Human Needs? Front. Cell Infect. Microbiol. 2014, 4, 112. [Google Scholar] [CrossRef]
- Pedersen, K.; Tannock, G.W. Colonization of the Porcine Gastrointestinal Tract by Lactobacilli. Appl. Environ. Microbiol. 1989, 55, 279–283. [Google Scholar] [CrossRef] [PubMed]
- Van Tassell, M.L.; Miller, M.J. Lactobacillus Adhesion to Mucus. Nutrients 2011, 3, 613–636. [Google Scholar] [CrossRef]
- McLean, J.S.; Pinchuk, G.E.; Geydebrekht, O.V.; Bilskis, C.L.; Zakrajsek, B.A.; Hill, E.A.; Saffarini, D.A.; Romine, M.F.; Gorby, Y.A.; Fredrickson, J.K.; et al. Oxygen-Dependent Autoaggregation in Shewanella Oneidensis MR-1. Environ. Microbiol. 2008, 10, 1861–1876. [Google Scholar] [CrossRef]
- Trunk, T.; Khalil, H.S.; Leo, J.C. Bacterial Autoaggregation. AIMS Microbiol. 2018, 4, 140–164. [Google Scholar] [CrossRef]
- Celebioglu, H.U.; Erden, Y.; Ozel, H.B. In Vitro Cytotoxic Effects of Lactobacilli Grown with Lime Honey on Human Breast and Colon Cancer Cells. Food Biosci. 2021, 41, 101020. [Google Scholar] [CrossRef]
- Lee-Sarwar, K.A.; Kelly, R.S.; Lasky-Su, J.; Zeiger, R.S.; O’Connor, G.T.; Sandel, M.T.; Bacharier, L.B.; Beigelman, A.; Laranjo, N.; Gold, D.R.; et al. Integrative Analysis of the Intestinal Metabolome of Childhood Asthma. J. Allergy Clin. Immunol. 2019, 144, 442–454. [Google Scholar] [CrossRef]
- Waters, J.L.; Ley, R.E. The Human Gut Bacteria Christensenellaceae Are Widespread, Heritable, and Associated with Health. BMC Biol. 2019, 17, 83. [Google Scholar] [CrossRef] [PubMed]
- Ruaud, A.; Esquivel-Elizondo, S.; de la Cuesta-Zuluaga, J.; Waters, J.L.; Angenent, L.T.; Youngblut, N.D.; Ley, R.E. Syntrophy via Interspecies H2 Transfer between Christensenella and Methanobrevibacter Underlies Their Global Cooccurrence in the Human Gut. mBio 2020, 11, e03235-19. [Google Scholar] [CrossRef] [PubMed]
- Mahboubi, M. Mentha spicata L. Essential Oil, Phytochemistry and Its Effectiveness in Flatulence. J. Tradit. Complement. Med. 2021, 11, 75–81. [Google Scholar] [CrossRef]
- Kurbel, S.; Kurbel, B.; Vcev, A. Intestinal Gases and Flatulence: Possible Causes of Occurrence. Med. Hypotheses 2006, 67, 235–239. [Google Scholar] [CrossRef]
- Tzounis, X.; Vulevic, J.; Kuhnle, G.G.C.; George, T.; Leonczak, J.; Gibson, G.R.; Kwik-Uribe, C.; Spencer, J.P.E. Flavanol Monomer-Induced Changes to the Human Faecal Microflora. Br. J. Nutr. 2008, 99, 782–792. [Google Scholar] [CrossRef]
 ” indicates gastric mucosa; “
 ” indicates submucosa; “
 ” indicates muscularis.
” indicates gastric mucosa; “” indicates submucosa; “” indicates muscularis.
” indicates muscularis.
” indicates gastric mucosa; “” indicates submucosa; “” indicates muscularis.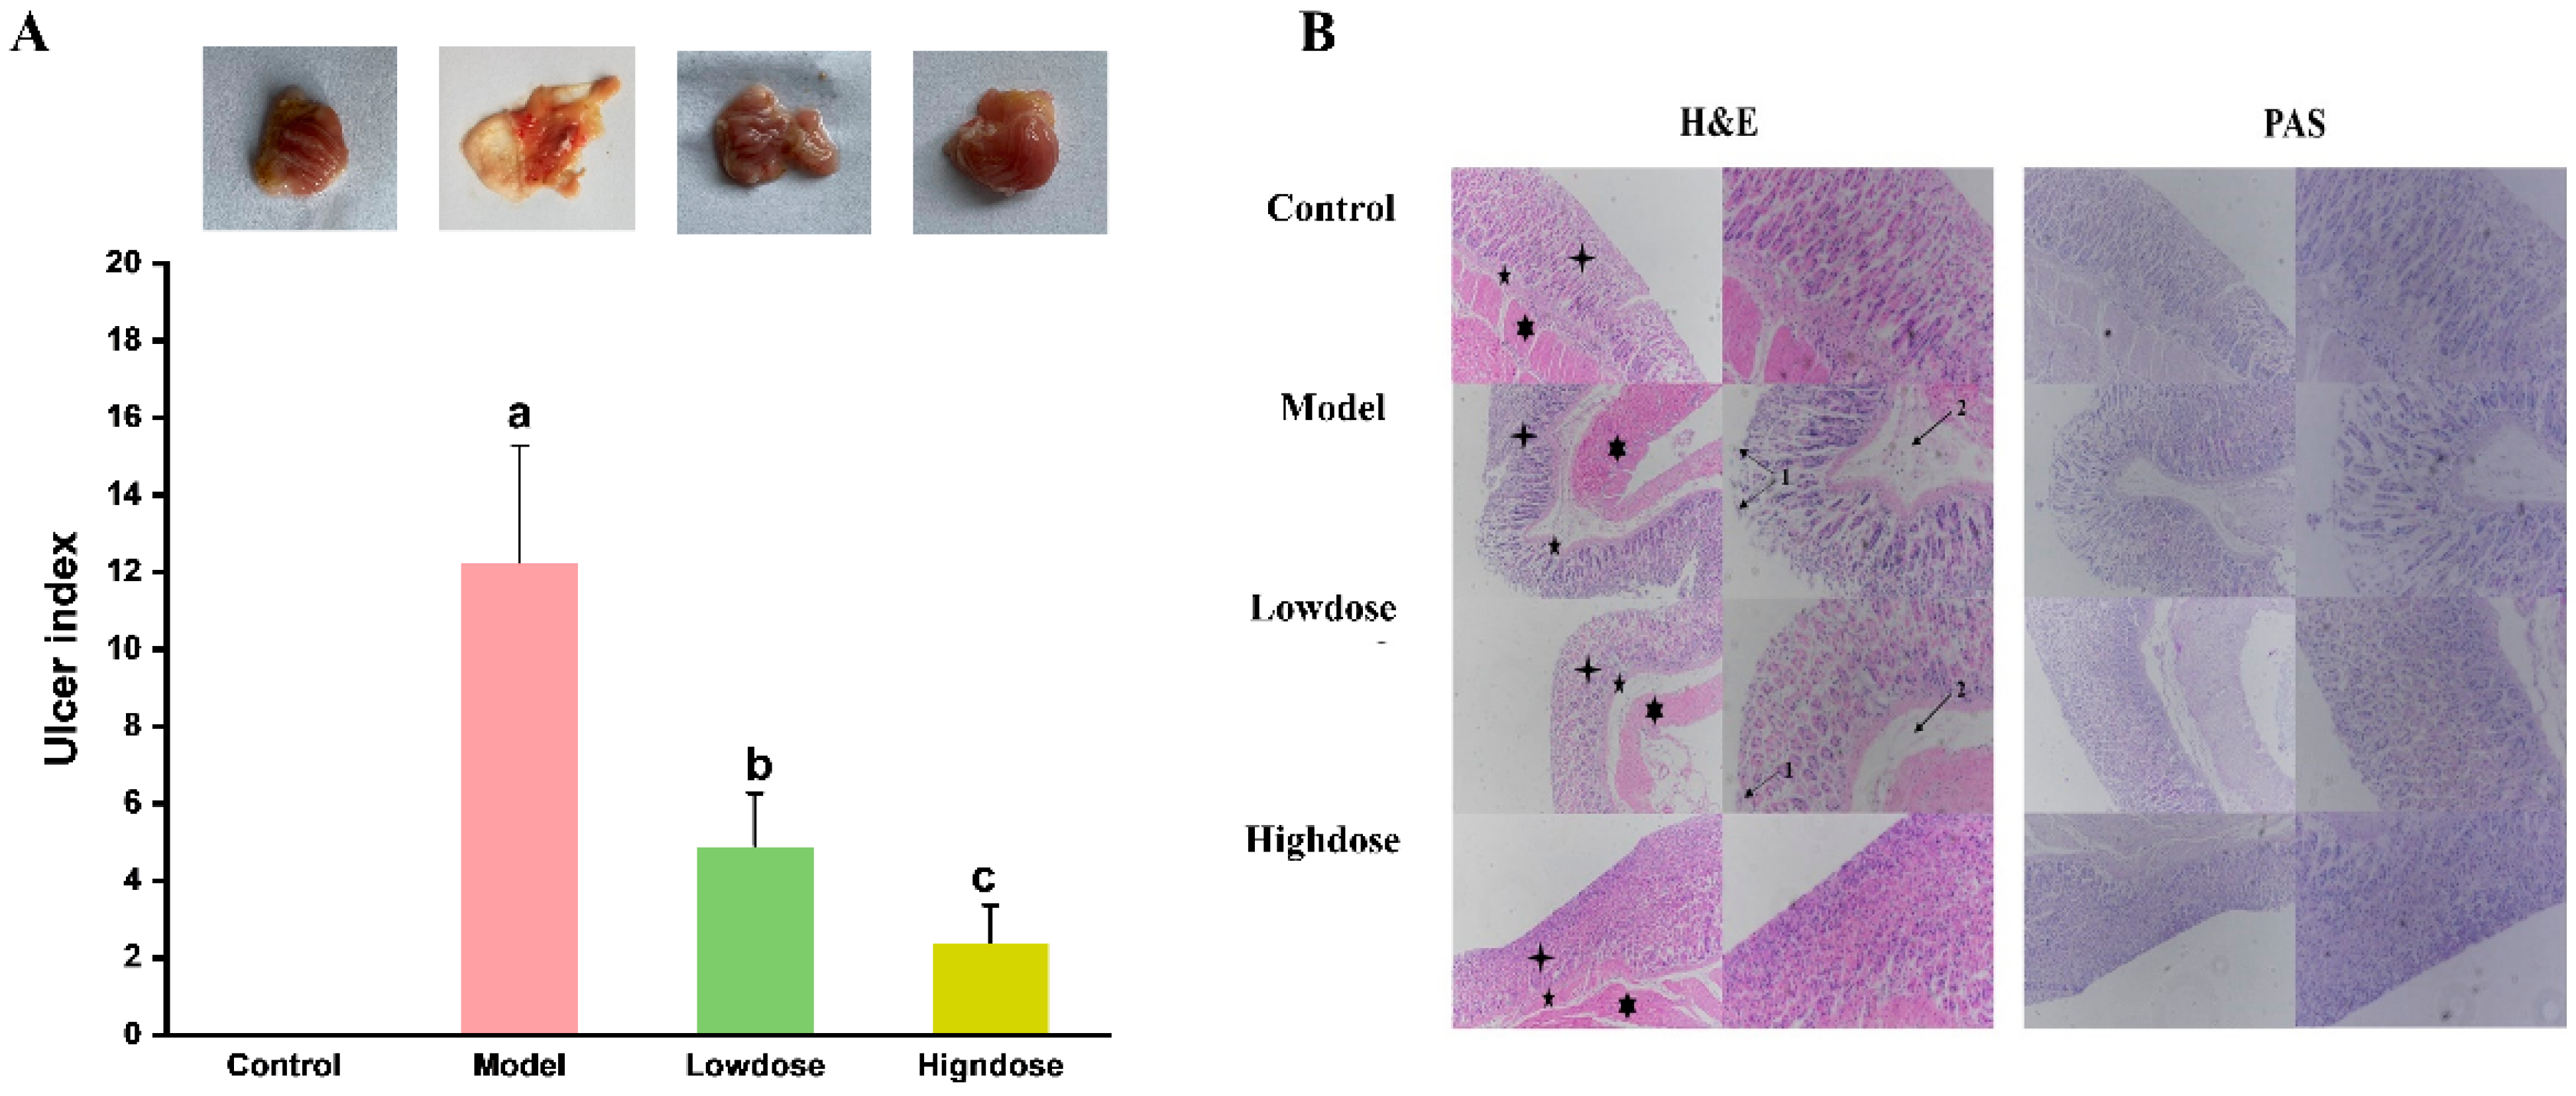

| NO. | Tentative Assignment | Tr a (min) | [M-H]− b (m/z) | [M-H]− c (m/z) | Molecular Formula | Error (ppm) | Fragment Ions (m/z) |
|---|---|---|---|---|---|---|---|
| 1 | Protocatechuic acid | 3.86 | 153.0194 | 153.0194 | C7H6O4 | 0.65 | 153; 135; 109 |
| 2 | 4-Hydroxybenzoic acid | 5.48 | 137.0245 | 137.0244 | C7H6O3 | 0.45 | 119; 93 |
| 3 | Chlorogenic acid | 7.45 | 353.0894 | 353.0878 | C16H18O9 | 4.53 | 191; 179 |
| 4 | Caffeic acid | 8.76 | 179.0355 | 179.0350 | C9H8O4 | 2.70 | 161; 135 |
| 5 | p-Coumaric acid | 12.16 | 163.0404 | 163.0401 | C9H8O3 | 2.26 | 119 |
| 6 | Quercetin 3,4′-diglucoside | 13.43 | 625.1434 | 625.1405 | C27H30O17 | 4.64 | 463; 301 |
| 7 | Gallocatechin | 15.17 | 305.0674 | 305.0661 | C15H14O7 | 4.26 | 287; 179; 161; 137 |
| 8 | Rutin | 15.74 | 609.1456 | 609.1464 | C27H30O16 | −0.82 | 301 |
| 9 | Myricetin | 16.61 | 317.0321 | 317.0303 | C15H10O8 | 5.68 | 178; 151; 137 |
| 10 | Dimethoxycinnamic acid | 17.80 | 207.0688 | 207.0668 | C11H12O4 | 9.66 | 163 |
| 11 | Pinobanksin | 18.49 | 271.0629 | 271.0612 | C15H12O5 | 6.27 | 243; 227; 151; |
| 12 | Catechin | 18.51 | 289.0710 | 289.0719 | C15H14O6 | −3.11 | 271; 257; 161; 151; |
| 13 | Kaempferol | 18.89 | 285.0418 | 285.0405 | C15H10O6 | 4.56 | 267; 257; 241; 151 |
| 14 | Isorhamnetin | 19.65 | 315.0519 | 315.0510 | C16H12O7 | 2.70 | 315; 300; 151; |
| 15 | Luteolin | 19.79 | 285.0409 | 285.0405 | C15H10O6 | 1.71 | 257; 151; |
| 16 | Apigenin | 20.03 | 269.0462 | 269.0455 | C15H10O5 | 2.60 | 269; 251; 225; 151 |
| 17 | Pinocembrin | 21.47 | 255.0665 | 255.0663 | C15H12O4 | 0.73 | 237; 227; 221; 151; |
| 18 | 3-o-acetylpinobanksin | 21.65 | 313.0719 | 313.0718 | C17H14O6 | 0.32 | 313; 269 |
| 19 | Chrysin | 22.12 | 253.0518 | 253.0506 | C15H10O4 | 4.74 | 253; 235; 151; |
| 20 | Caffeic acid phenylethyl ester | 22.19 | 283.0982 | 283.0976 | C17H16O4 | 2.12 | 283; 253; 151; |
| 21 | Galangin | 22.61 | 269.0463 | 269.0455 | C15H10O5 | 2.97 | 269; 251; 225; |
| Chao1 | ACE | Shannon | Simpson | Faith | Pielou | |
|---|---|---|---|---|---|---|
| Control | 1927 ± 287 a | 1602 ± 273 a | 7.44 ± 0.92 a | 0.97 ± 0.02 a | 104 ± 11 a | 0.66 ± 0.07 a |
| Model | 1326 ± 180 b | 1529 ± 539 a | 6.18 ± 0.41 b | 0.92 ± 0.02 b | 100 ± 17 a | 0.62 ± 0.06 a |
| Lowdose | 1594 ± 246 b | 1585 ± 248 a | 6.61 ± 0.48 b | 0.94 ± 0.04 b | 105 ± 13 a | 0.64 ± 0.05 a |
| Highdose | 2249 ± 301 a | 1650 ± 304 a | 7.80 ± 0.31 a | 0.97 ± 0.01 a | 107 ± 6 a | 0.69 ± 0.04 a |
Disclaimer/Publisher’s Note: The statements, opinions and data contained in all publications are solely those of the individual author(s) and contributor(s) and not of MDPI and/or the editor(s). MDPI and/or the editor(s) disclaim responsibility for any injury to people or property resulting from any ideas, methods, instructions or products referred to in the content. |
© 2025 by the authors. Licensee MDPI, Basel, Switzerland. This article is an open access article distributed under the terms and conditions of the Creative Commons Attribution (CC BY) license (https://creativecommons.org/licenses/by/4.0/).
Share and Cite
Zhu, M.; Yang, J.; Zhao, H.; Qiu, Y.; Yuan, L.; Hong, J.; Cao, W. Effect of Elaeagnus angustifolia Honey in the Protection Against Ethanol-Induced Chronic Gastric Injury via Counteracting Oxidative Stress, Interfering with Inflammation and Regulating Gut Microbiota in Mice. Foods 2025, 14, 1600. https://doi.org/10.3390/foods14091600
Zhu M, Yang J, Zhao H, Qiu Y, Yuan L, Hong J, Cao W. Effect of Elaeagnus angustifolia Honey in the Protection Against Ethanol-Induced Chronic Gastric Injury via Counteracting Oxidative Stress, Interfering with Inflammation and Regulating Gut Microbiota in Mice. Foods. 2025; 14(9):1600. https://doi.org/10.3390/foods14091600
Chicago/Turabian StyleZhu, Min, Jiayan Yang, Haoan Zhao, Yu Qiu, Lin Yuan, Jingyang Hong, and Wei Cao. 2025. "Effect of Elaeagnus angustifolia Honey in the Protection Against Ethanol-Induced Chronic Gastric Injury via Counteracting Oxidative Stress, Interfering with Inflammation and Regulating Gut Microbiota in Mice" Foods 14, no. 9: 1600. https://doi.org/10.3390/foods14091600
APA StyleZhu, M., Yang, J., Zhao, H., Qiu, Y., Yuan, L., Hong, J., & Cao, W. (2025). Effect of Elaeagnus angustifolia Honey in the Protection Against Ethanol-Induced Chronic Gastric Injury via Counteracting Oxidative Stress, Interfering with Inflammation and Regulating Gut Microbiota in Mice. Foods, 14(9), 1600. https://doi.org/10.3390/foods14091600