Article

Extraction of Bound Polyphenols from Elaeagnus angustifolia L. by Ultrasonic-Assisted Enzymatic Hydrolysis and Evaluation of Its Antioxidant Activity In Vitro

1
College of Food Science and Engineering, Tarim University, Alar 843300, China
2
Production & Construction Group Key Laboratory of Special Agricultural Products Further Processing in Southern Xinjiang, Alar 843300, China
3
Analysis and Testing Center, Tarim University, Alar 843300, China
*
Author to whom correspondence should be addressed.
These authors contributed equally to this work.
Foods 2025, 14(9), 1567; https://doi.org/10.3390/foods14091567
Submission received: 13 February 2025 / Revised: 18 April 2025 / Accepted: 28 April 2025 / Published: 29 April 2025
(This article belongs to the Section Food Nutrition)

Abstract

:
Herein, Elaeagnus angustifolia L. was utilized as a raw material to extract bound polyphenols using an ultrasound-assisted complex enzyme method for the first time. The effects of enzyme ratio, ultrasonic time, liquid-to-solid ratio, and pH value on the bound polyphenol yield were investigated using single-factor experiments. The key parameters were subsequently optimized using the Box–Behnken design. The optimal conditions identified were as follows: enzyme ratio (α-amylase/cellulase = 5:1 mg/mg), ultrasonic time of 50 min, liquid-to-solid ratio of 12:1 mL/g, and pH value of 5. Under these conditions, the bound polyphenol yield was measured at 13.970 ± 0.3 mg/g. A total of 27 phenolic compounds were identified using ultrahigh-performance liquid chromatography–ion mobility quadrupole time-of-flight mass spectrometry (UPLC–IMS-QTOF-MS), including two coumarins, five lignins, 10 polyphenols, nine flavonoids, and one tannin, and specifically containing Angeloylgomisin Q, Yakuchinone A, Furosin, 6-Dehydrogingerdione, and 4′-Methylpinosylvin, and so on. Antioxidant activity was assessed using the 1,1-diphenyl-2-picryl-hydrazil (DPPH) and 2,2′-azino-bis-(3-ethylbenzthiazoline-6-sulfonate) (ABTS) methods, revealing significant antioxidant potential. This study introduced a novel extraction process for bound polyphenols from E. angustifolia L. and provided the first qualitative analysis of bound polyphenols in this species, establishing a scientific foundation for its development and application in the functional food, medicine, and cosmetics industries.

1. Introduction

Elaeagnus angustifolia L., commonly referred to as Qilixiang, Guixiangliu, and Jigedai, belongs to the Elaeagnaceae family. Currently, over 80 recognized varieties of E. angustifolia L. exist worldwide, primarily distributed across northwest China, subtropical Europe, parts of North America, and the Himalayas [1,2,3,4]. One of the prevalent varieties of E. angustifolia L. can be found in Xinjiang. This species is characterized by its drought tolerance, saline–alkali resistance, and ability to withstand wind and sand. Additionally, nitrogen-fixing rhizobia associated with the roots of E. angustifolia L. contribute to soil fertility and enhance the soil environment [5,6]. Thus, E. angustifolia L. is recognized as a significant tree species for semiarid regions and saltland shelterbelts. The pulp of E. angustifolia L. is rich in various nutrients, including starches [7], sugars, fats, proteins, amino acids, and minerals [8,9]. Recent studies indicate that the fruit of E. angustifolia L. is rich in sugars, tannins, flavonoids, minerals, and various trace elements, exhibiting health benefits such as hypoglycemic, cholesterol-lowering, anti-inflammatory, and antioxidant effects [10].
Polyphenols are secondary metabolites widely distributed in plants, containing an aromatic ring and one or more hydroxyl groups. Based on the number and position of the hydroxyl groups, they can be classified into phenolic acids, flavonoids, stilbenes, and lignin [11]. In recent years, many reports have documented the biological activities of plant polyphenols, such as antiviral, antibacterial, antitumor, hypoglycemic, and hypolipidemic [12,13]. Phenolic compounds can be divided into free polyphenols (FPs) and bound polyphenols (BPs) based on their dissolution characteristics [14,15]. FP is mainly present in the food matrix as monomers and is easily dissolved in water and organic solvents [16]. BP is often present in the plant cell wall matrix and is linked to macromolecules such as cellulose, structural proteins, and cell wall polysaccharides in the form of monomers, dimers, or oligomers through ester bonds, ether bonds, or C–C bonds. Such polyphenols are more difficult to extract [17]. BP mainly exists in the residues of FP released by water and is not released through the hydrolysis process. Thus, most people often ignore BP. Existing studies have shown that the BP content in plants is significantly higher than the FP content, and BP has superior biological activities [18,19].
The methods for extracting BP from plants include chemical methods, biological methods, and physically assisted extraction methods. Chemical methods usually require a longer extraction time and a more complex pretreatment process and need to be performed under high-temperature conditions, which will lead to the degradation of some phenolic compounds [20]. The enzymatic hydrolysis reaction has the advantages of being green, mild, and efficient [21]. In the food industry, physical assistive technology has been widely used, with the advantages of high mass transfer efficiency and environmental friendliness [22,23]. It has been reported that the combination of ultrasound with other hydrolysis methods such as alkaline hydrolysis and supercritical fluid extraction is more effective in releasing BP than any other single extraction method [24,25], showed that the amount of tartary buckwheat BP released by ultrasound-assisted hydrolysis was significantly higher than that released by acid–base hydrolysis. Compared with previous studies, in this study, the combination of ultrasonic extraction and enzymatic hydrolysis was used to extract BP from E. angustifolia L. The ultrasonic extraction method utilizes the cavitation effect, mechanical effect, and thermal effect generated by ultrasonic waves to disrupt the plant cell wall, thereby accelerating the infiltration of solvents and the dissolution of active ingredients. The enzymatic hydrolysis method has the advantages of environmental protection and mildness. Compared with traditional extraction methods, the combination of the two can achieve efficient extraction and maintain mild reaction conditions and environmental friendliness.
In this experiment, ultrasound-assisted enzymatic hydrolysis was used for the first time to extract BP from E. angustifolia L. from Xinjiang, China. The effects of the compound enzyme ratio, ultrasonic time, liquid-to-solid ratio, and pH on BP yield were investigated. The process parameters were optimized using the response surface methodology. In addition, we also analyzed the antioxidant activity in vitro of BP from E. angustifolia L., and identified the phenolic compounds by UPLC–IMS-QTOF-MS, aiming to provide new ideas for its application in the research and development of functional foods, drugs, and cosmetics.

2. Results and Discussion

2.1. Single-Factor Investigation

2.1.1. Effect of Enzyme Ratio on BP Extraction

The effect of the enzyme ratio on the extraction rate of E. angustifolia L. BP is shown in Figure 1a. After the preliminary test, α-amylase and cellulase were selected. The addition ratio of the two enzymes was increased from 1:3 to 5:1 mg/mg, and the BP yield showed an upward trend, reaching a maximum when the enzyme ratio was 5:1 mg/mg. When the enzyme ratio continued to increase to 7:1 mg/mg, BP showed a downward trend. BP is often present in the plant cell wall matrix and is linked to starch and other macromolecules in the form of monomers, dimers, or oligomers through ester bonds, ether bonds, or C–C bonds [26]. Amylase can break the starch chain, destroy its spatial structure, and hydrolyze the glycosidic bond so that the phenolic substances embedded in the starch network structure can be released. Cellulase can destroy the cell wall structure because the cell wall structure is dominated by cellulose and hemicellulose, and the phenolic substances connected to it are continuously released into the solvent, thereby promoting the extraction efficiency of phenolic substances [27]. In this experiment, with an increase in the amount of α-amylase, the BP yield in E. angustifolia L. increased continuously, which may be due to the combination of BP and starch in E. angustifolia L. When it increased to a certain amount, it showed a downward trend, which might be because the enzyme concentration and substrate reached saturation, but the extraction rate decreased. Some researchers have shown [28] that enzyme concentration and substrate saturation have an effect. Simply put, when α-amylase is excessive, it may preferentially occupy the reaction interface, resulting in the inability of cellulase to effectively contact cell wall substrates, or the oligosaccharides generated by α-amylase to decompose starch may inhibit itself or cellulase activity and reduce overall efficiency. Therefore, considering the above reasons and cost issues, the best enzyme ratio is 5:1.

2.1.2. The Influence of Ultrasound Time on BP Extraction

The effect of ultrasonic time on the BP extraction rate of E. angustifolia L. is shown in Figure 1b. The BP yield increased with an increase in ultrasonic time from 30 to 50 min and reached the peak at 50 min, but it decreased sharply with an increase in extraction time. This may be because these compounds need a certain amount of time to dissolve and diffuse from the plant cell membrane to the solvent medium under the mechanical action of the ultrasound, and the chemical bonds connected to BP cannot be completely broken in a short time. Prolonging the extraction time can increase the extraction amount of BP. However, with the extension of time, some of the dissolved polyphenols are prone to oxidation and loss, and the structures of some unstable components are easily destroyed under long-term ultrasound, and a large number of impurities are dissolved, which is not conducive to separation and extraction [29,30,31]. It is also possible that a very long ultrasonic time will reduce the activity of the enzyme, resulting in a decrease in BP yield [32]. In this experiment, the highest BP yield was obtained at 50 min, which was consistent with the experimental results reported by Liu and Jiao et al. [33,34]. Therefore, the appropriate ultrasonic time is 50 min.

2.1.3. The Effect of Liquid-to-Solid Ratio on BP Extraction

The effect of the liquid-to-solid ratio on the BP extraction yield of E. angustifolia L. is shown in Figure 1c. The BP yield increased slowly with an increase in the liquid-to-solid ratio from 8:1 to 12:1 mL/mg, and it reached its maximum when the liquid-to-solid ratio was 12:1 mL/mg. The reason may be that the liquid-to-solid ratio was small and the reaction between the powder of E. angustifolia L. and the solvent was not sufficient, which affected the dissolution of BP, indicating that the increase in liquid-to-solid ratio promoted the hydrolysis and release of BP by the enzyme. However, if we continue to increase the solid-to-liquid ratio, the BP yield will show a serious downward trend. This may be because of the increase in the volume of the liquid, which increases the contact area with the air, ensuring that the released BP is oxidized, or it may be because the amount of enzyme and the reaction substrate are saturated. If we continue to increase the liquid-to-solid ratio, it will not only increase the solvent consumption but also may dissolve more alcohol-soluble impurities such as pigments [35,36]. This will increase the workload and cost of subsequent processes; the test results are consistent with the trend reported by Gao et al. [37]. Therefore, the optimum liquid-to-solid ratio is 12:1 mL/mg.

2.1.4. Effect of pH on BP Extraction

The effect of pH on the BP extraction rate of E. angustifolia L. is shown in Fig. 1d. When the pH was less than 5.0, the BP yield increased significantly with an increase in pH value. When the pH of the enzymatic hydrolysate was 5.0, the BP yield reached the maximum. When the pH was greater than 5.0, the BP yield decreased with an increase in pH, indicating that the enzyme activity was affected by the pH value. The complex enzyme activity was strong under the weak acid condition of pH 4–5, which is conducive to the release of BP, and the complex enzyme activity was inhibited under the strong acid and neutral conditions, which was not conducive to its role [38,39]. The pH value not only affects the enzyme activity but also affects the activity of polyphenols. Previous studies [40] have shown that most polyphenols are structurally stable in the pH range of 2–5, and hydrolysis or decarboxylation occurs under alkaline conditions, resulting in structural damage. Therefore, the optimal enzyme solution pH is 5.0.

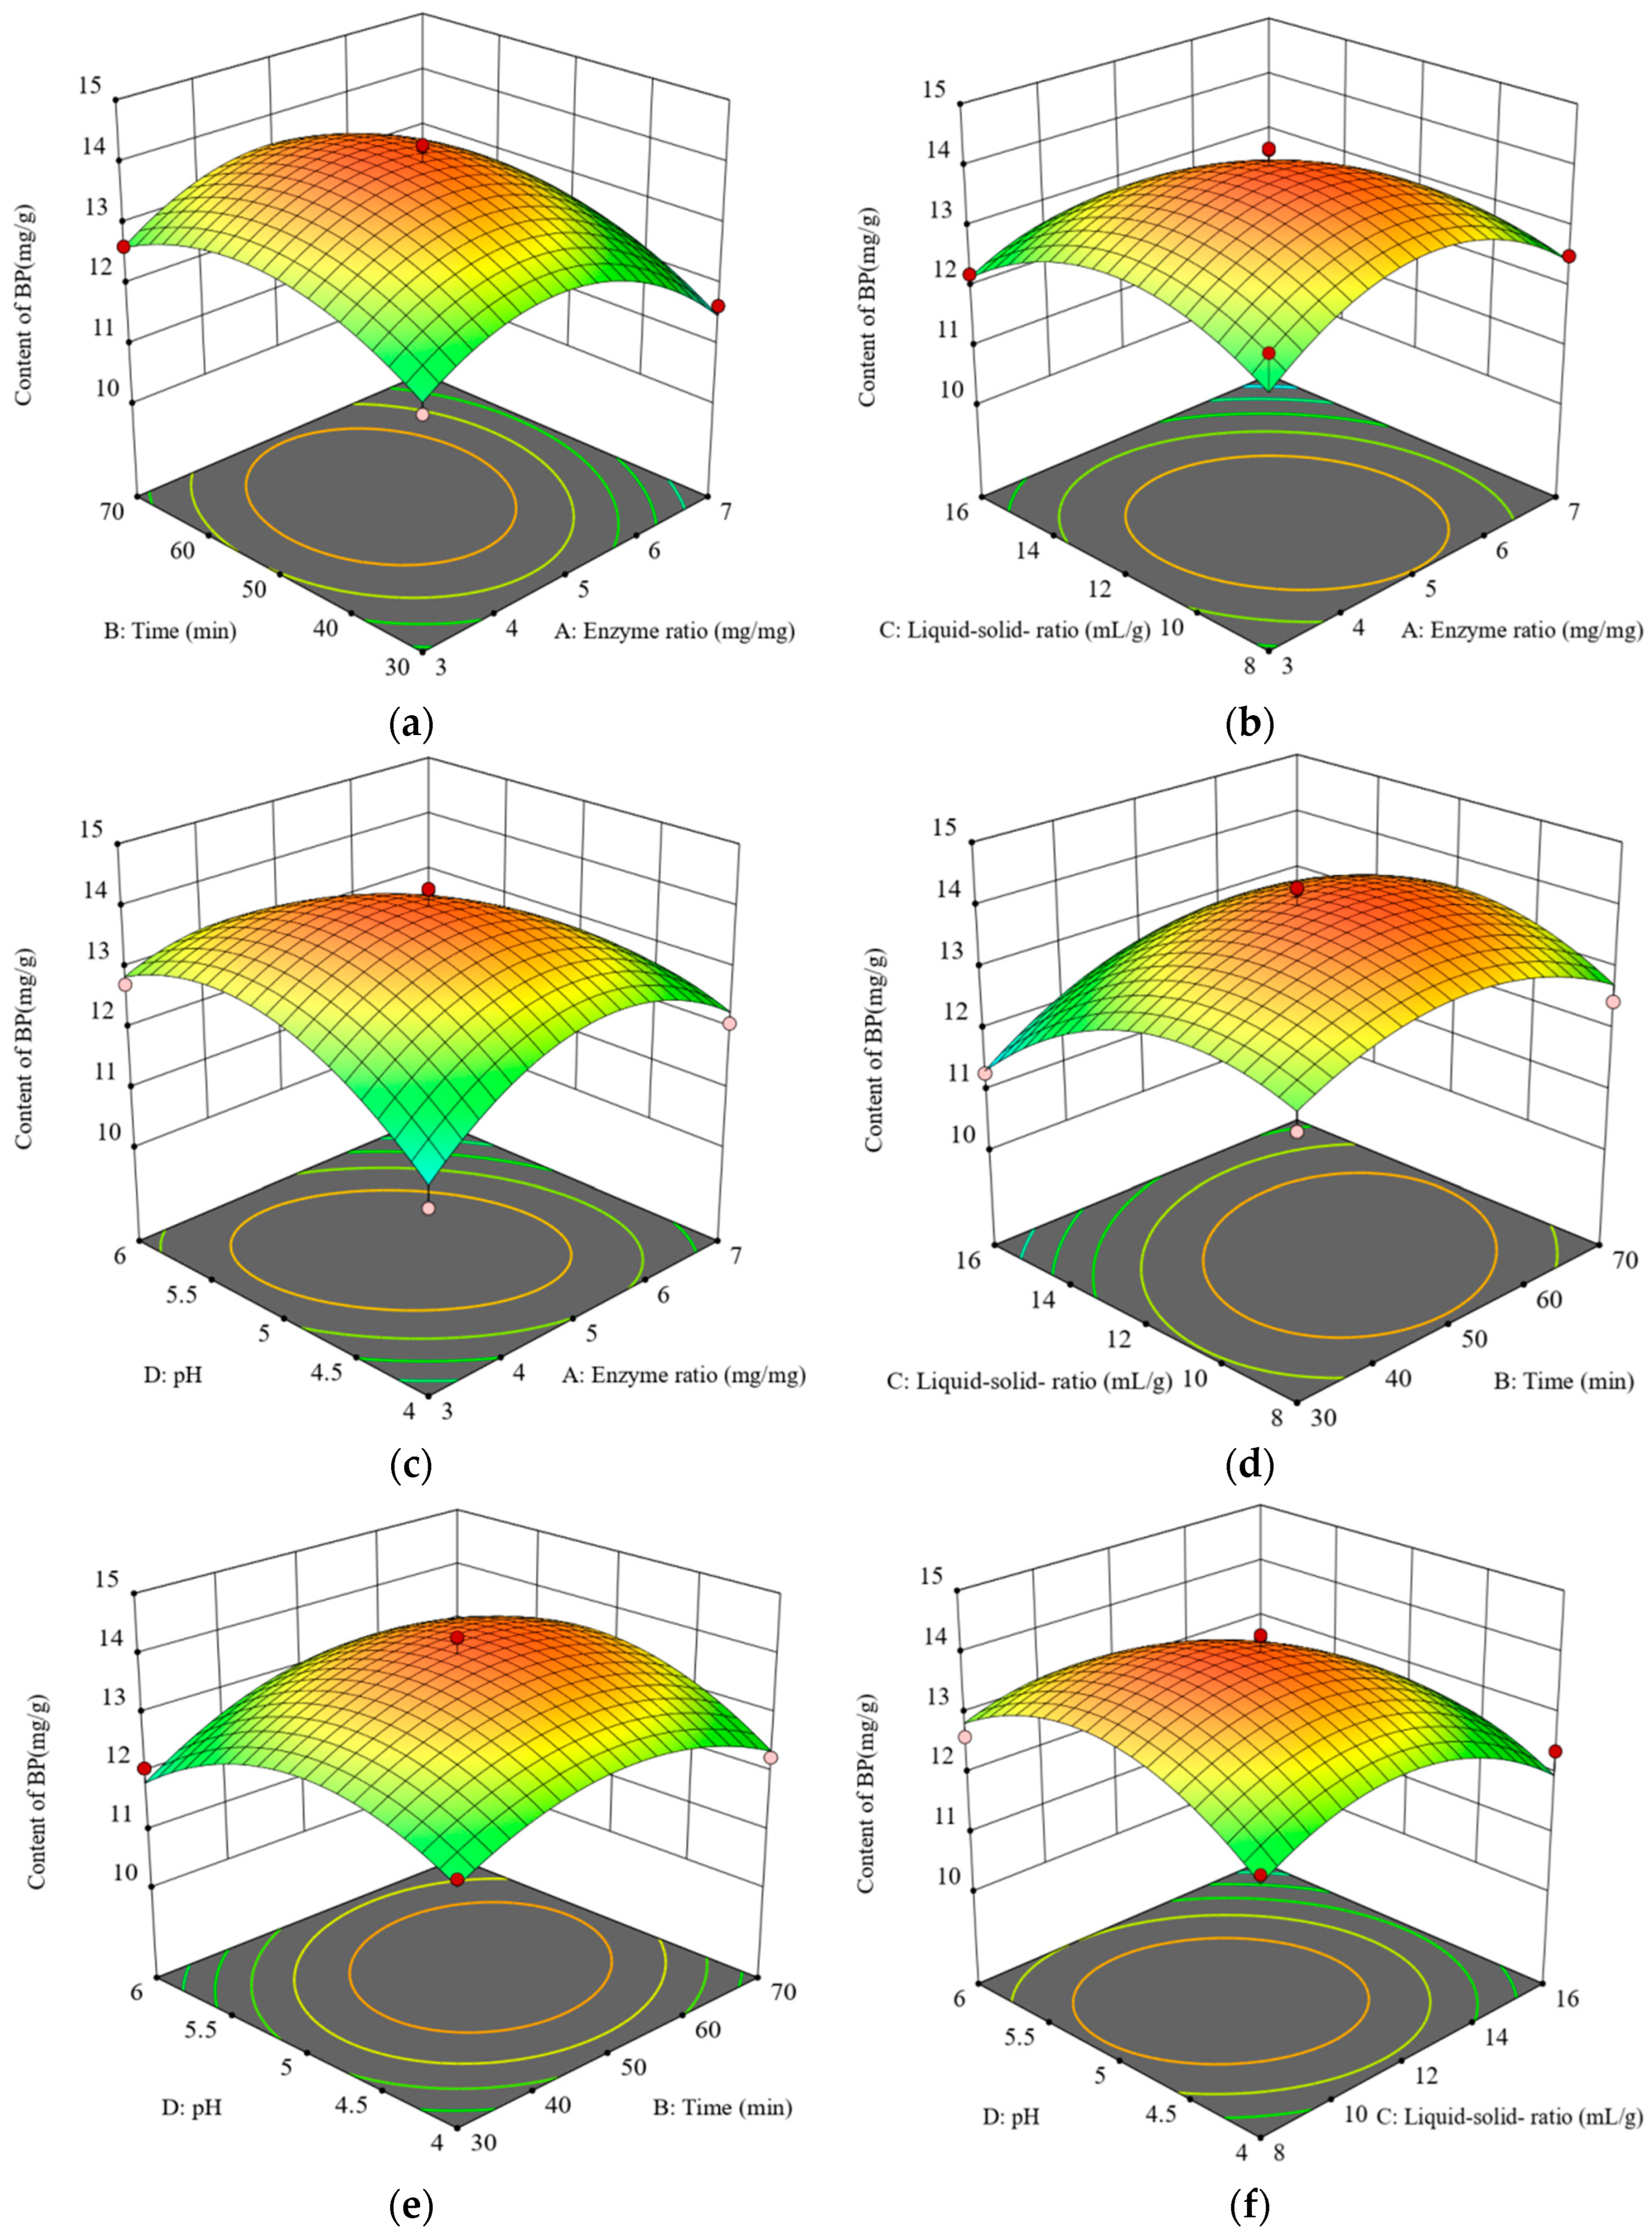
2.2. Response Surface Methodology for Optimizing the BP Extraction Process of E. angustifolia L.

Based on single-factor test results, the four factors of enzyme ratio (A), time (B), liquid-to-material ratio (C), and pH (D) were selected as variables, and the BP yield of E. angustifolia L. was used as the response value (Y). According to the principle of the Box–Behnken experiment, we designed a response surface experiment to optimize the technological parameters of E. angustifolia L. BP. Table 1 illustrates the design and results of the experiment. The experimental results were analyzed and fitted, and the quadratic regression equation model of the relationship between polyphenol yield (Y) and each factor variable was established:
Y = 14.01 0.2854 A + 0.2815 B 0.4264 C + 0.0073 D + 0.0897 A B 0.3029 A C 0.5984 A D + 0.3084 B C + 0.2141 B D 0.2471 C D 1.10 A 2 0.7603 B 2 0.9072 C 2 0.9319 D 2 .
The regression model was comprehensively evaluated using analysis of variance, and results are shown in Table 2. The regression model of F = 12.68, p < 0.0001, misfit term p = 0.2654 > 0.05 loss of fit was not significant, and the coefficient of determination R2 = 0.9269. Therefore, the fitting degree of the regression model is very good, which can be used to analyze and predict the process of the ultrasound-assisted enzymatic extraction of E. angustifolia L. BP. In the regression model, the regression coefficients of C, A, and B were significant (p < 0.05). The C item was extremely significant (p < 0.01), and the quadratic item (A2, B2, C2, D2) showed a significant level (p < 0.01). AD was the same as the quadratic item (p < 0.01), and the other items had no significant effect on the extraction rate of BP (p > 0.05). The mechanism of the four variables on BP yield is as follows: liquid-to-solid ratio (C) > enzyme ratio (A) > time (B) > pH (D).
The response surface and contour lines of each interaction are shown in Figure 2. The response surface and contour map intuitively reflect the influence of the interaction of two factors on the BP extraction rate of E. angustifolia L. With the increase in the slope of the response surface, the contour line becomes denser, indicating that each factor has a great influence on the leaching rate of E. angustifolia L. BP. The contour map is an ellipse, indicating that there is an interaction between the two factors. The closer to the circle, the smaller the interaction. The color in the response surface fades from green to red, indicating an increase in the response value. The red area corresponds to the highest extraction rate, and the green area corresponds to the lowest value. The darkest or brightest areas, such as the red highlights, often indicate the global optimal combination of parameters.
According to the quadratic regression model established by response surface analysis, the optimum extraction conditions of E. angustifolia L. BP were as follows: enzyme ratio, 4.76:1; ultrasonic time, 52.97 min; liquid-to-solid ratio, 11.93:1 mL/g; and pH, 5.087. The BP yield was 14.093 mg/g. According to the actual operation, the parameters were adjusted as follows: enzyme ratio of 5:1, ultrasonic time of 50 min, liquid-to-solid ratio of 12:1 mL/g, and pH of 5. Five parallel experiments were conducted according to these process conditions. The BP yield was 13.970 ± 0.3 mg/g, which was consistent with the predicted value given by the model. Therefore, the model was feasible, and the optimized process parameters were accurate and reliable.

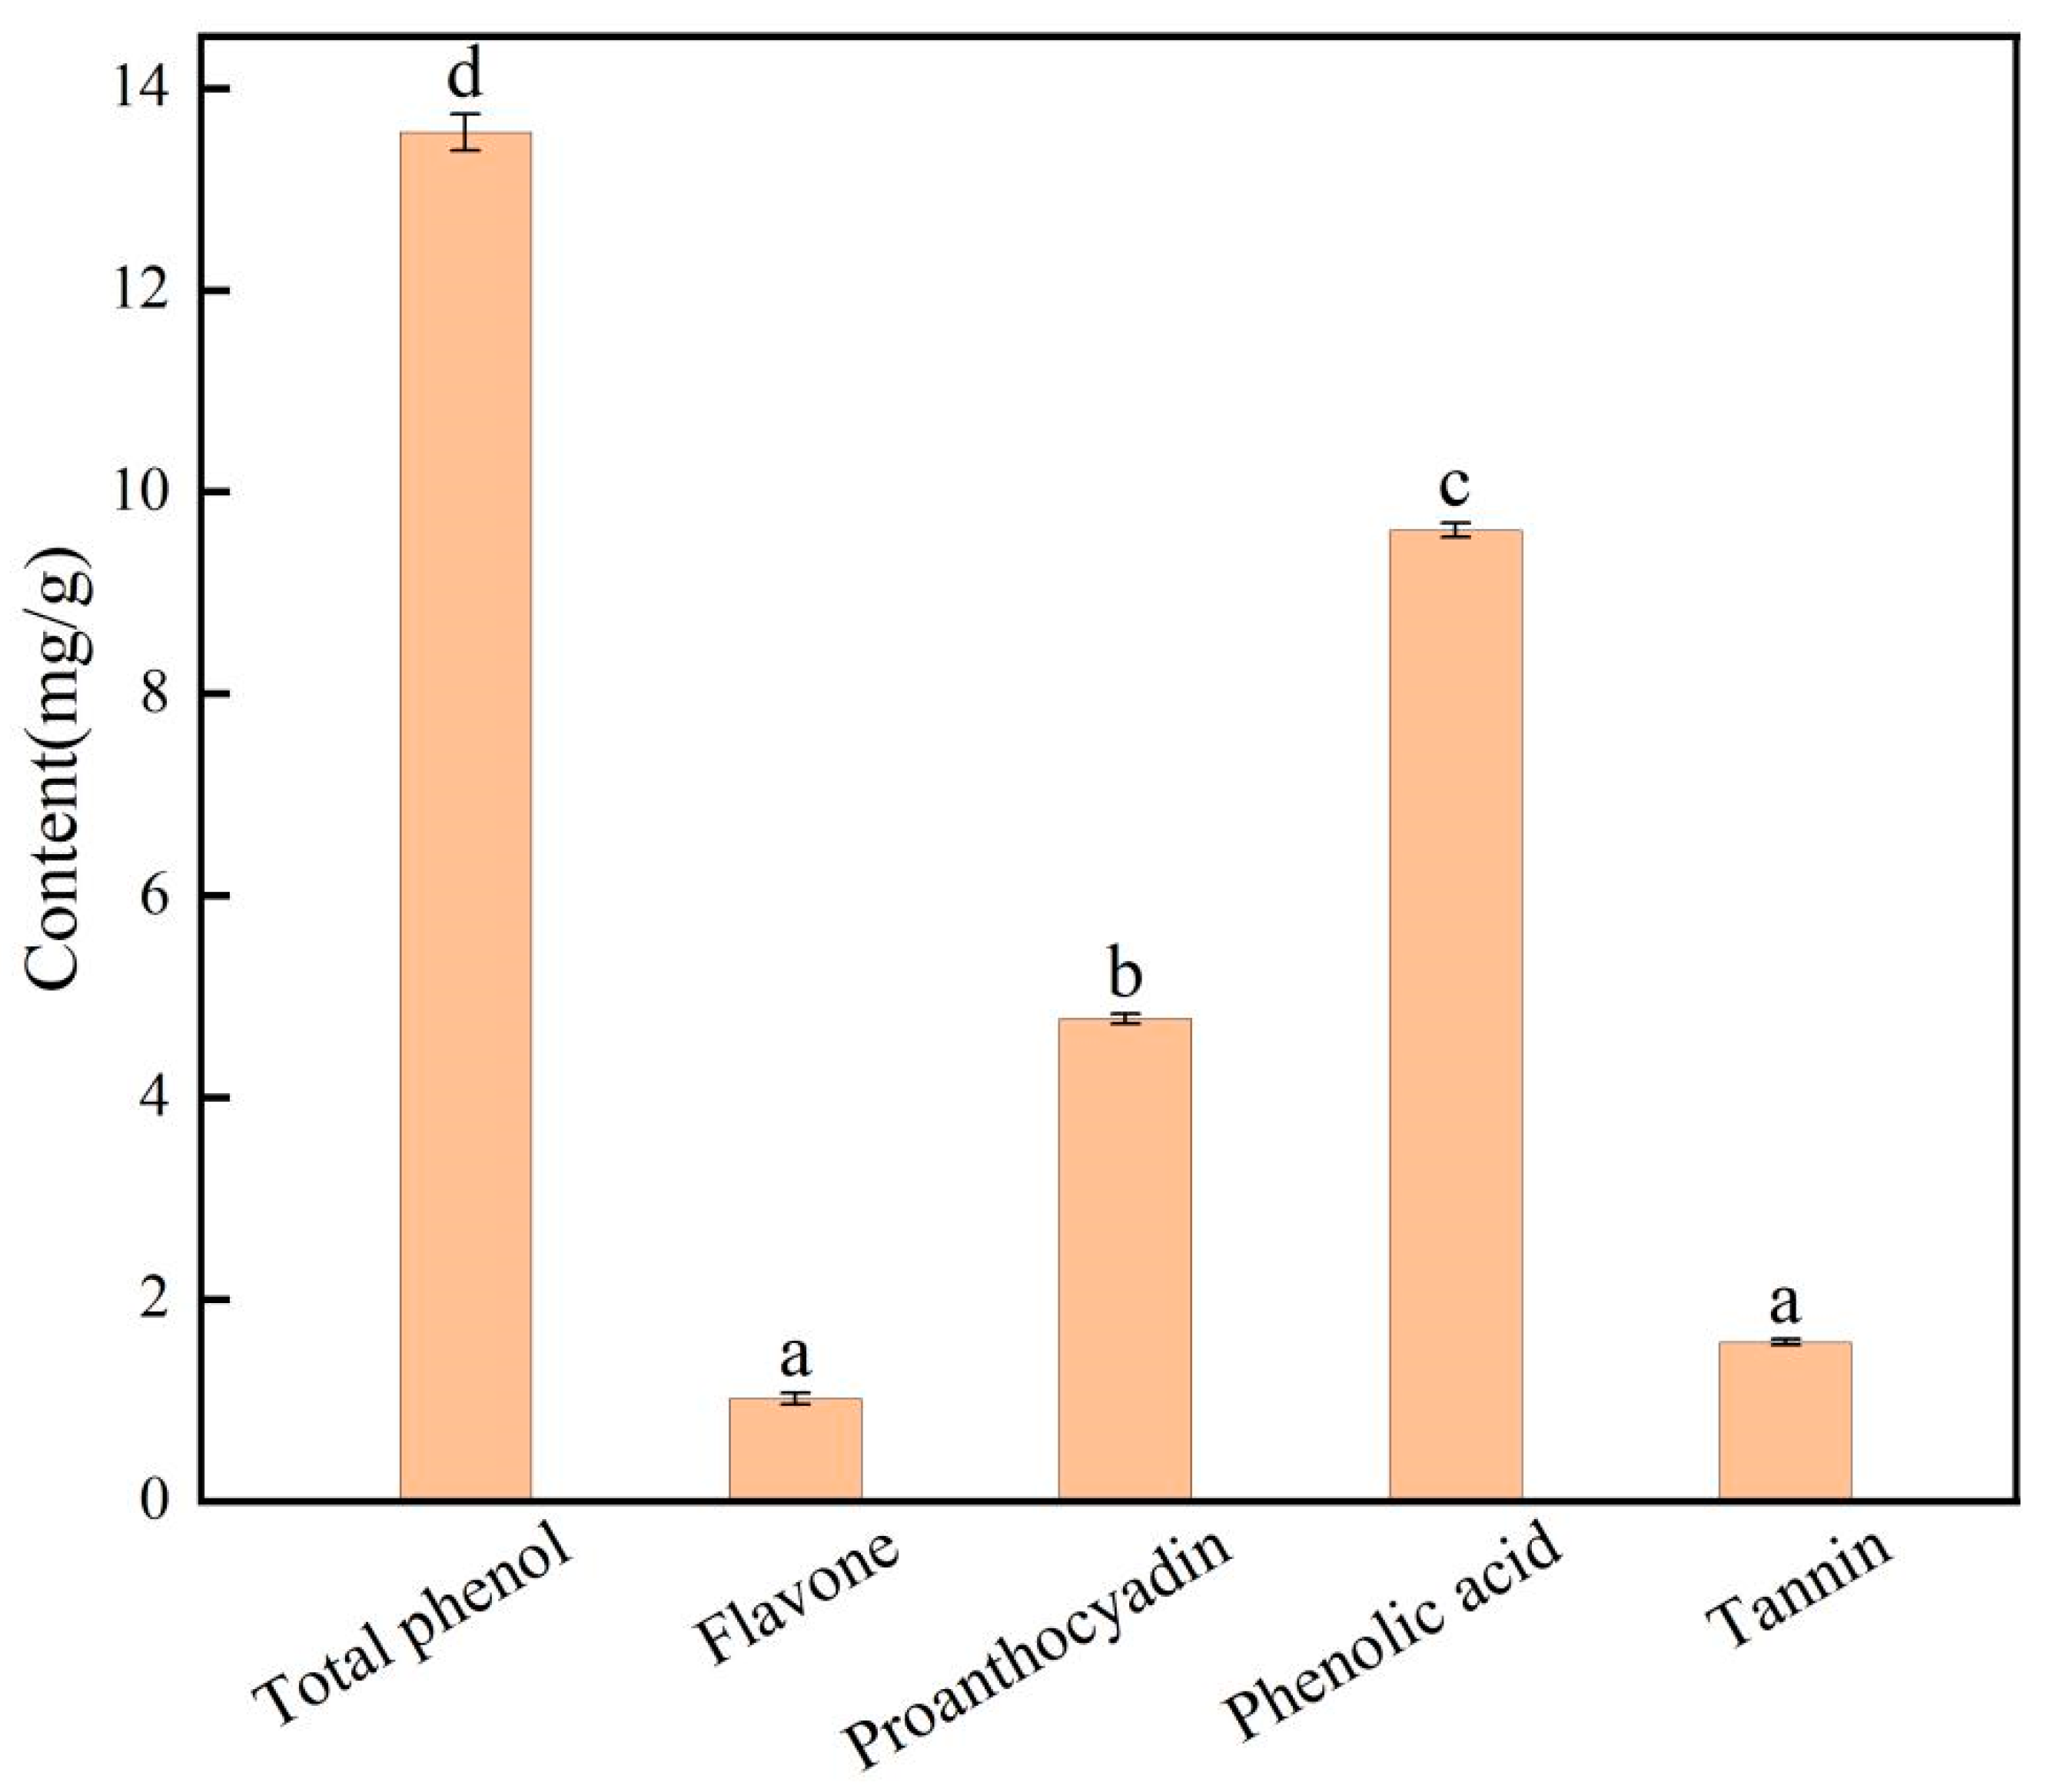
2.3. Determination of Phenols

Phenol Content of E. angustifolia L.

The standard regression equation and correlation coefficient of the combined polyphenols of E. angustifolia L. are shown in Table 3, and results show that the linear relationship with the components is good.
The phenolic compound content of E. angustifolia L. is shown in Figure 3. After the response surface optimization test, the polyphenol content of E. angustifolia L. BP was up to 13.566 mg/g. The phenolic acid content was 9.622 mg/g, and the proanthocyanidin, tannin, and flavonoid contents were 4.783, 1.575, and 1.015 mg/g, respectively. Results showed that E. angustifolia L. is rich in polyphenols, imparting it with good biological function and antioxidant activity.

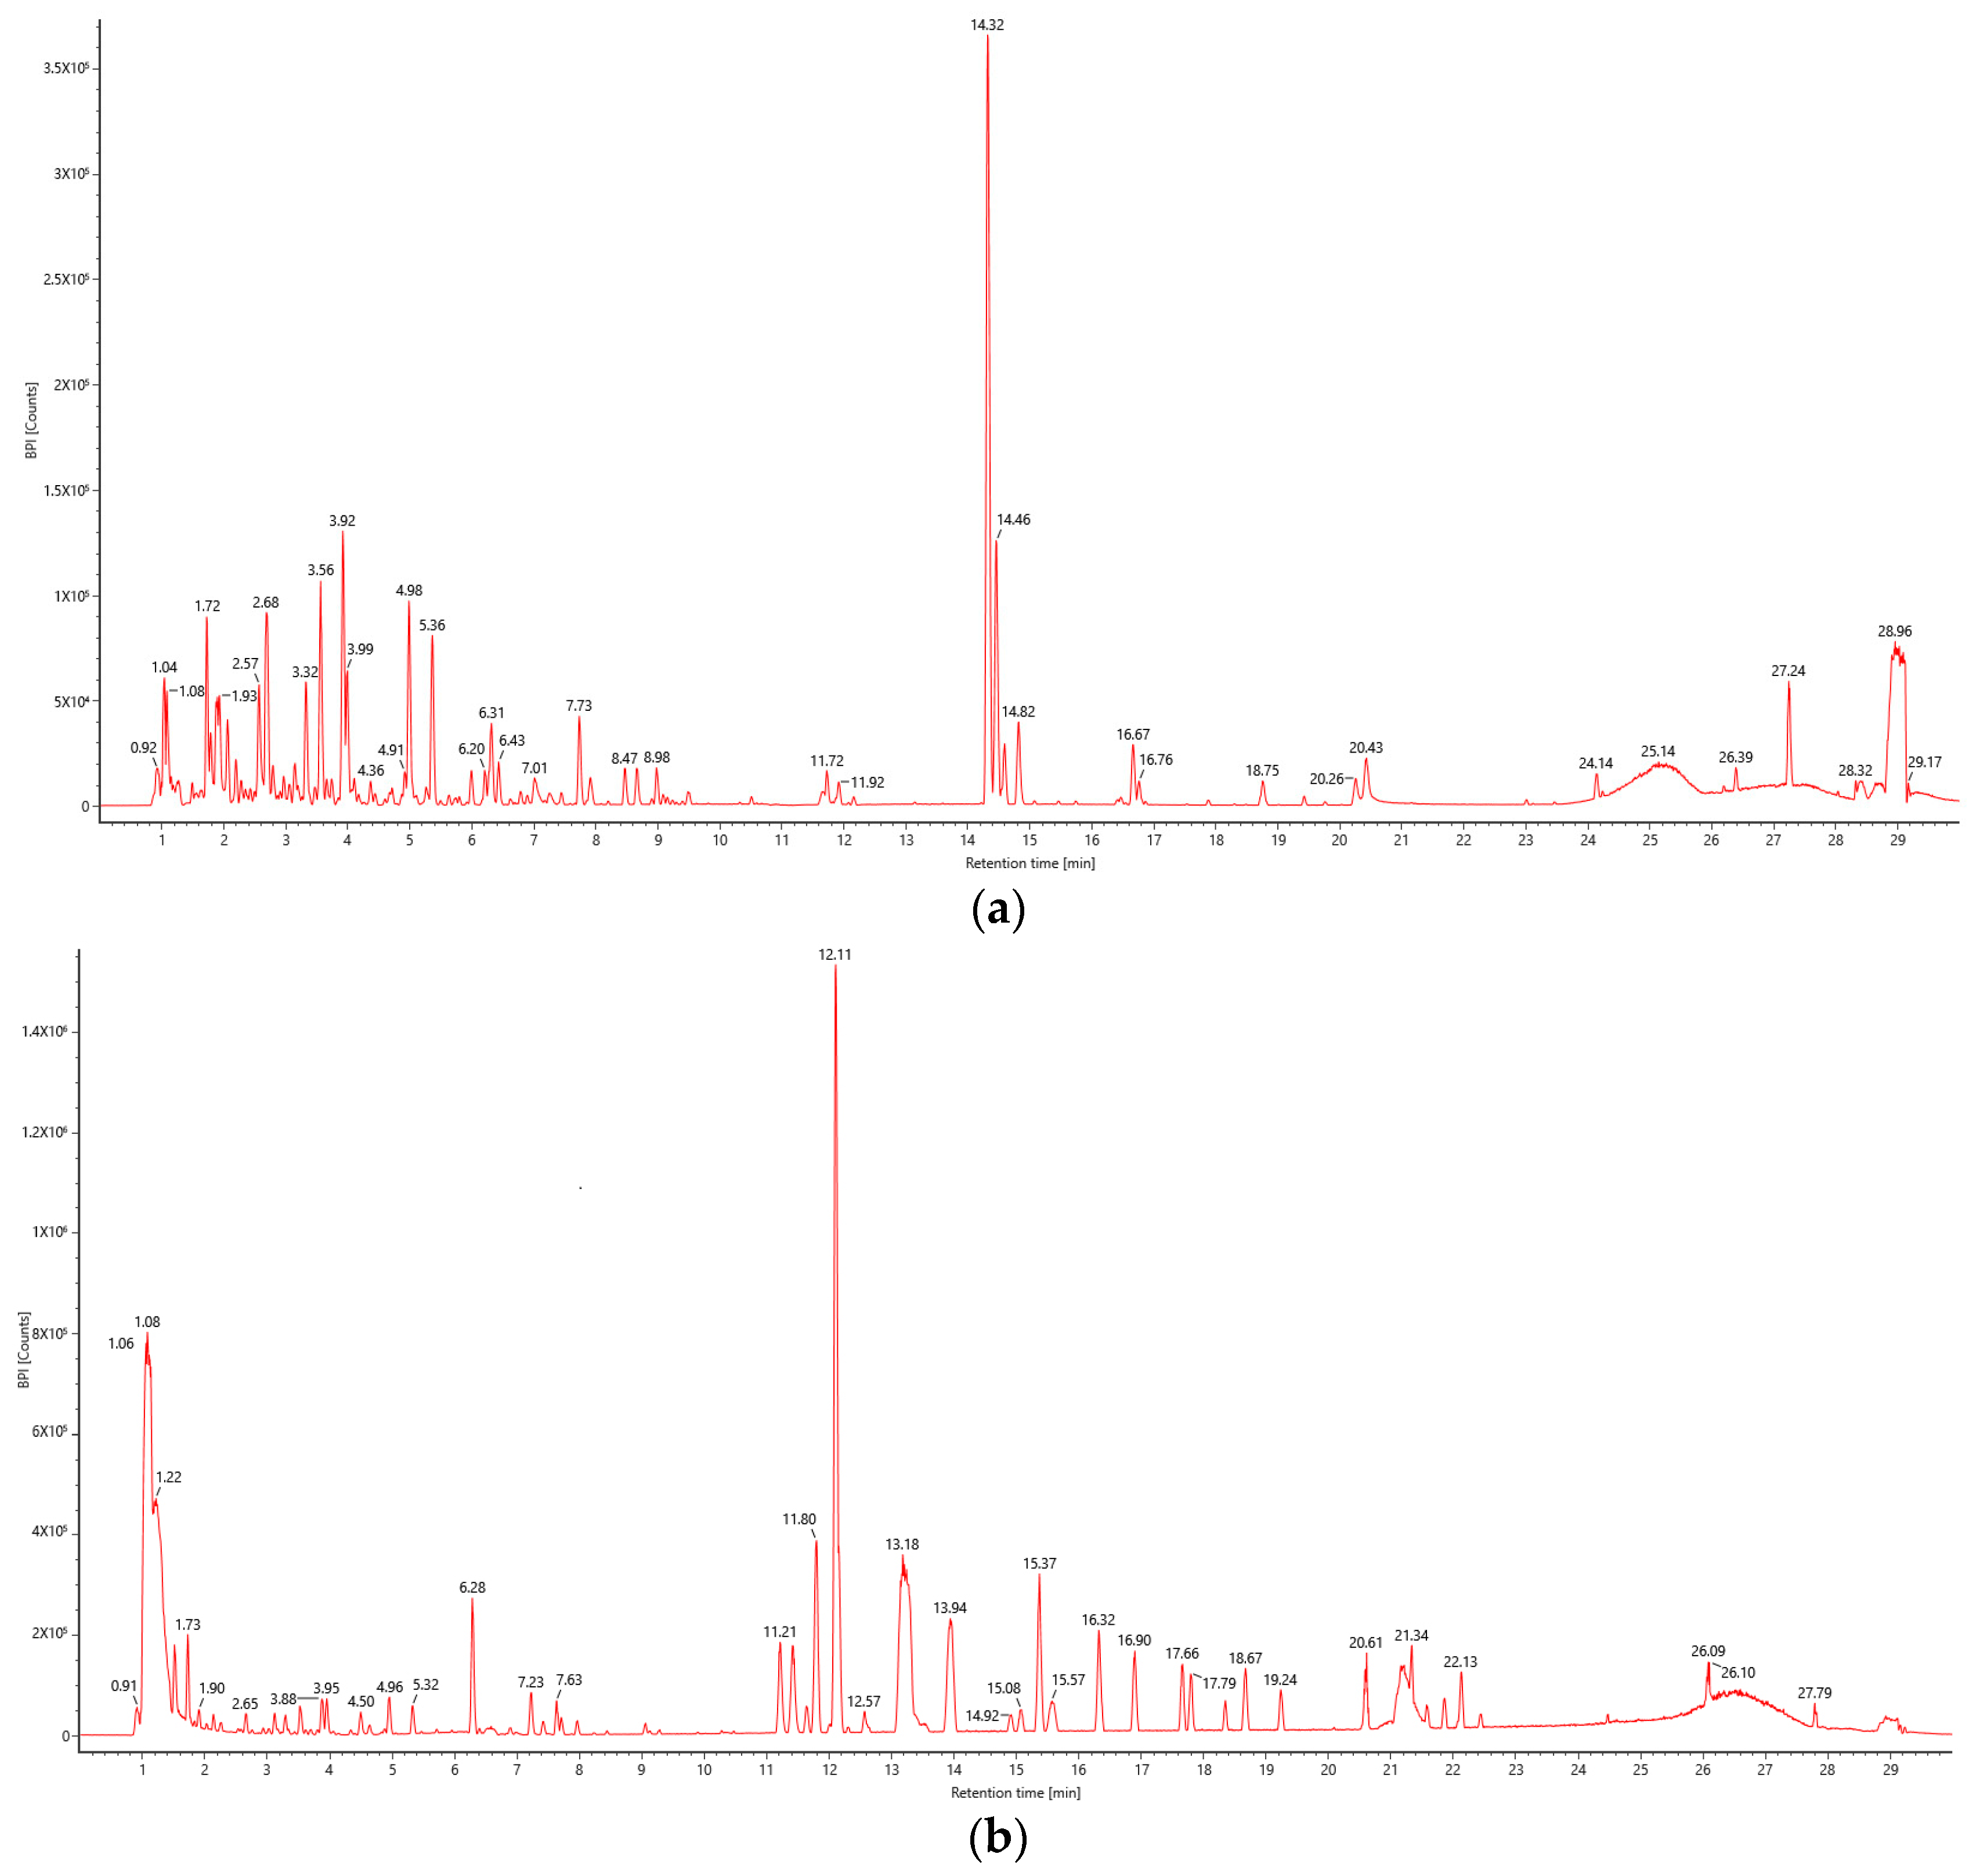
2.4. Qualitative Analysis of BPs of E. angustifolia L.

The chemical constituents of the extract were studied by UPLC–IMS-QTOF-MS, and the first-order total ion flow map in ion mode was obtained, as shown in Figure 4. The results obtained by the parent ion mass-to-charge ratio, the ion information of the characteristic fragments, and the reference to the relevant literature [41,42] are shown in Table 4. A total of 27 compounds were identified in the BP freeze-dried powder of E. angustifolia L., including two coumarins, five lignins, 10 polyphenols, nine flavonoids, and one tannin.
It is well known that Angeloylgomisin Q is a kind of lignin, as shown in Table 4. Some researchers [43,44] have concluded that Angeloylgomisin Q shows moderate activity in anti-HIV-1 activity screening, and may play an antiviral role by interfering with the viral replication cycle. Lin Rong-Jyh et al. showed [45] that Yakuchinone A was the main component of A.oxyphylla, which had anti-inflammatory, antitumor, antibacterial, and gastric protective activities. Ji Yun Baek et al. [46] found that Furosin could scavenge free radicals and inhibit apoptosis, protecting HT22 neurons from glutamate-induced oxidative damage. Some researchers [47] had found that 6-Dehydrogingerdione can activate the Keap1-Nrf2-ARE pathway, up-regulate glutathione synthase and HO-1, protect PC12 cells from oxidative damage, and has good antioxidant activity. It can be seen that BP extracted from E. angustifolia L. was an active ingredient with multiple active functions. This is conducive to opening up the market in the food, pharmaceutical, and cosmetics industries.

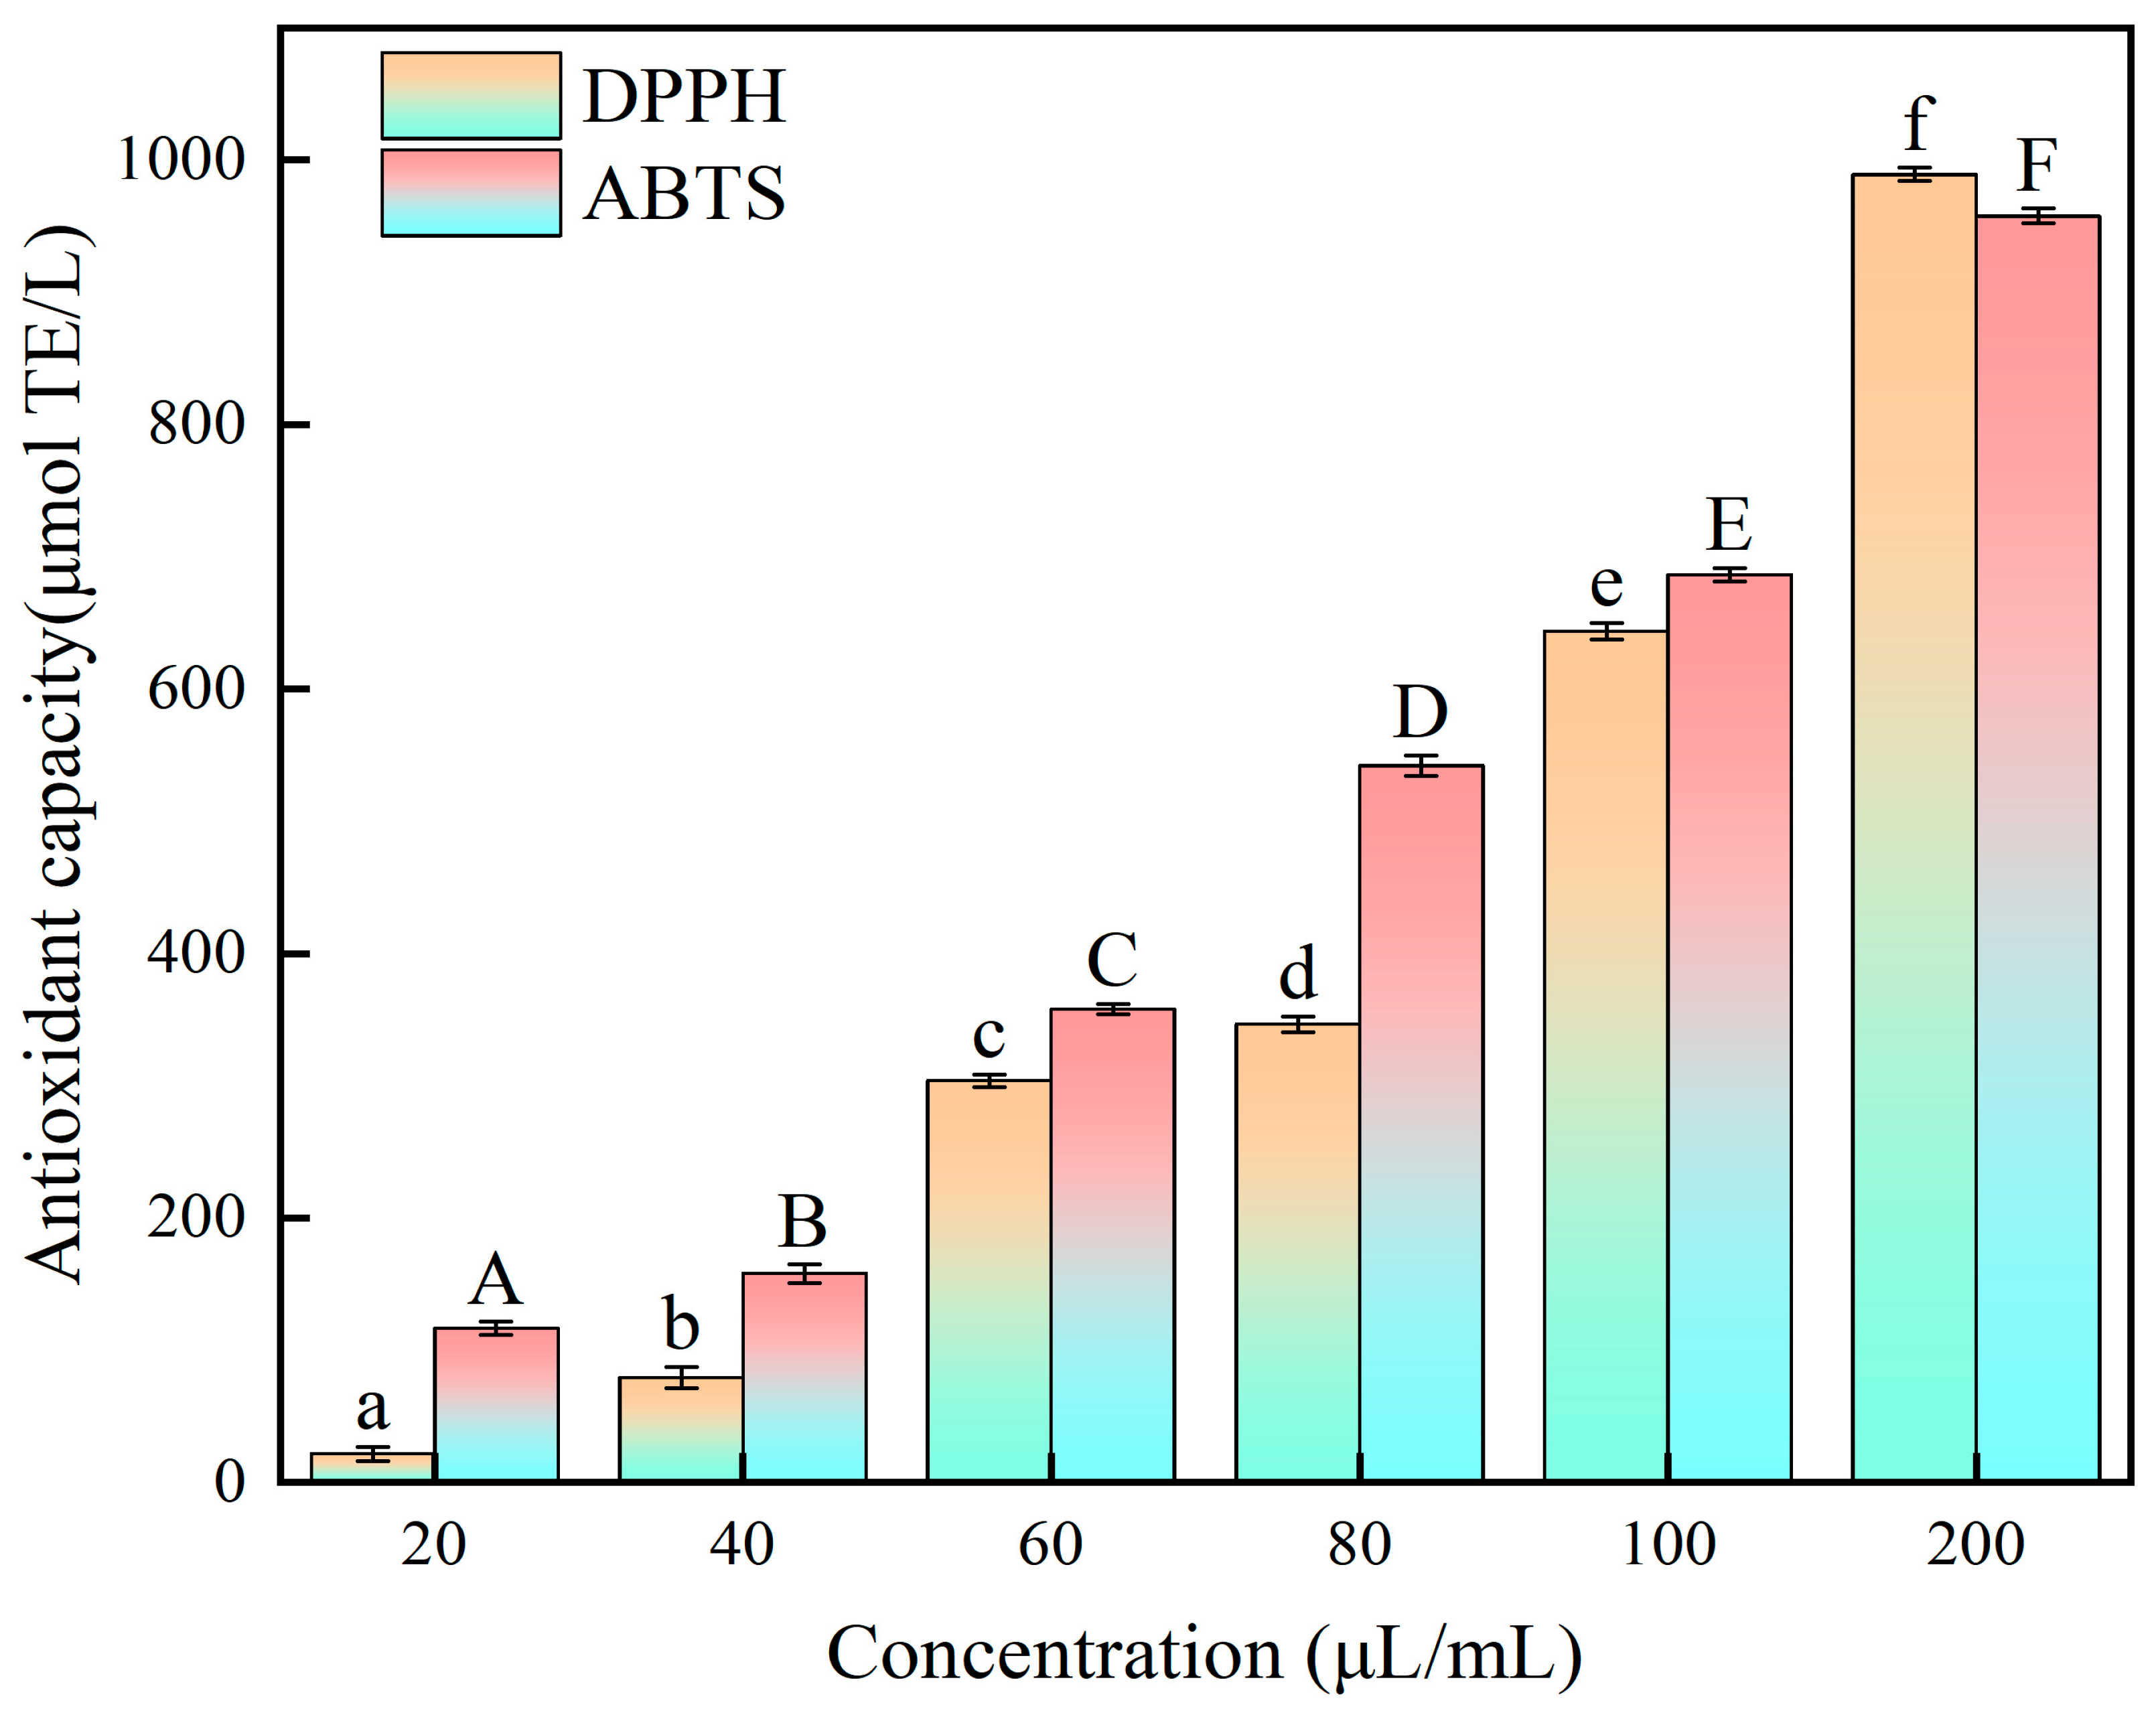
2.5. Antioxidant Analysis of E. angustifolia L. BP Extracts In Vitro

The scavenging ability of the BP extract on DPPH and ABTS free radicals is shown in Figure 5. As the concentration of the BP extract increased, the scavenging ability increased. When the concentration of the BP extract was 20–100 μL/mL, the scavenging ability of ABTS was higher than that of DPPH. This may be because the ABTS free radical has higher water solubility and electron transfer ability and the DPPH free radical is more stable [48]. The ABTS radical is more easily formed in aqueous solution. Therefore, its scavenging ability may be more affected by the water solubility of polyphenols [49,50]. When the addition amount was 200 μL/mL, the scavenging ability of DPPH was higher than that of ABTS. The different values obtained by different free radicals depend on the polarity and symbiotic mechanism of the compounds. More importantly, the mechanisms of different free radicals are different [51], which are the potential reasons for this situation. For the ABTS radical, phenolic compounds reduce free radicals through single electron transfer (SET) or hydrogen atom transfer (HAT) mechanisms [52]. Phenolic compounds act as electron donors and directly transfer electrons to ABTS to form stable phenolic oxygen radicals and reduced ABTS [53]. For the DPPH free radical, phenols can transfer electrons first, then release protons, and can also be transferred through HAT. The phenolic hydroxyl group directly provides hydrogen atoms to terminate the free radical chain reaction. Most importantly, phenols first dissociate protons in the solvent to form anions, and then transfer electrons [51]. All of the above are the possible mechanisms of phenols in the DPPH free radical reaction.
It is a common method to evaluate antioxidant capacity with ABTS and DPPH. Lu et al. [54] determined the DPPH free radical scavenging activity of onion BP, and the results were 447.14–623.95 μmol TE/g. Qin et al. [55] determined that the IC50 values of DPPH and ABTS+ were 0.0599 and 0.0121 mg/mL, respectively. Xiao et al. [56] determined the DPPH and ABTS scavenging ability of different varieties of rice bran BP, and the DPPH and ABTS scavenging ability ranges were 3.97–6.68 and 7.8–11.8 mgVC/gDW, respectively. In general, with an increase in polyphenol concentration, the scavenging rates of DPPH and ABTS free radicals gradually increase. In a lower concentration range, the clearance rate increases significantly with an increase in concentration. In a higher concentration range, the clearance increases slowly with an increase in concentration [57]. When the additional amount of BP extract was 200 μL/mL, the scavenging ability of DPPH and ABTS was as high as 989.28 and 957.86 μmol Trolox/L, respectively. This indicates that BP has good antioxidant activity.

3. Materials and Methods

3.1. Materials and Reagents

Xinjiang E. angustifolia L. samples were collected in 2024. α-Amylase (3700 U/g), cellulase (50 U/mg), Folin phenol solution, vanillin, and anhydrous sodium carbonate were obtained from Tuckblue Biotechnology Co., Ltd. (Alar, China). In addition, gallic acid, proanthocyanidins, Trolox standards, and rutin were provided by Sigma. Anhydrous ethanol, sodium nitrite, aluminum nitrate, NaOH, DPPH, ABTS, etc., were provided by Dingyuan Biotechnology Co., Ltd. (Alar, China).

3.2. Test Instruments

UPLC–IMS-QTOF-MS (Waters, Milford, MA, USA), a UV–visible spectrophotometer (J6, Shanghai Jinghua, Shanghai, China), an rE-3000A rotary evaporator (Xi’an Hepu, Xianxi, China), a TGL-20B high-speed desktop centrifuge (Shanghai anting, Shanghai, China), an SB-5200DT ultrasonic cleaning machine (Guangzhou Huruiming Instrument Co., Ltd., Hangzhou, China), a pilot3–6 m automatic silicone oil circulation system freeze-drying machine (Beijing Boyikang Experimental Instrument Co., Ltd., Beijing, China), a Synergy H1 multifunction microplate reader (BIO-TEK, Palo Alto, CA, USA), and an LE2002E electronic balance were used in the experiments (Satorius, Gottingen, Germany).

3.3. Removal of FP from E. angustifolia L.

To avoid the influence of FP in E. angustifolia L. on the analysis of the results, it should be extracted completely before extracting BP. According to the method described in literature reference [58], E. angustifolia L. was dried in a 45 °C drying oven, and the core was removed. E. angustifolia L. pulp was ground into powder and sieved by a 40 mesh screen, and refrigerated. Dry powder (200 g) was added to 75% ethanol at a liquid-to-solid ratio of 20:1 mL/g. After ultrasonication at room temperature (25 °C) for 30 min, the extract was centrifuged at 8000 r/min for 10 min, and the precipitate was repeatedly extracted more than three times according to the above steps until the extract did not contain phenolic substances, using the Folin–Ciocalteu method. The supernatant was collected, and the precipitate was recovered and dried at 40 °C.

3.4. Extraction of BP from E. angustifolia L.

With reference to the method of previous studies [59], slightly modified, BP was extracted. E. angustifolia L. without FP (1 g) was accurately weighed and hydrolyzed with a certain amount of compound enzyme solution. After ultrasonic extraction at a certain temperature for a period of time, it was centrifuged (8000 r/min, 10 min), the precipitate was extracted twice again, and the supernatant was combined for later use.

3.5. Design of Single-Factor Experiment for BP Extraction of E. angustifolia L.

According to the previous test, the ultrasonic temperature should be controlled at 50 °C, and the control variable method was used. The fixed factor level involved an enzyme ratio of α-amylase/cellulase = 5:1 mg/mg, an ultrasonic time of 50 min, a liquid-to-solid ratio of 12:1 mL/g, and pH 5. The effects of different enzyme ratios (1:3, 1:1, 3:1, 5:1, and 7:1 mg/mg), ultrasonic times (30, 50, 70, 90, and 110 min), liquid-to-solid ratios (8:1, 12:1, 16:1, 20:1, and 24:1 mL/g), and pH (3, 4, 5, 6, and 7) on the BP yield from E. angustifolia L. by ultrasound-assisted enzymatic extraction were investigated.

3.6. Experimental Design of Response Surface

Based on a single-factor test, the optimal factors and levels were selected. The enzyme ratio (A), time (B), liquid-to-solid ratio (C), and pH (D) were used as independent variables, and the BP yield of E. angustifolia L. (Y) was used as the target value. A response surface optimization test of four factors and three levels was designed. The levels of the experimental factors are shown in Table 5.

3.7. Determination of Phenolic Compound Content

3.7.1. Determination of Total Phenol

The total phenol content was determined by the Folin–Ciocalteu colorimetric method [60]. Here, 0.1 mg/mL gallic acid standard solution (0, 0.1, 0.2, 0.3, 0.4, 0.5, and 0.6 mL) was accurately measured in a 25 mL colorimetric tube, added with distilled water to 10 mL, added with 0.3 mL of Folin–Ciocalteu reagent, shaken well, and allowed to stand at room temperature for 5 min. Then, 1 mL of 15% sodium carbonate solution was added and shaken well. Absorbance was measured at 746 nm after reaction at 25 °C for 2 h in the dark. A standard curve was plotted with the mass concentration of gallic acid (X) as the abscissa and the absorbance value (Y) as the ordinate.
The extract was diluted to obtain the sample solution to be tested. The absorbance of 0.2 mL of the solution was measured using the abovementioned method, and the BP content was calculated using the following formula:
Y = c × D × V × 10 3 m .
where Y represents BP content (mg/g), c is the mass concentration of the test solution (μg/mL), D stands for dilution multiple, V is the sample liquid volume (mL), and m is the mass of the raw material quality (g).

3.7.2. Flavone Determination

Determination of flavonoids was determined using the method described by Zhao et al. [61]. The 0.15 g/L rutin standard solution was added with 0, 1.0, 2.0, 3.0, 4.0, 5.0, and 6.0 mL, respectively. Distilled water was added to the test tube to 6 mL, and 1 mL of 5% sodium nitrite was added to each test tube for 6 min. Then, 1 mL of 10% aluminum nitrate solution was added for 6 min of reaction. Finally, 4% sodium hydroxide was added to make the volume of 25 mL, and the absorbance was measured at 510 nm. Taking the rutin (X) mass concentration as the horizontal axis and absorbance (Y) as vertical axis, the standard curve was plotted to get a straight line. Then, the standard curve was used for regression, and the content of total flavonoids in the sample was obtained.

3.7.3. Determination of Proanthocyanidins

Total proanthocyanidins were determined using the hydrochloric acid–vanillin method, as described by Lv et al. [62], with slight modifications. Then, 1 mg/mL proanthocyanidin standard solution was diluted into five gradients of 0.5, 0.4, 0.3, 0.2, and 0.1 mg/mL, and 1 mL of each gradient standard solution was accurately measured and added to a mixture containing 6 mL of vanillin–methanol solution and 3 mL of concentrated hydrochloric acid. The mixture was quickly mixed and reacted for 20 min under dark conditions. Absorbance was measured at a wavelength of 500 nm. The blank control was anhydrous methanol. A standard curve was drawn with the mass concentration of proanthocyanidin (X) as the abscissa and the absorbance value (Y) as the ordinate. The proanthocyanidin content in the sample extract was calculated using the standard curve regression equation.

3.7.4. Determination of Phenolic Acid

The Kumaran et al. [63] method was slightly modified, and the gallic acid standard at 1.0 mg/mL was diluted with five gradients (0.2, 0.4, 0.6, 0.8, 1.0 mg/mL). A series of concentration gradients of gallic acid reference solution 0.1 mL, Folin phenol reagent 0.5 mL, and 20% sodium carbonate 1.5 mL were mixed evenly, and then diluted with distilled water to a 10 mL volumetric flask, placed at 25 °C for 2.0 h, using distilled water as a blank, and the absorbance was measured at a wavelength of 765 nm. The content of phenolic acid was obtained by fitting the standard curve with the gallic acid content (X) as the horizontal axis and the absorption rate (Y) as the vertical axis.

3.7.5. Determination of Total Tannins

The tannin content was determined using the hydrochloric acid–vanillin method, with reference to the slightly modified method reported by Hao et al. [64]. Then, 0, 1.0, 2.0, 3.0, 4.0, and 5.0 mL of 1 mg/mL catechin standard solution were accurately removed and diluted to 10 mL with methanol solution. Each 0.5 mL was transferred to six test tubes wrapped with aluminum platinum paper, 3 mL of 4% vanillin–methanol solution, and 1.5 mL of concentrated hydrochloric acid were added and reacted at 20 °C for 20 min, and absorbance was measured at a wavelength of 510 nm. A standard curve was drawn with catechin mass concentration (X) as the abscissa and absorbance value (Y) as the ordinate, and the tannin content in the sample extract was calculated using the regression equation of the standard curve.

3.8. Qualitative Analysis of BP in E. angustifolia L.

Referring to previous research [65], the qualitative analysis of the BP component was slightly modified. Here, 10 mg of freeze-dried E. angustifolia L. BP powder was accurately weighed, and 1 mL of purified water and 1 mL of mass spectrometry methanol were added. The mixture was shaken to completely dissolve the powder and centrifuged at 10,000 rpm for 10 min. UPLC–IMS-QTOF-MS analysis was performed after filtration using a 0.22 μm filter membrane.
The chromatographic conditions were as follows: An ACQUITY UPLC-BEH C18 chromatographic column (2.1 mm × 100 mm; particle size, 1.7 μm) was used. Mobile phase A was acetonitrile/methanol = 9:1, and mobile phase B was 0.1% formic acid aqueous solution. The column temperature was 25 °C. The volume of injection was 1 μL. The mobile phase elution conditions were 0–27 min, 95% B; 27–28 min, 100% B; 28–28.1 min, 100% B; and 28.1–30 min, 95% B.
The mass spectrometry conditions were as follows: An ESI ionization source and positive and negative ion modes were used. The capillary voltage was 2.5 kV, and the cone hole voltage was 40.0 V. The desolvation temperature was 500 °C; the relative molecular mass scanning range (m/z) was 50–2000; the scanning time was 0.2 s; the cone gas flow rate was 50 L/h; the desolvation gas flow rate was 100 L/h; the ion source temperature was 120 °C; and the desolvation gas temperature was 500 °C.

3.9. Study on Antioxidant Activity In Vitro of BP Extract of E. angustifolia L.

3.9.1. DPPH Radical Scavenging Assay

According to the reports by Li and Sathasivam [66,67], extracts of different concentrations were prepared, and 100 μL of each extract was added to 3.9 mL of 25 mg/L DPPH solution. Afterward, absorbance was measured at 517 nm for 20 min in the dark. Trolox was prepared with 0–1000 μmol/L Trolox, and the DPPH free radical scavenging activity was calculated by the standard curve. The regression equation of the standard curve was obtained: Y = −0.0006X + 0.6459, R2 = 0.9946. The results were expressed as μmol Trolox/L.

3.9.2. Determination of ABTS Free Radical Scavenging Ability

The ABTS radical scavenging ability test was slightly modified by referring to the method reported by Dong et al. [68]. The ABTS cation radical was prepared by reacting ABTS stock solution (7 mmol/L) with potassium persulfate (2.45 mmol/L) at room temperature for 12–16 h in the dark. The ABTS free radical solution was diluted with methanol to reach an absorbance of 0.70 ± 0.02 at 734 nm. Samples (100 μL) with different solubilities were prepared and placed in 3.9 mL of ABTS solution, and absorbance was measured at 734 nm after reaction for 8 min in the dark. The standard curve of ABTS free radical capture ability was prepared and analyzed by preparing a 0–1000 μmol/L Trolox standard sample. The results show that the fitting results of the model are Y = −0.0007X + 0.7015, R2 = 0.9981; the results were expressed with μmol Trolox/L.

3.10. Statistical Analysis

All the results needed more than 3 experiments. The experimental design of the response surface analysis was established by using Design-Expert V13.0.1.5 software to improve the extraction method. SPSS statistical V27.0.1 software was used for statistical analysis. The difference was statistically significant when p < 0.05.

4. Conclusions

In summary, the ultrasonic-assisted enzymatic method was used to extract bound polyphenols from E. angustifolia L., and the key parameters were optimized by the Box–Behnken design. The optimum conditions were as follows: enzyme ratio (α-amylase/cellulase = 5:1 mg/mg), ultrasonic time of 50 min, liquid-to-solid ratio of 12:1 mL/g, and pH value of 5. Under these conditions, the bound polyphenol yield was measured at 13.970 ± 0.3 mg/g. A total of 27 phenolic compounds were identified by UPLC–IMS-QTOF-MS. Finally, through DPPH and ABTS antioxidant tests, when the additional amount of BP extract was 200 μL/mL, the scavenging abilities of DPPH and ABTS were as high as 989.28 and 957.86 μmol Trolox/L. This indicates that E. angustifolia L. BP has good antioxidant activity. This study increased our understanding of the medicinal and edible value of E. angustifolia L., provided an improved theoretical basis for the most effective use of E. angustifolia L., and provided potential functional food ingredients for the food industry. However, further research is required to delve deeper into the antioxidant and other biological activities of E. angustifolia L. BPs, as well as their specific mechanisms of action and biological accessibility within the human body.

Author Contributions

Conceptualization, J.L., L.L., Z.L., W.W. and N.Z.; Methodology, J.L.; Software, L.L., N.Z. and Q.J.; Data curation, J.L. and Z.L.; Writing—original draft, J.L. and N.Z.; Funding acquisition, N.Z. All authors have read and agreed to the published version of the manuscript.

Funding

This research was funded by the National Natural Science Foundation of China (No. 32360579), and the Bingtuan Science and Technology Program (No. 2024DA045).

Institutional Review Board Statement

Not applicable.

Informed Consent Statement

Not applicable.

Data Availability Statement

The original contributions presented in the study are included in the article, further inquiries can be directed to the corresponding author.

Conflicts of Interest

The authors declare that they have no known competing financial interests or personal relationships that could have appeared to influence the work reported in this paper.

References

  1. Han, J.X.; Chen, X.Y.; Liu, W.; Cui, H.; Yuan, T. Triterpenoid saponin and lignan glycosides from the traditional medicine Elaeagnus angustifolia flowers and their cytotoxic activities. Molecules 2020, 25, 462. [Google Scholar] [CrossRef] [PubMed]
  2. Hamidpour, R.; Hamidpour, S.; Hamidpour, M.; Shahlari, M.; Sohraby, M.; Shahlari, N.; Hamidpour, R. Russian olive (Elaeagnus angustifolia L.): From a variety of traditional medicinal applications to its novel roles as active antioxidant, anti-inflammatory, anti-mutagenic and analgesic agent. J. Tradit. Complement. Med. 2017, 7, 24–29. [Google Scholar] [CrossRef] [PubMed]
  3. Jia, X.; Zhao, Y.; Zhu, Y.; Zeng, X.; Liang, X.; Xie, J.; Wu, F. Ethnobotany of wild edible plants in multiethnic areas of the gansu–ningxia–inner mongolia junction zone. J. Ethnobiol. Ethnomed. 2022, 18, 53. [Google Scholar] [CrossRef]
  4. Zhao, Y.Y.; Fang, S.J.; Zhang, Z.; Qi, H.M.; Bo, X.M.; Wei, J.; Wu, J. Optimization of extraction process of polysaccharide from Elaeagnus angustifolia flower and its proliferation effect on probiotics. Food Ind. Sci. Technol. 2023, 44, 134–142. [Google Scholar] [CrossRef]
  5. Jabeen, A.; Sharma, A.; Gupta, I.; Kheraldine, H.; Vranic, S.; Al Moustafa, A.-E.; Al Farsi, H.F. Elaeagnus angustifolia plant extract inhibits epithelialmesenchymal transition and induces apoptosis via HER2 inactivation and JNK pathway in HER2-positive breast cancer cells. Molecules 2020, 25, 4240. [Google Scholar] [CrossRef]
  6. Yang, S.; Liu, T.; Zhang, H.X.; Li, H.Y.; Zhang, L. Growth performance and physiological characteristics of Elaeagnus angustifolia seedlings under salt stress. J. Fujian For. Univ. 2014, 34, 64–70. [Google Scholar] [CrossRef]
  7. Kang, J.; Cui, J.Y. Comparison of nutritional components of Elaeagnus angustifolia in different regions of Xinjiang. Food Res. Dev. 2008, 29, 133–134. [Google Scholar]
  8. Du, H.; Chen, J.; Tian, S.; Gu, H.; Li, N.; Sun, Y.; Ru, J.; Wang, J. Extraction optimization, preliminary characterization and immunological activities in vitro of polysaccharides from Elaeagnus angustifolia L. pulp. Carbohydr. Polym. 2016, 151, 348–357. [Google Scholar] [CrossRef]
  9. Abela, R.; Ji, B.; Zhou, F. Research progress on nutrition, active ingredients and pharmacological effects of Elaeagnus angustifolia fruit. Food Ind. Sci. Technol. 2018, 39, 343–352. [Google Scholar] [CrossRef]
  10. Wang, T.; Lin, X.N.; Liu, N.; Liu, Y.G. The main active substances of Elaeagnus angustifolia and their application in food. Chin. Fruit Veg. 2023, 43, 42–48. [Google Scholar] [CrossRef]
  11. Olagaray, K.E.; Bradford, B.J. Plant flavonoids to improve productivity of ruminants—A review. Anim. Feed Sci. Technol. 2019, 251, 21–36. [Google Scholar] [CrossRef]
  12. Weng, W.; Zhang, Q.M.; Li, S.K.; Zhu, J.F. Research progress on antiviral effect and mechanism of plant polyphenols. Chin. J. Tradit. Chin. Med. 2020, 35, 6236–6240. [Google Scholar]
  13. Liu, X.; Ma, Q.; Sun, Y.; Ju, W.; Kumrungsee, T.; Zhou, Z.; Wang, L.; Cao, R. Effects of processings and complexation on solubility, antioxidant and antibacterial properties of buckwheat polyphenols. Food Bioprocess Technol. 2024, 17, 1583–1595. [Google Scholar] [CrossRef]
  14. Phan, A.D.T.; Netzel, G.; Wang, D.; Flanagan, B.M.; D’Arcy, B.R.; Gidley, M.J. Binding of dietary polyphenols to cellulose: Structural and nutritional aspects. Food Chem. 2015, 171, 388–396. [Google Scholar] [CrossRef]
  15. Gorzynik-Debicka, M.; Przychodzen, P.; Cappello, F.; Kuban-Jankowska, A.; Marino Gammazza, A.; Knap, N.; Wozniak, M.; Gorska-Ponikowska, M. Potential health benefits of olive oil and plant polyphenols. Int. J. Mol. Sci. 2018, 19, 686. [Google Scholar] [CrossRef]
  16. Yan, C.Z.; Ye, F.Y.; Zhao, G.H. Research progress of polyphenols in food. Food Sci. 2015, 36, 249–254. [Google Scholar] [CrossRef]
  17. Zhang, M.W. Research progress on phenolic compounds and antioxidant activity of whole grains. Food Process. 2016, 41, 28–36. [Google Scholar]
  18. Zhou, Z. The distribution of phenolic acids in rice. Food Chem. 2004, 87, 401–406. [Google Scholar] [CrossRef]
  19. Mora-Rochin, S.; Gutiérrez-Uribe, J.A.; Serna-Saldivar, S.O.; Sánchez-Peña, P.; Reyes-Moreno, C.; Milán-Carrillo, J. Phenolic content and antioxidant activity of tortillas produced from pigmented maize processed by conventional nixtamalization or extrusion cooking. J. Cereal Sci. 2010, 52, 502–508. [Google Scholar] [CrossRef]
  20. Boateng, I.D. Mechanisms, capabilities, limitations, and economic stability outlook for extracting phenolics from agro-byproducts using emerging thermal extraction technologies and their combinative effects. Food Bioprocess Technol. 2024, 17, 1109–1140. [Google Scholar] [CrossRef]
  21. Lv, J.J.; Li, L.; Zhang, N. Research progress on the release and functional activity of bound polyphenols in plant foods. Food Ind. Sci. Technol. 2025, 46, 404–413. [Google Scholar] [CrossRef]
  22. Wen, C.; Zhang, J.; Zhang, H.; Dzah, C.S.; Zandile, M.; Duan, Y.; Ma, H.; Luo, X. Advances in ultrasound assisted extraction of bioactive compounds from cash crops—A review. Ultrason. Sonochem. 2018, 48, 538–549. [Google Scholar] [CrossRef] [PubMed]
  23. Chemat, F.; Abert Vian, M.; Fabiano-Tixier, A.; Nutrizio, M.; Režek Jambrak, A.; Munekata, P.E.S.; Lorenzo, J.M.; Barba, F.J.; Binello, A.; Cravotto, G. A review of sustainable and intensified techniques for extraction of food and natural products. Green Chem. 2020, 22, 2325–2353. [Google Scholar] [CrossRef]
  24. Gonzales, G.B.; Smagghe, G.; Raes, K.; Van Camp, J. Combined alkaline hydrolysis and ultrasound-assisted extraction for the release of nonextractable phenolics from cauliflower (Brassica oleracea var. botrytis) waste. J. Agric. Food Chem. 2014, 62, 3371–3376. [Google Scholar] [CrossRef]
  25. Dzah, C.S.; Duan, Y.; Zhang, H.; Ma, H. Effects of pretreatment and type of hydrolysis on the composition, antioxidant potential and hepg2 cytotoxicity of bound polyphenols from tartary buckwheat (Fagopyrum tataricum L. Gaerth) hulls. Food Res. Int. 2021, 142, 110187. [Google Scholar] [CrossRef]
  26. Zhao, K.H.; Zhang, R.F.; Su, D.X.; Dong, L.H.; Liu, L.; Wei, Z.C.; Zhang, M.W. Research progress on phenolic compounds and antioxidant activity of whole grains. Chin. J. Food Sci. 2017, 17, 183–196. [Google Scholar] [CrossRef]
  27. Li, W.T. Study on the Composition, Gastrointestinal Bioaccessibility and Antioxidant Activity of Different Bound Polyphenols in Six Kinds of Legumes. Master’s Thesis, Nanchang University, Nanchang, China, 2018. [Google Scholar]
  28. Anica, D.; Shilpa, S.; Tulasi, S. Progress in Ameliorating Beneficial Characteristics of Microbial Cellulases by Genetic Engineering Approaches for Cellulose Saccharification. Front. Microbiol. 2020, 11, 1387. [Google Scholar]
  29. Ding, Y.; Tang, S.Y.; Hou, H.X.; Dong, H.Z.; Zhang, J.L. Effects of hydrolysis conditions on the release of phenolic acids in wheat bran. Chin. Food Nutr. 2012, 18, 52–58. [Google Scholar]
  30. Mu, T.H.; Ye, J.; Yang, M.J.; Miao, J.L.; Wang, X.J.; Zhou, X.T.; Zhang, W.W. Study on extraction process optimization and storage stability of pomegranate peel polyphenols. Food Ind. Sci. Technol. 2021, 42, 142–146. [Google Scholar] [CrossRef]
  31. Boateng, I.D.; Mustapha, A.; Daubert, C.R.; Kuehnel, L.; Kumar, R.; Flint-Garcia, S.; Agliata, J.; Wan, C.; Somavat, P. Novel two-pot microwave extraction of purple corn pericarp’s phenolics and evaluation of the polyphenol-rich extract’s product quality, bioactivities, and structural properties. Food Bioprocess Technol. 2023, 16, 2668–2691. [Google Scholar] [CrossRef]
  32. Liu, Y.; Li, L.Q.; Li, X.F. Optimization of ultrasonic-assisted extraction process and antioxidant activity of polyphenols from bayberry core-shell. Packag. Food Mach. 2021, 39, 8–12, 83. [Google Scholar] [CrossRef]
  33. Liu, R.Q.; Zong, N.Y.; Yang, S.M.; Peng, R.; Li, R.Y. Optimization of ultrasonic-assisted enzymatic extraction of polyphenols from Zizyphus mauritiana and its antioxidant activity. Chem. Eng. 2024, 38, 1–6+11. [Google Scholar] [CrossRef]
  34. Jiao, P.; He, X.; Ma, S.; Wang, S.; Niu, Q. Ultrasonic-Assisted Extraction of Antioxidants from Perilla frutescens Leaves Based on Tailor-Made Deep Eutectic Solvents: Optimization and Antioxidant Activity. Molecules 2023, 28, 7554. [Google Scholar] [CrossRef] [PubMed]
  35. Pei, P.; Tao, H.L.; Cai, L.J.; Wei, S.S.; Yuan, Y.M.; Yang, W.J.; Hu, Q.H. Response surface test optimized the ultrasonic-assisted extraction process of polyphenols from Moringa oleifera leaves and its antioxidant activity. Food Sci. 2016, 37, 24–30. [Google Scholar] [CrossRef]
  36. Gao, Y.; Feng, Y.; Lv, Z.; Su, J.Y.; Feng, Y. Enzymatic hydrolysis to release sweet potato bound phenols. Food Res. Dev. 2022, 43, 118–125. [Google Scholar] [CrossRef]
  37. Hemwimol, S.; Pavasant, P.; Shotipruk, A. Ultrasound-assisted extraction of anthraquinones from roots of Morinda citrifolia. Ultrason. Sonochem. 2006, 13, 543–548. [Google Scholar] [CrossRef]
  38. Wang, H.B.; Wang, S.; Fu, L. Study on enzymatic extraction of pomegranate peel polyphenols. Chin. J. Food Sci. 2012, 12, 56–65. [Google Scholar] [CrossRef]
  39. Hatiguli, A.; Shi, L.L.; Jia, X.Y.; Shi, M.H. Optimization of extraction process of total flavonoids and polyphenols from Elaeagnus moorcroftii based on response surface methodology. Chin. Folk. Med. 2025, 34, 34–43. [Google Scholar]
  40. Honda, S.; Ishida, R.; Hidaka, K.; Masuda, T. Stability of Polyphenols under Alkaline Conditions and the Formation of a Xanthine Oxidase Inhibitor from Gallic Acid in a Solution at pH 7.4. Food Sci. Technol. Res. 2019, 25, 123–129. [Google Scholar] [CrossRef]
  41. Arigò, A.; Česla, P.; Šilarová, P.; Calabrò, M.L.; Česlová, L. Development of extraction method for characterization of free and bonded polyphenols in barley (Hordeum vulgare L.) Grown in czech republic using liquid chromatography-tandem mass spectrometry. Food Chem. 2018, 245, 829–837. [Google Scholar] [CrossRef]
  42. Wu, N.; Zhu, B.S.; Zhang, X.; Dong, F.Y.; Liu, J.; Cheng, F.; Deng, Z.Y.; Ban, Y. Changes of active components and antioxidant capacity of Phyllanthus emblica fruit and ethanol extract during simulated digestion in vitro. Food Ind. Technol. 2023, 44, 349–358. [Google Scholar] [CrossRef]
  43. Li, D.; Wan Ibadullah, W.Z.; Shukri, R.; Duan, Q.; Gu, Y.; Mustapha, N.A. The effects of different extraction methods on the yield, microstructure, and antioxidant activity of polysaccharides from Rhodomyrtus tomentosa berry. Food Bioprocess Technol. 2024, 18, 3719–3731. [Google Scholar] [CrossRef]
  44. Xu, X.; Wang, D.; Li, Y.; Deyrup, S.T.; Zhang, H. Plant-derived lignans as potential antiviral agents: A systematic review. Phytochem. Rev. 2021, 21, 239–289. [Google Scholar] [CrossRef] [PubMed]
  45. Rong-Jyh, L.; Chuan-Min, Y.; Tzung-Han, C.; Feng-Yu, C.; Guey-Horng, W.; Ya-Ping, T.; Lin, W.; Ting-Wei, H.; Hui-Chuan, W.; Leong-Perng, C.; et al. Antioxidant, anti-adipocyte differentiation, antitumor activity and anthelmintic activities against anisakis simplex and Hymenolepis nana of yakuchinone a from Alpinia oxyphylla. BMC Complement. Altern. Med. 2013, 13, 237. [Google Scholar]
  46. Baek, J.Y.; Song, J.H.; Choi, S.Y. Protective effect of furosin isolated from Euphorbia helioscopia against glutamate-induced ht22 cell death. J. Korean Med. 2018, 39, 35–43. [Google Scholar] [CrossRef]
  47. Yao, J.; Ge, C.; Duan, D.; Zhang, B.; Cui, X.; Peng, S.; Liu, Y.; Fang, J. Activation of the phase ii enzymes for neuroprotection by ginger active constituent 6-dehydrogingerdione in pc12 cells. J. Agric. Food. Chem. 2014, 62, 5507–5518. [Google Scholar] [CrossRef]
  48. Al-Rajhi, A.M.H.; Ghany, T.M.A. In vitro repress of breast cancer by bio-product of edible Pleurotus ostreatus loaded with chitosan nanoparticles. Appl. Biol. Chem. 2023, 66, 33. [Google Scholar] [CrossRef]
  49. Liang, H.M.; Ren, J.B.; Li, Y.K.; Gao, D.Y.; Hu, W.X. Improved DPPH and ABTS free radical methods were used to evaluate the antioxidant capacity of different grape seed oils. Chin. J. Grain Oil 2018, 33, 85–91. [Google Scholar] [CrossRef]
  50. López-Téllez, J.M.; Del Pilar Cañizares-Macías, M. Evaluation of tomato (Lycopersicon esculentum p. Mill.) By-product extracts obtained by different extraction methods as exploitation strategy of high-value polyphenols. Food Bioprocess Technol. 2024, 17, 3217–3235. [Google Scholar] [CrossRef]
  51. Qi, W.S.; Rong, L.; Tao, J.Z.; Ying, W.; Jin, T.; Hua, T.S. Evaluation of antioxidant active ingredients of spikenard essential oil by ultra-fast gas chromatography electronic nose and radical scavenging mechanism. Ind. Crops Prod. 2020, 151, 112489. [Google Scholar]
  52. Yu, L.; Beta, T. Identification and Antioxidant Properties of Phenolic Compounds during Production of Bread from Purple Wheat Grains. Molecules 2015, 20, 15525–15549. [Google Scholar] [CrossRef] [PubMed]
  53. Melanie, P.; Sandra, K.; Thomas, H.; Ute, S.; Oliver, M.; Peter, E. Common Trends and Differences in Antioxidant Activity Analysis of Phenolic Substances Using Single Electron Transfer Based Assays. Molecules 2021, 26, 1244. [Google Scholar] [CrossRef] [PubMed]
  54. Lu, Y.L.; Wang, B.; Liu, C.; Zubaidan, A.; Gao, C.Y. Antioxidant activity and digestive enzyme inhibition of polyphenol extracts from Allium mongolicum Regel. Chin. J. Food 2024, 24, 164–177. [Google Scholar]
  55. Qin, Y.Z.; He, Y.; Feng, Y.T.; Fan, F.Y. Optimization of ultrasonic-assisted alkaline extraction of bound polyphenols from Rosa sterilis and analysis of its antioxidant activity. Food Ind. Sci. Technol. 2024, 45, 1–9. [Google Scholar]
  56. Xiao, Y.T.; Yan, C.; Wang, F.; Wang, R.H.; Zhu, W. Comparative Study on Polyphenol Components and Antioxidant Activity of Indica and Japonica Rice Bran. Chin. J. Grain Oil 2023, 38, 76–81. [Google Scholar]
  57. Ordóñez, R.M.; Cardozo, M.L.; Zampini, I.C.; Isla, M.I. Evaluation of antioxidant activity and genotoxicity of alcoholic and aqueous beverages and pomace derived from ripe fruits of Cyphomandra betacea sendt. J. Agric. Food Chem. 2010, 58, 331–337. [Google Scholar] [CrossRef]
  58. Wang, Y.; Zeng, W.J.; Zhang, Y.T.; Buerhan, J.; Li, Y.P.; Ding, J.B.; Li, R.R.; Yang, J. Comparison of alkali hydrolysis and acid hydrolysis extraction process of bound polyphenols from Lycii Fructus and product analysis. Res. Dev. Nat. Prod. 2024, 36, 632–643. [Google Scholar] [CrossRef]
  59. Hoyos, M.N.; Huertas, L.F.V.; Vargas, J.D.C.; Aguilar, V.L.; Corella, D.A.; Baudrit, J.R.V.; Esquivel, L.G.R.; Kopper, A.S.; Navarro, A.M.; Sibaja, A.M.A. HRMS Characterization and Antioxidant Evaluation of Costa Rican Spent Coffee Grounds as a Source of Bioactive Polyphenolic Extracts. Foods 2025, 14, 448. [Google Scholar] [CrossRef]
  60. Zhang, N.; Liu, L.; Li, L.; Lv, J.J.; Dong, Y.Y. Optimization of ultrasonic-assisted extraction process of polyphenols from Taraxacum mongolicum root and its antioxidant and hypoglycemic activities in vitro. Food Ind. Technol. 2024, 45, 200–208. [Google Scholar] [CrossRef]
  61. Zhao, D.; Dai, Q.; Zhang, Y.; Shen, H.; Mao, Y.; Zhou, X.; Chen, X.; Pang, H.; Wang, H.; Liu, L. Identification of Miscanthus floridulus as a promising anti-alzheimer’s disease and antidiabetic agent through bioactivity evaluations and chemical composition analyses. Arab. J. Chem. 2024, 17, 106037. [Google Scholar] [CrossRef]
  62. Lv, Q.; Luo, F.; Zhao, X.; Liu, Y.; Hu, G.; Sun, C.; Li, X.; Chen, K. Identification of proanthocyanidins from litchi (Litchi chinensis sonn.) Pulp by lc-esi-q-tof-ms and their antioxidant activity. PLoS ONE 2015, 10, 120480. [Google Scholar] [CrossRef] [PubMed]
  63. Kumaran, A.; Joel Karunakaran, R. In vitro antioxidant activities of methanol extracts of five Phyllanthus species from india. Lwt—Food Sci. Technol. 2007, 40, 344–352. [Google Scholar] [CrossRef]
  64. Hao, Y.; Wang, Y.P.; Li, J.L.; Jin, Y.P. Study on the dynamic changes of total flavonoids, total flavonols and total phenolic acids in the leaves of Schisandra chinensis at different harvest times. Shizhen Tradit. Chin. Med. 2021, 32, 2500–2502. [Google Scholar]
  65. Xin, Q.Y.; Min, X.H.; Tian, Z.T.; Xue, L.; Ying, H.; Da, W.H.; Mei, G.X.; Zhi, Y.W. Ultra-high performance liquid chromatography/ion mobility-quadrupole time-of-flight mass spectrometry and database-driven automatic peak annotation for the rapid profiling and characterization of the multicomponents from Stephaniae tetrandrae radix (Fang-Ji). World J. Tradit. Chin. Med. 2021, 7, 120–134. [Google Scholar]
  66. Li, J.F.; Diao, J.J.; Cheng, Z.H.; Gao, X.; Chang, J.M. Analysis of chemical constituents of grape seed extract and determination of multi-component content based on ultra-high performance liquid chromatography-tandem mass spectrometry. Food Ferment. Ind. 2024, 50, 303–312. [Google Scholar] [CrossRef]
  67. Sathasivam, R.; Kim, N.S.; Lim, J.; Yang, S.H.; Kim, B.; Park, H.W.; Kim, J.K.; Park, S.U. Comprehensive analysis of primary and secondary metabolites and antioxidant activities provides insights into metabolic profiling of different organs of Pimpinella brachycarpa nakai. Food Chem. 2025, 468, 142394. [Google Scholar] [CrossRef]
  68. Dong, R.; Yu, Q.; Liao, W.; Liu, S.; He, Z.; Hu, X.; Chen, Y.; Xie, J.; Nie, S.; Xie, M. Composition of bound polyphenols from carrot dietary fiber and its in vivo and in vitro antioxidant activity. Food Chem. 2021, 339, 127879. [Google Scholar] [CrossRef]
Figure 1. Impact of various operating parameters on BP content: (a) effects of enzyme ratio; (b) ultrasound time; (c) liquid/solid ratio; (d) pH on the yield of BP. (Different letters represent significant differences, p < 0.05).
Foods 14 01567 g001
Figure 2. Effects of interaction of factors on BP yield. (a) Enzyme ratio/time. (b) Enzyme ratio/liquid/solid ratio. (c) Enzyme ratio/pH. (d) Time/liquid/solid ratio. (e) Time/pH. (f) Liquid/solid ratio/pH.
Foods 14 01567 g002
Figure 3. The content of bound phenols in E. angustifolia L. (Different letters represent significant differences, p < 0.05).
Foods 14 01567 g003
Figure 4. UPLC–IMS-QTOF-MS total ion diagram of E. angustifolia L. extract. (a): Positive ion mode; (b): negative ion mode.
Foods 14 01567 g004
Figure 5. Scavenging ability of DPPH and ABTS by BP extract of E. angustifolia L. (Different letters represent significant differences, p < 0.05).
Foods 14 01567 g005
Table 1. Response surface test design and results.
No.ABCDY (mg/g)
1110012.598
2010112.850
30−1−1012.499
4010−112.268
5000014.270
6−10−1013.000
7−101012.224
8101010.544
9100−112.100
10−100112.744
11100111.137
12−110012.645
130−10−112.356
140−11011.287
15000013.677
1600−1−112.477
17000013.970
1810−1012.532
19001111.551
2001−1012.470
21−1−10012.063
22−100−111.313
23000013.853
240−10112.082
25000014.138
261−10011.657
27011012.492
28001−112.389
2900−1112.627
Table 2. Analysis of variance for regression variance.
SourceSum of SquaresDegree of FreedomMean SquareF-Valuep-ValueSignificance
Model21.36141.5312.68<0.0001**
A0.975910.97598.110.0129*
B0.95110.9517.90.0139*
C2.1812.1818.130.0008**
D0.000610.00060.00530.9428
AB0.032210.03220.26730.6132
AC0.366910.36693.050.1026
AD1.4311.4311.910.0039**
BC0.380310.38033.160.0971
BC0.183410.18341.520.2373
CD0.244110.24412.030.1762
A27.8317.8365.11<0.0001**
B23.7513.7531.17<0.0001**
C25.3415.3444.37<0.0001**
D25.6315.6346.82<0.0001**
Residual1.68140.1203
Misfit term1.4100.14021.990.2654
Pure error0.282240.0706
Summation23.0428
Note: ** is very significant (p < 0.01), * is significant (p < 0.05).
Table 3. Standard regression equation and correlation coefficient of phenols.
Regression EquationCorrelation Coefficient
Total phenolsy = 1.8223x + 0.05790.9955
Flavoney = 1.1897x + 0.00070.9990
Proanthocyanidinsy = 0.572x − 0.00060.9961
Phenolic acidy = 1.0768x + 0.09010.9976
Tanniny = 1.458x + 0.0240.9984
Table 4. Identification and analysis results of chemical constituents of E. angustifolia L. extract.
IDRT (min)Chemical
Formula
First-Order Mass SpectrometrySecondary Fragments (m/z)Component NameType
Neutral Mass (m/z)Observed (m/z)
12.66C9H8O2148.0523147.045103.05463,4-DihydrocoumarinCoumarin
22.76C16H14O3226.0952225.0879147.04484′-MethylpinosylvinLignin
33.46 482.1894527.1876271.1294
331.1504
395.1465
2-Butenoic acid, 2-methyl-, (6R,7R,8R,14aS)-5,6,7,8-tetrahydro-1,2-dimethoxy-6,7-dimethyl-3-oxo-3H,14H-benzo [1,8] cycloocta [1,2,3-cd] [1,3] dioxolo [4,5-g] benzofuran-8-yl ester, (2Z)-rel-(-)Lignin
43.62C17H16O2252.1106251.1033221.0924EffusolPolyphenol
54.06C19H18O3294.1216293.1143275.10321,7-Bis (4-hydroxyphenyl) hepta-4,6-dien-3-oneFlavone
64.28C25H30O8358.1732403.1714241.1191Kadsurenin CLignin
74.98C29H38O9530.2535531.2607349.0756Angeloylgomisin QLignin
84.67C20H24O3312.1771335.1663119.0494Yakuchinone APolyphenol
96.18C9H10O3166.0626165.0553120.0214
121.0289
PaeonolPolyphenol
106.23 374.1686373.1613357.0982Cubeb oleoresinLignin
117.23C30H34O8522.2272523.2345221.1184Benzoylgomisin HPolyphenol
129.09C18H18O2266.1297284.1635221.0928JuncusolPolyphenol
1311.22 446.1216445.1143121.0292
313.0719
401.0882
3′-MethoxydaidzeinFlavone
1412.11C19H14O7356.09401.0882121.0293
313.0720
3-(1,3-Benzodioxol-5-ylmethyl)-3,4-dihydro-5,7-dihydroxy-8-methyl-4-oxo-2H-1-benzopyran-6-carboxaldehydeFlavone
1513.15C16H18O5290.113289.1057207.10295-O-MethylvisamminolFlavone
1613.32C10H10O4194.0615239.0597116.9948KakoulCoumarin
1713.37 342.0738341.0665109.0289
177.0556
3,8-Dihydroxy-4,10-dimethoxy-7-oxo-[2] benzopyrano [2] [1]benzopyran-7-(5H)-onePolyphenol
1813.71C14H14O6250.0841249.0767132.9904
165.0165
177.0921
3-Acetyl-3,4-dihydro-5,6-dimethoxy-2 (1) H-benzopyranoneCoumarin
1913.95C32H28O11600.1668599.1595221.1184Neosappanone APolyphenol
2015.54C15H14O6594.1373593.13549.1037Epiafzelechin-(2β-O-7,4β-8)-ent-EpicatechinFlavone
2115.6C30H26O13594.1403595.1476112.9853TilirosideFlavone
2215.69C18H16O7328.0951327.0878121.02915-Hydroxy-3′,4′,7-trimethoxyflavoneFlavone
2316.38C27H22O19650.0752649.0679426.9899FurosinTannin
2417.47C20H20O5340.1305339.1232277.0829
291.0989
6,7-dimethoxy-2-(2-(4-methoxyphenyl)ethyl)chromoneFlavone
2517.8C17H22O4292.1678291.1605245.15456-DehydrogingerdionePolyphenol
2620.6C14H22O206.1671205.1599189.12812-OctylphenolPolyphenol
2726.08C21H26O10438.1507437.1434183.0118
195.0626
Sec-O-GlucosylhamaudolPolyphenol
Table 5. Factors and levels of response surface design.
FactorLevels
−101
Enzyme ratio
(mg/mg)
A3:15:17:1
Time(min)B305070
Liquid-to-solid ratio(mL/g)C81216
pHD456
Disclaimer/Publisher’s Note: The statements, opinions and data contained in all publications are solely those of the individual author(s) and contributor(s) and not of MDPI and/or the editor(s). MDPI and/or the editor(s) disclaim responsibility for any injury to people or property resulting from any ideas, methods, instructions or products referred to in the content.

