Author Contributions
Conceptualization, M.X.; methodology, M.X. and L.A.; formal analysis, Y.S. and S.Y.; investigation, Y.S., S.Y., X.Z. (Xiaofeng Zhang), W.H., S.T., J.C., and X.Z. (Xiaoyun Zhou); resources, M.X. and L.A.; data curation, Y.S. and S.Y.; writing—original draft, Y.S.; writing—review and editing, Y.S. and L.A.; visualization, Y.S., S.Y., X.Z. (Xiaofeng Zhang), W.H., S.T., J.C., and X.Z. (Xiaoyun Zhou); supervision, M.X. and L.A. All authors have read and agreed to the published version of the manuscript.
Figure 1.
The effects of supplementing different concentrations of CX at normal temperature on DSM egg yolk color scores at 3, 6, and 9 weeks. (A) Representative images of egg yolks after continuous supplementation with different concentrations of CX for 3, 6, and 9 weeks under normal temperature; (B) The effect of continuous addition of CX for 3 weeks, 6 weeks, and 9 weeks on egg yolk color score under normal temperature. Scale bar 1 cm. Data for each treatment consist of 6 replicate samples, with each replicate comprising 2 eggs. The figure presents mean ± standard deviation. Different superscript letters a–d indicate significant differences (p < 0.05) among dietary CX supplementation doses within the same experimental period, as determined by one-way ANOVA. Abbreviations: NC, normal temperature control group; NCX4, supplementing the daily diet with an additional 4 mg/kg CX under normal temperature; NCX6, supplementing the daily diet with an additional 6 mg/kg CX under normal temperature; NCX8, supplementing the daily diet with an additional 8 mg/kg CX under normal temperature; NCX10, supplementing the daily diet with an additional 10 mg/kg CX under normal temperature.
![Foods 14 00950 g001]()
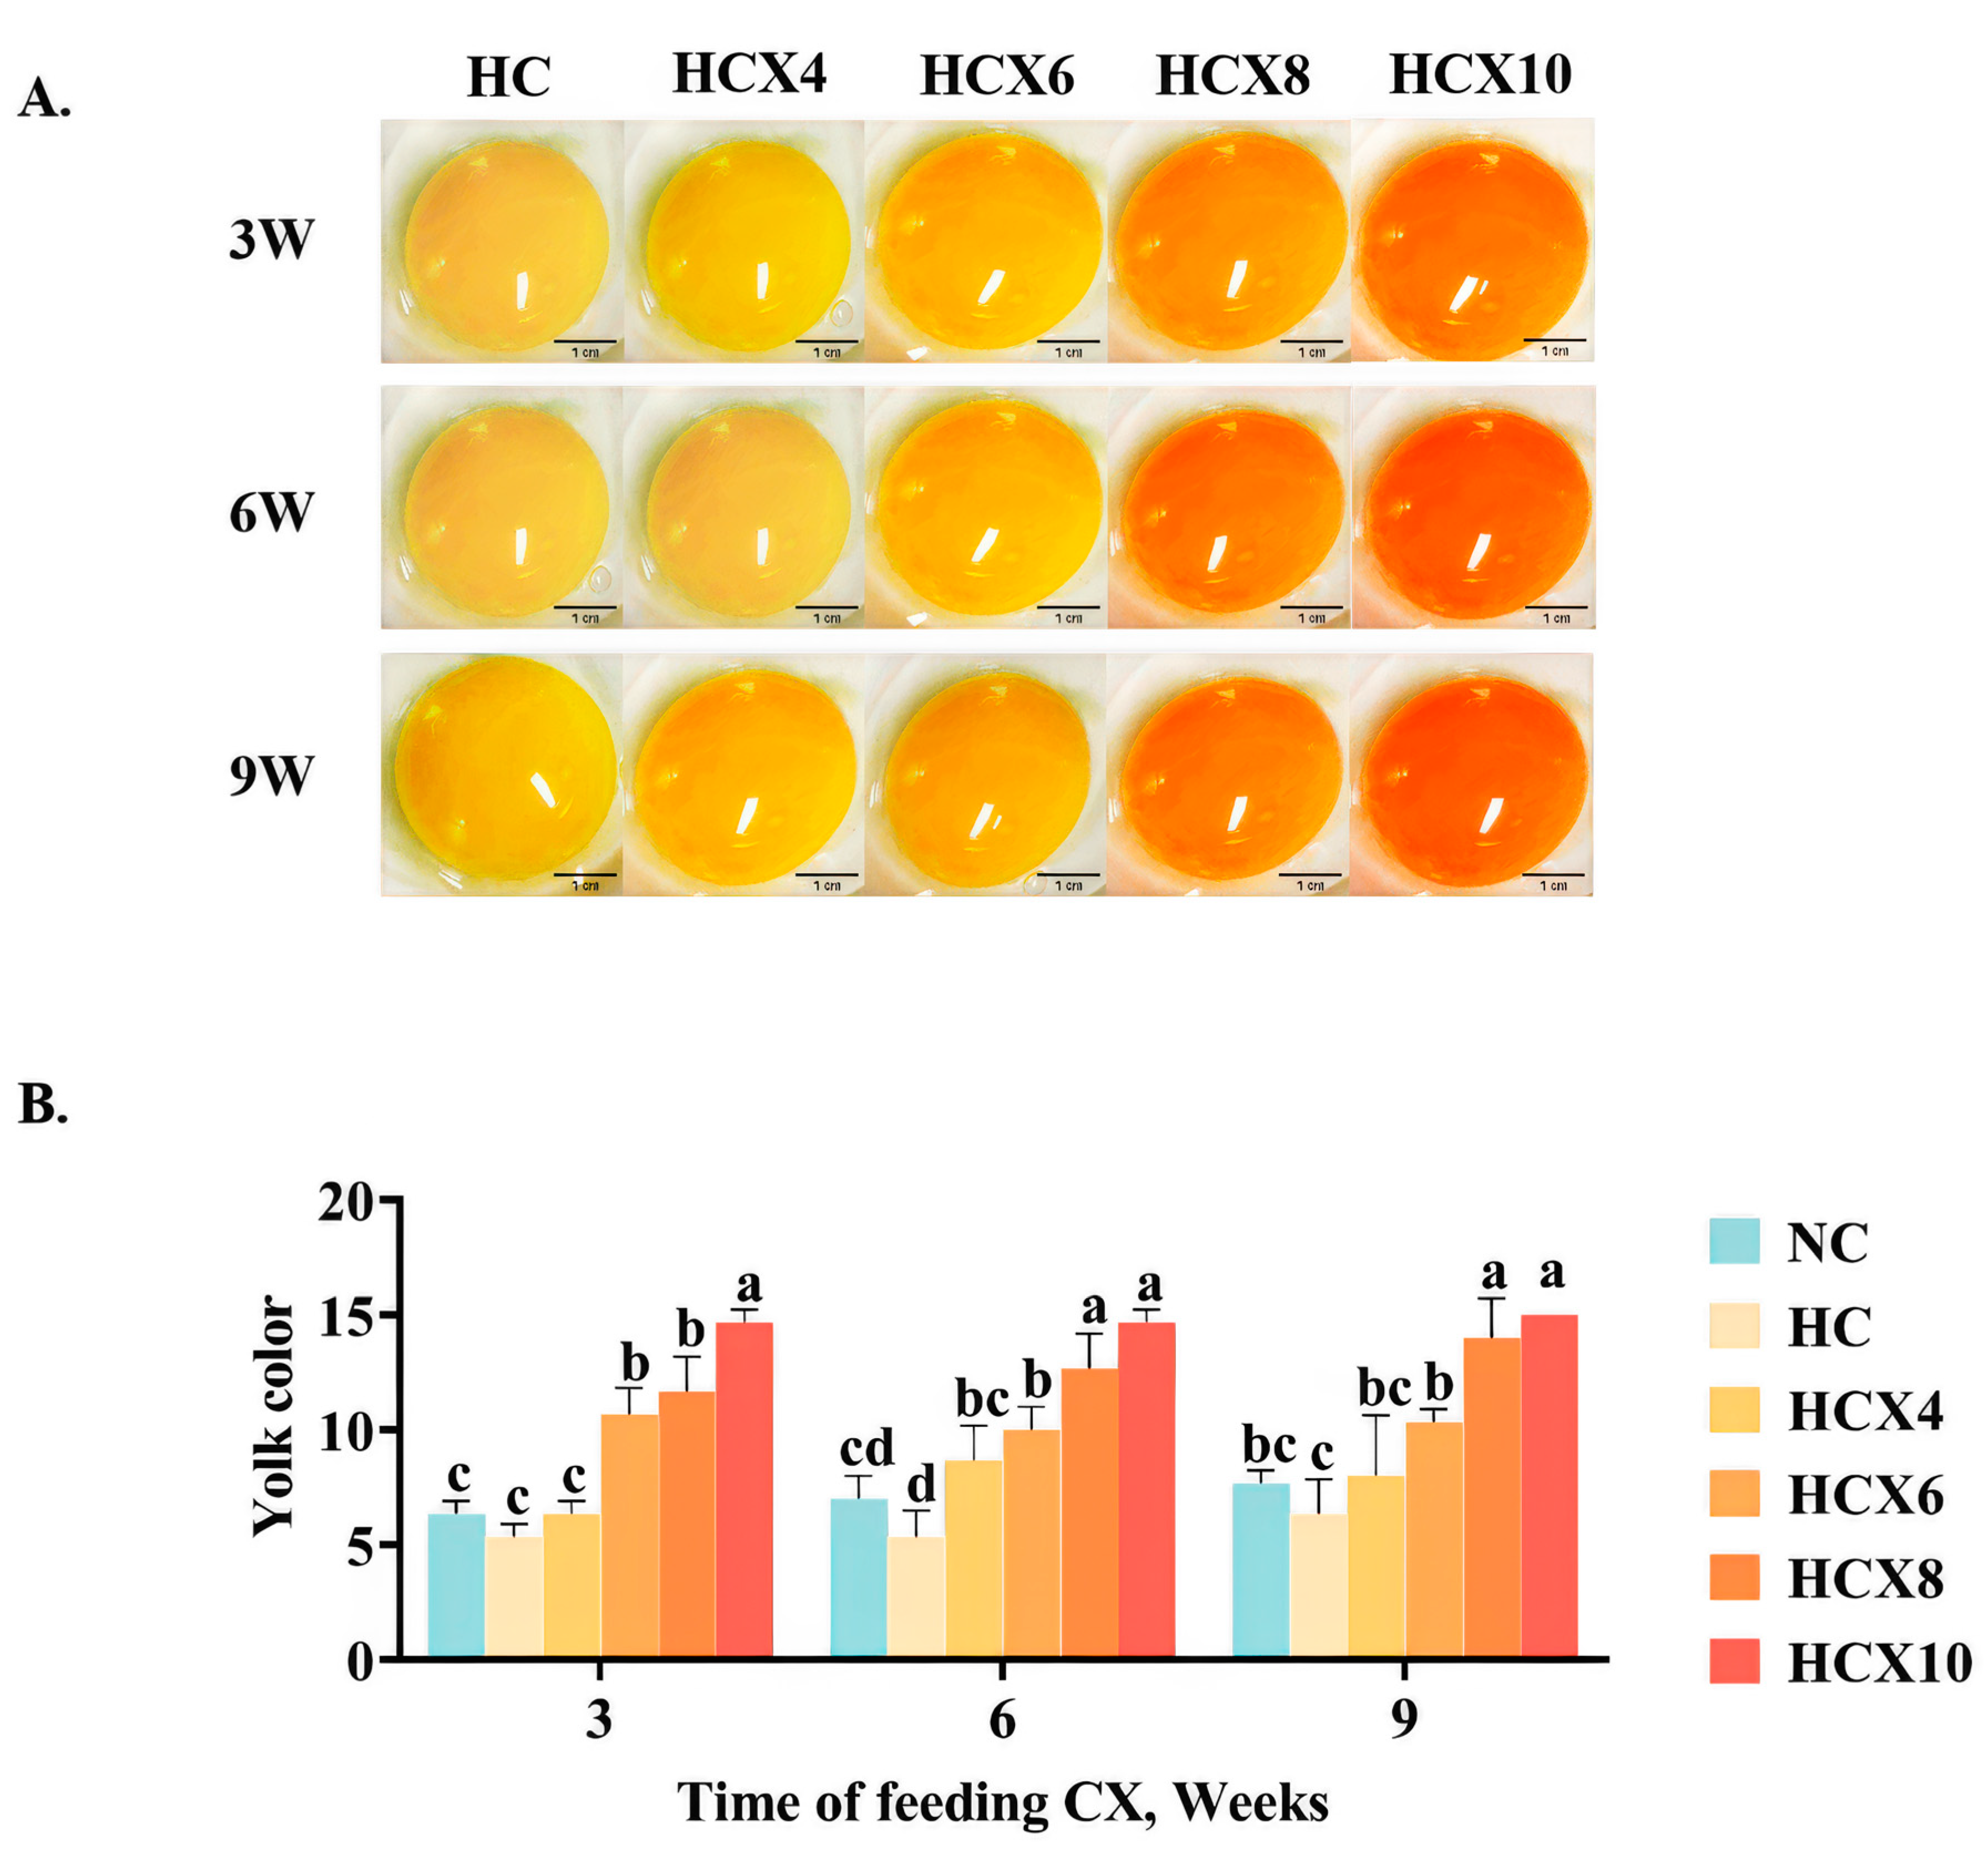
Figure 2.
The effects of continuous high temperatures for 3, 6, and 9 weeks on DSM egg yolk color scores, as well as the effects of continuous supplementation with varying concentrations of CX for 3, 6, and 9 weeks under high temperature on DSM egg yolk color scores, were evaluated. (A) Representative images of egg yolks after continuous supplementation with different concentrations of CX for 3, 6, and 9 weeks under high temperature; (B) The effect of continuous addition of CX for 3 weeks, 6 weeks, and 9 weeks on egg yolk color score under high temperature. Scale bar 1 cm. Data for each treatment consist of 6 replicate samples, with each replicate comprising 2 eggs. The figure presents mean ± standard deviation. Different superscript letters a–d indicate significant differences (p < 0.05) among dietary CX supplementation doses within the same experimental period, as determined by one-way ANOVA. Abbreviations: NC, normal temperature control group; HC, high-temperature control group; HCX4, supplementing the daily diet with an additional 4 mg/kg CX under high temperature; HCX6, supplementing the daily diet with an additional 6 mg/kg CX under high temperature; HCX8, supplementing the daily diet with an additional 8 mg/kg CX under high temperature; HCX10, supplementing the daily diet with an additional 10 mg/kg CX under high temperature.
![Foods 14 00950 g002]()
Table 1.
Arrangement of the treatments.
Table 1.
Arrangement of the treatments.
| Group | NC | NCX4 | NCX6 | NCX8 | NCX10 | HC | HCX4 | HCX6 | HCX8 | HCX10 |
|---|
| Temperature | Normal temperature (25 ± 2 °C) | High temperature (32 ± 2 °C) |
| Supplementary dose of CX (mg/kg) | 0 | 4 | 6 | 8 | 10 | 0 | 4 | 6 | 8 | 10 |
Table 2.
Composition and nutrient levels of basal diets (air-dry basis).
Table 2.
Composition and nutrient levels of basal diets (air-dry basis).
| Ingredients | Percent (%) | Nutrients 2 (Analyzed Composition, %) | Content (%) |
|---|
| Corn | 55.0 | ME/(MJ/kg) | 11.3 |
| Wheat bran | 9.5 | Ca, % | 3.0 |
| Soybean meal | 20.0 | CP, % | 15.5 |
| Fish meal | 5.0 | TP, % | 0.6 |
| Limestone | 7.5 | Met, % | 0.4 |
| Ca(HCO3)2 | 2.5 | Cys, % | 0.3 |
| NaCl | 0.1 | Lys, % | 0.8 |
| Premix 1 | 0.4 | | |
Table 3.
Effects of dietary CX supplementation under normal temperature on egg-laying performance in hens: a comprehensive analysis of egg-laying rate, average egg weight, average feed intake, yolk weight, and relative weight of egg yolk over 3-week, 6-week, and 9-week periods. Data are presented as mean ± standard deviation. n = 6 replicates (6 hens per replicate).
| Item | Time | NC | NCX4 | NCX6 | NCX8 | NCX10 | p-Value |
|---|
| Egg-laying rate (%) | 3 weeks | 47.61 ± 5.61 B | 39.64 ± 3.75 B | 39.86 ± 1.87 B | 45.08 ± 2.14 B | 39.17 ± 1.24 AB | 0.323 |
| 6 weeks | 55.63 ± 8.18 B | 43.27 ± 5.06 B | 40.55 ± 8.32 B | 44.33 ± 3.99 B | 34.26 ± 7.21 B | 0.328 |
| 9 weeks | 67.80 ± 3.81 Ab | 76.96 ± 2.55 Aa | 73.45 ± 2.02 Aa | 75.18 ± 3.45 Aa | 54.91 ± 0.41 Ac | 0.000 |
| p-value | 0.046 | 0.001 | 0.005 | 0.00 | 0.042 | |
| Average egg weight (g) | 3 weeks | 42.93 ± 1.22 | 40.6 ± 1.6 | 40.69 ± 0.72 B | 41.35 ± 0.94 | 41.1 ± 0.79 | 0.577 |
| 6 weeks | 42.66 ± 1.17 | 41.08 ± 3.26 | 45.39 ± 0.73 A | 43.58 ± 1.94 | 42.79 ± 1.36 | 0.614 |
| 9 weeks | 42.14 ± 1.97 | 45.61 ± 2.22 | 46.71 ± 1.06 A | 41.14 ± 1.61 | 44.04 ± 1.22 | 0.138 |
| p-value | 0.930 | 0.311 | 0.000 | 0.486 | 0.225 | |
| Average feed intake (g) | 3 weeks | 110.72 ± 18.62 | 97.12 ± 21.54 | 97.89 ± 21.63 | 98.52 ± 21.56 | 93.15 ± 25.17 | 0.983 |
| 6 weeks | 102.9 ± 7.42 | 91.82 ± 10.97 | 98.89 ± 8.22 | 92.16 ± 6.17 | 84.08 ± 5.7 | 0.533 |
| 9 weeks | 101.42 ± 8.61 | 88.4 ± 4.24 | 94.16 ± 6.42 | 93.01 ± 4.36 | 89.2 ± 5.56 | 0.589 |
| p-value | 0.8578 | 0.910 | 0.968 | 0.934 | 0.916 | |
| Yolk weight (g) | 3 weeks | 12.44 ± 0.57 B | 13.2 ± 0.31 B | 13.52 ± 0.37 B | 12.41 ± 0.28 B | 12.92 ± 0.44 B | 0.263 |
| 6 weeks | 15.94 ± 0.76 A | 15.04 ± 0.52 A | 16.83 ± 0.54 A | 15.68 ± 0.47 A | 15.54 ± 0.69 A | 0.341 |
| 9 weeks | 14.82 ± 0.71 AB | 15.48 ± 0.62 A | 16.15 ± 0.3 A | 14.95 ± 0.46 A | 15.22 ± 0.61 A | 0.483 |
| p-value | 0.008 | 0.013 | 0.00 | 0.00 | 0.013 | |
| Relative weight of egg yolk (%) | 3 weeks | 29.1 ± 1.65 Bb | 32.69 ± 1.12 a | 33.22 ± 0.62 Ba | 30.11 ± 1.06 Bab | 31.41 ± 0.73 Bab | 0.039 |
| 6 weeks | 35.49 ± 1.95 A | 34.57 ± 2.52 | 34.17 ± 1.6 AB | 34.34 ± 1.92 A | 34.47 ± 1.79 AB | 0.987 |
| 9 weeks | 37.26 ± 1.26 A | 37.53 ± 1.57 | 37.61 ± 0.51 A | 36.49 ± 1.23 A | 37.52 ± 0.78 A | 0.516 |
| p-value | 0.007 | 0.154 | 0.047 | 0.01 | 0.028 | |
Table 4.
Effects of dietary CX supplementation under normal temperature on total amino acid content in egg yolks at 3, 6, and 9 weeks. Data are presented as mean ± standard deviation. n = 6 replicates.
Table 4.
Effects of dietary CX supplementation under normal temperature on total amino acid content in egg yolks at 3, 6, and 9 weeks. Data are presented as mean ± standard deviation. n = 6 replicates.
| Total Amino Acid Content (μmol/g) | 3 Weeks | 6 Weeks | 9 Weeks | p-Value |
|---|
| NC | 123.99 ± 1.95 AB | 137.24 ± 4.42 Ab | 110.75 ± 9.81 B | 0.012 |
| NCX4 | 117.36 ± 2.64 | 123.26 ± 2.87 ab | 111.46 ± 9.40 | 0.153 |
| NCX6 | 113.42 ± 8.92 | 106.01 ± 7.64 bc | 120.85 ± 4.60 | 0.245 |
| NCX8 | 116.50 ± 4.20 AB | 108.68 ± 2.74 Bc | 124.31 ± 3.99 A | 0.013 |
| NCX10 | 124.37 ± 4.28 | 128.92 ± 6.53 ab | 119.83 ± 5.76 | 0.41 |
| p-value | 0.086 | 0.008 | 0.151 | |
Table 5.
Effects of dietary CX supplementation under normal temperature on percentages of 17 individual amino acids in egg yolks at 3, 6, and 9 weeks. Data are presented as mean ± standard deviation. n = 6 replicates.
Table 5.
Effects of dietary CX supplementation under normal temperature on percentages of 17 individual amino acids in egg yolks at 3, 6, and 9 weeks. Data are presented as mean ± standard deviation. n = 6 replicates.
| Proportion (%) | Time | NC | NT1 | NT2 | NT3 | NT4 | p-Value |
|---|
| Leucine | 3 weeks | 7.51 ± 0.12 | 7.54 ± 0.23 | 7.88 ± 0.43 | 7.65 ± 0.27 | 7.19 ± 0.12 | 0.489 |
| 6 weeks | 7.13 ± 0.35 | 7.36 ± 0.19 | 8.79 ± 0.68 | 8.74 ± 0.51 | 7.44 ± 0.33 | 0.056 |
| 9 weeks | 8.04 ± 0.31 a | 7.75 ± 0.37 ab | 7.1 ± 0.29 bc | 6.7 ± 0.25 c | 6.94 ± 0.16 bc | 0.035 |
| Asparagine | 3 weeks | 4.4 ± 0.02 | 4.96 ± 0.71 | 5.41 ± 0.09 | 4.68 ± 0.01 | 4.58 ± 0.01 | 0.126 |
| 6 weeks | 3.33 ± 0.13 b | 4.71 ± 0.57 a | 5.07 ± 0.05 a | 4.24 ± 0.35 ab | 3.53 ± 0.23 b | 0.008 |
| 9 weeks | 5.78 ± 0.13 | 5.23 ± 0.83 | 5.71 ± 0.13 | 5.06 ± 0.28 | 5.72 ± 0.29 | 0.437 |
| Histidine | 3 weeks | 1.5 ± 0.02 | 1.49 ± 0.1 | 1.53 ± 0.01 | 1.48 ± 0.08 | 1.34 ± 0.03 | 0.198 |
| 6 weeks | 1.59 ± 0 | 1.62 ± 0.03 | 1.9 ± 0.07 | 1.88 ± 0.15 | 1.59 ± 0.01 | 0.112 |
| 9 weeks | 1.4 ± 0.04 a | 1.36 ± 0.17 ab | 1.21 ± 0.04 ac | 1.14 ± 0.01 bc | 1.09 ± 0.06 c | 0.027 |
| Lysine | 3 weeks | 6.07 ± 0.03 | 6.11 ± 0.53 | 6.78 ± 0.08 | 6.04 ± 0.02 | 5.55 ± 0.24 | 0.086 |
| 6 weeks | 5.5 ± 0.08 b | 6.44 ± 0.25 ab | 7.52 ± 0 a | 6.8 ± 0.2 ab | 5.58 ± 0.26 b | 0.027 |
| 9 weeks | 6.86 ± 0.17 | 5.7 ± 0.92 | 6.16 ± 0.15 | 5.38 ± 0.14 | 5.54 ± 0.22 | 0.094 |
| Glutamic acid | 3 weeks | 4.38 ± 0.26 | 5.08 ± 0.77 | 5.59 ± 0.06 | 4.79 ± 0.04 | 4.6 ± 0.12 | 0.135 |
| 6 weeks | 4.34 ± 0.46 b | 5.31 ± 0.02 ab | 6.23 ± 0.14 a | 5.43 ± 0.58 ab | 4.47 ± 0.51 b | 0.026 |
| 9 weeks | 4.47 ± 0.02 | 4.06 ± 1.08 | 5.05 ± 0 | 4.22 ± 0.42 | 4.73 ± 0.32 | 0.474 |
| Alanine | 3 weeks | 3.18 ± 0.1 ab | 3.26 ± 0.03 a | 3.02 ± 0.09 ab | 2.88 ± 0.05 bc | 2.55 ± 0.2 c | 0.008 |
| 6 weeks | 3.33 ± 0.1 | 3.44 ± 0.21 | 3.83 ± 0.07 | 3.63 ± 0.04 | 2.97 ± 0.22 | 0.054 |
| 9 weeks | 3 ± 0.1 a | 3.08 ± 0.28 a | 2.32 ± 0.1 b | 2.22 ± 0.04 b | 2.1 ± 0.17 b | 0.004 |
| Valine | 3 weeks | 4.3 ± 0.1 a | 4.11 ± 0.06 ab | 4.27 ± 0.03 a | 4.04 ± 0.19 ab | 3.72 ± 0.16 b | 0.042 |
| 6 weeks | 3.92 ± 0.02 | 3.93 ± 0.02 | 4.59 ± 0.11 | 4.42 ± 0.32 | 3.78 ± 0.1 | 0.064 |
| 9 weeks | 4.79 ± 0.2 a | 4.32 ± 0.13 b | 4 ± 0.05 bc | 3.72 ± 0.06 c | 3.67 ± 0.24 c | 0.002 |
| Isoleucine | 3 weeks | 4.15 ± 0.12 | 4.03 ± 0.21 | 4.13 ± 0.02 | 3.92 ± 0.19 | 3.57 ± 0.13 | 0.055 |
| 6 weeks | 3.78 ± 0.1 | 3.76 ± 0.08 | 4.45 ± 0.14 | 4.25 ± 0.38 | 3.63 ± 0.01 | 0.097 |
| 9 weeks | 4.64 ± 0.16 a | 4.35 ± 0.4 ab | 3.87 ± 0.09 bc | 3.63 ± 0.02 c | 3.53 ± 0.27 c | 0.004 |
| Serine | 3 weeks | 6.07 ± 0.08 | 6.31 ± 0.12 | 6.51 ± 0.07 | 6.22 ± 0.36 | 5.78 ± 0.01 | 0.187 |
| 6 weeks | 5.84 ± 0 | 6.21 ± 0.02 | 7.28 ± 0.07 | 7.06 ± 0.41 | 6 ± 0.14 | 0.053 |
| 9 weeks | 6.42 ± 0.17 a | 6.18 ± 0.27 a | 5.87 ± 0.2 ab | 5.38 ± 0.14 b | 5.36 ± 0.14 b | 0.028 |
| Threonine | 3 weeks | 3.65 ± 0.04 b | 3.59 ± 0.03 b | 4.33 ± 0.05 a | 3.91 ± 0.19 ab | 3.55 ± 0 b | 0.042 |
| 6 weeks | 3.56 ± 0.05 b | 3.69 ± 0.1 b | 4.39 ± 0.08 a | 4.32 ± 0.07 a | 3.51 ± 0.12 b | 0.016 |
| 9 weeks | 3.78 ± 0.15 | 3.48 ± 0.15 | 4.15 ± 0.02 | 3.55 ± 0.28 | 3.62 ± 0.13 | 0.216 |
| Arginine | 3 weeks | 4.95 ± 0.1 | 5.18 ± 0.08 | 5.47 ± 0 | 5.26 ± 0.07 | 4.87 ± 0.14 | 0.074 |
| 6 weeks | 4.74 ± 0.1 | 5.27 ± 0.01 | 6.19 ± 0.07 | 5.86 ± 0.28 | 4.94 ± 0.11 | 0.062 |
| 9 weeks | 5.29 ± 0.11 a | 4.84 ± 0.04 ab | 4.38 ± 0.14 bc | 4.04 ± 0.08 c | 4.05 ± 0.07 c | 0.002 |
| Glycine | 3 weeks | 2.37 ± 0.05 | 2.52 ± 0.35 | 2.48 ± 0.01 | 2.56 ± 0.25 | 2.37 ± 0.1 | 0.795 |
| 6 weeks | 2.33 ± 0 | 2.42 ± 0.13 | 2.85 ± 0.06 | 3.06 ± 0.49 | 2.69 ± 0.05 | 0.108 |
| 9 weeks | 2.44 ± 0.09 | 2.65 ± 0.62 | 2.16 ± 0.08 | 2.13 ± 0.04 | 2.04 ± 0.16 | 0.209 |
| Phenylalanine | 3 weeks | 3.83 ± 0.1 | 3.95 ± 0.42 | 3.89 ± 0.06 | 3.79 ± 0.27 | 3.47 ± 0.19 | 0.449 |
| 6 weeks | 3.6 ± 0.08 | 3.66 ± 0.13 | 4.28 ± 0.13 | 4.32 ± 0.5 | 3.79 ± 0.14 | 0.156 |
| 9 weeks | 4.13 ± 0.13 ab | 4.3 ± 0.79 a | 3.56 ± 0 ac | 3.33 ± 0.08 bc | 3.15 ± 0.24 c | 0.045 |
| Proline | 3 weeks | 2.94 ± 0.06 | 3.04 ± 0.34 | 3.02 ± 0.15 | 3.11 ± 0.18 | 2.91 ± 0.11 | 0.912 |
| 6 weeks | 2.87 ± 0.02 | 2.94 ± 0.16 | 3.47 ± 0.06 | 3.65 ± 0.47 | 3.07 ± 0.01 | 0.119 |
| 9 weeks | 3.05 ± 0.12 b | 3.16 ± 0.56 b | 4.41 ± 0.18 a | 4.42 ± 0.22 a | 4.8 ± 0.32 a | 0.001 |
| Tyrosine | 3 weeks | 4.43 ± 0.16 | 4.55 ± 0.61 | 4.5 ± 0.04 | 4.65 ± 0.28 | 4.08 ± 0.09 | 0.463 |
| 6 weeks | 3.93 ± 0.09 | 4.08 ± 0.28 | 5.07 ± 0.18 | 5.25 ± 0.7 | 4.47 ± 0.2 | 0.070 |
| 9 weeks | 5.1 ± 0.26 | 5.11 ± 1.05 | 4.02 ± 0.23 | 4.13 ± 0.1 | 3.7 ± 0.41 | 0.061 |
| Methionine | 3 weeks | 1.4 ± 0.02 | 1.46 ± 0.12 | 1.4 ± 0 | 1.45 ± 0.12 | 1.29 ± 0.06 | 0.269 |
| 6 weeks | 1.27 ± 0.03 | 1.28 ± 0.01 | 1.47 ± 0.07 | 1.53 ± 0.22 | 1.34 ± 0.1 | 0.151 |
| 9 weeks | 1.58 ± 0.07 ab | 1.66 ± 0.28 a | 1.35 ± 0.06 bc | 1.37 ± 0.03 ac | 1.24 ± 0.02 c | 0.044 |
| Cysteine | 3 weeks | 0.67 ± 0.16 a | 0.25 ± 0.08 b | 0.22 ± 0.01 b | 0.25 ± 0.07 b | 0.22 ± 0 b | 0.001 |
| 6 weeks | 0.91 ± 0.27 a | 0.17 ± 0.02 b | 0.18 ± 0 b | 0.24 ± 0.11 b | 0.15 ± 0.01 b | 0.000 |
| 9 weeks | 0.35 ± 0.03 | 0.36 ± 0.17 | 0.26 ± 0.01 | 0.26 ± 0.03 | 0.29 ± 0.01 | 0.490 |
| Others | 3 weeks | 34.13 ± 1.02 | 32.49 ± 0.94 | 29.5 ± 0.55 | 33.25 ± 2.67 | 38.3 ± 1.75 | 0.105 |
| 6 weeks | 37.95 ± 0.08 a | 33.63 ± 0.17 ac | 22.38 ± 0.78 c | 25.26 ± 3.83 bc | 36.97 ± 1.87 ab | 0.037 |
| 9 weeks | 28.8 ± 2.13 b | 32.35 ± 2.73 ab | 34.35 ± 1.66 ab | 39.25 ± 1.94 a | 38.38 ± 1.22 a | 0.035 |
Table 6.
Effects of dietary CX supplementation under normal temperature on lipid content of egg yolk: a comprehensive analysis of total cholesterol (TC), triglycerides (TG), high-density lipoprotein cholesterol (HDL-C), low-density lipoprotein cholesterol (LDL-C), and lecithin (LEC) over 3-week, 6-week, and 9-week periods. Data are presented as mean ± standard deviation. n = 6 replicates.
| Item | Time | NC | NCX4 | NCX6 | NCX8 | NCX10 | p-Value |
|---|
| TG (mg/g) | 3 weeks | 33.71 ± 0.97 | 36.01 ± 0.83 AB | 35.92 ± 1.63 AB | 35.9 ± 0.98 B | 37.87 ± 2.73 | 0.521 |
| 6 weeks | 37.66 ± 2.89 a | 32.91 ± 0.79 Bab | 30.87 ± 1.41 Bb | 36.22 ± 1.29 Ba | 36.86 ± 0.62 a | 0.049 |
| 9 weeks | 41.26 ± 1.72 | 37.88 ± 0.67 A | 39.74 ± 1.20 A | 40.61 ± 0.68 A | 39.92 ± 2.73 | 0.651 |
| p-value | 0.098 | 0.01 | 0.013 | 0.029 | 0.642 | |
| TC (mg/g) | 3 weeks | 11.14 ± 0.60 | 10.83 ± 0.4 AB | 11.83 ± 0.91 | 13.7 ± 2.39 | 13.79 ± 2.18 | 0.533 |
| 6 weeks | 12.95 ± 0.81 | 11.18 ± 0.8 A | 10.88 ± 1.01 | 11.77 ± 0.56 | 12.01 ± 0.67 | 0.429 |
| 9 weeks | 10.82 ± 0.12 | 10.24 ± 0.34 B | 11.24 ± 0.86 | 9.94 ± 0.45 | 11.59 ± 0.66 | 0.257 |
| p-value | 0.0834 | 0.035 | 0.775 | 0.258 | 0.520 | |
| LEC (ng/g) | 3 weeks | 255.21 ± 14.50 B | 270.42 ± 25.65 B | 244.41 ± 45.52 B | 294.59 ± 41.91 B | 241.97 ± 18.82 B | 0.759 |
| 6 weeks | 349.27 ± 2.47 Ac | 409.07 ± 3.38 Ab | 415.43 ± 3.32 Ab | 409.25 ± 3.90 Ab | 441.06 ± 5.52 Aa | 0.000 |
| 9 weeks | 368.33 ± 3.38 Ac | 434.57 ± 3.11 Aa | 442.55 ± 3.43 Aa | 405.39 ± 2.23 Ab | 428.94 ± 5.02 Aa | 0.000 |
| p-value | 0.000 | 0.001 | 0.004 | 0.026 | 0.000 | |
| LDL-C (µmol/g) | 3 weeks | 33.32 ± 3.04 | 30.36 ± 2.57 | 35.53 ± 2.87 A | 33.18 ± 0.49 A | 32.04 ± 1.89 | 0.643 |
| 6 weeks | 27.6 ± 2.82 | 25.9 ± 2.03 | 25.72 ± 2.5 B | 27.47 ± 1.78 B | 28.69 ± 0.45 | 0.831 |
| 9 weeks | 25.86 ± 1.78 | 24.63 ± 0.52 | 26.23 ± 1.72 B | 22.68 ± 1.24 B | 27.09 ± 0.68 | 0.218 |
| p-value | 0.187 | 0.165 | 0.048 | 0.004 | 0.063 | |
| HDL-C (µmol/g) | 3 weeks | 9.62 ± 0.59 A | 8.5 ± 0.28 A | 8.97 ± 0.92 A | 9.45 ± 0.49 A | 8.43 ± 0.75 | 0.605 |
| 6 weeks | 6.09 ± 1.05 B | 5.64 ± 0.59 B | 4.61 ± 0.45 B | 6.16 ± 0.70 B | 6.5 ± 0.53 | 0.408 |
| 9 weeks | 6.85 ± 0.20 AB | 6.86 ± 0.17 AB | 7.91 ± 0.46 A | 7.42 ± 0.20 AB | 6.95 ± 0.67 | 0.309 |
| p-value | 0.027 | 0.006 | 0.007 | 0.010 | 0.172 | |
Table 7.
Effects of dietary CX supplementation under normal temperature on Calcium (Ca), Phosphorus (P), Vitamin B2 (Vb2) of egg yolk at 3, 6, and 9 weeks. Data are presented as mean ± standard deviation. n = 6 replicates.
Table 7.
Effects of dietary CX supplementation under normal temperature on Calcium (Ca), Phosphorus (P), Vitamin B2 (Vb2) of egg yolk at 3, 6, and 9 weeks. Data are presented as mean ± standard deviation. n = 6 replicates.
| Item | Time | NC | NCX4 | NCX6 | NCX8 | NCX10 | p-Value |
|---|
| Ca (g/kg) | 3 weeks | 0.5 ± 0.04 | 0.52 ± 0.02 | 0.54 ± 0.01 | 0.55 ± 0.03 | 0.57 ± 0.03 | 0.382 |
| 6 weeks | 0.43 ± 0.04 | 0.44 ± 0.04 | 0.51 ± 0.03 | 0.49 ± 0.03 | 0.49 ± 0.05 | 0.466 |
| 9 weeks | 0.56 ± 0.04 | 0.6 ± 0.07 | 0.57 ± 0.02 | 0.6 ± 0.03 | 0.65 ± 0.07 | 0.771 |
| p-value | 0.117 | 0.125 | 0.305 | 0.086 | 0.175 | |
| P (mg/kg) | 3 weeks | 0.98 ± 0.04 | 1.01 ± 0.01 | 1.02 ± 0.01 | 0.99 ± 0.04 | 0.98 ± 0.01 AB | 0.652 |
| 6 weeks | 0.96 ± 0.03 | 0.97 ± 0.06 | 1.06 ± 0.05 | 1 ± 0.02 | 0.95 ± 0.01 B | 0.183 |
| 9 weeks | 1 ± 0.05 | 1.06 ± 0.03 | 0.98 ± 0.04 | 0.98 ± 0.06 | 1 ± 0.01 A | 0.728 |
| p-value | 0.796 | 0.360 | 0.455 | 0.945 | 0.020 | |
| VB2 (mg/kg) | 3 weeks | 2.57 ± 0.08 | 2.83 ± 0.43 | 2.75 ± 0.06 | 2.51 ± 0.13 | 2.12 ± 0.15 B | 0.250 |
| 6 weeks | 2.46 ± 0.62 | 2.5 ± 0.39 | 2.74 ± 0.29 | 2.91 ± 0.45 | 2.99 ± 0.25 A | 0.462 |
| 9 weeks | 2.53 ± 0.25 | 1.92 ± 0.08 | 2 ± 0.54 | 2.21 ± 0.37 | 1.86 ± 0.3 B | 0.654 |
| p-value | 0.979 | 0.237 | 0.307 | 0.414 | 0.037 | |
Table 8.
The impact of continuous high temperatures for 3, 6, and 9 weeks on the egg-laying performance of hens and the effect of continuous supplementation with varying concentrations of CX under high temperature on the egg-laying performance of hens were evaluated: a comprehensive analysis of egg-laying rate, average egg weight, average feed intake, yolk weight, and relative weight of egg yolk over 3-week, 6-week, and 9-week periods. Data are presented as mean ± standard deviation. n = 6 replicates (6 hens per replicate).
| Item | Time | NC | HC | HCX4 | HCX6 | HCX8 | HCX10 | p-Value |
|---|
| Egg-laying rate (%) | 3 weeks | 47.61 ± 5.61 ab | 40.1 ± 0.45 b | 47.7 ± 1.96 Bab | 52.15 ± 1.84 Ba | 52.05 ± 1.12 a | 41.86 ± 1.50 b | 0.032 |
| 6 weeks | 55.63 ± 8.18 a | 31.48 ± 2.81 c | 42.89 ± 1.08 Bbc | 44.9 ± 1.84 Bab | 52.11 ± 1.18 a | 45.37 ± 1.85 ab | 0.011 |
| 9 weeks | 57.80 ± 3.81 a | 32.96 ± 2.55 c | 52.93 ± 1.43 Aab | 52.47 ± 2.47 Aab | 55.64 ± 0.66 a | 43.84 ± 1.43 b | 0.000 |
| p-value | 0.506 | 0.068 | 0.014 | 0.034 | 0.087 | 0.343 | |
| Average egg weight (g) | 3 weeks | 42.93 ± 1.22 | 43.21 ± 1.58 | 40.24 ± 0.87 B | 39.65 ± 0.72 B | 42.37 ± 1.38 | 40.90 ± 1.81 | 0.301 |
| 6 weeks | 42.66 ± 1.17 | 39.2 ± 1.23 | 39.97 ± 0.51 B | 41.48 ± 0.84 B | 41.49 ± 0.52 | 41.48 ± 1.17 | 0.166 |
| 9 weeks | 42.14 ± 1.97 | 41.88 ± 2.47 | 44.52 ± 1.78 A | 45.38 ± 1.30 A | 43.68 ± 0.64 | 45.24 ± 1.19 | 0.538 |
| p-value | 0.930 | 0.318 | 0.026 | 0.003 | 0.276 | 0.097 | |
| Average feed intake (g) | 3 weeks | 110.72 ± 18.62 | 84.19 ± 17.57 | 88.84 ± 18.84 | 87.91 ± 18.83 | 87.16 ± 18.93 | 82.24 ± 18.9 | 0.898 |
| 6 weeks | 102.9 ± 7.42 | 82.45 ± 4.81 | 84.39 ± 4.47 | 85.88 ± 5.53 | 91.29 ± 5.39 | 80.96 ± 4.87 | 0.124 |
| 9 weeks | 101.42 ± 8.61 | 88.26 ± 4.00 | 83.90 ± 4.38 | 81.94 ± 5.52 | 81.69 ± 2.09 | 80.58 ± 5.52 | 0.130 |
| p-value | 0.506 | 0.927 | 0.946 | 0.936 | 0.841 | 0.994 | |
| Yolk weight (g) | 3 weeks | 12.44 ± 0.57 Bb | 13.76 ± 0.6 ab | 14.06 ± 0.54 ab | 13.17 ± 0.38 Bab | 14.87 ± 0.39 Ba | 13.68 ± 0.39 Bab | 0.033 |
| 6 weeks | 15.94 ± 0.76 Aa | 13.65 ± 0.5 b | 14.59 ± 0.56 ab | 15.39 ± 0.39 Aa | 15.28 ± 0.38 ABa | 15.61 ± 0.48 Aa | 0.044 |
| 9 weeks | 14.82 ± 0.71 ABab | 13.44 ± 0.75 b | 14.39 ± 0.65 ab | 15.2 ± 0.82 ABab | 16.2 ± 0.18 Aa | 15.21 ± 0.34 Aab | 0.048 |
| p-value | 0.008 | 0.935 | 0.810 | 0.026 | 0.036 | 0.010 | |
| Relative weight of egg yolk (%) | 3 weeks | 29.10 ± 1.65 Bb | 31.88 ± 1.11 ab | 34.94 ± 1.12 ABa | 33.19 ± 0.47 Bab | 35.27 ± 1.42 a | 33.83 ± 2.06 ab | 0.041 |
| 6 weeks | 37.49 ± 1.95 A | 34.86 ± 1.00 | 36.47 ± 1.08 A | 37.18 ± 1.16 A | 36.81 ± 0.48 | 37.65 ± 0.81 | 0.586 |
| 9 weeks | 35.26 ± 1.26 Aa | 32.15 ± 0.53 b | 32.3 ± 0.43 Bb | 33.42 ± 1.22 Bab | 37.11 ± 0.3 a | 33.72 ± 0.99 ab | 0.002 |
| p-value | 0.007 | 0.069 | 0.018 | 0.017 | 0.313 | 0.121 | |
Table 9.
The impact of continuous high temperatures for 3, 6, and 9 weeks on total amino acid content of egg yolks and the effect of continuous supplementation with varying concentrations of CX for 3, 6, and 9 weeks under high temperature on total amino acid content of egg yolks were evaluated. Data are presented as mean ± standard deviation. n = 6 replicates.
| Total Amino Acid Content (μmol/g) | 3 Weeks | 6 Weeks | 9 Weeks | p-Value |
|---|
| NC | 123.99 ± 1.13 ABa | 137.24 ± 4.42 Aa | 110.75 ± 5.66 B | 0.012 |
| HC | 114.65 ± 2.40 b | 117.54 ± 4.30 b | 111.75 ± 9.10 | 0.798 |
| HCX4 | 111.88 ± 1.34 b | 112.11 ± 2.36 b | 111.65 ± 2.50 | 0.988 |
| HCX6 | 114.8 ± 3.98 b | 113.14 ± 5.63 b | 116.46 ± 2.38 | 0.86 |
| HCX8 | 112.27 ± 3.08 b | 107.65 ± 1.27 b | 116.88 ± 5.38 | 0.279 |
| HCX10 | 116.58 ± 3.33 ab | 115 ± 1.09 b | 118.16 ± 6.80 | 0.882 |
| p-value | 0.042 | 0.001 | 0.897 | |
Table 10.
The impact of continuous high temperatures for 3, 6, and 9 weeks on percentages of 17 individual amino acids of egg yolks and the effect of continuous supplementation for 3, 6, and 9 weeks with varying concentrations of CX under high temperature on percentages of 17 individual amino acids of egg yolks were evaluated. Data are presented as mean ± standard deviation. n = 6 replicates.
| Proportion (%) | Time | HC | HCX4 | HCX6 | HCX8 | HCX10 | p-Value |
|---|
| Leucine | 3 weeks | 8.24 ± 0.03 | 7.82 ± 0.13 | 7.85 ± 0.18 | 7.82 ± 0.2 | 7.48 ± 0.34 | 0.376 |
| 6 weeks | 8.64 ± 0.18 | 8.29 ± 0.26 | 8.42 ± 0.25 | 8.52 ± 0.25 | 7.67 ± 0.03 | 0.245 |
| 9 weeks | 7.95 ± 0.17 | 7.35 ± 0.02 | 7.32 ± 0.12 | 7.16 ± 0.13 | 7.31 ± 0.69 | 0.442 |
| Asparagine | 3 weeks | 5.02 ± 0.26 | 4.9 ± 0.05 | 5.03 ± 0.23 | 4.89 ± 0.04 | 4.32 ± 0.15 | 0.272 |
| 6 weeks | 4.25 ± 0.18 | 3.96 ± 0.35 | 4.41 ± 0.56 | 4.31 ± 0.76 | 4.03 ± 0.19 | 0.518 |
| 9 weeks | 5.86 ± 0.3 | 5.88 ± 0.27 | 5.65 ± 0.13 | 5.46 ± 0.62 | 4.64 ± 0.5 | 0.383 |
| Histidine | 3 weeks | 1.6 ± 0.04 | 1.47 ± 0.02 | 1.48 ± 0.04 | 1.45 ± 0.04 | 1.42 ± 0.07 | 0.250 |
| 6 weeks | 1.88 ± 0.03 | 1.76 ± 0.05 | 1.8 ± 0.07 | 1.76 ± 0.06 | 1.62 ± 0.01 | 0.462 |
| 9 weeks | 1.34 ± 0.08 | 1.19 ± 0 | 1.17 ± 0.02 | 1.15 ± 0.02 | 1.23 ± 0.12 | 0.089 |
| Lysine | 3 weeks | 6.87 ± 0.04 | 6.04 ± 0.22 | 6.41 ± 0.27 | 6.02 ± 0 | 5.49 ± 0.11 | 0.093 |
| 6 weeks | 6.91 ± 0.24 | 6.01 ± 0.5 | 6.89 ± 0.49 | 6.5 ± 0.41 | 6.05 ± 0.18 | 0.374 |
| 9 weeks | 6.9 ± 0.12 a | 6.08 ± 0.07 ab | 5.97 ± 0.06 ab | 5.58 ± 0.34 ab | 4.95 ± 0.34 b | 0.015 |
| Glutamic acid | 3 weeks | 4.95 ± 0.21 | 5.17 ± 0.25 | 5.3 ± 0.41 | 4.82 ± 0.01 | 4.17 ± 0.12 | 0.096 |
| 6 weeks | 5.12 ± 0.33 | 5.06 ± 0.5 | 5.77 ± 0.8 | 5.5 ± 0.62 | 5.04 ± 0.49 | 0.459 |
| 9 weeks | 4.81 ± 0.12 ab | 5.32 ± 0 a | 4.87 ± 0.02 ab | 4.22 ± 0.49 bc | 3.34 ± 0.15 c | 0.011 |
| Alanine | 3 weeks | 3.4 ± 0.03 | 2.9 ± 0.05 | 3.02 ± 0.22 | 2.88 ± 0.12 | 2.92 ± 0.1 | 0.085 |
| 6 weeks | 3.71 ± 0.05 | 3.42 ± 0.04 | 3.65 ± 0.37 | 3.38 ± 0.22 | 3.09 ± 0.22 | 0.532 |
| 9 weeks | 3.08 ± 0.04 a | 2.38 ± 0.06 b | 2.42 ± 0.09 b | 2.41 ± 0.05 b | 2.77 ± 0.39 ab | 0.019 |
| Valine | 3 weeks | 4.59 ± 0.02 a | 4.14 ± 0.04 bc | 3.91 ± 0.14 bd | 3.81 ± 0.04 cd | 3.57 ± 0.13 d | 0.001 |
| 6 weeks | 4.6 ± 0.09 a | 4.06 ± 0.09 ab | 3.9 ± 0.18 b | 3.91 ± 0.05 b | 3.45 ± 0.03 b | 0.040 |
| 9 weeks | 4.65 ± 0.11 ab | 4.22 ± 0.01 ac | 3.92 ± 0.09 bc | 3.73 ± 0.11 c | 3.7 ± 0.3 c | 0.019 |
| Isoleucine | 3 weeks | 4.36 ± 0 a | 3.97 ± 0.08 ac | 3.87 ± 0.08 bc | 3.87 ± 0.08 bc | 3.71 ± 0.2 c | 0.031 |
| 6 weeks | 4.3 ± 0.08 | 3.9 ± 0.18 | 3.87 ± 0.06 | 3.96 ± 0.1 | 3.49 ± 0.07 | 0.386 |
| 9 weeks | 4.51 ± 0.07 | 4.03 ± 0.02 | 3.88 ± 0.09 | 3.78 ± 0.06 | 3.94 ± 0.37 | 0.061 |
| Serine | 3 weeks | 6.76 ± 0.05 | 6.35 ± 0.04 | 6.37 ± 0.12 | 6.17 ± 0.24 | 5.79 ± 0.27 | 0.078 |
| 6 weeks | 7.14 ± 0.15 | 6.7 ± 0.05 | 7 ± 0.2 | 6.83 ± 0.18 | 6.21 ± 0.02 | 0.198 |
| 9 weeks | 6.46 ± 0.19 | 6.01 ± 0.02 | 5.77 ± 0.04 | 5.56 ± 0.26 | 5.4 ± 0.51 | 0.159 |
| Threonine | 3 weeks | 3.93 ± 0.06 | 3.94 ± 0.06 | 3.97 ± 0.14 | 3.8 ± 0.07 | 3.41 ± 0.13 | 0.143 |
| 6 weeks | 4.29 ± 0.12 | 3.91 ± 0.03 | 4.11 ± 0.26 | 3.95 ± 0.21 | 3.52 ± 0.13 | 0.146 |
| 9 weeks | 3.61 ± 0.2 | 3.99 ± 0.15 | 3.85 ± 0.01 | 3.68 ± 0.31 | 3.31 ± 0.36 | 0.600 |
| Arginine | 3 weeks | 5.61 ± 0.02 a | 4.88 ± 0.05 b | 5 ± 0.17 b | 4.76 ± 0.17 b | 4.4 ± 0.24 b | 0.023 |
| 6 weeks | 5.92 ± 0.15 | 5.5 ± 0.08 | 5.88 ± 0.33 | 5.65 ± 0.01 | 5.05 ± 0.03 | 0.213 |
| 9 weeks | 5.36 ± 0.15 a | 4.26 ± 0.02 b | 4.17 ± 0.03 b | 3.94 ± 0.26 b | 3.77 ± 0.43 b | 0.004 |
| Glycine | 3 weeks | 2.61 ± 0.03 | 2.75 ± 0.13 | 2.6 ± 0.04 | 2.67 ± 0.13 | 2.63 ± 0.17 | 0.257 |
| 6 weeks | 2.89 ± 0.03 | 3.14 ± 0.3 | 2.93 ± 0.02 | 3.04 ± 0.3 | 2.72 ± 0.01 | 0.272 |
| 9 weeks | 2.38 ± 0.05 | 2.35 ± 0.04 | 2.28 ± 0.07 | 2.33 ± 0.03 | 2.54 ± 0.32 | 0.728 |
| Phenylalanine | 3 weeks | 4.06 ± 0.03 | 3.98 ± 0.2 | 3.81 ± 0.05 | 3.92 ± 0.15 | 3.76 ± 0.22 | 0.643 |
| 6 weeks | 4.26 ± 0.07 | 4.24 ± 0.41 | 4.03 ± 0.01 | 4.21 ± 0.3 | 3.69 ± 0.03 | 0.360 |
| 9 weeks | 3.92 ± 0.03 | 3.72 ± 0.02 | 3.61 ± 0.12 | 3.63 ± 0.01 | 3.84 ± 0.41 | 0.348 |
| Proline | 3 weeks | 3.19 ± 0.04 c | 4.36 ± 0.25 a | 4.32 ± 0.03 ab | 4.21 ± 0.4 ab | 3.61 ± 0.06 bc | 0.002 |
| 6 weeks | 3.49 ± 0.04 | 3.57 ± 0.24 | 3.41 ± 0.13 | 3.29 ± 0.37 | 2.81 ± 0.05 | 0.350 |
| 9 weeks | 2.94 ± 0.07 b | 5.14 ± 0.25 a | 5.21 ± 0.12 a | 5.07 ± 0.46 a | 4.4 ± 0.25 a | 0.000 |
| Tyrosine | 3 weeks | 4.88 ± 0.02 | 4.47 ± 0.16 | 4.45 ± 0.01 | 4.71 ± 0.12 | 4.8 ± 0.5 | 0.378 |
| 6 weeks | 5.11 ± 0.08 | 4.88 ± 0.34 | 4.78 ± 0.09 | 4.93 ± 0.36 | 4.4 ± 0.4 | 0.259 |
| 9 weeks | 4.74 ± 0.08 ab | 4.06 ± 0.02 b | 4.14 ± 0.06 b | 4.5 ± 0.1 ab | 5.21 ± 0.64 a | 0.050 |
| Methionine | 3 weeks | 1.49 ± 0.05 | 1.44 ± 0.04 | 1.45 ± 0.02 | 1.47 ± 0.11 | 1.54 ± 0.14 | 0.642 |
| 6 weeks | 1.5 ± 0.04 | 1.5 ± 0.11 | 1.48 ± 0.02 | 1.48 ± 0.23 | 1.4 ± 0.02 | 0.663 |
| 9 weeks | 1.52 ± 0.11 | 1.38 ± 0.04 | 1.42 ± 0.06 | 1.45 ± 0 | 1.67 ± 0.28 | 0.369 |
| Cysteine | 3 weeks | 0.36 ± 0.06 b | 0.3 ± 0.08 b | 0.26 ± 0.01 b | 0.25 ± 0 b | 0.27 ± 0.01 b | 0.001 |
| 6 weeks | 0.44 ± 0.12 b | 0.28 ± 0.14 b | 0.21 ± 0.01 b | 0.2 ± 0.02 b | 0.2 ± 0.03 b | 0.000 |
| 9 weeks | 0.28 ± 0 | 0.33 ± 0.01 | 0.31 ± 0 | 0.29 ± 0.01 | 0.33 ± 0.06 | 0.214 |
| Others | 3 weeks | 28.07 ± 0.17 | 31.1 ± 0.71 | 30.89 ± 2.13 | 32.43 ± 1.59 | 36.64 ± 2.71 | 0.234 |
| 6 weeks | 25.55 ± 1.74 | 29.82 ± 0.84 | 27.48 ± 3.6 | 28.5 ± 0.12 | 35.46 ± 0.86 | 0.265 |
| 9 weeks | 29.69 ± 0.93 | 32.33 ± 0.57 | 34 ± 0.66 | 35.99 ± 2.93 | 37.55 ± 6.13 | 0.472 |
Table 11.
The impact of high temperatures on lipid content of egg yolk and the effects of dietary CX supplementation under high temperature on lipid content of egg yolk: a comprehensive analysis of total cholesterol (TC), triglycerides (TG), high-density lipoprotein cholesterol (HDL-C), low-density lipoprotein cholesterol (LDL-C), and lecithin (LEC) over 3-week, 6-week, and 9-week periods. Data are presented as mean ± standard deviation. n = 6 replicates.
| Item | Time | NC | HC | HCX4 | HCX6 | HCX8 | HCX10 | p-Value |
|---|
| TG (mg/g) | 3 weeks | 33.71 ± 0.97 b | 37.24 ± 1.34 Bab | 36.95 ± 1.09 Aab | 38.36 ± 0.24 a | 40.08 ± 1.73 a | 40.91 ± 1.92 a | 0.029 |
| 6 weeks | 37.66 ± 2.89 | 32.77 ± 1.23 C | 33.00 ± 0.29 B | 36.04 ± 0.76 | 36.86 ± 1.52 | 36.98 ± 1.11 | 0.519 |
| 9 weeks | 41.26 ± 1.72 | 40.62 ± 1.80 A | 39.07 ± 0.03 A | 38.33 ± 1.66 | 41.32 ± 0.06 | 42.30 ± 2.51 | 0.518 |
| p-value | 0.098 | 0.026 | 0.002 | 0.283 | 0.125 | 0.211 | |
| TC (mg/g) | 3 weeks | 11.14 ± 0.60 c | 12.07 ± 0.49 bc | 14.18 ± 0.44 ab | 12.16 ± 0.69 bc | 14.84 ± 0.76 a | 13.43 ± 0.18 ac | 0.004 |
| 6 weeks | 12.95 ± 0.81 | 12.39 ± 0.30 | 14.39 ± 1.34 | 13.84 ± 1.73 | 15.21 ± 1.53 | 14.09 ± 0.92 | 0.110 |
| 9 weeks | 10.82 ± 0.12 b | 12.39 ± 0.30 a | 11.63 ± 0.32 ab | 12.51 ± 0.86 a | 11.71 ± 0.70 ab | 12.76 ± 0.11 a | 0.045 |
| p-value | 0.8 | 0.796 | 0.104 | 0.597 | 0.11 | 0.298 | |
| LEC (ng/g) | 3 weeks | 255.21 ± 14.50 B | 226.14 ± 17.91 B | 285.92 ± 43.39 B | 264.98 ± 34.02 B | 274.87 ± 38.35 B | 270.61 ± 47.30 B | 0.870 |
| 6 weeks | 349.27 ± 2.47 Ac | 340.55 ± 3.07 Ab | 407.93 ± 1.81 Aa | 428.56 ± 3.42 Aa | 422.1 ± 5.41 Aa | 427.76 ± 7.80 Aa | 0.000 |
| 9 weeks | 368.33 ± 3.38 Ab | 333.34 ± 6.59 Ac | 422.34 ± 2.14 Aa | 409.42 ± 5.06 Aa | 412.82 ± 3.06 Aa | 410.12 ± 5.25 Aa | 0.000 |
| p-value | 0.000 | 0.001 | 0.016 | 0.002 | 0.006 | 0.014 | |
| LDL-C (µmol/g) | 3 weeks | 33.32 ± 3.04 | 34.45 ± 2.17 | 30.81 ± 0.96 | 32.45 ± 1.16 A | 33.39 ± 1.42 | 32.07 ± 1.31 | 0.787 |
| 6 weeks | 27.6 ± 2.82 | 26.26 ± 3.85 | 26.08 ± 3.16 | 28.55 ± 1.16 AB | 29.44 ± 2.6 | 31.38 ± 2.36 | 0.753 |
| 9 weeks | 25.86 ± 1.78 b | 29.53 ± 0.8 a | 29.64 ± 0.47 a | 27.44 ± 0.79 Bab | 25.35 ± 0.81 b | 28.52 ± 0.7 ab | 0.036 |
| p-value | 0.187 | 0.160 | 0.272 | 0.034 | 0.050 | 0.325 | |
| HDL-C (µmol/g) | 3 weeks | 9.62 ± 0.59 A | 9.92 ± 0.49 A | 9.79 ± 0.52 A | 10.28 ± 0.34 A | 10.04 ± 0.16 A | 10.04 ± 0.16 A | 0.901 |
| 6 weeks | 6.09 ± 1.05 Bb | 6.43 ± 1.03 Bb | 6.9 ± 0.65 Bab | 7.22 ± 0.43 Bab | 8.32 ± 0.78 ABab | 9.12 ± 0.54 ABa | 0.042 |
| 9 weeks | 6.85 ± 0.20 Bb | 6.81 ± 0.41 Bb | 6.99 ± 0.12 Bb | 7.37 ± 0.21 Bb | 7.54 ± 0.17 Bab | 8.57 ± 0.05 Ba | 0.001 |
| p-value | 0.027 | 0.023 | 0.009 | 0.001 | 0.023 | 0.048 | |
Table 12.
The impact of high temperatures on lipid content of egg yolk and the effects of dietary CX supplementation under high temperature on lipid content of egg yolk: a comprehensive analysis of Calcium (Ca), Phosphorus (P), Vitamin B2 (Vb2) over 3-week, 6-week, and 9-week periods. Data are presented as mean ± standard deviation. n = 6 replicates.
| Item | Time | NC | HC | HCX4 | HCX6 | HCX8 | HCX10 | p-Value |
|---|
| Ca (g/kg) | 3 weeks | 0.5 ± 0.04 c | 0.53 ± 0.00 c | 0.52 ± 0.00 Bc | 0.6 ± 0.03 a | 0.57 ± 0.02 ab | 0.61 ± 0.01 Ba | 0.015 |
| 6 weeks | 0.43 ± 0.04 b | 0.53 ± 0.02 a | 0.48 ± 0.01 Cab | 0.54 ± 0.02 a | 0.54 ± 0 a | 0.54 ± 0.03 Ca | 0.016 |
| 9 weeks | 0.56 ± 0.04 c | 0.53 ± 0.01 c | 0.57 ± 0.01 Abc | 0.67 ± 0.06 ab | 0.61 ± 0.03 ac | 0.69 ± 0.01 Aa | 0.026 |
| p-value | 0.117 | 0.991 | 0.000 | 0.153 | 0.150 | 0.005 | |
| P (mg/kg) | 3 weeks | 0.98 ± 0.04 | 1.01 ± 0.02 | 0.98 ± 0.02 | 0.99 ± 0.02 | 1.01 ± 0.02 | 0.99 ± 0.02 | 0.792 |
| 6 weeks | 0.96 ± 0.03 | 1.05 ± 0.03 | 1.01 ± 0.03 | 1 ± 0.04 | 0.98 ± 0.04 | 0.97 ± 0.04 | 0.622 |
| 9 weeks | 1.00 ± 0.05 | 0.98 ± 0.00 | 0.94 ± 0.00 | 0.98 ± 0.01 | 1.04 ± 0.01 | 1.00 ± 0.02 | 0.132 |
| p-value | 0.797 | 0.129 | 0.100 | 0.895 | 0.370 | 0.764 | |
| VB2 (mg/kg) | 3 weeks | 2.57 ± 0.08 a | 1.86 ± 0.1 Abc | 2.24 ± 0.11 ac | 1.78 ± 0.09 c | 2.34 ± 0.21 ab | 2.3 ± 0.26 ab | 0.030 |
| 6 weeks | 2.46 ± 0.62 ab | 1.3 ± 0.16 Bb | 1.64 ± 0.39 ab | 2.97 ± 0.57 a | 2.81 ± 0.41 a | 2.51 ± 0.37 a | 0.016 |
| 9 weeks | 2.53 ± 0.25 ab | 1.08 ± 0.06 Bb | 1.45 ± 0.30 b | 3.64 ± 0.66 a | 2.18 ± 0.27 ab | 3.11 ± 0.82 a | 0.018 |
| p-value | 0.979 | 0.006 | 0.213 | 0.099 | 0.380 | 0.576 | |


