Abstract
Pandan leaves have a prominent glutinous-rice aroma; however, few studies have explored their volatile aroma compound composition. Herein, the differences in the volatile aroma components of fresh and dried pandan leaves were investigated for the first time using HS–SPME–GC–O–MS combined with principal component analysis, orthogonal partial least squares discriminant analysis, and HS-GC-IMS with aroma fingerprinting. A total of 93 volatile compounds were identified, exceeding previous reports, including 43 main flavor components with odor activity values (OAV) > 1. OAV and aroma extract dilution analysis tests reveal 13 main aroma volatiles including 2-acetyl-1-pyrroline, hexanal, nonanal, phenylacetaldehyde, β-cyclocitral, butanal, ethyl caprylate, ethyl nonanoate, ethyl caprate, ethyl laurate, 3-hydroxy-2-butanone, acetophenone, and α-ionone. Sixteen types of aromas were classified, and the results are presented as flavor wheels. The findings of this study elucidate the changes and retention of aroma volatiles in differently processed leaves, which could benefit food industry applications.
1. Introduction
Pandanus amaryllifolius Roxb. or “pandan”, which belongs to the Pandanaceae family, is a tropical plant of the Pandanus (screw pine) genus. Pandan is the only Pandanus species with fragrant leaves and is primarily distributed throughout Southeast Asia, including Malaysia, Thailand, Indonesia, and China. Pandan leaves have a “sticky rice” fragrance and are known as the “vanilla of the Orient” [1]. Thus, pandan leaves are primarily used in the folk and spice industries as a spice additive or flavor adjunct.
Pandan-leaf processing is an important aspect of industrial production. Owing to the considerable loss of aroma and increased perishability caused by moisture in pandan leaves, common pre-treatments such as dehydration, thermal processing, and freeze-drying are employed. However, the flavor, preservation, and transport quality of food products are significantly affected by such processing treatments. For example, dehydration extends food-product shelf life while also inducing new attractive organoleptic properties; thermal processing applies high temperatures that induce the release of new aroma substances, thereby rendering the food more flavorful; and freeze-drying preserves food by reducing water activity and chemical reaction rates, while also having the potential to yield a higher recovery of key aroma components, which can provide a more pronounced characteristic flavor. However, freeze-drying slightly reduces the proportion of volatile or aroma-active compounds. To maximize pandan-leaf aroma, spray drying [2], solvothermal extraction [3], and freeze-drying [4] have been used for pandan-leaf processing; however, different processing techniques yield significant differences in the green note and mild pandan aroma of the resultant pandan leaves [5,6].
Pandan-leaf oil comprises various volatile compounds encompassing groups of alcohols, aliphatic compounds, carboxylic acids, ketones, aldehydes, esters, hydrocarbons, furans, furanones, and terpenoids [4]. Several studies have analyzed the organoleptic origins of the “glutinous rice” flavor of pandan leaves, focusing on the volatile compounds responsible for this characteristic flavor. Many studies have focused on 2-acetyl-1-pyrroline (2-AP) [1,3,7], which is one of the main sources of the characteristic pandan-leaf aroma. In the 1970s, researchers conducted an extraction of pandan leaves with a blend of chloroform and methanol as the solvent mixture, followed by the use of thin-layer chromatography to identify an oxidized product that included a yellow carotenoid pigment [8], and this polymer was described as peculiarly popcorn-like, with a typical pandan-leaf aroma. Buttery reported using vacuum water-vapor distillation in sequential extraction combined with gas chromatography–mass spectrometry (GC-MS) to identify a major eluting component in 12 volatile oils obtained from lyophilized samples. The Kovats retention index (KI) of this component matched that of synthesized 2-AP samples [9]. He also found that 2-AP was ten times more abundant in pandan leaves than in aromatic rice, indicating that 2-AP is not only the main differential flavoring substance among different aromatic rice varieties but also a compound that contributes significantly to the flavor of pandan leaves.
In later years, pre-treatment measures were primarily used for in-depth investigation of other volatile aroma components of pandan leaves, including supercritical CO2 extraction [10,11], solvent extraction [12,13], and simultaneous distillation-extraction combined with GC-MS. For example, Jiang has performed the centrifugal extraction of fresh pandan-leaf samples using dichloromethane as a solvent and analyzed the supernatant in combination with GC-MS and obtained 22 compounds [14]. The results indicated that 3-methyl-2(5H)-furanone was the major extract component, constituting 73% of the total volatile components, which were mainly characterized as having a caramelized, herbaceous aroma. Other major volatile components included 3-hexanol, 4-methyl-2-pentanol, 3-hexanone, and 2-hexanone, collectively accounting for 2.65–7.09% of the total volatile profile. These researchers concluded that C6 compounds contribute significantly to the fresh, green aroma profile of pandan leaves. Wakte identified the volatile constituents of 37 different varieties of pandan leaves distributed across peninsular India using headspace-solid phase microextraction-GC-flame ionization detection (HS-SPME-GC-FID). They found that these varieties contained 19 shared volatile compounds, which constituted more than 85% of the total volatile compounds; these volatile compounds had a typically pandan-like, green, and bean aroma [7]. Therefore, previous analyses of pandan leaves performed using different analytical methods have yielded volatile compounds that vary considerably in type, quantity, and aromatic structure. To better understand the effects of different processing methods on the volatile aroma–compound composition and the overall flavor of pandan leaves, a systematic and comprehensive study of the available flavor detection methods, processes, and statistical analysis methods must be conducted to provide a theoretical basis for further pandan-leaf processing and application.
HS-SPME-GC-MS enables accurate qualitative and quantitative analyses of different volatile compounds; however, this technique provides no sensory information. Olfactometric detection systems, which are electronic instruments that use the human nose to detect the odor intensity of analytes, can validate vague, non-subjective sensations using MS and matching to NIST libraries. In this way, samples can be correlated with all aroma types and complex analytical methods can be simplified to characterize and differentiate food products with distinctive aroma features.
Headspace gas chromatography–ion mobility spectrometry (HS-GC-IMS) is an effective analytical method for the separation and identification of trace volatile organic compounds (VOCs) in complex matrices [15]. The combination of GC and IMS offers enhanced separation capabilities and rapid responses. Therefore, HS-GC-IMS has a fast response, high analytical efficiency, and a wide detection threshold while also being easy to operate. This technique characterizes chemical ionic substances based on differences in the gas-phase mobilities of different ions in an electric field. HS-GC-IMS has been successfully applied to the analysis of honey [16] and coffee [17], which have complex flavor profiles and characteristic aromas, with easily overlooked flavor compounds being resolved. This method can detect volatiles with concentration resolutions as low as micrograms per liter, without the need for complex sample pre-treatment. Additionally, HS-GC-IMS can precisely identify volatiles in a non-targeted manner based on two-dimensional (2D) information in the GC retention time (RT) and IMS drift time. Currently, this technology is being applied to food additives [18], plants [19], tobacco [20], environment sensing [21], and medicine [22].
Principal component analysis (PCA) and orthogonal projections to latent structures discriminant analysis (OPLS-DA) are powerful statistical modeling tools that provide insights into separations between experimental groups based on high-dimensional spectral measurements from NMR, MS, or other analytical techniques. To prove that the ingredients tested are real and valid, multiple tests and multivariate statistical methods must be used to validate a method. This study represents the first investigation of the differences in volatile aroma components of fresh and dried pandan leaves through the aforementioned methods. Fresh pandan leaves were sourced from Hainan, China, with some samples subjected to sun- and freeze-drying treatments. The volatile aroma components of fresh, sun-dried, and freeze-dried samples were extracted and enriched using HS-SPME combined with GC-MS and GC-IMS, and were identified and classified using olfactory tests and OAV analytical techniques.
2. Materials and Methods
2.1. Materials
2.1.1. Raw Materials
Fresh pandan leaves were collected in September 2022 from a pandan farm in Wanquan Colorful Science and Technology Agriculture Co., Ltd., (Wanning, China). The selected variety is representative and widely grown in Southeast Asia. To characterize the pandan-leaf aroma as accurately as possible, samples were randomly taken over 2 d of storage at 4 °C. In total, 2 kg of pandan leaves were extracted and processed without mechanical damage.
Fresh pandan leaves were artificially ground under liquid nitrogen drying and sieved through a 60-mesh sieve to obtain a powder. In the sun-drying process, the pandan leaves were naturally dried at 25 °C for 7 d, before being crushed through a 60-mesh sieve to obtain a powder. With reference to the optimization process [23], in the freeze-drying process, the pandan leaves were crushed, immersed in a water bath, centrifuged, vacuum freeze-dried, and cryogenically milled through a 60-mesh sieve to obtain powder samples. In this paper T1-1, T1-2, and T1-3 were used to name the fresh sun-dried and freeze-dried samples of pandan leaves, respectively. All prepared samples were stored in an ultra-low-temperature refrigerator at −80 °C until analysis prior to loading. The experimental analyses were performed in three batches.
2.1.2. Chemicals
A standard mixture of n-alkanes (C5–C20), 2-octanol, 2-nonanone (as an internal standard, 99%), used to calculate KIs, and 2-AP (as an internal standard, 97%) was purchased from Energy-Chemical Reagents, Ltd. (Shanghai, China). A mixture of standards for the detection of six ketones (2-butanone, 2-pentanone, 2-hexanone, 2-heptanone, 2-octanone, and 2-nonanone) was purchased from Aladdin Chemical Reagent Co. (Shanghai, China). Chromatography-grade ethanol was purchased from Sigma Chemical Reagents (St. Louis, MO, USA).
2.2. HS-GC-IMS Preparations
Each sample was transferred to liquid nitrogen for rapid pre-cooling, milled and sieved through a 60-mesh sieve, packed in a vacuum-sealed food-grade polyethylene plastic storage bag, and stored frozen at −80 °C. For testing, 1.000 g of each sample was accurately weighed on an electronic balance (AL104-1C Electronic Analytical Balance, Mettler Toledo, Shanghai, China) and mixed with 1000 μL of the internal standard (10 mg/L of 2-nonanone in ethanol solvent) before being placed in a 20 mL HS injection bottle. The sample was then incubated at 60 °C and shaken at 500 r/min for 15 min. For each sample, measurements were performed for three parallel groups, and an empty sample bottle was employed as blank control.
2.3. HS–GC–IMS Analysis
The samples were analyzed using an Agilent 8890 gas chromatograph (G.A.S., Dortmund, Germany) equipped with a DB-5MS capillary column (30 m × 0.25 mm, 0.25 μm) and an IMS system with a CTC-PAL 3 static HS autosampling unit (CTC Analytics AG, Zwingen, Switzerland) and a feeding needle (Dortmund, Germany). For the initial column, the GC oven temperature was held at 40 °C for 4 min, before being increased to 100 °C at a rate of 6 °C/min. This was followed by another increase to 250 °C at a rate of 4 °C/min and, finally, holding for 5 min. The GC carrier gas was high-purity helium (≥99.999%), which was supplied at a 1.5 mL/min flow rate in constant flow mode, while the GC oven maintained an inlet temperature of 250 °C. No injection splitting was observed.
The IMS was set to splitless mode, the column temperature was set to 60 °C, and the IMS temperature was 45 °C. High-purity nitrogen (≥99.99%) was used as the drift gas, with a 75 mL/min flow rate. B-rays (3H, 300 MBq) were used as the ionization source, in positive ion mode and with a 53 mm migration tube length. The RIs and drift times were compared with those in the G.A.S. GC-IMS library (Dortmund, Germany) to enable volatile compound identification. The RIs were calculated based on the C4–C9 ortho-ketones, for a 500 V/cm electric field strength and a 45 °C migration tube temperature.
Mixed standards of six ketones were detected and RT and retention index (RI) calibration curves were established. The substance RIs were then calculated from the target RTs. The target volatiles were analyzed qualitatively and semi-quantitatively using the GC RI database (NIST 2020) incorporated in the VOCal software package (version 4).
2.4. HS–SPME
For most volatile compounds, a 10–15 min equilibration time is sufficient [7]. Therefore, a 10 min equilibration time was selected for this study. With reference to the conditions and results of the SPME optimization test reported by Wakte, a 10 mm 80 μm divinylbenzene/carboxen/polydimethylsiloxane fiber assembly (Agilent, Santa Clara, CA, USA) was selected for the sample analysis. Based on our pre-optimized extraction conditions, the samples were accurately weighed at 1.000 g each on a balance (AL104-1C Electronic Analytical Balance, Mettler Toledo Instruments, Geneva, Switzerland) and placed into 20.00 mL HS injection vials spiked with 5 μL of the internal standard (1.02 mg/mL of 2-octanol in ethanol solvent). The vials were then immediately sealed and equilibrated for 10 min at 40 °C. The samples were then analyzed at an extraction temperature of 40 °C and an extraction time of 20 min. The fibers were placed into the inlet port for 5 min using manual HS injection with an SPME injector; they were then thermally desorbed at 250 °C.
2.5. GC–O–MS Analysis
The SPME fibers were thermally desorbed for 5 min on an 8890GC-5977MS GC-MS coupler (Agilent, USA) with an HP-5MS capillary column (30 m × 0.25 mm, 0.25 μm). The GC effluent was separated at a 1:1 ratio at the MS detector and the sniffer port for analysis. The carrier gas was high-purity helium (≥99.999%) at a constant flow rate of 1.5 mL/min. The GC temperature was initially maintained at 40 °C for 4 min. This temperature was then increased to 100 °C at a rate of 6 °C/min for 5 min, held for 5 min, increased to 250 °C at a rate of 4 °C/min and, finally, held for 5 min. The injector, MS-interface, and ion-source temperatures were held at 250, 280, and 230 °C, respectively. The electronic ionization was set to 70 eV with a m/z range of 50–550.
2.6. Aroma Extraction Dilution Analysis
An aroma extraction dilution analysis (AEDA) dilution test was performed under the gas chromatography–olfactometry–mass spectrometry (GC-O-MS) conditions of Section 2.5. An olfactometer (ODP4, GERSTEL) was used for olfactory analysis of the GC effluent substances, with the transfer temperature between the gas chromatograph and olfactory detector set to 280 °C. Three evaluators with the best olfactory statuses were selected from ten panelists with more than three years of experience and a familiarity with food volatiles. Based on the previous reports [24,25], an AEDA dilution test was performed via GC-O-MS on the T1-1, T1-2, and T1-3 samples. The samples were diluted stepwise with dichloromethane at a 1:2 ratio to obtain extract dilution ratios of 1:1, 1:2, 1:4, etc., up to the highest value of 1:512. Each dilution was analyzed using GC-O on a HP-5MS column, and three experienced sensory panel members evaluated each dilution using GC-O. During sniffing, the evaluators were required to describe the sensory characteristics of the corresponding substance and record the RT and aroma type until no aroma was detected. Each member repeated each experiment thrice. The flavor dilution (FD) factor for each compound was defined as the highest dilution that could be smelled. The compounds identified for the three samples (T1-1, T1-2, and T1-3) were validated against the standards in this test.
2.7. Qualitative and Relative Quantitative Analysis of Aroma Components
2.7.1. Qualitative Analysis
C5–C20 n-alkanes were analyzed under the conditions described in Section 2.5, their RT values were recorded. The RIs of the volatiles were calculated according to the linear retention index referring to the IUPAC Compendium of Chemical Technology [26]:
where n and n + 1 represent the number of carbon atoms in the n-alkanes before and after the target compound Y elutes. It has been observed that Tn < TY < Tn+1. Generally, the number of carbon atoms, n, in n-alkanes is greater than 4.
2.7.2. Relative Quantitative Analysis
Referring to the internal standard calculation method of report [27], the relative content of any volatile compound Y in the sample was determined as follows:
where AX and CX are the peak area and relative concentration of the internal standard X, respectively; AY and mY are the peak area and relative concentration of compound Y; and f′Y is the relative mass correction factor of compound Y with respect to the internal standard. In this experiment, the relative correction factor for each compound was 1.000.
The volatiles were determined by comparing the mass spectrum of each analyte to the NIST 17 standard library. The actual RI of compound Y was then calculated and compared with the theoretical value (RI’). In addition, the odor compounds were reconfirmed according to the Flavor-Base FEMA-reported standard odor description database.
2.8. Odor Activity Value Calculation
With reference to the method used in report [28], the ratio of the concentration of an olfactory substance C to its perception threshold T was defined as the OAV. The OAV can be used to determine whether a compound is a significant contributor to the aroma [29]. For any component Y,
where C is the relative content of each volatile compound (%), and T is the corresponding water (fresh) or cellulose (dried) threshold (mg/kg), respectively. An OAV > 1 indicates that the substance component may have a direct impact on the overall odor. Within a certain range, a larger OAV indicates a greater contribution of the substance to the overall odor.
2.9. Data Processing and Statistical Analysis
The GC-O-MS data were analyzed using MassHunter qualitative software version F.01.03, the raw data were maintained using Microsoft Excel 2019, and figures were drawn using OriginPro (version 2022, USA), SIMCA (version 14.1, Sweden), and TBtools (version 1.1, China). The IMS data were processed using Xcalibur Software (version 4.3, Germany), with Reporter and Gallery Plot being used for flavor analysis. VOCal data processing software (version 0.4.03, Germany) was used to obtain 3D, 2D, difference, and fingerprint plots of the volatile constituents for the comparison of the VOCs within the different samples.
All tabular data analysis was conducted using SPSS 13.0. Analysis of variance (ANOVA) tests were performed in triplicate using mean ± standard deviation values. Significant differences were verified via ANOVA and the Duncan multiple range test (p < 0.05). PCA and OPLS-DA plots, along with validation models, were obtained using SIMCA.
3. Results
3.1. HS-GC-IMS Analysis
Figure S1 shows the 3D HS-GC-IMS spectra for the three pandan-leaf treatment samples considered in this study. In each spectrum, the three axes represent the migration time (X axis), RT (Y axis), and signal peak intensity (Z axis). To further visualize and compare the differences in the volatile compound compositions, the spectrum of the T1-1 sample was selected as a reference and subtracted from the spectra of the other samples.
For ease of observation, a top-view comparison is shown in Figure 1A. The abscissa in the 2D GC-IMS spectrum represents the Reactant Ion Peak (RIP) and the ordinate represents the GC RT (s). Each point on either side of a RIP represents a VOC, and two or more spots may represent different aggregates of the same organic matter, such as dimers or multimers, which were formed during GC-IMS analyses. The odor-component content is indicated by the change in the substance peak intensity. Here, the peak intensity of the volatile substance is represented using color shading from blue to red; the darker the color, the greater the peak intensity and the higher the substance content. The figure has shown that the VOCs of the different treatments could be separated via GC within 30 min, and that the components were mainly distributed between 0 and 1500 s, with a drift time of 1.0 ms to 1.5 ms. The three treatments seem quite different; moreover, the 3D peaks were available for comparison (Figure S1).
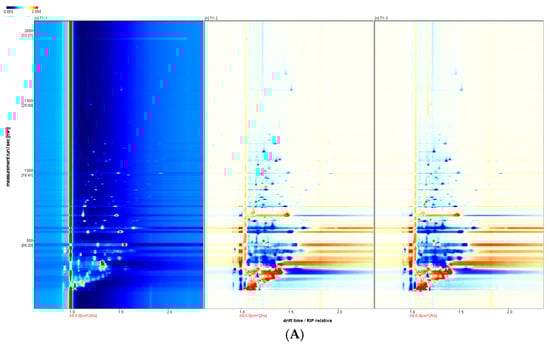
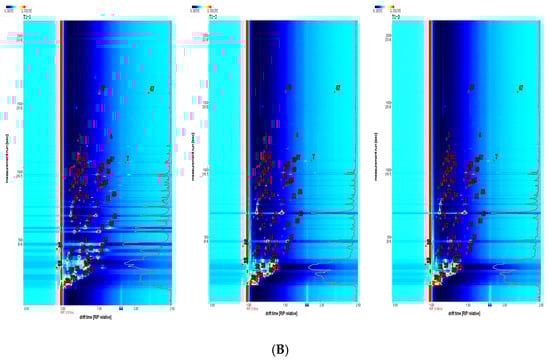
Figure 1.
Comparison of volatiles from different samples by HS-GC-IMS. (A) Two-dimensional GC-IMS difference spectrum of volatile components in pandan leaves. (B) Qualitative GC-IMS spectra of volatile components in pandan leaves.
The GC-IMS analysis results are presented in Table 1. The VOCal plug-in was used to characterize the volatile components in each sample; the characterization spectra are shown in Figure 1B. A total of 63 signal peaks were determined for the three samples. The results matched the GC × IMS database, with 58 components being accurately characterized. Among the detected components, 24 pairs of components appear as a monomer (“M”) or dimer (“D”) because of the ionization of the protonated neutral component before passing through the drift tube during the detection process (see the Supporting Information for more details). A total of 34 compounds were identified using HS-GC-IMS, with a rich composition of VOCs, including 2 nitrogenous compounds, 14 alcohols, 8 aldehydes, 4 ketones, 2 esters, 1 oxygenated compound, 1 alkene, 1 acid, and 1 ether. The volatile-component breakdown is listed in Table 1. In terms of the total volatile concentration (Figure 2), the order was as follows: T1-1 > T1-2 > T1-3.

Table 1.
Contents of volatile components in samples identified by HS-GC-IMS.
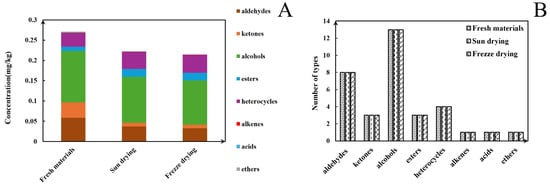
Figure 2.
(A) Contents of different types of volatiles detected under HS-GC-IMS in different samples. (B) Volatile types in pandan leaves in different samples.
To further determine and compare the volatile substances obtained under the different processing methods, the fingerprints of all the volatile substances were established (Figure 3). The aroma compound compositions and distributions differed greatly between the treatments. As shown in the red box in Figure 3, borneol, hexenal, (Z)-2-pentenal, 3-hydroxy-2-butanone, 1-penten-3-ol, 2-methyl-3-furylthiol, benzaldehyde, pentanol, (E)-2-pentenal, heptanal, hexanol, nonanal, 2-phenylethanol, and α-ionone had high concentrations in T1-1. In contrast, 2-ethylfuran, 2-methylpropanol, ethyl acetate, 2-acetylpyrroline, ethanol, butanal, phenylacetaldehyde, and α-phellandrene were more abundant in T1-2 and T1-3, as indicated by the green box.
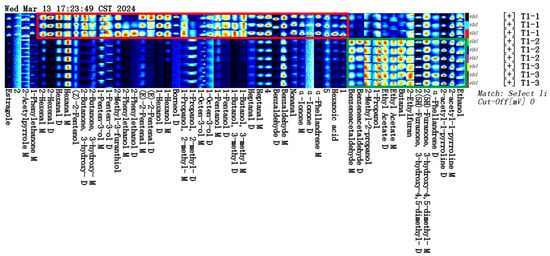
Figure 3.
Aroma fingerprint based on volatile component contents determined by HS-GC-IMS.
3.2. HS-SPME-GC-O-MS Analysis of Volatile Compound Profiles
Based on our pre-optimized HS-SPME-GC-MS sample preparation conditions, the total ion chromatograms of the three samples are shown in Figure 4. The volatile compounds identified through this analysis are listed in Table 2. As shown in Figure 5A, and Table 2, the volatile compound fractions of the pandan leaves were varied, with 72 compounds being identified and classified into eight major groups: 19 aldehydes, 11 ketones, 6 alcohols, 3 heterocyclic groups, 4 aromatic compounds, 20 esters, 8 alkenes, and 1 acid. Figure 5B shows the types and quantities of volatile compounds produced in the employed processes, which mainly consisted of esters, aldehydes, and ketones. Among these, 45, 44, and 29 VOCs were identified for the fresh, sun-dried, and freeze-dried pandan leaves, respectively. Notably, the ester constituents were more abundant in T1-2 and T1-3. In principle, alcohol acyltransferases and dehydrogenases play key roles in the biosynthesis of esters, amino acids, sugars, and lipids, which must be converted to acids, aldehydes, or alcohols before being converted to esters [30]. Acids and alcohols can be converted directly by alcohol acyltransferases, whereas aldehydes must be converted to acids or alcohols before being converted to esters [31]; this aspect is coincidentally illustrated by the greater abundance of aldehydes in T1-1. As an example of the reaction pathways of the substances examined in our study, hexanal can be generated from linoleic acid by the actions of lipoxygenase and hydroperoxide lyase, followed by the oxidation of hexanal to hexanoic acid or the generation of hexanol by the action of alcohol dehydrogenase. Further esterification can generate esters such as ethyl hexanoate [32].
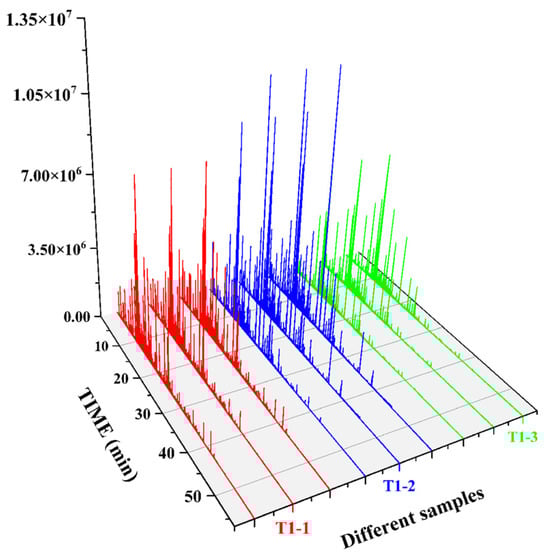
Figure 4.
GC-O-MS total ion chromatograms of three samples.
Table 2.
Total volatile compounds of pandan leaves under different processes identified by HS-SPME-GC-O-MS.
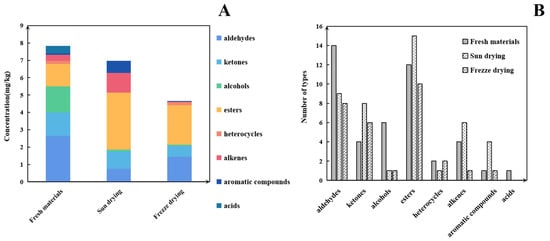
Figure 5.
(A) Content of different types of volatiles detected under HS-SPME-GC-O-MS in different samples. (B) Volatile types in pandan leaves in different samples.
The total volatile matter content was in the order of fresh > sun-dried > freeze-dried. This order is consistent with the HS-GC-IMS results and may be related to the aromatic-substance formation or volatilization caused by the drying process. During the different pretreatment processes, these VOCs may undergo changes before being frozen that are affected by some biochemical metabolic activities; therefore, the formation of aroma during drying is a dynamic process [33]. When it comes to sun-drying, most of the basic and non-basic components of food are degraded to some extent, yielding a wide variety of odorous compounds. Volatile compounds are usually released from fresh product tissues before drying, when cell fragmentation occurs and enzymes and organic substrates isolated from different cell compartments interact. At this stage, the various fatty acids, amino acids, and carbohydrates in the food act as aroma precursor substances, which could be converted to form different volatile compounds under the action of key enzymes. A variety of volatiles collaborate to form an aroma that is unique to the sun-drying method [34].
In the vacuum freeze-drying process, alcohols may oxidize into corresponding aldehydes, ketones, and acids, for example, 1-hexen-3-ol can be converted into 2-hexenal and 2-hexenoic acid. Secondly, the dehydration caused by drying halts many enzymatic reactions in the Pandan leaves. Upon rehydration, water molecules serve as a medium for various enzymatic reactions. The significant decreased content of compounds such as 1-octen-3-ol and 2-octanone after drying can likely be attributed to these enzymatic reactions. Lastly, the diversity of isoenzymes in Pandan leaves may also contribute to different outcomes, although isoenzymes catalyze the same chemical reactions, and their physicochemical properties and molecular structures can differ, leading to varying results [35].
PCA shows the separation among the differently processed samples (Figure 6A). These results have indicated compositional differences in the pandan-leaf volatile components subjected to the different processes. To verify the significance of the aroma differences and to differentiate among the treatments in Table 2, OPLS-DA was employed by taking 72 shared aroma components as dependent variables and the treatments as independent variables (Figure 6B). The fit indexes for the independent and dependent variables (R2x and R2y, respectively) were 0.931 and 0.996, respectively. The model prediction index (Q2) was 0.992, and R2 and Q2 values exceeding 0.5 were obtained, indicating acceptable model fitting [36]. After 200 substitution tests, as shown in Figure 6C, the intersection of the Q2 regression line with the vertical axis was less than 0, which also indicated that there was no model overfitting and that the model validation was effective. These results are considered useful for the future identification of pandan constituents in terms of their processing methods.
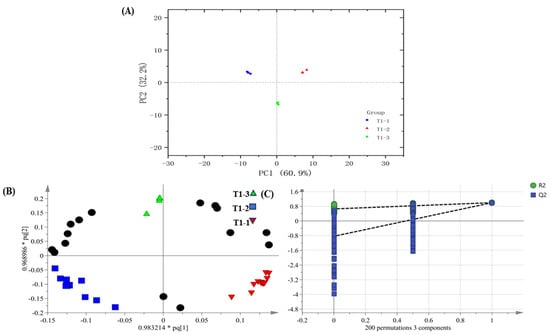
Figure 6.
(A) PCA score diagram, (B) OPLS-DA (The black circle, along with other shapes, represents the significance of compounds), and (C) model cross-validation results of pandan leaves components based on HS-SPME-GC-O-MS data (The black line represents a curve trend with mathematical significance).
The total ion flow chromatogram (Figure 6C) was determined using the peak RT and mass-spectrometry signal intensity parameters of the aroma components. Obvious differences existed between the ion spectra of the different samples. Regarding the differences between the fresh samples and those treated by the different drying processes, some of the aroma components were similar, but the contents of each substance type differed. To further clarify the affinity between the volatile flavor profiles of the different samples, 35 different aroma substances were screened out from the total volatile substances according to the following criteria: p < 0.05 and VIP > 1. A hierarchical clustering heat map was drawn based on the substance content data (Figure 7), from which 10 esters, 7 aldehydes, 6 alkenes, 5 ketones, 2 alcohols, 2 aromatic compounds, 2 heterocyclic compounds, and 1 acid were selected. Region A, highlighted in yellow, contains 12 different aromatic constituents of the fresh pandan-leaf samples, including phenethyl alcohol, (2E,6E)-nona-2,6-dienal, nonanoic acid, and α-ionone. Region B contains the 17 most prominent differential aromatic components in the sun-dried sample, including citral, styrene, 3-buten-2-one, 1-phenylethyl propionate, and ethyl hexanoate. Region C shows the six aroma components with prominent contents in the freeze-dried sample, namely, trans-2-pentenal, 3-(methylthio) propionaldehyde, (3E,5E)-octa-3,5-dien-2-one, ethyl caprylate, ethyl pentadecanoate, and ethyl linoleate.
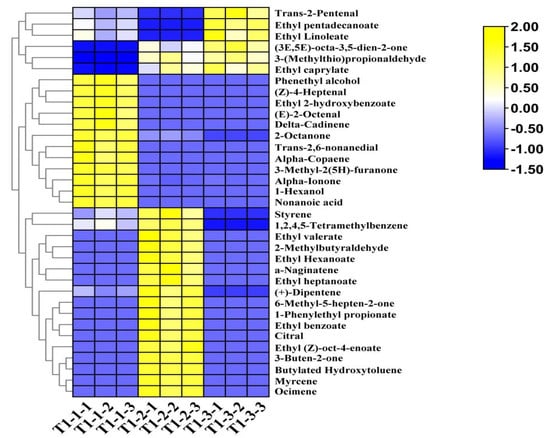
Figure 7.
Differential aroma component clustering heat map of pandan-leaf components based on HS-SPME-GC-O-MS data.
3.3. Key AEDA-Identified Aroma-Active Compounds
Volatiles from the SPME extracts were analyzed using the AEDA sniffing dilution test to determine the volatile compound contributions to the overall aromas of the pandan leaves subjected to different processes. An AEDA sniffing test for 72 compounds was performed based on the stationary-phase RIs, compound-standard RTs, and gradient dilutions utilizing the above GC-O-MS conditions. With the GC-O-MS method, aroma-active compounds were determined based on the air matrix, which differs from the dichloromethane solvent matrix used in the sniff test. Therefore, this work combined the substance content with the odor perception threshold, defined as the OAV, to statistically analyze the validation test results (see Table S1 of the Supporting information for details).
3.4. OAVs of Volatile Compounds in Three Pandanus amaryllifolius Roxb. Samples
The aroma component content is not sufficient for determining the aroma profile. The odor activity value (OAV) is a common method to objectively describe the contribution value of aroma components to the aroma style of a sample [37]. Herein, this work calculated the OAVs of the volatile compounds in all three samples based on the relative substance concentration and detection threshold. Compounds with an OAV > 1 were defined as key odorants (the odorants had OAVs ≥ 1). Table 3 lists 43 volatile compounds with an OAV > 1 and their corresponding dilution factors, grouping the compounds based on their odor properties. Finally, this work plotted the flavor wheels of the different pandan-leaf samples based on the OAVs of the odor properties (Figure 8).
Table 3.
Odor-active compounds identified in pandan leaves by HS-SPME-GC-O-MS and HS-GC-IMS (based on OAV > 1).
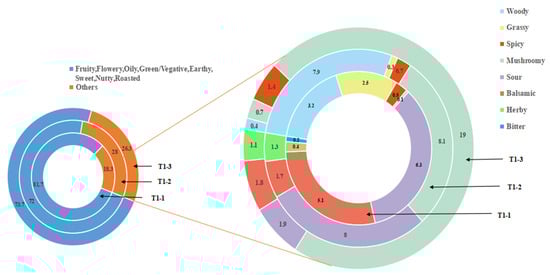
Figure 8.
Flavor wheel of the aroma compounds present in pandan leaves under different processes based on OAVs.
The experimental results (Table 3) also showed that the fresh, sun-dried, and freeze-dried samples had 31, 28, and 18 key odorants, respectively. Further, there were 13 common components among the sample types. This work believes that these 13 compounds together constitute the volatile aroma of pandan leaves, which is an important underlying flavor. Five of the components were aldehydes: hexanal (OAV = 33.86 ± 8.29–73.71 ± 3.64), nonanal (114.85 ± 24.5–203.25 ± 67.55), phenylacetaldehyde (66.25 ± 3.58–85.25 ± 4.33), β-cyclocitral (4.27 ± 0.36–12.63 ± 0.96), and butanal (2.80 ± 0.04–7.84 ± 0.15); four were esters: ethyl caprylate (3.06 ± 0.48–37.83 ± 6.74), ethyl nonanoate (6.78 ± 0.84–21.92 ± 4.99), ethyl caprate (87.25 ± 10.25–712 ± 245.75), and ethyl laurate (106.85 ± 30.45–205.55 ± 78.35); three were ketones: 3-hydroxy-2-butanone (0.44 ± 0.01–2.43 ± 0.08), acetophenone (5.18 ± 0.7–27.44 ± 5.2), and α-ionone (22.6 ± 2.33–124.53 ± 6.98); and one was a nitrogenous compound: 2-AP. Indeed, 2-AP exhibited the highest OAV among the shared compounds (718.01 ± 27.28–1080.06 ± 13.22) and, for all three treatments, 2-AP had OAVs of 700–1000 with FDs of 256–512. In conclusion, 2-AP was the most important odor-active compound in the fresh pandan leaves considered in this study, and the main source of aroma in the processed pandan leaves. Its olfactory aroma types were roasted and sweet.
T1-1 had 31 aroma components with an OAV > 1, which constituted the basic (13) and characteristic (18) key odorants. This work concluded that there were 18 volatile components that could be taken as characteristic aromatic substances, as listed in Table 3. Among them, nonanoic acid, butyl acrylate, decyl aldehyde, (2E,6E)-nona-2,6-dienal, and other aroma components with an OAV > 50 were identified; these components can contribute to green, floral, fruity, and cheesy aromas with high sensory scores. In particular, a higher OAV was obtained for (2E,6E)-nona-2,6-dienal, which was a fresh and delicate fragrance, in T1-1 than in the other samples. This component may enhance the aroma that is characteristic to fresh pandan leaves. For T1-2, 28 aroma components with an OAV > 1 were determined; these components were considered to constitute the basic (13) and characteristic (15) key odorants. Among them, 3-buten-2-one (flowery, woody) and ethyl undecanoate (fruity, coconut) had OAVs of almost 1000, and a sensory predominance of fruity and woody aromas was determined. Methyl benzoate (flowery, fruity, green, herby), ethyl valerate (fruity, herby), and isovalerylaldehyde (fruity, sweet) had an OAV > 50, indicating that these components may also contribute significantly to the aromatic characteristics of sun-dried pandan-leaf samples. Further, the most significant differences in the OAVs among the three samples were obtained for these five substances; thus, they may be the main aromatic components differentiating the different treatments. For T1-3, 18 aroma components had an OAV > 1 and were considered to constitute the basic (13) and characteristic (5) key odorants of the freeze-dried samples.
The OAVs of most aromatic components of the volatile components were similar. For example, ethyl undecanoate (fruity, coconut) and 3-(methylthio) propionaldehyde (roasted, mushroomy) appeared in T1-2; these are new products discovered after processing and drying. Benzaldehyde (roasted, nutty, almond) and trans-2-hexenal (juicy, green) were found in T1-1. However, the only compound that distinguished the freeze-dried sample from the fresh and sun-dried samples was a volatile compound found in the former; namely, isophorone (green, herby), which has a camphor odor characteristic that made the freeze-dried sample easier to distinguish than the samples of the other two treatments. The differential aroma substance of interest was 3-(methylthio) propionaldehyde, which was present in both the processed sun- and freeze-dried samples, with an OAV > 1000. It has a roasted aroma and mushroomy flavor that may not be obvious but that constitutes the base flavor of the volatile aroma. This flavor may be related to the short heating time of the processed powder. Because of the special nature of sun-drying technology, the integrity and activity of the pandan-leaf cells are maintained for a long time during processing, allowing for sufficient enzymatic reactions. During processing, the leaves are subjected to various stresses and, particularly, a comprehensive stress response during the greening process. This stress response is related to dehydration reactions, sustained temperature-induced mechanical damage during sun-drying, and the Maillard reaction [38].
In addition, most of the key odorants had high FD values, indicating consistency between the calculated OAVs of these compounds and the AEDA results; however, exceptions exist. For example, ethyl pentadecanoate had an FD value of 16 in both T1-1 and T1-3, whereas its OAVs were less than 1. These results indicate interactions between the various volatile substances, rather than simple additive relationships, which may affect the retention or release of flavor compounds. These results also confirm that the combination of smell and instrumentation plays a crucial role in food flavor research.
Although this study could investigate volatile aromas in terms of the recombination of aroma substances to discuss the reproduction of artificially blended aromas, just as flavor is the result of a multitude of factor-driven outcomes, this work may be able to discuss more profound flavor mechanisms in terms of metabolites and genes of samples from different regions or varieties.
3.5. Comparative Analysis of HS-SPME-GC-O-MS and HS-GC-IMS Results
In this study, a total of 93 VOCs were identified in three pandan-leaf samples utilizing HS-GC-IMS and HS-SPME-GC-MS. In addition to these, 13 VOCs (benzaldehyde, 2-hexenal, hexanal, 2-acetylpyrrole, 1-hexanol, 2-ethylfuran, (E)-2-pentenal, nonanal, acetophenone, α-ionone) were detected by both analytical methods. Notably, compounds such as estragole, geraniol, 2-butanone, and 2-Methyl-3-furanthiol were observed solely via GC-IMS, suggesting that these compounds may have a negligible contribution to the aromatic profile of pandan leaves. Furthermore, the contribution of VOCs was evaluated using the OAV methodology. The analysis identified 43 compounds with an OAV > 1, and 13 of these compounds were confirmed by both GC-IMS and SPME-GC-O-MS. These include 2-AP, hexanal, nonanal, phenylacetaldehyde, β-cyclocitral, butanal, ethyl caprylate, ethyl nonanoate, ethyl caprate, ethyl laurate, 3-hydroxy-2-butanone, acetophenone, and α-ionone, all of which are hypothesized to significantly influence the characteristic aroma associated with “glutinous rice” or pandan flavor. GC-O-MS demonstrates a higher capacity for identifying volatile compounds compared to GC-IMS, and the concentrations of VOCs discovered by GC-IMS are lower than those identified by GC-O-MS. Consequently, the integration of GC-IMS and GC-O-MS methodologies is proposed to enhance the comprehensive identification and quantification of aroma compounds in complex matrices.
4. Conclusions
All in all, 72 and 34 volatile compounds of fresh pandan and its processed leaves were successfully identified using HS-SPME-GC-O-MS and HS-GC-IMS, respectively. Differential metabolites were analyzed under the criteria of a VIP > 1 and p < 0.05, and the volatile compounds were qualitatively analyzed using an AEDA dilution olfactory test. The differences between fresh leaves and processed leaves were assessed through comparative olfactory tests and OAV results, demonstrating that pandan-leaf aroma can be classified into 16 aroma types. The comparative analysis of the GC-IMS and SPME-GC-O-MS results yielded 13 consensus volatiles, including 2-AP, hexanal, nonanal, phenylacetaldehyde, β-cyclocitral, butanal, ethyl caprylate, ethyl nonanoate, ethyl caprate, ethyl laurate, 3-hydroxy-2-butanone, acetophenone, and α-ionone, which are the key components contributing to the characteristic “glutinous rice” flavor of pandan leaves. Furthermore, there were 31, 28, and 18 compounds in the fresh, sun-dried, and freeze-dried samples, respectively. The differences in these compounds result in subtle variations in the aroma of the various states of pandan leaves. This study provides a theoretical basis for further research on key substances related to the characteristic flavors of plants and offers data supporting the selection of pandan-leaf processing styles and aroma recombination practices.
Supplementary Materials
The following supporting information can be downloaded at: https://www.mdpi.com/article/10.3390/foods14060935/s1, References [39,40,41,42,43,44,45,46,47,48,49,50,51,52,53,54,55] are cited in the Supplementary Materials. Figure S1. Shows a three-dimensional spectrum of GC-IMS, where the three axes represent the ion migration time (X-axis), retention time (Y-axis), and signal intensity (Z-axis); Figure S2. Overlapping chromatograms; Figure S3. Qualitative GC-IMS spectra of volatile components in pandan leaves; Figure S4. Loading Scatter Plot (origin graph in SIMCA); Table S1. The Odor description and compounds of GC-IMS identified volatile compounds from fresh and treated pandan leaves; Table S2. Total volatile compound components in different processes of pandan leaves by HS-SPME-GC-O-MS and AEDA; Table S3. The characterization of 3-(Methylthio)propionaldehyde (Methional); Table S4. Structre of Aroma-active compounds identified by SPME-GC-O-MS and GC-IMS (based on OAV > 1).
Author Contributions
Conceptualization, K.T. and C.C.; methodology, software, validation, Y.L. (Yutong Liu) and Y.L. (Yiye Luo); formal analysis, data curation, original draft preparation, writing, K.T.; investigation, resources, S.L.; writing—review and editing, X.C. and Z.W.; visualization, supervision, project administration and funding acquisition, Z.W. All authors have read and agreed to the published version of the manuscript.
Funding
This research was funded by the Henan Provincial Department of Science and Technology (242102110081).
Institutional Review Board Statement
According to the evaluation procedure outlined in the national standard of China (“GB/T 16291.1-2012”) and “ISO-5496”, the experimental scheme involving sensory evaluation is in line with Chinese national law and does not need ethical approval. In the course of the implementation of this study, no human or animal subjects were used, so no laws related to animals, morality, or the “Declaration of Helsinki” were violated. All participants gave written consent. Before the sensory evaluation, all participants had read the local standard for pandan leaves (DBS 46/004-2022) and were already familiar with the characteristics of this raw material.
Informed Consent Statement
Informed consent was obtained from all subjects involved in the study.
Data Availability Statement
The data presented in this study are available on request from the corresponding authors. The data are not publicly available due to privacy restrictions.
Conflicts of Interest
The authors declare no conflicts of interest.
References
- Ningrum, A.; Minh, N.N.; Schreiner, M. Carotenoids and norisoprenoids as carotenoid degradation products in Pandan Leaves (Pandanus amaryllifolius Roxb.). Int. J. Food Prop. 2015, 18, 1905–1914. [Google Scholar] [CrossRef]
- Loh, S.K.; Che Man, Y.B.; Tan, C.P.; Osman, A.; Hamid, N.S.A. Process optimisation of encapsulated pandan (Pandanus amaryllifolius) powder using spray-drying method. J. Sci. Food Agric. 2005, 85, 1999–2004. [Google Scholar] [CrossRef]
- Routray, W.; Rayaguru, K. Chemical constituents and post-harvest prospects of Pandanus amaryllifolius leaves: A Review. Food Rev. Int. 2010, 26, 230–245. [Google Scholar] [CrossRef]
- Yahya, F.; Lu, T.; Santos, R.C.D.; Fryer, P.J.; Bakalis, S. Supercritical carbon dioxide and solvent extraction of 2-acetyl-1-pyrroline from Pandan leaf: The effect of pre-treatment. J. Supercrit. Fluids 2010, 55, 200–207. [Google Scholar] [CrossRef]
- Omer, N.; Yen-Mun, C.; Ahmad, N.; Yusof, N.S.M. Ultrasound-assisted encapsulation of Pandan (Pandanus amaryllifolius) extract. Ultrason. Sonochem. 2021, 79, 105793. [Google Scholar] [CrossRef]
- Starkenmann, C.; Niclass, Y.; Vuichoud, B.; Schweizer, S.; He, X.F. Occurrence of 2-acetyl-1-pyrroline and its nonvolatile precursors in celtuce (Lactuca sativa L. var. augustana). J. Agric. Food Chem. 2019, 67, 11710–11717. [Google Scholar] [CrossRef]
- Wakte, K.V.; Thengane, R.J.; Jawali, N.; Nadaf, A.B. Optimization of HS-SPME conditions for quantification of 2-acetyl-1-pyrroline and study of other volatiles in Pandanus amaryllifolius Roxb. Food Chem. 2010, 121, 595–600. [Google Scholar] [CrossRef]
- Teng, L.C.; Shen, T.C.; Goh, S.H. The flavoring compound of the leaves of Pandanus amaryllifolius. Econ. Bot. 1979, 33, 72–74. [Google Scholar] [CrossRef]
- Buttery, R.G.; Ling, L.C.; Juliano, B.O.; Turnbaugh, J.G. Cooked rice aroma and 2-acetyl-1-pyrroline. J. Agric. Food Chem. 1983, 31, 823–826. [Google Scholar] [CrossRef]
- Bhattacharjee, P.; Kshirsagar, A.; Singhal, R.S. Supercritical carbon dioxide extraction of 2-acetyl-1-pyrroline from Pandanus amaryllifolius Roxb. Food Chem. 2005, 91, 255–259. [Google Scholar] [CrossRef]
- Laohakunjit, N.; Noomhorm, A. Supercritical carbon dioxide extraction of 2-acetyl-1-pyrroline and volatile components from pandan leaves. Flavour Fragr. J. 2004, 19, 251–259. [Google Scholar] [CrossRef]
- Ngadi, N.; Yahya, N.Y. Extraction of 2-acetyl-1-pyrroline (2AP) in pandan leaves (Pandanus amaryllifolius Roxb.) via solvent extraction method: Effect of solvent. J. Teknol. 2014, 67, 2. [Google Scholar] [CrossRef]
- Tanchotikul, U.; Hsieh, T.C. An improved method for quantification of 2-acetyl-1-pyrroline, a “popcorn”-like aroma, in aromatic rice by high-resolution gas chromatography/mass spectrometry/selected ion monitoring. J. Agric. Food Chem. 1991, 39, 944–947. [Google Scholar] [CrossRef]
- Jiang, J. Volatile Composition of Pandan Leaves (Pandanus amaryllifolius). In Flavor Chemistry of Ethnic Foods; Shahidi, F., Ho, C.T., Eds.; Springer: Boston, MA, USA, 1999. [Google Scholar] [CrossRef]
- Wang, S.; Chen, H.; Sun, B. Recent progress in food flavor analysis using gas chromatography–ion mobility spectrometry (GC–IMS). Food Chem. 2020, 315, 126158. [Google Scholar] [CrossRef]
- Schanzmann, H.; Augustini, A.L.R.M.; Sanders, D.; Dahlheimer, M.; Wigger, M.; Zech, P.-M.; Sielemann, S. Differentiation of monofloral honey using volatile organic compounds by HS-GCxIMS. Molecules 2022, 27, 7554. [Google Scholar] [CrossRef]
- Piotr Konieczka, P.; Aliaño-González, M.J.; Ferreiro-González, M.; Barbero, G.F.; Palma, M. Characterization of Arabica and Robusta coffees by ion mobility sum spectrum. Sensors 2020, 20, 3123. [Google Scholar] [CrossRef]
- Chi, X.; Guo, H.; Zhang, Y.; Zheng, N.; Liu, H.; Wang, J. E-nose, E-tongue combined with GC-IMS to analyze the influence of key additives during processing on the flavor of infant formula. Foods 2022, 11, 3708. [Google Scholar] [CrossRef]
- Shen, D.-Y.; Song, H.-L.; Zou, T.-T.; Wan, S.-Y.; Li, M.-K. Characterization of odor-active compounds in moso bamboo (Phyllostachys pubescens Mazel) leaf via gas chromatography-ion mobility spectrometry, one-and two-dimensional gas chromatography-olfactory-mass spectrometry, and electronic nose. Food Res. Int. 2022, 152, 110916. [Google Scholar] [CrossRef]
- Augustini, A.L.R.M.; Sielemann, S.; Telgheder, U. Strategy for the identification of flavor compounds in e-liquids by correlating the analysis of GCxIMS and GC-MS. Talanta 2021, 230, 122318. [Google Scholar] [CrossRef]
- MacNeil, A.; Li, X.; Amiri, R.; Muir, D.C.G.; Simpson, A.; Simpson, M.J.; Dorman, F.L.; Jobst, K.J. Gas chromatography-(Cyclic) ion mobility mass spectrometry: A novel platform for the discovery of unknown per-/polyfluoroalkyl substances. Anal. Chem. 2022, 94, 11096–11103. [Google Scholar] [CrossRef]
- Zhang, L.; Li, X.; Chen, H.; Wu, Z.; Hu, M.; Yao, M. Haze air pollution health impacts of breath-borne VOCs. Environ. Sci. Technol. 2022, 56, 8541–8551. [Google Scholar] [CrossRef] [PubMed]
- Degenhardt, A.; Krammer, G.; Koch, J.; Tai, M. Novel Pandan Extract Articles in Powder Form and Process for the Production Thereof. U.S. Patent No. 20120213904, 22 February 2012. Available online: https://www.freepatentsonline.com/y2012/0213904.html (accessed on 23 August 2012).
- Li, X.; Zeng, X.; Song, H.; Xi, Y.; Li, Y.; Hui, B.; Li, H.; Li, J. Characterization of the aroma profiles of cold and hot break tomato pastes by GC-O-MS, GC×GC-O-TOF-MS, and GC-IMS. Food Chem. 2023, 405, 134823. [Google Scholar] [CrossRef] [PubMed]
- Zhu, J.; Niu, Y.; Xiao, Z. Characterization of the key aroma compounds in Laoshan green teas by application of odour activity value (OAV), gas chromatography-mass spectrometry-olfactometry (GC-MS-O) and comprehensive two-dimensional gas chromatography mass spectrometry (GC×GC-qMS). Food Chem. 2021, 339, 128136. [Google Scholar] [CrossRef] [PubMed]
- Ceva-Antunes, P.M.N.; Bizzo, H.R.; Silva, A.S.; Carvalho, C.P.S.; Antunes, O.A.C. Analysis of volatile composition of siriguela (Spondias purpurea L.) by solid phase microextraction (SPME). LWT–Food Sci. Technol. 2006, 39, 437–443. [Google Scholar] [CrossRef]
- Zhao, Y.; Zhan, P.; Tian, H.-L.; Wang, P.; Lu, C.; Tian, P.; Zhang, Y.-Y. Insights into the aroma profile in three kiwifruit varieties by HS-SPME-GC-MS and GC-IMS coupled with DSA. Food Anal. Methods 2021, 14, 1033–1042. [Google Scholar] [CrossRef]
- Zhu, Y.; Chen, J.; Chen, X.; Chen, D.; Deng, S. Use of relative odor activity value (ROAV) to link aroma profiles to volatile compounds: Application to fresh and dried eel (Muraenesox cinereus). Int. J. Food Prop. 2020, 23, 2257–2270. [Google Scholar] [CrossRef]
- Van Gemert, L.J. Compilations of Odour Threshold Values in Air, Water and Other Media; Boelens Aroma Chemical Information Service: Huizen, The Netherlands, 2003. [Google Scholar]
- Liu, G.; Huang, L.; Lian, J. Alcohol acyltransferases for the biosynthesis of esters. Biotechnol. Biofuels Bioprod. 2023, 16, 93. [Google Scholar] [CrossRef]
- Rowland, O.; Domergue, F. Plant fatty acyl reductases: Enzymes generating fatty alcohols for protective layers with potential for industrial applications. Plant Sci. 2012, 193, 28–38. [Google Scholar] [CrossRef]
- Jelen, H.; Wasowicz, E. Lipid-derived flavor compounds. In Food Flavors: Chemical, Sensory, and Technological Properties; Jelen, H., Ed.; CRC Press: Boca Raton, FL, USA, 2011; pp. 65–89. [Google Scholar]
- Lewicki, P.P. Effect of pre-drying treatment, drying and rehydration on plant tissue properties: A review. Int. J. Food Prop. 1998, 1, 1–22. [Google Scholar] [CrossRef]
- Suharta, S.; Hunaefi, D.; Wijaya, C.H. Changes in volatiles and aroma profile of andaliman (Zanthoxylum acanthopodium DC.) upon various drying techniques. Food Chem. 2021, 365, 130483. [Google Scholar] [CrossRef]
- Marco, P.; Campo, E.; Oria, R.; Blanco, D.; Venturini, M.E. Effect of lyophilisation in the black truffle (Tuber melanosporum) aroma: A comparison with other long-term preservation treatments (freezing and sterilization). Acta Hortic. 2018, 1194, 831–838. [Google Scholar] [CrossRef]
- Yun, J.; Cui, C.; Zhang, S.; Zhu, J.; Peng, C.; Cai, H.; Yang, X.; Hou, R. Use of headspace GC/MS combined with chemometric analysis to identify the geographic origins of black tea. Food Chem. 2021, 360, 130033. [Google Scholar] [CrossRef] [PubMed]
- Guth, H. Quantitation and sensory studies of character impact odorants of different white wine varieties. J. Agric. Food Chem. 1997, 45, 3027–3032. [Google Scholar] [CrossRef]
- Kerler, J.; van der Ven, J.G.M.; Weenen, H. α-Acetyl-N-heterocycles in the Maillard reaction. Food Rev. Int. 1997, 13, 553–575. [Google Scholar] [CrossRef]
- Garrido-Delgado, R.; del Mar Dobao-Prieto, M.; Arce, L.; Valcárcel, M. Determination of volatile compounds by GC–IMS to assign the quality of virgin olive oil. Food Chem. 2015, 187, 572–579. [Google Scholar] [CrossRef]
- Yao, W.; Ma, S.; Wu, H.; Liu, D.; Liu, J.; Zhang, M. Flavor profile analysis of grilled lamb seasoned with classic salt, chili pepper, and cumin (Cuminum cyminum) through HS-SPME-GC-MS, HS-GC-IMS, E-nose techniques, and sensory evaluation on Sonit sheep. Food Chem. 2024, 454, 139514. [Google Scholar] [CrossRef]
- Bleicher, J.; Ebner, E.E.; Bak, K.H. Formation and analysis of volatile and odor compounds in meat—A review. Molecules 2022, 27, 6703. [Google Scholar] [CrossRef]
- Engel, K.H. The Importance of Sulfur-Containing Compounds to Fruit Flavors. In Flavor Chemistry; Teranishi, R., Wick, E.L., Hornstein, I., Eds.; Springer: Boston, MA, USA, 1999. [Google Scholar] [CrossRef]
- Iranshahi, M. A review of volatile sulfur-containing compounds from terrestrial plants: Biosynthesis, distribution and analytical methods. J. Essent. Oil Res. 2012, 24, 393–434. [Google Scholar] [CrossRef]
- Kelebek, H.; Kesen, S.; Sonmezdag, A.S.; Cetiner, B.; Kola, O.; Selli, S. Characterization of the key aroma compounds in tomato pastes as affected by hot and cold break process. J. Food Meas. Charact. 2018, 12, 2461–2474. [Google Scholar] [CrossRef]
- Goulet, C.; Kamiyoshihara, Y.; Lam, N.B.; Richard, T.; Taylor, M.G.; Tieman, D.M.; Klee, H.J. Divergence in the enzymatic activities of a tomato and Solanum pennellii alcohol acyltransferase impacts fruit volatile ester composition. Mol. Plant 2015, 8, 153–162. [Google Scholar] [CrossRef]
- Smit, B.A.; Engels, W.J.; Smit, G. Branched chain aldehydes: Production and breakdown pathways and relevance for flavour in foods. Appl. Microbiol. Biotechnol. 2009, 81, 987–999. [Google Scholar] [CrossRef] [PubMed]
- Wei, X.; Handoko, D.D.; Pather, L.; Methven, L.; Elmore, J.S. Evaluation of 2-acetyl-1-pyrroline in foods, with an emphasis on rice flavor. Food Chem. 2017, 232, 531–544. [Google Scholar] [CrossRef] [PubMed]
- Reineccius, G. Choosing the correct analytical technique in aroma analysis, University of Minnesota, USA. Flavor Food 2006, 2006, 81–97. [Google Scholar] [CrossRef]
- Matich, A.; Rowan, D. Pathway analysis of branched-chain ester biosynthesis in apple using deuterium labeling and enantioselective gas chromatography−mass spectrometry. J. Agric. Food Chem. 2007, 55, 2727–2735. [Google Scholar] [CrossRef]
- Cheetangdee, V.; Chaiseri, S. Free amino acid and reducing sugar composition of pandan (Pandanus amaryllifolius) leaves. Agric. Nat. Resour. 2006, 40 (Suppl.), 67–74. [Google Scholar]
- Wong, K.H.; Aziz, A.; Mohamed, S. Sensory aroma from Maillard reaction of individual and combinations of amino acids with glucose in acidic conditions. Int. J. Food Sci. Technol. 2006, 43, 1512–1519. [Google Scholar] [CrossRef]
- Adams, A.; De Kimpe, N. Formation of pyrazines and 2-acetyl-1-pyrroline by Bacillus cereus. Food Chem. 2007, 101, 1230–1238. [Google Scholar] [CrossRef]
- Romanczyk, L.J.; McClelland, C.A.; Post, L.S.; Aitken, W.M. Formation of 2-acetyl-1-pyrroline by several Bacillus cereus strains isolated from cocoa fermentation boxes. J. Agric. Food Chem. 1995, 43, 469–475. [Google Scholar] [CrossRef]
- Rungsardthong, V.; Noomhoom, A. Production of 2-acetyl-1-pyrroline by microbial cultures. Flavour Fragr. J. 2005, 20, 710–714. [Google Scholar] [CrossRef]
- Song, H.; Liu, J. GC-O-MS technique and its applications in food flavor analysis. Food Res. Int. 2018, 114, 187–198. [Google Scholar] [CrossRef]
Disclaimer/Publisher’s Note: The statements, opinions and data contained in all publications are solely those of the individual author(s) and contributor(s) and not of MDPI and/or the editor(s). MDPI and/or the editor(s) disclaim responsibility for any injury to people or property resulting from any ideas, methods, instructions or products referred to in the content. |
© 2025 by the authors. Licensee MDPI, Basel, Switzerland. This article is an open access article distributed under the terms and conditions of the Creative Commons Attribution (CC BY) license (https://creativecommons.org/licenses/by/4.0/).