
Green Extraction Methods Applied to the Brown Macroalga Saccharina latissima: Assessing Yield, Total Phenolics, Phlorotannins and Antioxidant Capacity
 ,
,  ,
,  and
and
Abstract
1. Introduction
2. Materials and Methods
2.1. Proximate Composition of the Raw Material
2.2. Chemicals and Reagents
2.3. Extraction Processes
2.3.1. Conventional Reflux Extraction (CRE)
2.3.2. Microwave-Assisted Extraction (MAE)
2.3.3. Pressurized Liquid Extraction (PLE)
2.3.4. Kinetics Study for the Alternative Extraction Methods
2.3.5. Extraction Yield (Ey)
2.4. Chemical Analysis
2.4.1. Total Phenolics Content (TPC) and UHPLC-q-TOF-MS/MS
2.4.2. Total Phlorotannins Content (TPTs)
2.4.3. DPPH Radical Scavenging Capacity
2.4.4. ABTS Radical Scavenging Assay
2.4.5. Oxygen Radical Absorbance Capacity (ORAC)
2.5. Statistical Analysis
3. Results and Discussion
3.1. S. latissima Proximal Composition and Kinetics Curves for MAE and PLE Assays
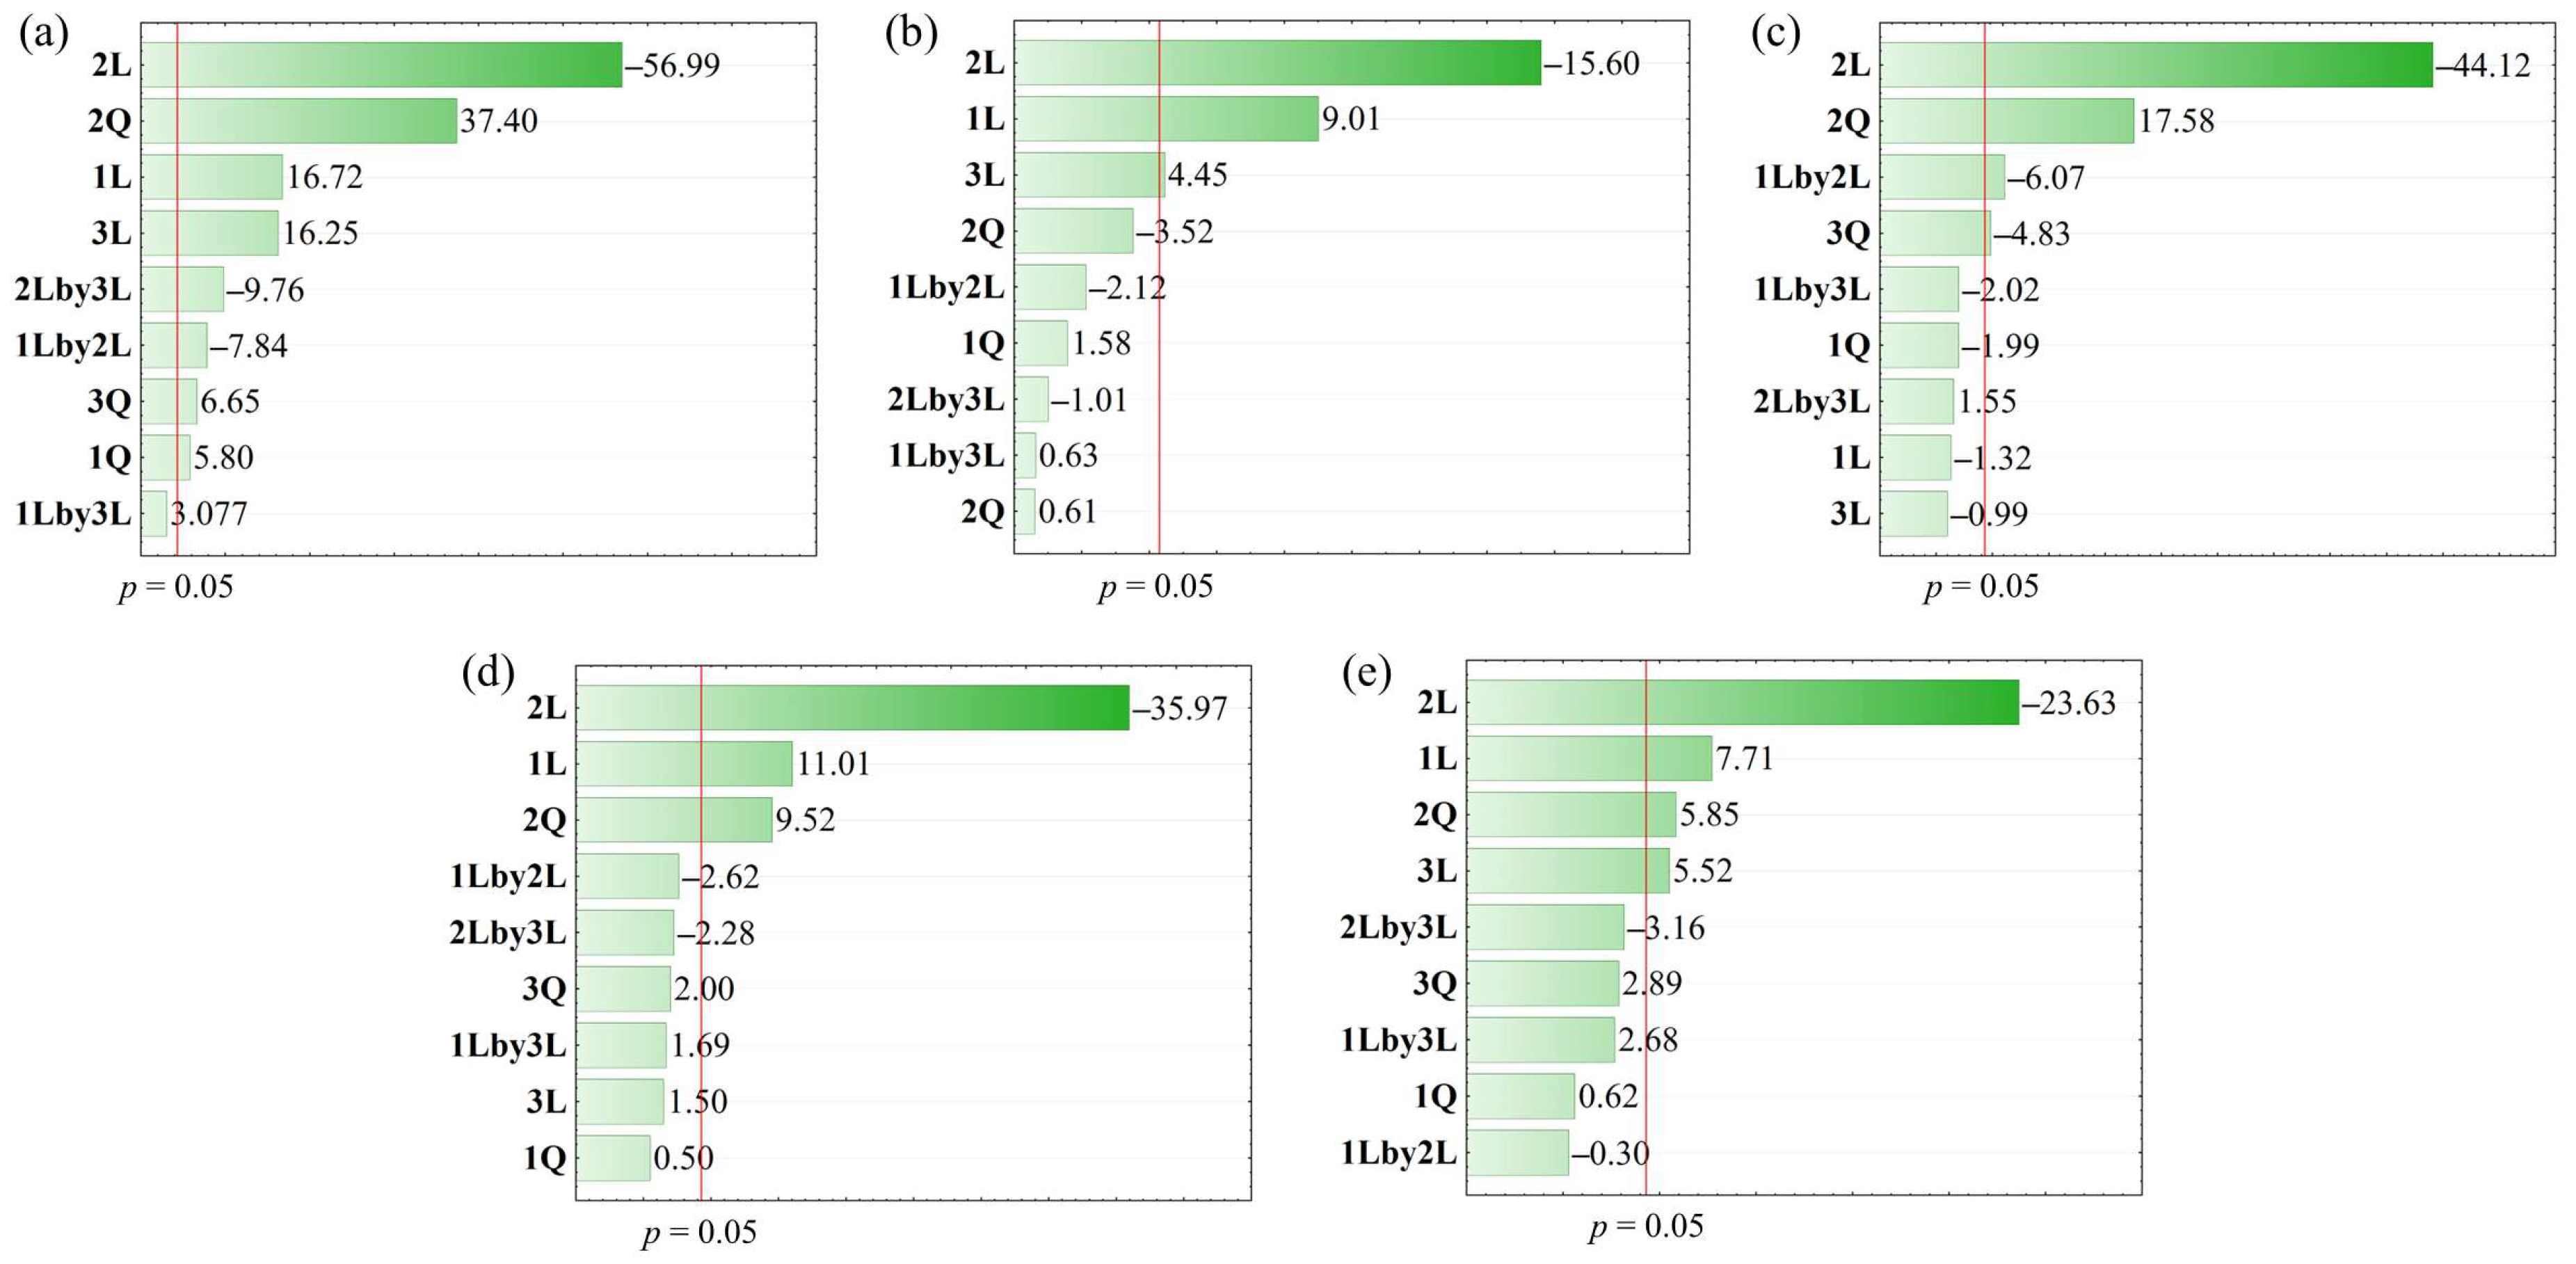
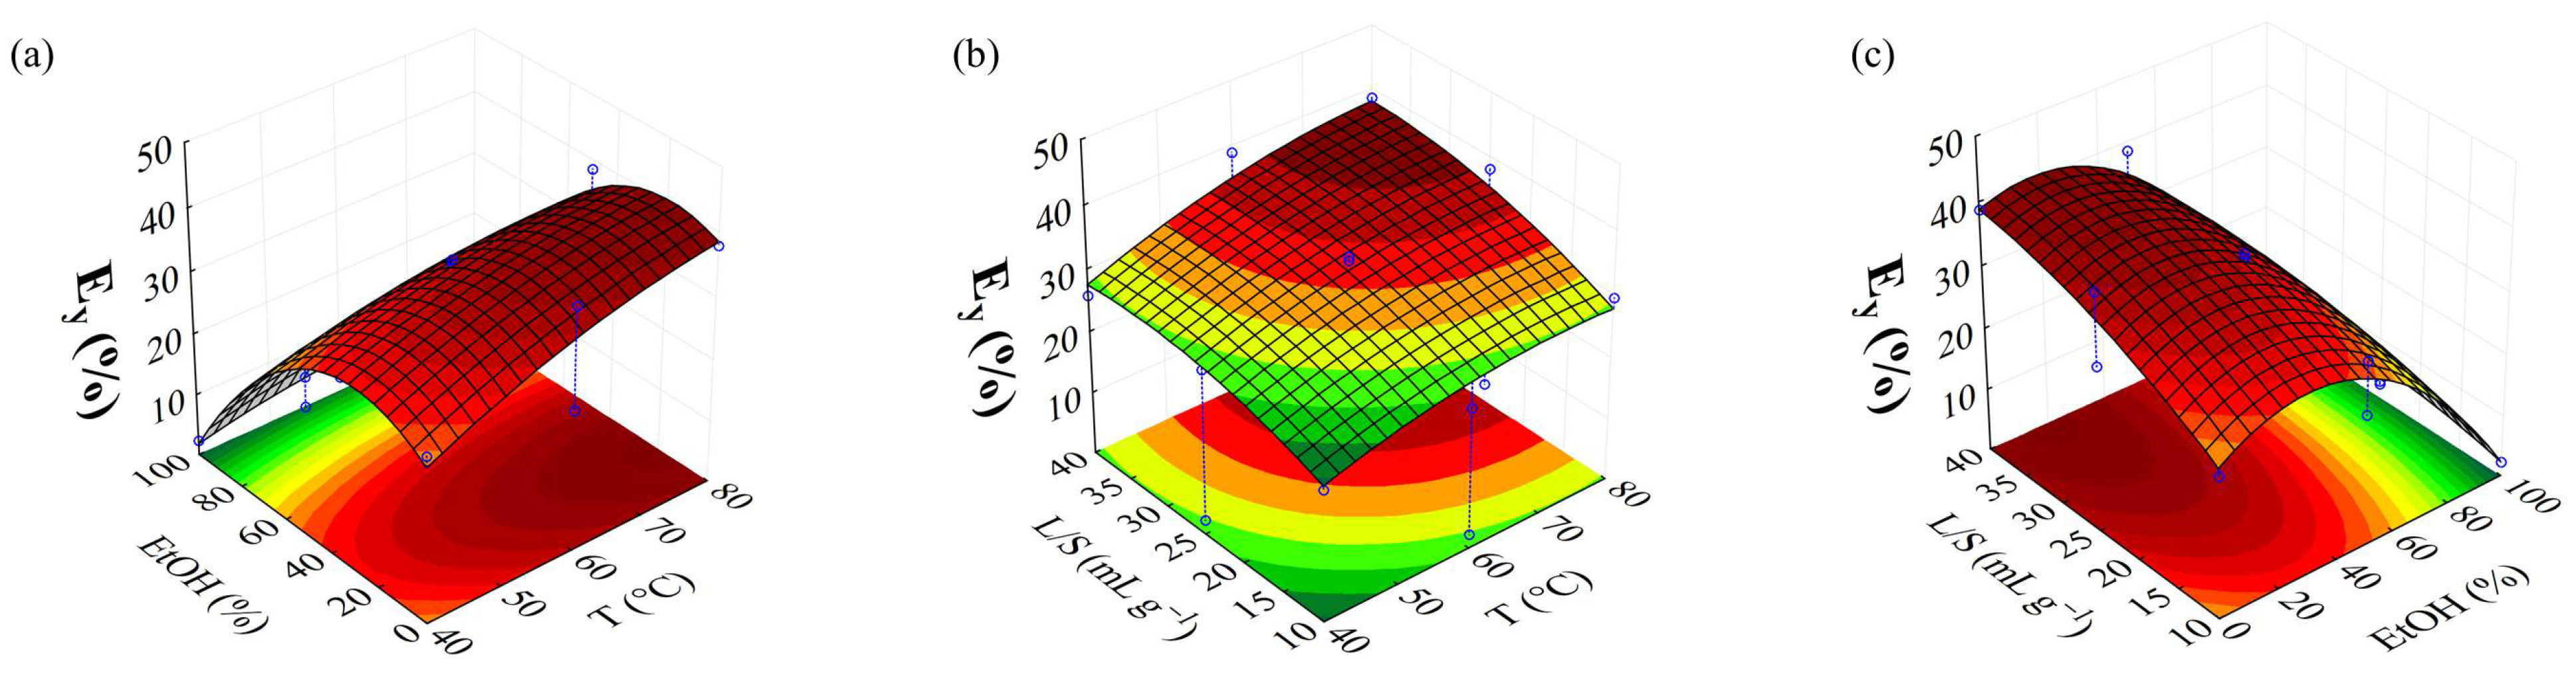
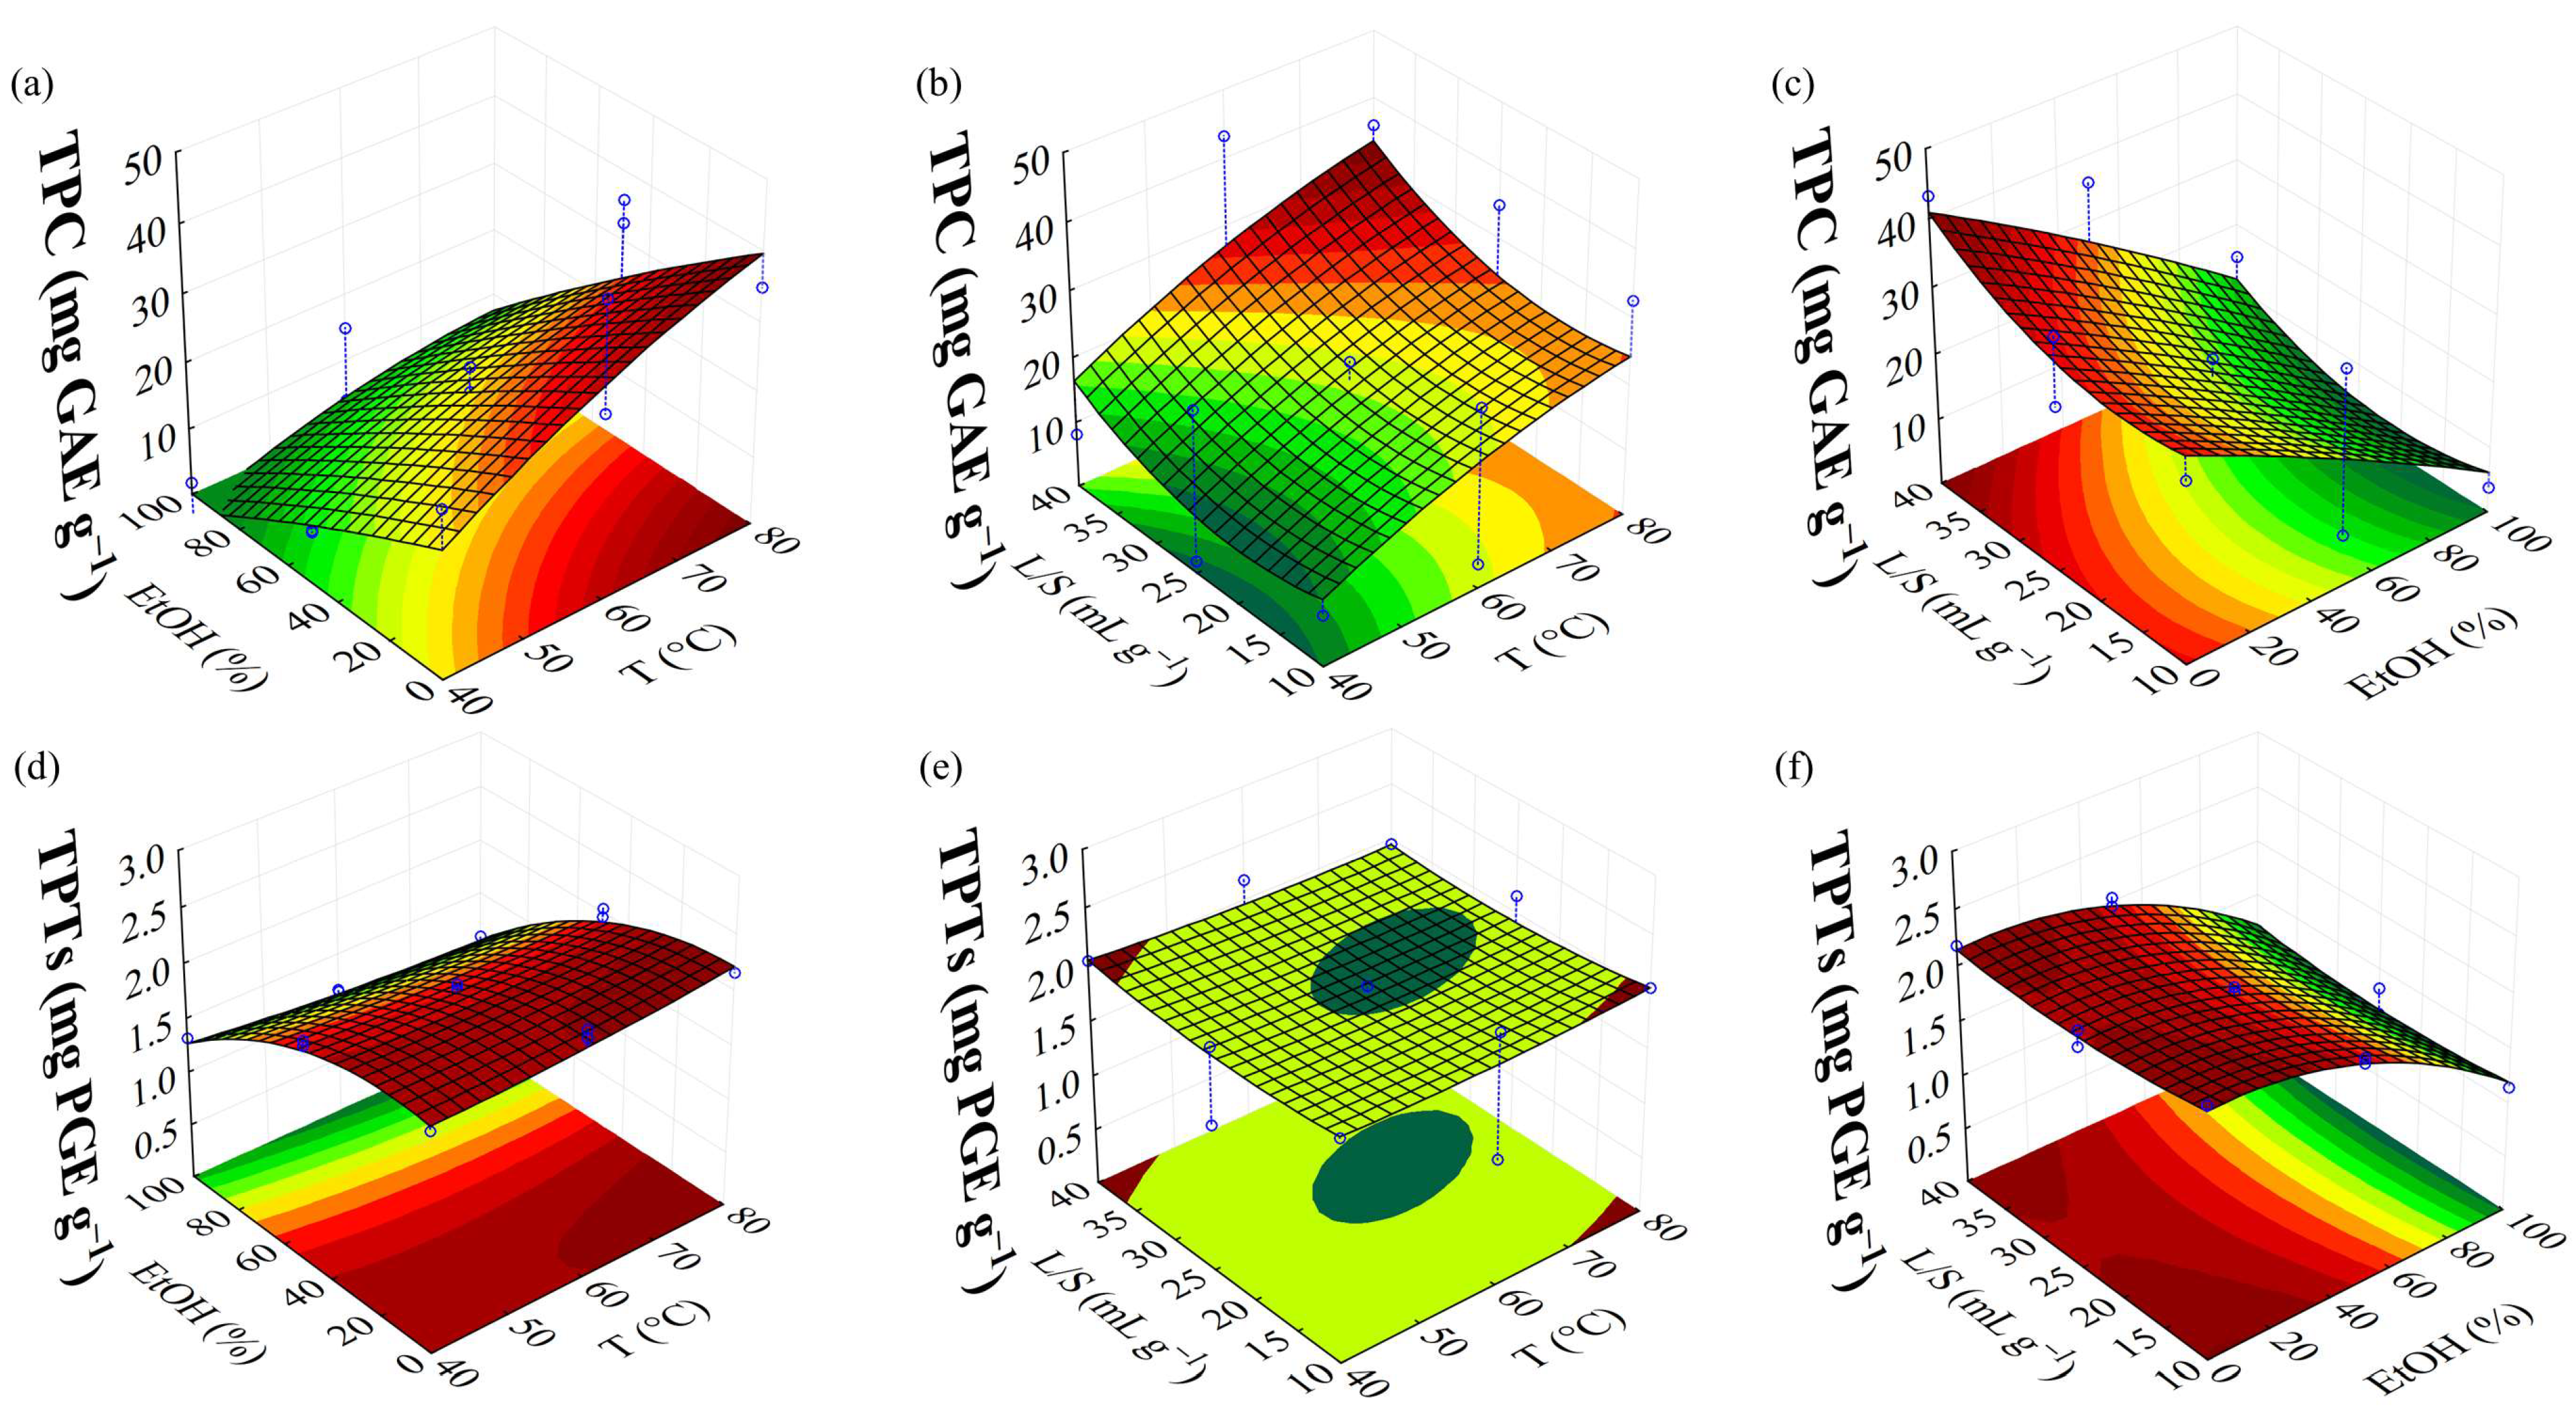
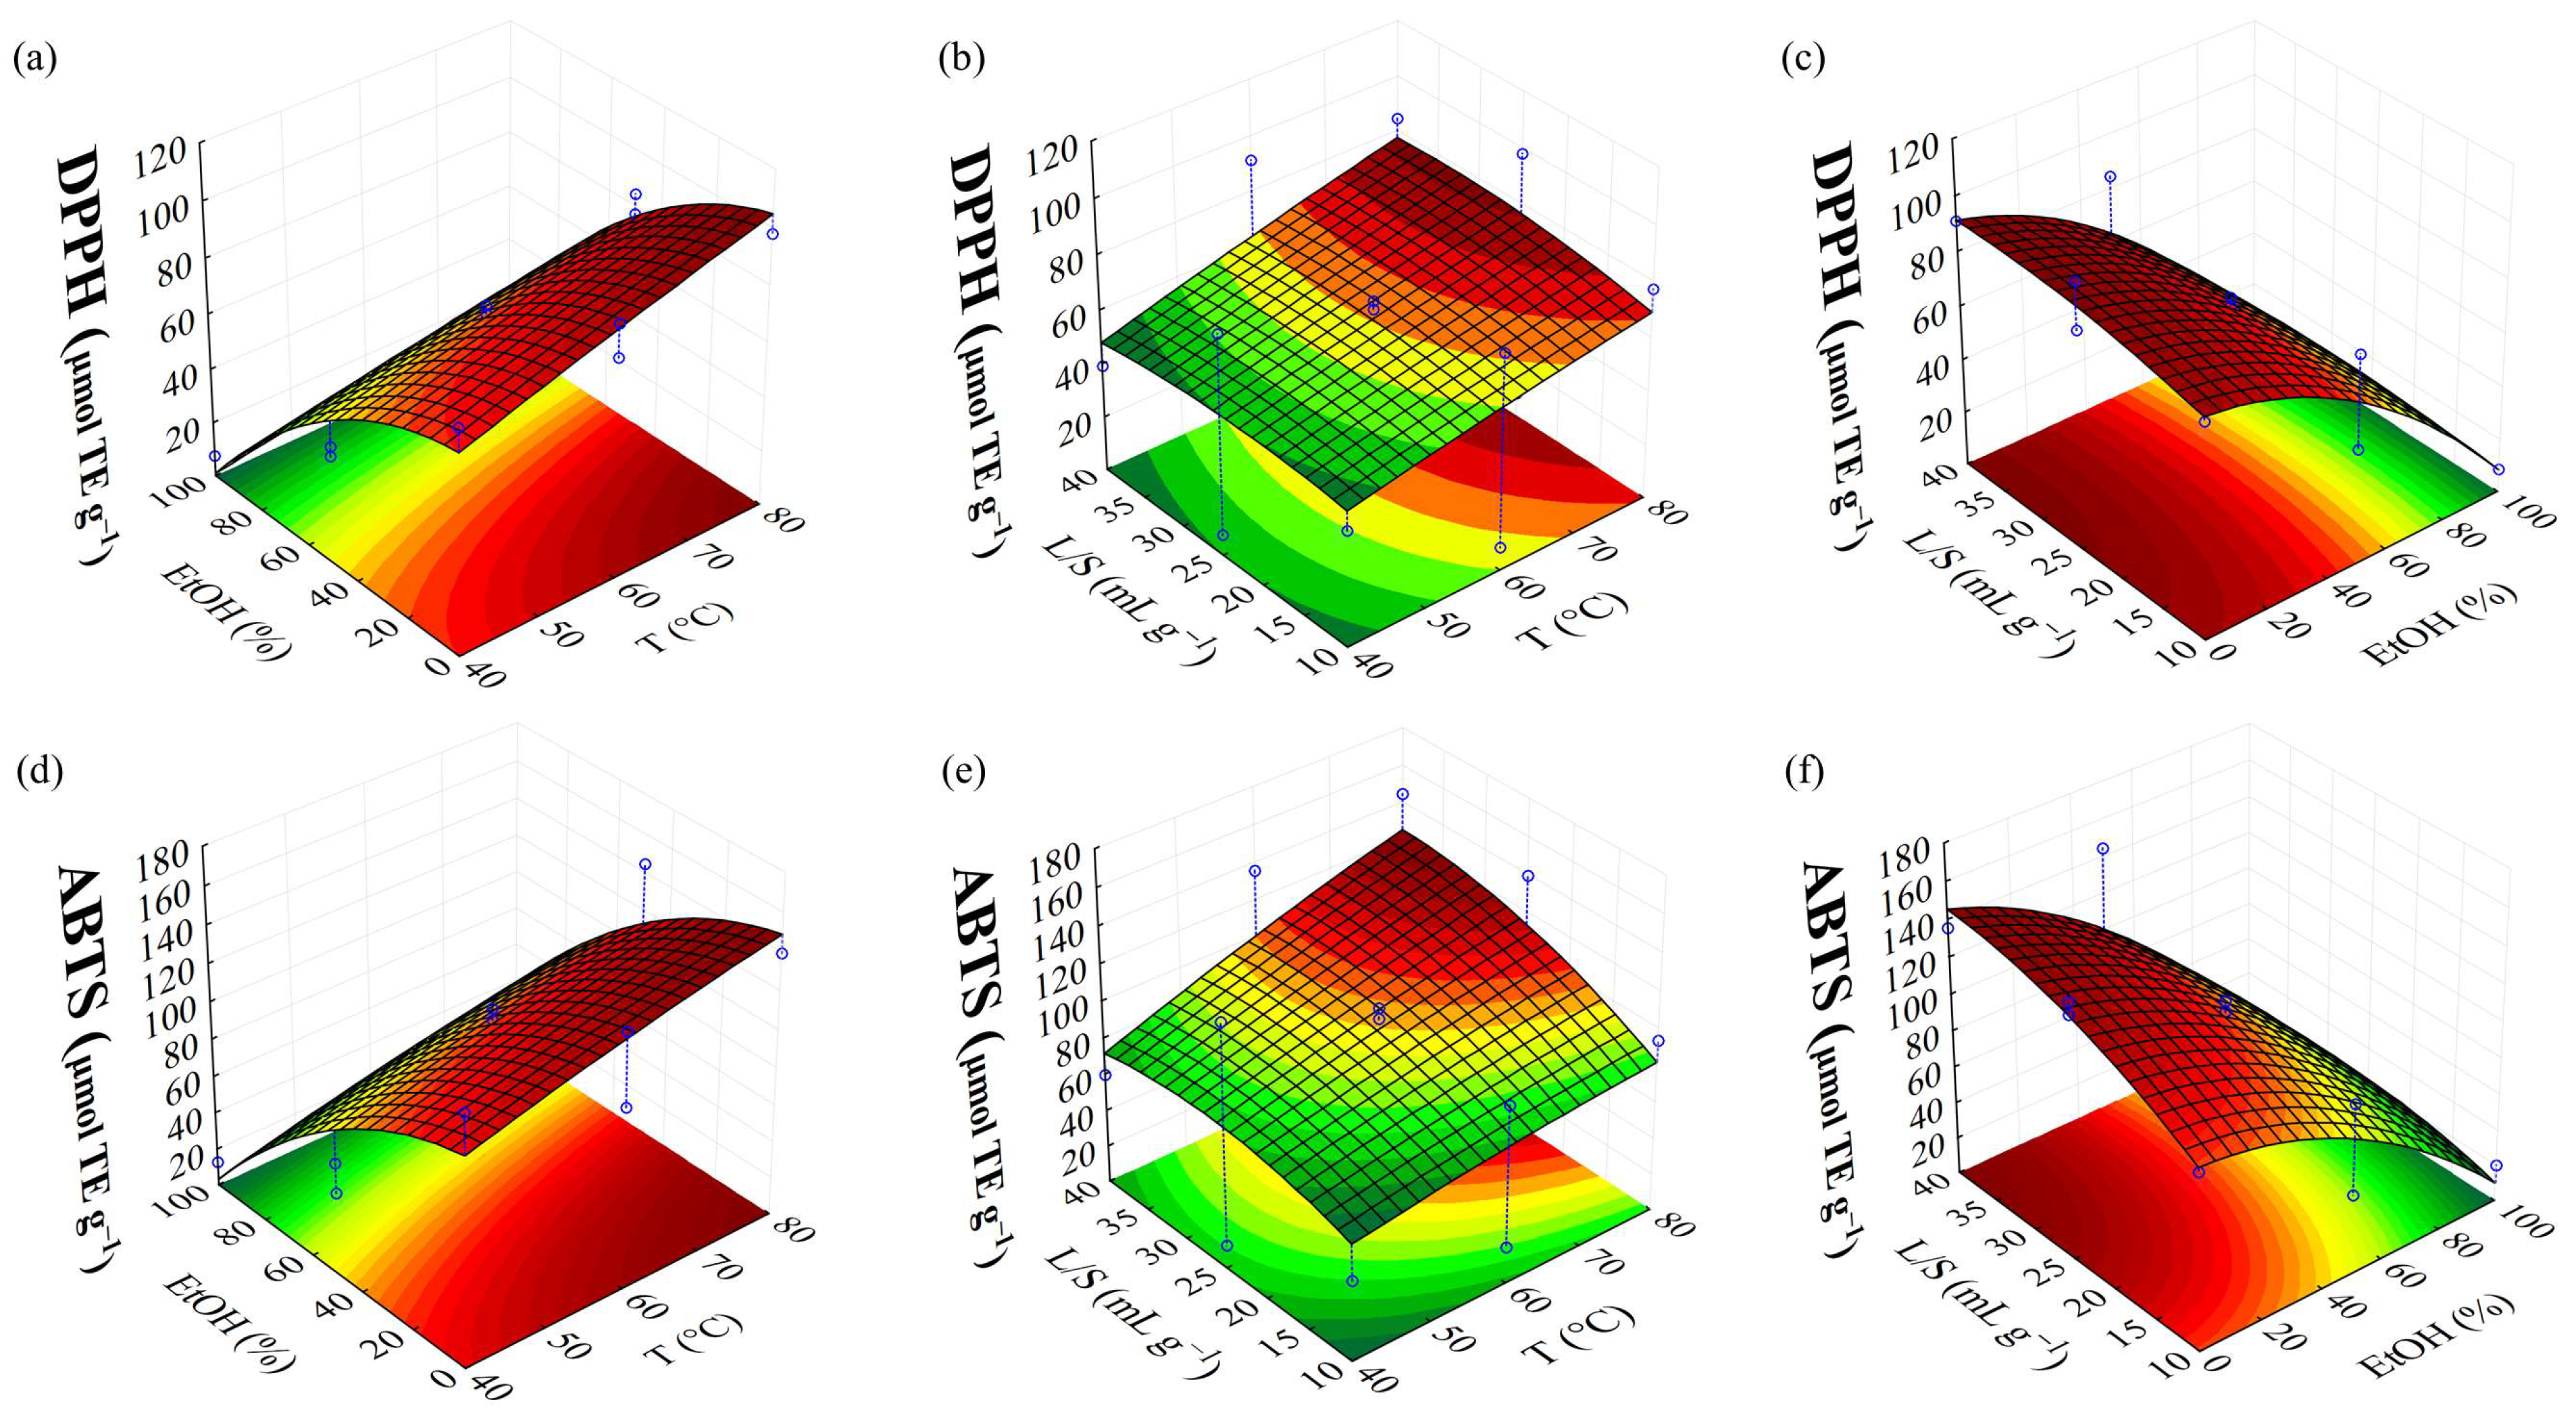
3.2. MAE Process
3.3. PLE and CRE Methods
3.4. Comparison of MAE, PLE and CRE Extraction Efficiency
3.5. Assessment of Oxygen Radical Absorbance Capacity (ORAC)
4. Conclusions
Supplementary Materials
Author Contributions
Funding
Institutional Review Board Statement
Informed Consent Statement
Data Availability Statement
Acknowledgments
Conflicts of Interest
References
- Jang, H.; Lee, J.; Park, Y.-K.; Lee, J.-Y. Exploring the Health Benefits and Concerns of Brown Seaweed Consumption: A Comprehensive Review of Bioactive Compounds in Brown Seaweed and Its Potential Therapeutic Effects. J. Agric. Food Res. 2024, 17, 101215. [Google Scholar] [CrossRef]
- Irianto, I.; Naryaningsih, A.; Trisnawati, N.W.; Astuti, A.; Komariyah, K.; Qomariyah, L.; Chaidir, C.; Saputri, A.; Wulandari, R.; Rizkiyah, D.N.; et al. From Sea to Solution: A Review of Green Extraction Approaches for Unlocking the Potential of Brown Algae. S. Afr. J. Chem. Eng. 2024, 48, 1–21. [Google Scholar] [CrossRef]
- Lee, Z.J.; Xie, C.; Ng, K.; Suleria, H.A.R. Unraveling the Bioactive Interplay: Seaweed Polysaccharide, Polyphenol and Their Gut Modulation Effect. Crit. Rev. Food Sci. Nutr. 2023, 65, 382–405. [Google Scholar] [CrossRef]
- Liu, X.; Yuan, W.; Sharma-Shivappa, R.; van Zanten, J. Antioxidant Activity of Phlorotannins from Brown Algae. Int. J. Agric. Biol. Eng. 2017, 10, 184–191. [Google Scholar] [CrossRef]
- Montero, L.; Sánchez-Camargo, A.P.; García-Cañas, V.; Tanniou, A.; Stiger-Pouvreau, V.; Russo, M.; Rastrelli, L.; Cifuentes, A.; Herrero, M.; Ibáñez, E. Anti-Proliferative Activity and Chemical Characterization by Comprehensive Two-Dimensional Liquid Chromatography Coupled to Mass Spectrometry of Phlorotannins from the Brown Macroalga Sargassum muticum Collected on North-Atlantic Coasts. J. Chromatogr. A 2016, 1428, 115–125. [Google Scholar] [CrossRef]
- Abdelhamid, A.; Lajili, S.; Elkaibi, M.A.; Ben Salem, Y.; Abdelhamid, A.; Muller, C.D.; Majdoub, H.; Kraiem, J.; Bouraoui, A. Optimized Extraction, Preliminary Characterization and Evaluation of the in Vitro Anticancer Activity of Phlorotannin-Rich Fraction from the Brown Seaweed, Cystoseira Sedoides. J. Aquat. Food Product. Technol. 2019, 28, 892–909. [Google Scholar] [CrossRef]
- Sardari, R.R.R.; Prothmann, J.; Gregersen, O.; Turner, C.; Nordberg Karlsson, E. Identification of Phlorotannins in the Brown Algae, Saccharina latissima and Ascophyllum nodosum by Ultra-High-Performance Liquid Chromatography Coupled to High-Resolution Tandem Mass Spectrometry. Molecules 2020, 26, 43. [Google Scholar] [CrossRef]
- Toan, T.Q.; Phong, T.D.; Tien, D.D.; Linh, N.M.; Mai Anh, N.T.; Hong Minh, P.T.; Duy, L.X.; Nghi, D.H.; Pham Thi, H.H.; Nhut, P.T.; et al. Optimization of Microwave-Assisted Extraction of Phlorotannin from Sargassum Swartzii (Turn.) C. Ag. with Ethanol/Water. Nat. Prod. Commun. 2021, 16, 1934578X2199618. [Google Scholar] [CrossRef]
- Keramane, B.; Sánchez-Camargo, A.d.P.; Montero, L.; Laincer, F.; Bedjou, F.; Ibañez, E. Pressurized Liquid Extraction of Bioactive Extracts with Antioxidant and Antibacterial Activity from Green, Red and Brown Algerian Algae. Algal Res. 2023, 76, 103293. [Google Scholar] [CrossRef]
- Sadeghi, A.; Rajabiyan, A.; Nabizade, N.; Meygoli Nezhad, N.; Zarei-Ahmady, A. Seaweed-Derived Phenolic Compounds as Diverse Bioactive Molecules: A Review on Identification, Application, Extraction and Purification Strategies. Int. J. Biol. Macromol. 2024, 266, 131147. [Google Scholar] [CrossRef]
- Sánchez-Camargo, A.P.; Montero, L.; Cifuentes, A.; Herrero, M.; Ibáñez, E. Application of Hansen Solubility Approach for the Subcritical and Supercritical Selective Extraction of Phlorotannins from Cystoseira Abies-Marina. RSC Adv. 2016, 6, 94884–94895. [Google Scholar] [CrossRef]
- He, Z.; Chen, Y.; Chen, Y.; Liu, H.; Yuan, G.; Fan, Y.; Chen, K. Optimization of the Microwave-Assisted Extraction of Phlorotannins from Saccharina japonica Aresch and Evaluation of the Inhibitory Effects of Phlorotannin-Containing Extracts on HepG2 Cancer Cells. Chin. J. Oceanol. Limnol. 2013, 31, 1045–1054. [Google Scholar] [CrossRef]
- AOAC Methods 970.22, 972.15, 963.15. In Official Methods of Analysis of the Association of Official Analytical Chemistry, 16th ed.; AOAC International: Gaithersburg, MD, USA, 1997.
- AOAC Method 920.39C. In Hods of Analysis of the Association of Official Analytical Chemists; A.O.A.C: Arlington, TX, USA, 2005; Volume 33.
- Rudke, A.R.; da Silva, M.; de Andrade, C.J.; Vitali, L.; Ferreira, S.R.S. Green Extraction of Phenolic Compounds and Carrageenan from the Red Alga Kappaphycus Alvarezii. Algal Res. 2022, 67, 102866. [Google Scholar] [CrossRef]
- Gonçalves Rodrigues, L.G.; Mazzutti, S.; Vitali, L.; Micke, G.A.; Ferreira, S.R.S. Recovery of Bioactive Phenolic Compounds from Papaya Seeds Agroindustrial Residue Using Subcritical Water Extraction. Biocatal. Agric. Biotechnol. 2019, 22, 101367. [Google Scholar] [CrossRef]
- Weinhold, T.d.S.; Bresciani, L.F.V.; Tridapalli, C.W.; Yunes, R.A.; Hense, H.; Ferreira, S.R.S. Polygala cyparissias Oleoresin: Comparing CO2 and Classical Organic Solvent Extractions. Chem. Eng. Process. Process Intensif. 2008, 47, 109–117. [Google Scholar] [CrossRef]
- Singleton, V.L.; Orthofer, R.; Lamuela-Raventós, R.M. Analysis of Total Phenols and Other Oxidation Substrates and Antioxidants by Means of Folin-Ciocalteu Reagent. Methods Enzymol. 1999, 299, 152–178. [Google Scholar]
- dos Santos, L.C.; Mendiola, J.A.; Sánchez-Camargo, A.d.P.; Álvarez-Rivera, G.; Viganó, J.; Cifuentes, A.; Ibáñez, E.; Martínez, J. Selective Extraction of Piceatannol from Passiflora edulis By-Products: Application of HSPs Strategy and Inhibition of Neurodegenerative Enzymes. Int. J. Mol. Sci. 2021, 22, 6248. [Google Scholar] [CrossRef]
- Lopes, G.; Sousa, C.; Silva, L.R.; Pinto, E.; Andrade, P.B.; Bernardo, J.; Mouga, T.; Valentão, P. Can Phlorotannins Purified Extracts Constitute a Novel Pharmacological Alternative for Microbial Infections with Associated Inflammatory Conditions? PLoS ONE 2012, 7, e31145. [Google Scholar] [CrossRef]
- Mensor, L.L.; Menezes, F.S.; Leitão, G.G.; Reis, A.S.; dos Santos, T.C.; Coube, C.S.; Leitão, S.G. Screening of Brazilian Plant Extracts for Antioxidant Activity by the Use of DPPH Free Radical Method. Phytother. Res. 2001, 15, 127–130. [Google Scholar] [CrossRef]
- Re, R.; Pellegrini, N.; Proteggente, A.; Pannala, A.; Yang, M.; Rice-Evans, C. Antioxidant Activity Applying an Improved ABTS Radical Cation Decolorization Assay. Free Radic. Biol. Med. 1999, 26, 1231–1237. [Google Scholar] [CrossRef]
- Ou, B.; Hampsch-Woodill, M.; Prior, R.L. Development and Validation of an Improved Oxygen Radical Absorbance Capacity Assay Using Fluorescein as the Fluorescent Probe. J. Agric. Food Chem. 2001, 49, 4619–4626. [Google Scholar] [CrossRef] [PubMed]
- Michalak, L.; Morales-Lange, B.; Montero, R.; Horn, S.J.; Mydland, L.T.; Øverland, M. Impact of Biorefinery Processing Conditions on the Bioactive Properties of Fucoidan Extracts from Saccharina Latissima on SHK-1 Cells. Algal Res. 2023, 75, 103221. [Google Scholar] [CrossRef]
- Rhein-Knudsen, N.; Reyes-Weiss, D.; Horn, S.J. Extraction of High Purity Fucoidans from Brown Seaweeds Using Cellulases and Alginate Lyases. Int. J. Biol. Macromol. 2023, 229, 199–209. [Google Scholar] [CrossRef]
- Reyes, B.A.S.; Dufourt, E.C.; Ross, J.; Warner, M.J.; Tanquilut, N.C.; Leung, A.B. Selected Phyto and Marine Bioactive Compounds: Alternatives for the Treatment of Type 2 Diabetes. Stud. Nat. Prod. Chem. 2018, 55, 111–143. [Google Scholar]
- Sovová, H. Rate of the Vegetable Oil Extraction with Supercritical CO2—I. Modelling of Extraction Curves. Chem. Eng. Sci. 1994, 49, 409–414. [Google Scholar] [CrossRef]
- Rodrigues, L.G.G.; Mazzutti, S.; Siddique, I.; da Silva, M.; Vitali, L.; Ferreira, S.R.S. Subcritical Water Extraction and Microwave-Assisted Extraction Applied for the Recovery of Bioactive Components from Chaya (Cnidoscolus aconitifolius Mill.). J. Supercrit. Fluids 2020, 165, 104976. [Google Scholar] [CrossRef]
- Rudke, A.R.; Mazzutti, S.; Andrade, K.S.; Vitali, L.; Ferreira, S.R.S. Optimization of Green PLE Method Applied for the Recovery of Antioxidant Compounds from Buriti (Mauritia flexuosa L.) Shell. Food Chem. 2019, 298, 125061. [Google Scholar] [CrossRef] [PubMed]
- Murugesh, C.S.; Rastogi, N.K.; Subramanian, R. Athermal Extraction of Green Tea: Optimisation and Kinetics of Extraction of Polyphenolic Compounds. Innov. Food Sci. Emerg. Technol. 2018, 50, 207–216. [Google Scholar] [CrossRef]
- Mezzomo, N.; Martínez, J.; Ferreira, S.R.S. Supercritical Fluid Extraction of Peach (Prunus persica) Almond Oil: Kinetics, Mathematical Modeling and Scale-Up. J. Supercrit. Fluids 2009, 51, 10–16. [Google Scholar] [CrossRef]
- Ferreira, S.R.S.; Meireles, M.A.A. Modeling the Supercritical Fluid Extraction of Black Pepper (Piper Nigrum L.) Essential Oil. J. Food Eng. 2002, 54, 263–269. [Google Scholar] [CrossRef]
- Magnusson, M.; Yuen, A.K.L.; Zhang, R.; Wright, J.T.; Taylor, R.B.; Maschmeyer, T.; de Nys, R. A Comparative Assessment of Microwave Assisted (MAE) and Conventional Solid-Liquid (SLE) Techniques for the Extraction of Phloroglucinol from Brown Seaweed. Algal Res. 2017, 23, 28–36. [Google Scholar] [CrossRef]
- Yuan, Y.; Zhang, J.; Fan, J.; Clark, J.; Shen, P.; Li, Y.; Zhang, C. Microwave Assisted Extraction of Phenolic Compounds from Four Economic Brown Macroalgae Species and Evaluation of Their Antioxidant Activities and Inhibitory Effects on α-Amylase, α-Glucosidase, Pancreatic Lipase and Tyrosinase. Food Res. Int. 2018, 113, 288–297. [Google Scholar] [CrossRef] [PubMed]
- Kadam, S.U.; Tiwari, B.K.; Smyth, T.J.; O’Donnell, C.P. Optimization of Ultrasound Assisted Extraction of Bioactive Components from Brown Seaweed Ascophyllum Nodosum Using Response Surface Methodology. Ultrason. Sonochem 2015, 23, 308–316. [Google Scholar] [CrossRef]
- Korzeniowska, K.; Łęska, B.; Wieczorek, P.P. Isolation and Determination of Phenolic Compounds from Freshwater Cladophora Glomerata. Algal Res. 2020, 48, 101912. [Google Scholar] [CrossRef]
- Quiles-Carrillo, L.; Mellinas, C.; Garrigos, M.C.; Balart, R.; Torres-Giner, S. Optimization of Microwave-Assisted Extraction of Phenolic Compounds with Antioxidant Activity from Carob Pods. Food Anal. Methods 2019, 12, 2480–2490. [Google Scholar] [CrossRef]
- Sánchez-Camargo, A.d.P.; Montero, L.A.; Stiger-Pouvreau, V.; Tanniou, A.; Cifuentes, A.; Herrero, M.; Ibáñez, E. Considerations on the Use of Enzyme-Assisted Extraction in Combination with Pressurized Liquids to Recover Bioactive Compounds from Algae. Food Chem. 2016, 192, 67–74. [Google Scholar] [CrossRef] [PubMed]
- Erpel, F.; Mateos, R.; Pérez-Jiménez, J.; Pérez-Correa, J.R. Phlorotannins: From Isolation and Structural Characterization, to the Evaluation of Their Antidiabetic and Anticancer Potential. Food Res. Int. 2020, 137, 109589. [Google Scholar] [CrossRef]
- Goksen, G. Elucidation and Quantification Health-Promoting Phenolic Compounds, Antioxidant Properties and Sugar Levels of Ultrasound Assisted Extraction, Aroma Compositions and Amino Acids Profiles of Macroalgae, Laurencia Papillosa. Ultrason. Sonochem 2023, 98, 106527. [Google Scholar] [CrossRef]
- Peng, Z.; Wu, Y.; Fu, Q.; Xiao, J. Free and Bound Phenolic Profiles and Antioxidant Ability of Eleven Marine Macroalgae from the South China Sea. Front. Nutr. 2024, 11, 1459757. [Google Scholar] [CrossRef]
- Wang, Z.; Li, S.; Ge, S.; Lin, S. Review of Distribution, Extraction Methods, and Health Benefits of Bound Phenolics in Food Plants. J. Agric. Food Chem. 2020, 68, 3330–3343. [Google Scholar] [CrossRef]
- Agregán, R.; Munekata, P.E.S.; Franco, D.; Dominguez, R.; Carballo, J.; Lorenzo, J.M. Phenolic Compounds from Three Brown Seaweed Species Using LC-DAD–ESI-MS/MS. Food Res. Int. 2017, 99, 979–985. [Google Scholar] [CrossRef] [PubMed]
- Montero, L.; Herrero, M.; Ibáñez, E.; Cifuentes, A. Separation and Characterization of Phlorotannins from Brown Algae Cystoseira Abies-marina by Comprehensive Two-Dimensional Liquid Chromatography. Electrophoresis 2014, 35, 1644–1651. [Google Scholar] [CrossRef] [PubMed]
- Mildenberger, J.; Stangeland, J.K.; Rebours, C. Antioxidative Activities, Phenolic Compounds and Marine Food Allergens in the Macroalgae Saccharina latissima Produced in Integrated Multi-Trophic Aquaculture Systems. Aquaculture 2022, 546, 737386. [Google Scholar] [CrossRef]

| S. latissima | |
|---|---|
| Moisture (fresh sample) (wt. %) | 13.45 ± 0.58 |
| Protein (dwt. %) | 6.29 ± 0.02 |
| Lipids (dwt. %) | 1.06 ± 0.01 |
| Ash (dwt. %) | 9.55 ± 0.08 |
| Carbohydrates * (dwt. %) | 69.79 ± 0.74 |
| Parameters | MAE | PLE1 | PLE2 |
|---|---|---|---|
| a1 (g) | 0.0137 | 0.0947 | 0.1549 |
| k1 (g min−1) | 0.0639 | 0.0590 | 0.0875 |
| tCER (min) | 2.0620 | 7.7305 | 7.6631 |
| k2 (g min−1) | 0.0063 | 0.0141 | 0.0096 |
| tFER (min) | 7.0632 | 25.9994 | 28.5496 |
| k3 (g min−1) | 0.0002 | 0.0038 | 0.0022 |
| R2 | 0.9637 | 0.9840 | 0.9674 |
| Assays | Real Variables | Ey (%) | TPC (mg GAE g−1) | TPTs (mg PGE g−1) | DPPH (µmol TE g−1) | ABTS (µmol TE g−1) | ||
|---|---|---|---|---|---|---|---|---|
| (1) T (°C) | (2) EtOH (%) | (3) L/S (mL g−1) | ||||||
| MAE1 | 40 | 0 | 25 | 26.44 | 24.76 | 2.01 | 80.78 | 132.77 |
| MAE2 | 80 | 0 | 25 | 38.01 | 34.94 | 2.15 | 97.81 | 139.33 |
| MAE3 | 40 | 100 | 25 | 2.28 | 1.82 | 1.32 | 7.61 | 12.70 |
| MAE4 | 80 | 100 | 25 | 2.79 | 1.61 | 1.09 | 8.27 | 15.31 |
| MAE5 | 40 | 50 | 10 | 20.99 | 7.78 | 1.99 | 42.65 | 43.65 |
| MAE6 | 80 | 50 | 10 | 29.46 | 32.47 | 2.04 | 77.22 | 93.18 |
| MAE7 | 40 | 50 | 40 | 25.71 | 8.09 | 2.04 | 39.22 | 59.57 |
| MAE8 | 80 | 50 | 40 | 38.53 | 35.87 | 1.96 | 84.33 | 144.30 |
| MAE9 | 60 | 0 | 10 | 22.55 | 27.22 | 2.26 | 79.06 | 96.76 |
| MAE10 | 60 | 100 | 10 | 2.27 | 3.77 | 1.14 | 8.51 | 19.98 |
| MAE11 | 60 | 0 | 40 | 38.76 | 43.28 | 2.18 | 90.95 | 135.35 |
| MAE12 | 60 | 100 | 40 | 4.70 | 14.88 | 1.16 | 6.17 | 16.96 |
| MAE13 | 60 | 50 | 25 | 33.91 | 21.36 | 1.87 | 68.03 | 103.53 |
| MAE14 | 60 | 50 | 25 | 32.50 | 17.66 | 1.93 | 61.78 | 90.40 |
| MAE15 | 60 | 50 | 25 | 33.31 | 16.73 | 1.88 | 64.96 | 97.56 |
| Response | Regression Equation | R2 |
|---|---|---|
| Ey | 21.04 + 4.17(1) + 1.06(1)2 − 14.22(2) + 6.87(2)2 + 4.05(3) + 1.22(3)2 − 2.76(1) * (2) − 3.44(2) * (3) | 0.9934 |
| TPC | 19.71 + 7.81(1) − 13.52(2) + 3.86(3) | 0.8769 |
| TPTs | 1.78 − 0.49(2) + 0.14(2)2 − 0.04(3)2 − 0.09(1) * (2) | 0.9912 |
| DPPH | 51.88 + 12.17(1) − 39.75(2) + 7.75(2)2 | 0.9668 |
| ABTS | 75.82 + 17.93(1) − 54.91(2) + 10.01(2)2 + 12.82(3) | 0.9252 |
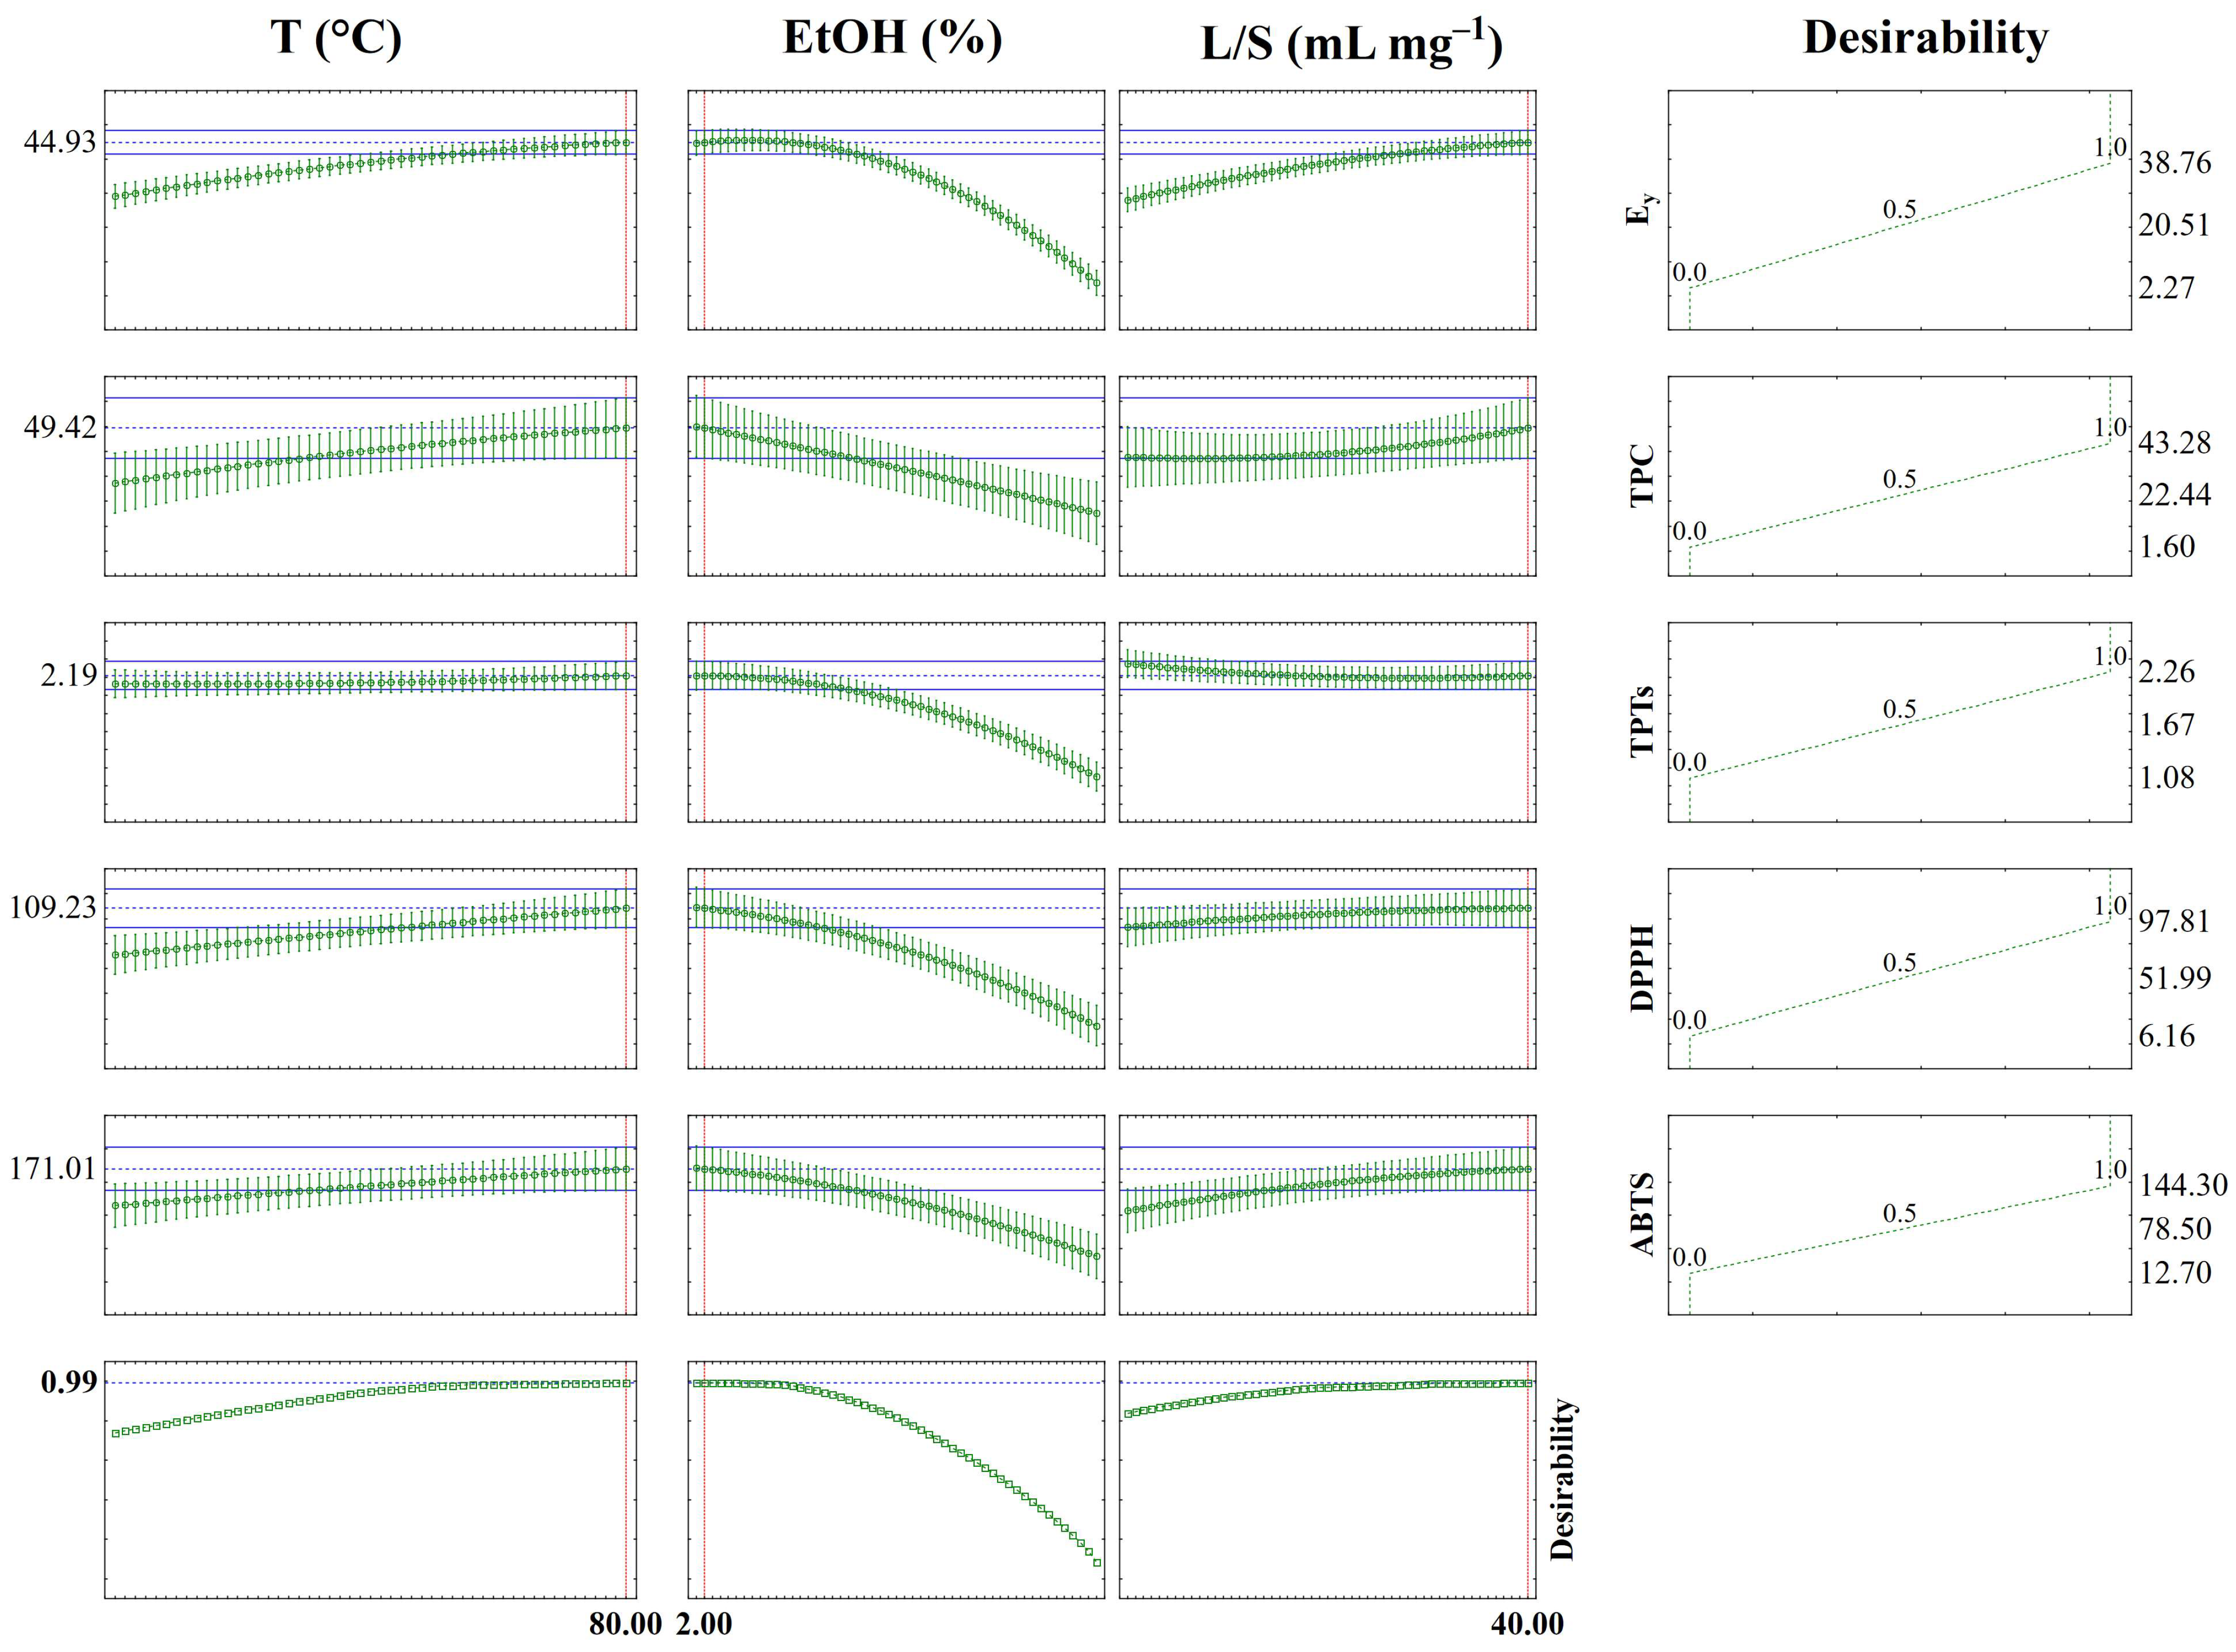
| Response Variable | Desirability Conditions | PV | EV | E% | ||
|---|---|---|---|---|---|---|
| T (°C) | EtOH (%) | L/S (mL g−1) | ||||
| Ey (%) | 80.00 | 2.00 | 40.00 | 44.93 | 44.17 | 1.69 |
| TPC (mg GAE g−1) | 49.42 | 47.60 | 3.68 | |||
| TPTs (mg PGE g−1) | 2.19 | 2.16 | 1.37 | |||
| DPPH (μmol TE g−1) | 109.23 | 113.50 | 3.91 | |||
| ABTS (μmol TE g−1) | 171.01 | 170.16 | 0.49 | |||
| Experimental Conditions | Ey (%) | TPC (mg GAE g−1) | TPTs (mg PGE g−1) | DPPH (μmol TE g−1) | ABTS (μmol TE g−1) |
|---|---|---|---|---|---|
| PLE—40 °C, 100% EtOH | 2.53 ± 0.36 e | 6.85 ± 0.93 e | 0.83 ± 0.04 e | 5.21 ± 0.02 e | 14.19 ± 0.55 f |
| PLE—40 °C, 50% EtOH | 28.12 ± 0.92 c | 23.83 ± 1.41 d | 1.90 ± 0.06 cd | 7.07 ± 0.08 e | 35.65 ± 0.79 d |
| PLE—40 °C, Water | 26.33 ± 0.67 c | 31.85 ± 2.45 bc | 2.07 ± 0.13 bc | 84.21 ± 0.97 d | 209.55 ± 5.54 b |
| PLE—80 °C, Water | 36.60 ± 0.43 b | 50.07 ± 1.93 a | 2.53 ± 0.15 a | 159.10 ± 3.42 a | 224.78 ± 1.80 a |
| PLE—120 °C, Water | 45.69 ± 1.04 a | 36.79 ± 2.83 b | 1.93 ± 0.16 c | 135.32 ± 0.37 b | 131.57 ± 1.24 c |
| CRE—100% EtOH | 3.14 ± 0.10 e | 5.62 ± 0.53 e | 0.84 ± 0.03 e | 6.07 ± 0.28 e | 13.08 ± 0.62 f |
| CRE—50% EtOH | 24.17 ± 0.70 d | 21.98 ± 1.07 d | 1.64 ± 0.15 d | 9.12 ± 0.22 e | 25.27 ± 0.23 e |
| CRE—Water | 26.65 ± 0.41 c | 30.93 ± 1.85 c | 2.22 ± 0.06 b | 92.30 ± 2.24 c | 124.61 ± 3.63 c |
| Extractions | ORAC IC50 (µg extract/mL) * |
|---|---|
| PLE1 | 19.04 ± 0.92 a |
| PLE2 | 15.33 ± 2.19 ab |
| Optimized MAE | 13.89 ± 0.39 b |
| Ascorbic Acid (positive control) | 0.48 ± 0.03 c |
Disclaimer/Publisher’s Note: The statements, opinions and data contained in all publications are solely those of the individual author(s) and contributor(s) and not of MDPI and/or the editor(s). MDPI and/or the editor(s) disclaim responsibility for any injury to people or property resulting from any ideas, methods, instructions or products referred to in the content. |
© 2025 by the authors. Licensee MDPI, Basel, Switzerland. This article is an open access article distributed under the terms and conditions of the Creative Commons Attribution (CC BY) license (https://creativecommons.org/licenses/by/4.0/).
Share and Cite
da Silva, J.; dos Santos, L.C.; Ibañez, E.; Ferreira, S.R.S. Green Extraction Methods Applied to the Brown Macroalga Saccharina latissima: Assessing Yield, Total Phenolics, Phlorotannins and Antioxidant Capacity. Foods 2025, 14, 1017. https://doi.org/10.3390/foods14061017
da Silva J, dos Santos LC, Ibañez E, Ferreira SRS. Green Extraction Methods Applied to the Brown Macroalga Saccharina latissima: Assessing Yield, Total Phenolics, Phlorotannins and Antioxidant Capacity. Foods. 2025; 14(6):1017. https://doi.org/10.3390/foods14061017
Chicago/Turabian Styleda Silva, Jonas, Luana Cristina dos Santos, Elena Ibañez, and Sandra Regina Salvador Ferreira. 2025. "Green Extraction Methods Applied to the Brown Macroalga Saccharina latissima: Assessing Yield, Total Phenolics, Phlorotannins and Antioxidant Capacity" Foods 14, no. 6: 1017. https://doi.org/10.3390/foods14061017
APA Styleda Silva, J., dos Santos, L. C., Ibañez, E., & Ferreira, S. R. S. (2025). Green Extraction Methods Applied to the Brown Macroalga Saccharina latissima: Assessing Yield, Total Phenolics, Phlorotannins and Antioxidant Capacity. Foods, 14(6), 1017. https://doi.org/10.3390/foods14061017