3.2. Analysis of the Amaranth Green Powder and the Mixtures of Wheat Flour and AGP
The results showed that the AGP mixture had a slightly acidic pH, high TDS and EC values, and low ORP values (
Table 5). The data suggest a high mineral content of AGP, which may have an impact on both oxidative stability and nutritional value when incorporated into butter biscuits.
Statistically significant differences were registered between the different flour–AGP mixtures (from 0% to 15%). (
Table 5) The increase in the AGP content caused a slight decrease in the pH value (from 6.55 to 6.28); hence, the acidity of the mixture slightly raised.
With an increase in the amount of the additive, the concentration of dissolved ions and minerals in the flour also rises, as evidenced by significant increases in both TDS and EC. TDS increases from 627 ppm at 0% additive to 2523 ppm at 15%, and EC rises from 1075 µS/cm to 3759 µS/cm over the same range, reflecting an improvement in ionic strength and mineral content. Furthermore, ORP also increases from 65 mV to 78 mV, indicating that higher additive concentrations lead to a shift toward a more oxidative environment.
The results indicate that the additive strongly alters the physicochemical properties of the flour, making it more acidic, more mineral-rich, and more oxidatively active, which could, in turn, affect its behavior during baking as well as its nutritional value.
3.3. Analysis of Dough
The physicochemical properties of biscuit dough containing different additive levels (0%, 5%, 10%, and 15%) are summarized in
Table 6. The pH remained largely consistent across all formulations (6.24–6.35), indicating near-neutral conditions with slight acidity. From
Table 6 it is evident that both TDS and EC increased with rising additive concentrations, reflecting higher levels of dissolved minerals and enhanced ionic strength. Specifically, TDS increased from 1834.5 ppm at 0% to 2439 ppm at 15%, while EC rose from 2962.5 µS/cm to 3932.5 µS/cm, reflecting enhanced ionic strength. ORP values remained relatively stable around 65 mV, suggesting that the additive has minimal effect on the dough’s redox balance. Overall, these results indicate that the additive enhances mineral content and ionic activity without significantly altering pH or redox stability, preserving the chemical integrity of the dough.
Figure 2 illustrates the overall changes in the surface characteristics of butter biscuit dough with increasing levels of amaranth flour. As the amount of plant flour increases, both the color characteristics and the surface structure of the product are noticeably altered.
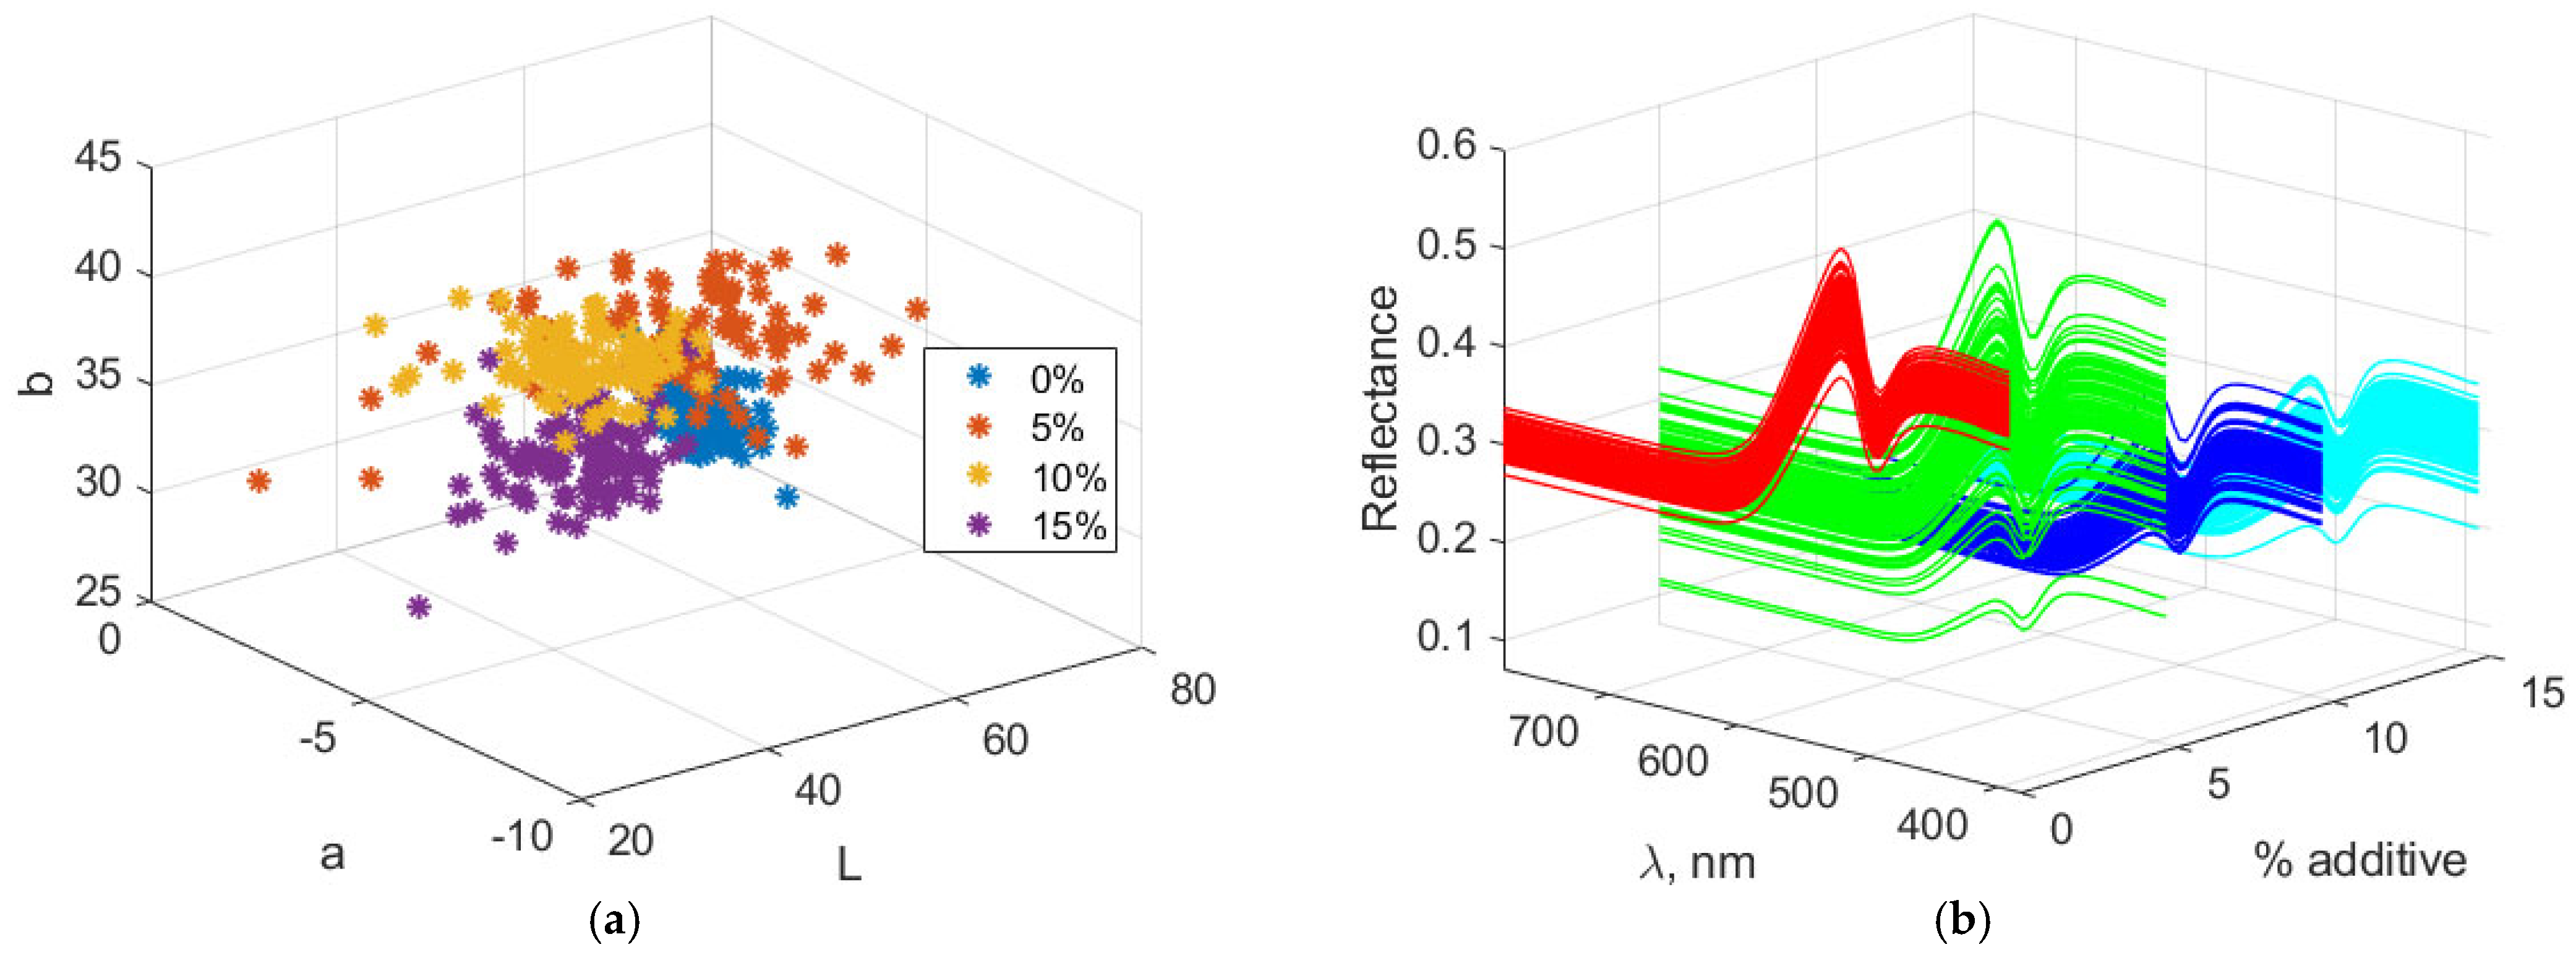
Figure 3 presents the Lab and spectral characteristics of biscuit dough containing amaranth. Lab values and spectral data generally change according to the color properties of the additive as its proportion in the dough increases. With higher additive levels, the “L” value decreases, indicating that the dough becomes darker. The “a” and “b” values adjust according to the hue of the additive: “a” decreases because the additive lacks a reddish tint, while “b” increases due to the additive’s greenish-yellow hue. The resulting spectral data reflect the loss of lightness, accompanied by wavelength shifts corresponding to the reflectance characteristics.
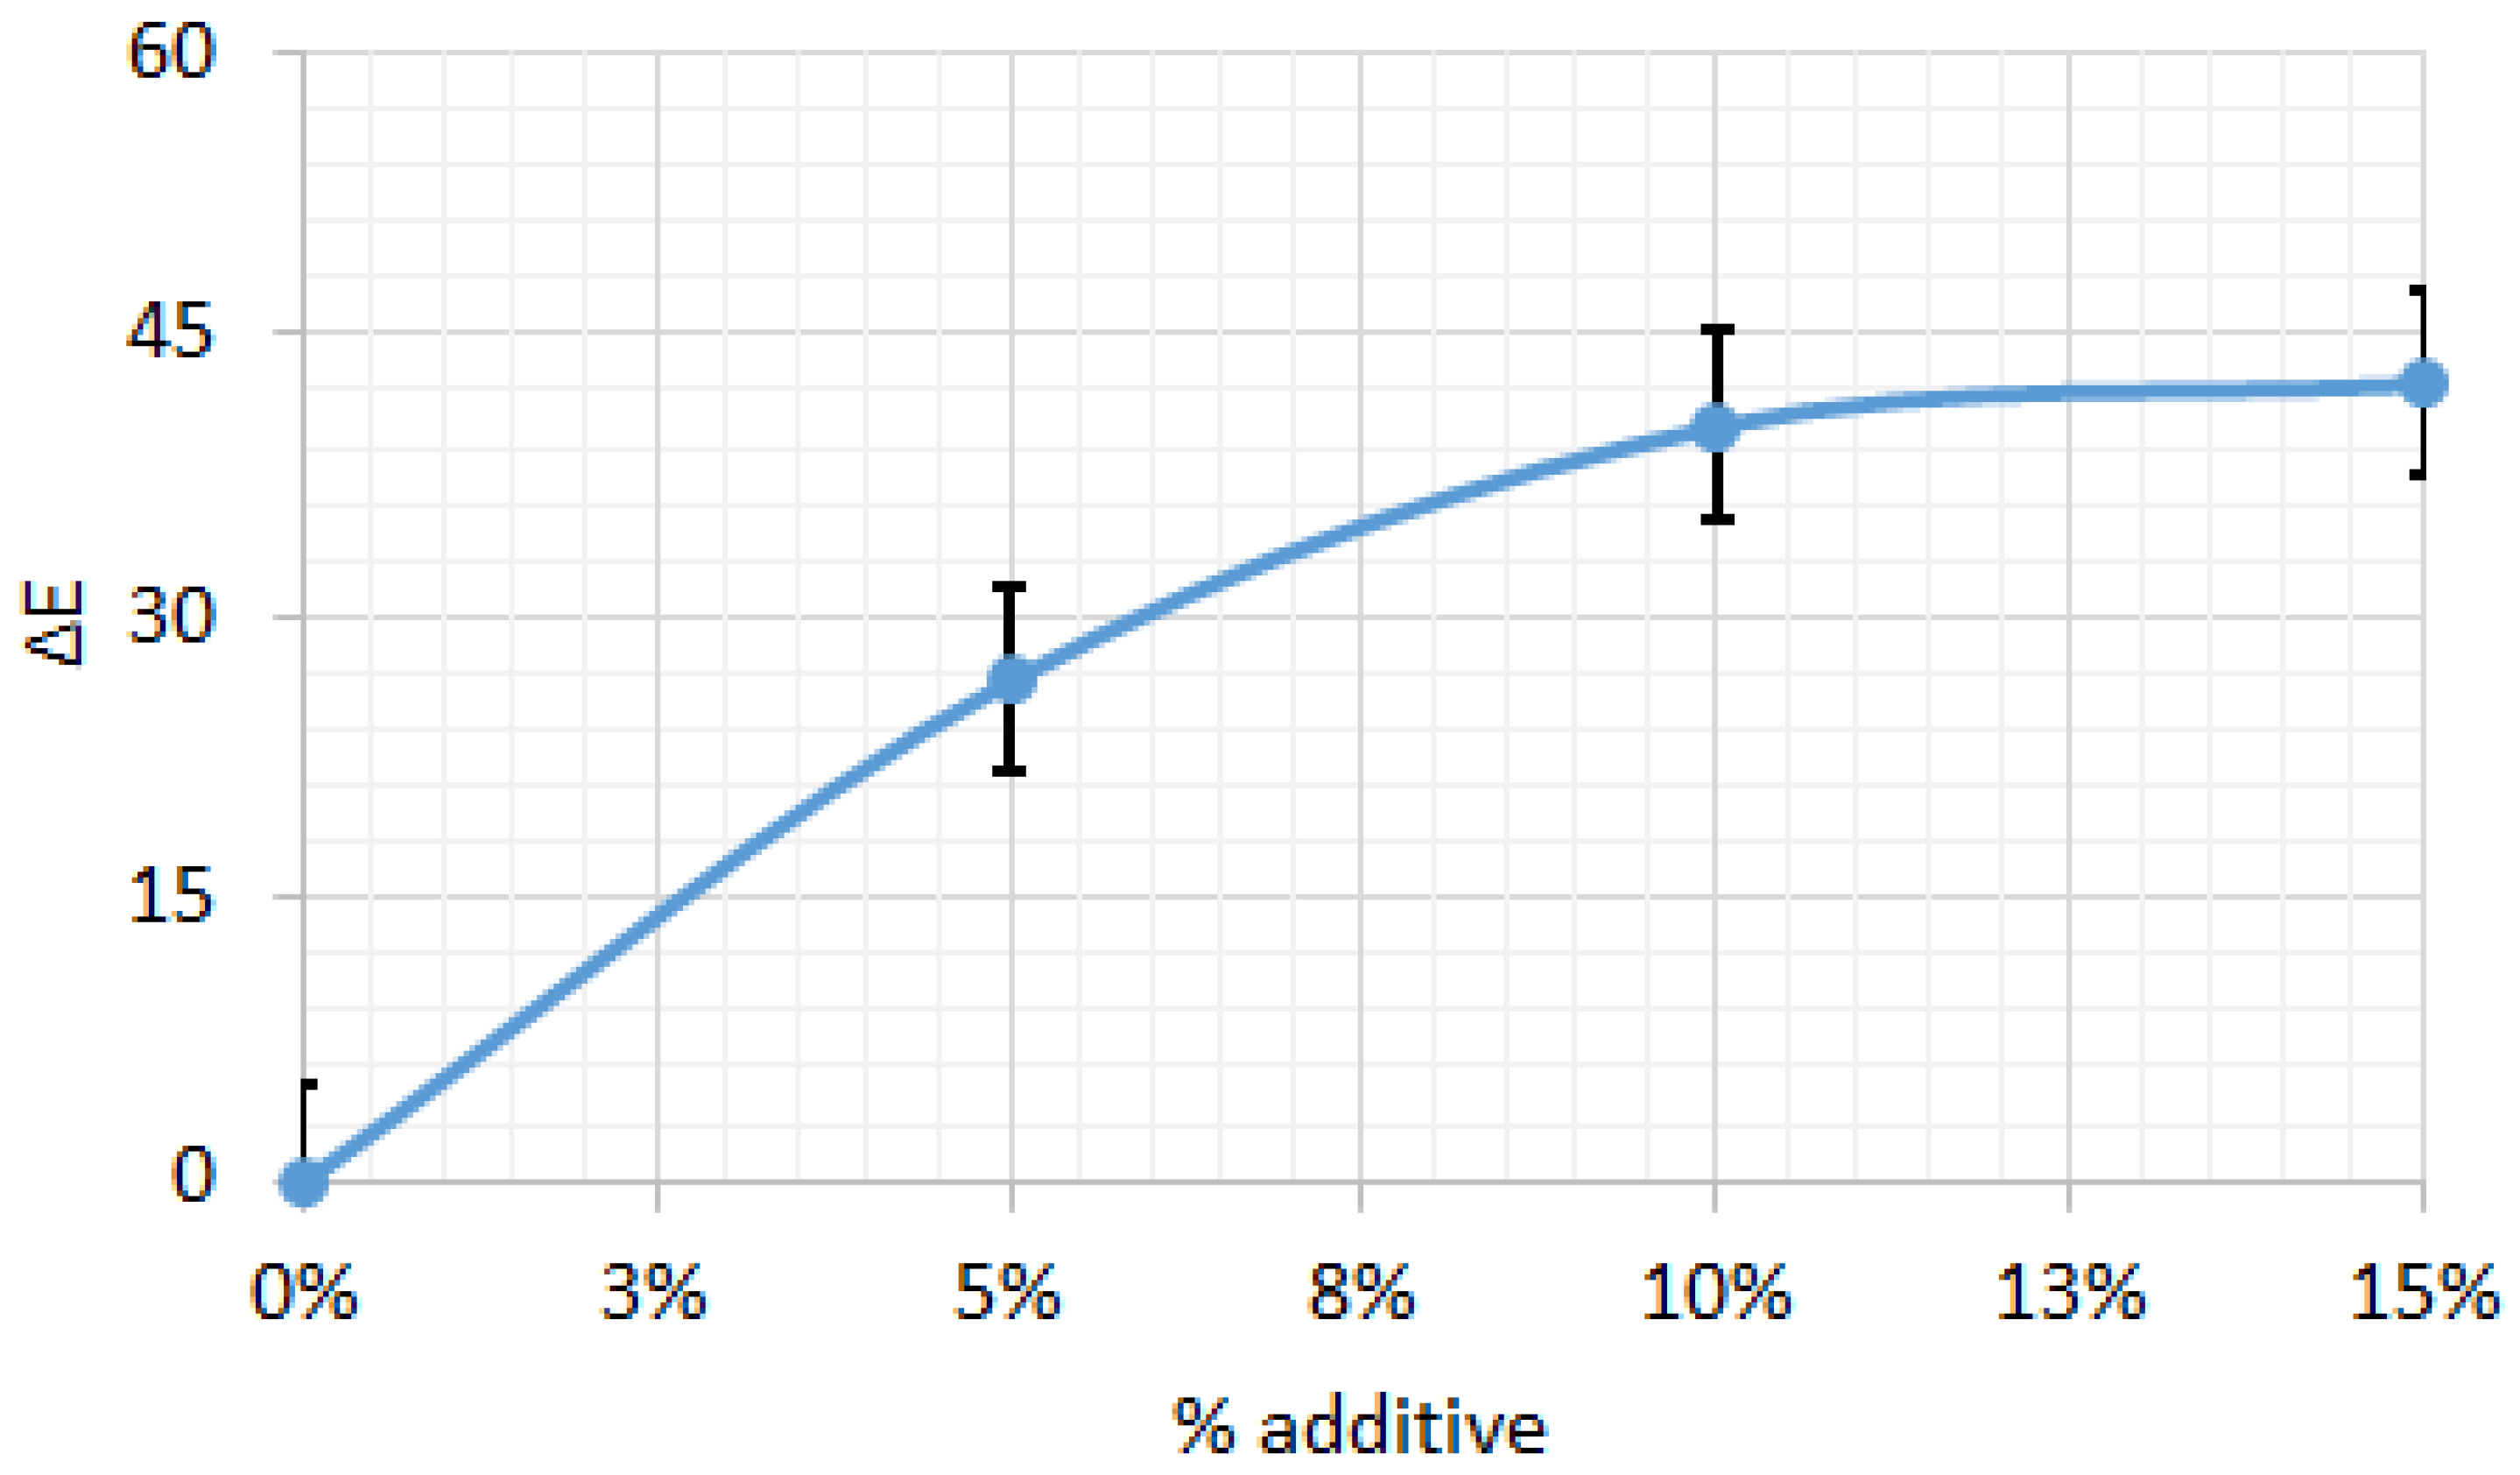
Figure 4 illustrates the color difference (ΔE) of biscuit dough relative to the control (0% additive) across varying additive levels. Increasing the additive concentration resulted in progressively larger ΔE values, indicating color changes that are readily perceptible to the naked eye.
The color index values of biscuit dough with varying percentages of additive are presented in
Table 7. Increasing the additive content resulted in significant changes, highlighting its strong impact on the dough’s appearance. With higher additive concentrations, the C1 value decreased, indicating a reduction in the intensity of this color index, while C3 and C4 values increased, reflecting enhanced color characteristics associated with these indices. C2 initially increased, reaching a maximum at 10% additive, before slightly declining, suggesting a more complex effect on this particular index. Overall, the additive substantially altered the color profile of the dough, enhancing or, in some cases, diminishing specific colors at different concentrations.
The values of the spectral indices of biscuit dough with different percentages of additive are presented in
Table 8. The data show significant variations in the indices with changes in additive levels. Index S1 remains constant across all additive concentrations, indicating that this spectral characteristic is not significantly affected. Index S2 decreases sharply from 0.87 at 0% additive to 0.24 at 15% additive, indicating a substantial change in the spectral properties of the dough due to the additive. Index S3 remains practically unchanged across different additive levels. In conclusion, the additive has a strong impact on the spectral index S2, while the indices S1 and S3 remain stable and are not significantly affected.
3.4. Biscuit Analysis
The main physicochemical characteristics of the biscuits show that increasing the amount of amaranth flour results in a slight decrease in pH. TDS and EC are strongly increased, while ORP remains approximately constant across all levels of the additive (
Table 9).
Table 10 presents data on the changes in the geometric characteristics of the biscuits and their heat losses during baking. Biscuit diameter remains relatively constant across all additive levels, while height increases slightly, peaking at 10% additive before slightly decreasing at 15%. Variations in the spread factor are minor, with no clear trend observed. Heat losses rise with increasing additive content, reaching a maximum at 10%, and stabilize at 17% for 5% and 15% additive levels.
The results of the sensory evaluation of biscuits with varying levels of amaranth flour are presented in
Table 11.
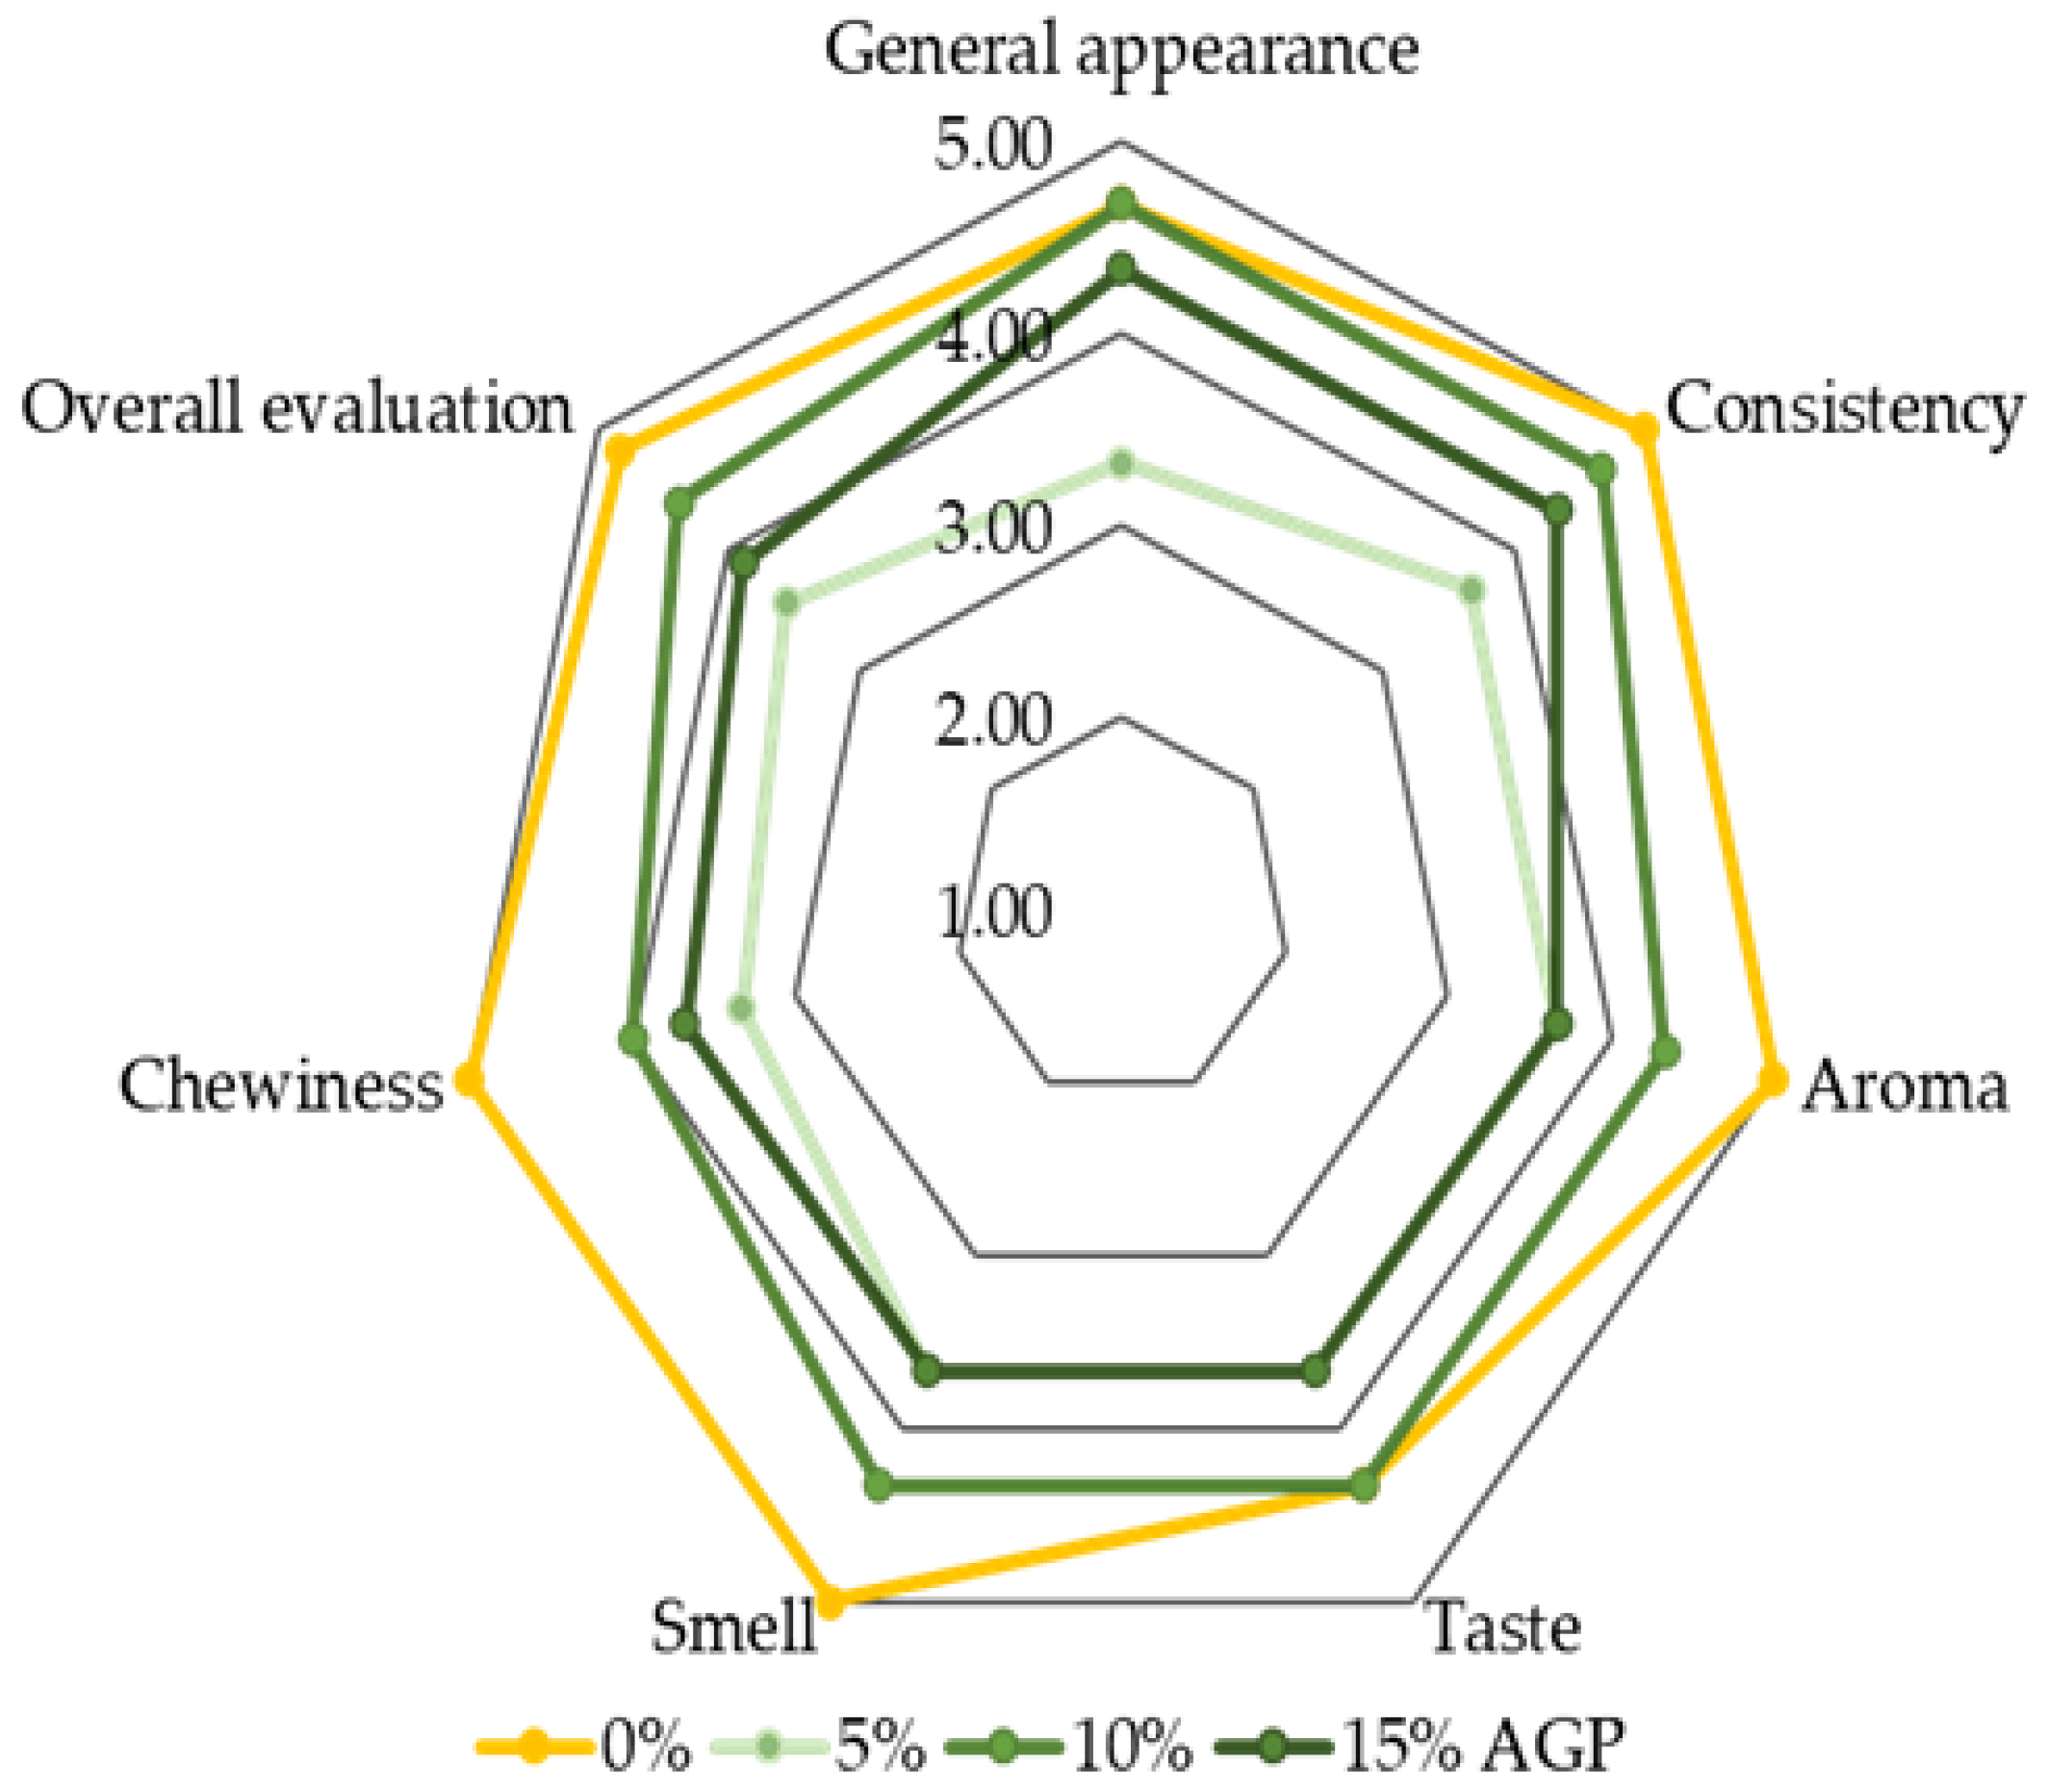
Increasing the additive by 5% generally leads to a decline in sensory attributes, including appearance, texture, aroma, taste, and chewiness. At 10% additive, however, most of these attributes improve, reaching values comparable to the control (0% additive). Further increasing the additive to 15% causes a slight decrease in sensory scores. These findings suggest that incorporating up to 10% amaranth flour achieves an optimal balance between enhanced sensory qualities and overall acceptability, while higher levels may negatively affect the sensory profile of the biscuits (
Figure 5).
Color digital images of the resulting biscuits are shown in
Figure 6. Increasing the amount of amaranth flour in the biscuits visibly alters both the color characteristics and the surface structure of the product.
Figure 7 illustrates the Lab and spectral characteristics of biscuits containing amaranth. Increasing the amount of amaranth flour leads to a decrease in the “L” value, indicating that the biscuits darken as the additive level rises. This color component decreases from 56.81 at 0% additive to 36.90 at 15%. The “a” component (red/green) has negative values, indicating that the color lies within the green spectrum. With increasing additive levels, “a” becomes more negative, changing from −4.74 at 0% to −6.33 at 15%, showing a slight intensification of the green hue. The “b” component (yellow/blue) increases with the amount of additive, reaching a maximum of 39.15 at 10%, and then slightly decreases to 35.37 at 15%. This suggests that the yellowing of the biscuits increases up to a certain point and then slightly decreases at the highest additive level.
The VIS reflection spectra reveal a general decrease in reflectance with increasing levels of the additive, indicating progressive darkening of the biscuits due to higher light absorption. A slight increase in reflectance is observed in the green wavelength range, which becomes more pronounced at higher additive levels. Reflectance in the yellow wavelength range rises up to 10% additive, then decreases slightly at 15%, suggesting a reduction in yellow hue intensity. Overall, the spectra indicate a trend toward darker and more muted colors with increasing additive content.
Figure 8 shows the color difference (ΔE) relative to the control biscuit sample, depending on the amount of amaranth flour. The ΔE results indicate significant color changes with increasing additive levels, reaching a maximum of ΔE = 63.27 at 5% additive. As the additive percentage increases to 10% and 15%, the color difference slightly decreases to ΔE = 55.88 and 51.51, respectively, suggesting that the initial addition of the additive causes a more pronounced color change, while higher concentrations produce a less marked effect. This trend indicates that the most significant variation in color occurs at lower additive levels, with the rate of change decreasing thereafter, likely due to saturation effects or interactions among the ingredients in the biscuit formulation.
Table 12 shows the color index values of biscuits containing varying amounts of amaranth flour. The C1 index increases at 5% additive but decreases with higher concentrations, indicating a gradual loss of brightness. The C2 and C3 indices rise progressively at 10% additive, reflecting enhanced color intensity and saturation, and continue to increase up to 15%, indicating further color deepening. These results suggest that moderate additive levels, around 10%, provide optimal color characteristics, while higher concentrations lead to more complex or less desirable color changes.
Table 13 presents the spectral index values of biscuits containing varying percentages of amaranth flour. The indices S1 and S2 exhibit clearly differentiated trends with increasing additive concentration. S1 shows a slight increase up to 10% additive, followed by a decrease at 15%, indicating a positive effect that levels off at higher concentrations. In contrast, S2 decreases markedly as the additive concentration rises, suggesting a reduction in the measured property (e.g., color or texture) with higher amaranth flour content. S3 shows minimal variation, with a slight overall decrease and a small increase at 15%, reflecting a negligible effect of the additive.
3.5. Determination of the Optimal Amount of Pigweed Flour in Biscuits
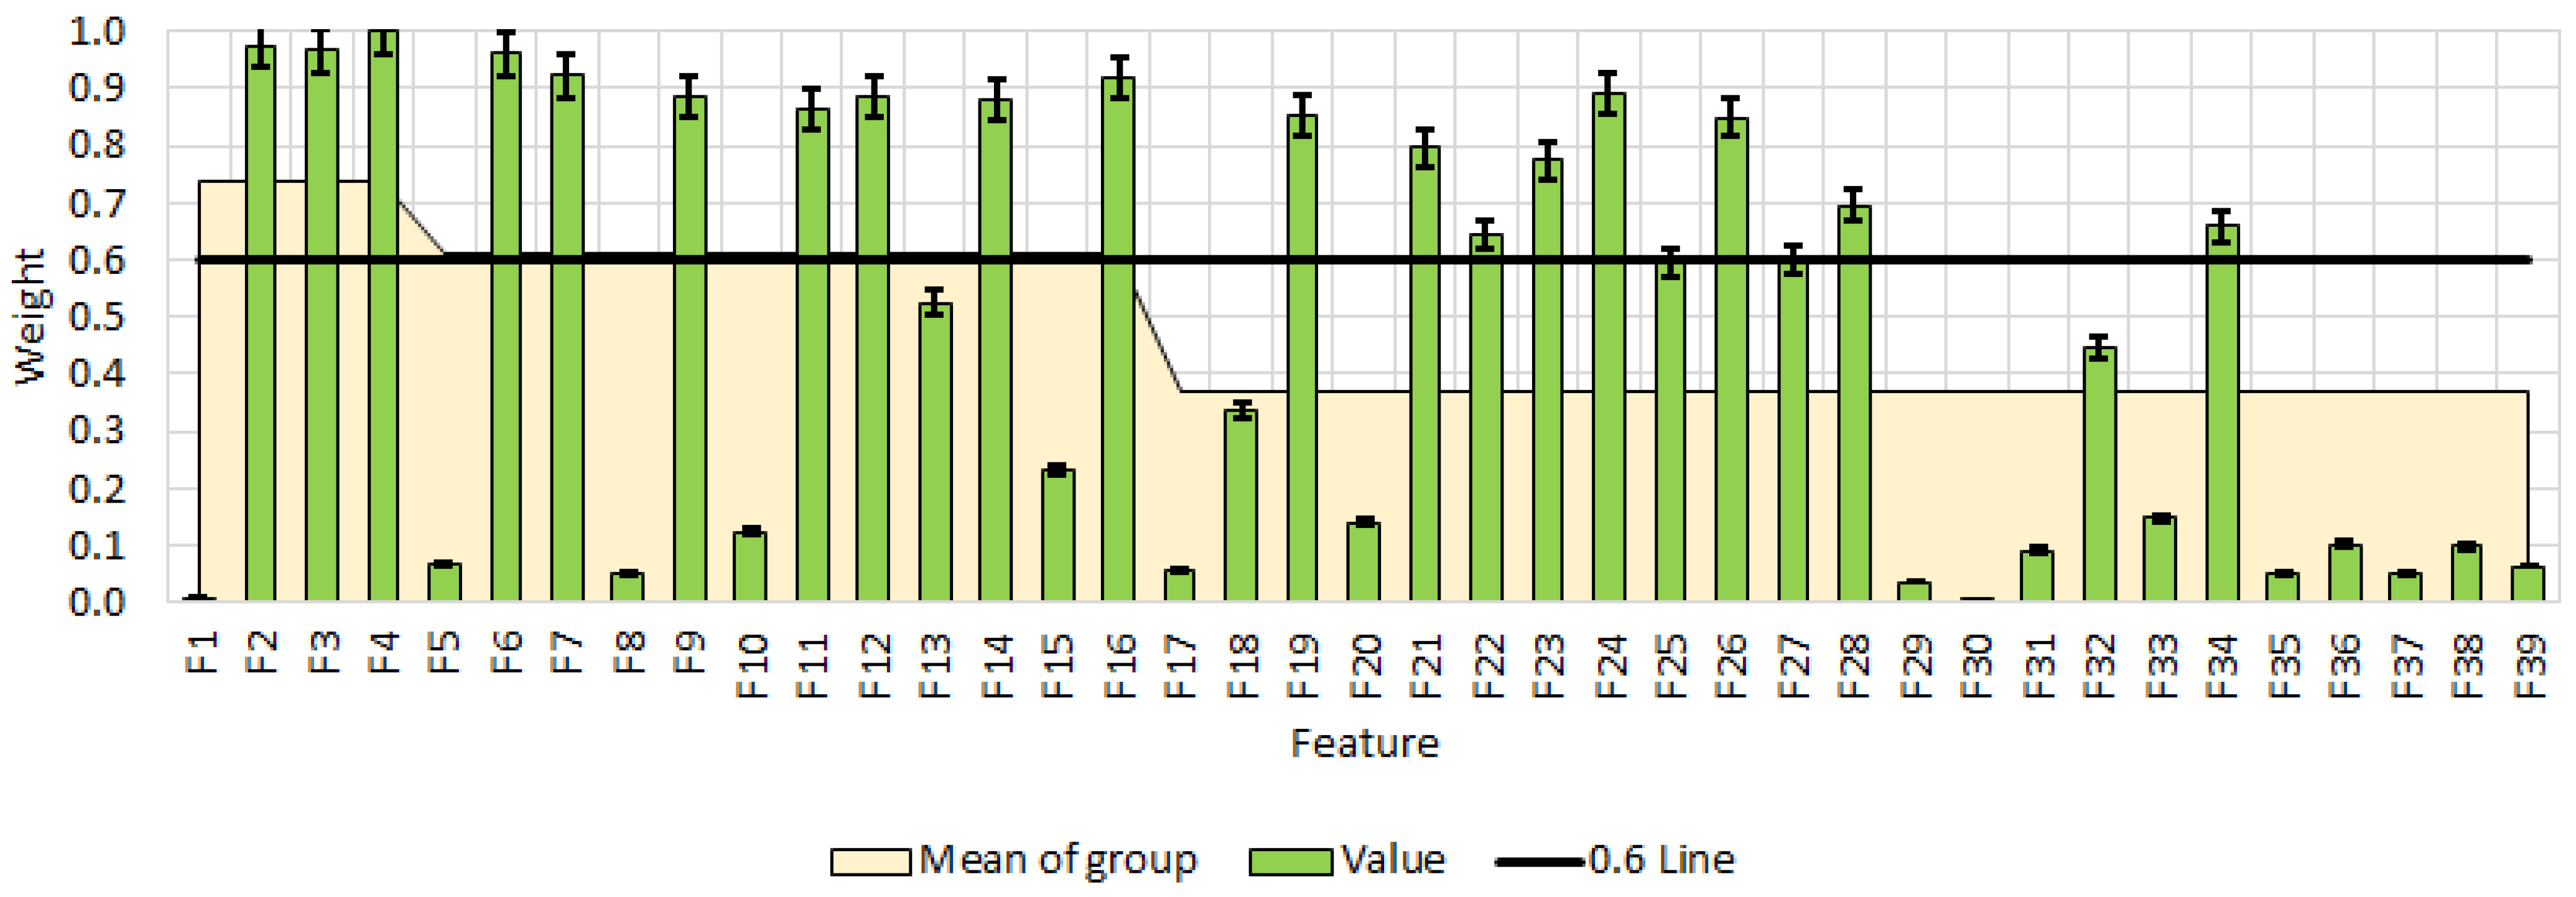
Figure 9 presents the results of informative feature selection using the RReliefF method. Features with weight coefficients above 0.6 indicate that TDS, EC, and ORP are the most influential variables in this model, showing significant changes across different additive levels, with weights of 0.97 and 1.00. Other important features include C1, C3, C4, S2, and ΔE, all exhibiting high coefficients ranging from 0.85 to 0.92. In contrast, features such as pH and ORP have relatively low coefficients in some cases, suggesting that their changes may be context-dependent. Furthermore, features with high weight coefficients but relatively low mean values, such as C2 and C4, are variably affected under different conditions.
The following vector of informative features is formed:
An analysis of principal components was conducted to investigate the relationship between % additive and the selected biscuit features. Prior to analysis, all data were normalized to the [0, 1] range.
Table 14 presents the normalized values of % additive relative to the selected features.
TDS shows the highest normalized values for F2 and F3, reaching 0.75 and 0.71 at 15% additive, respectively, indicating that both features gain importance as the additive level increases. In contrast, ORP exhibits minimal variation, remaining low across all additive levels. Other features, such as C1 (F12) and C2 (F14), display more variable behavior: C1 peaks at 0% additive with a value of 0.71 and declines slightly at higher levels, while C2 shows low variability. Changes in ΔE (F16) and C (F34) are particularly pronounced: ΔE rises sharply to 0.98 at 15%, whereas C (F34) jumps from 0.00 to 0.73 at 10% additive before decreasing. The observed variability among features highlights that each characteristic differs considerably in its relevance and effectiveness relative to additive level, underscoring the need for targeted analysis to optimize additive use.
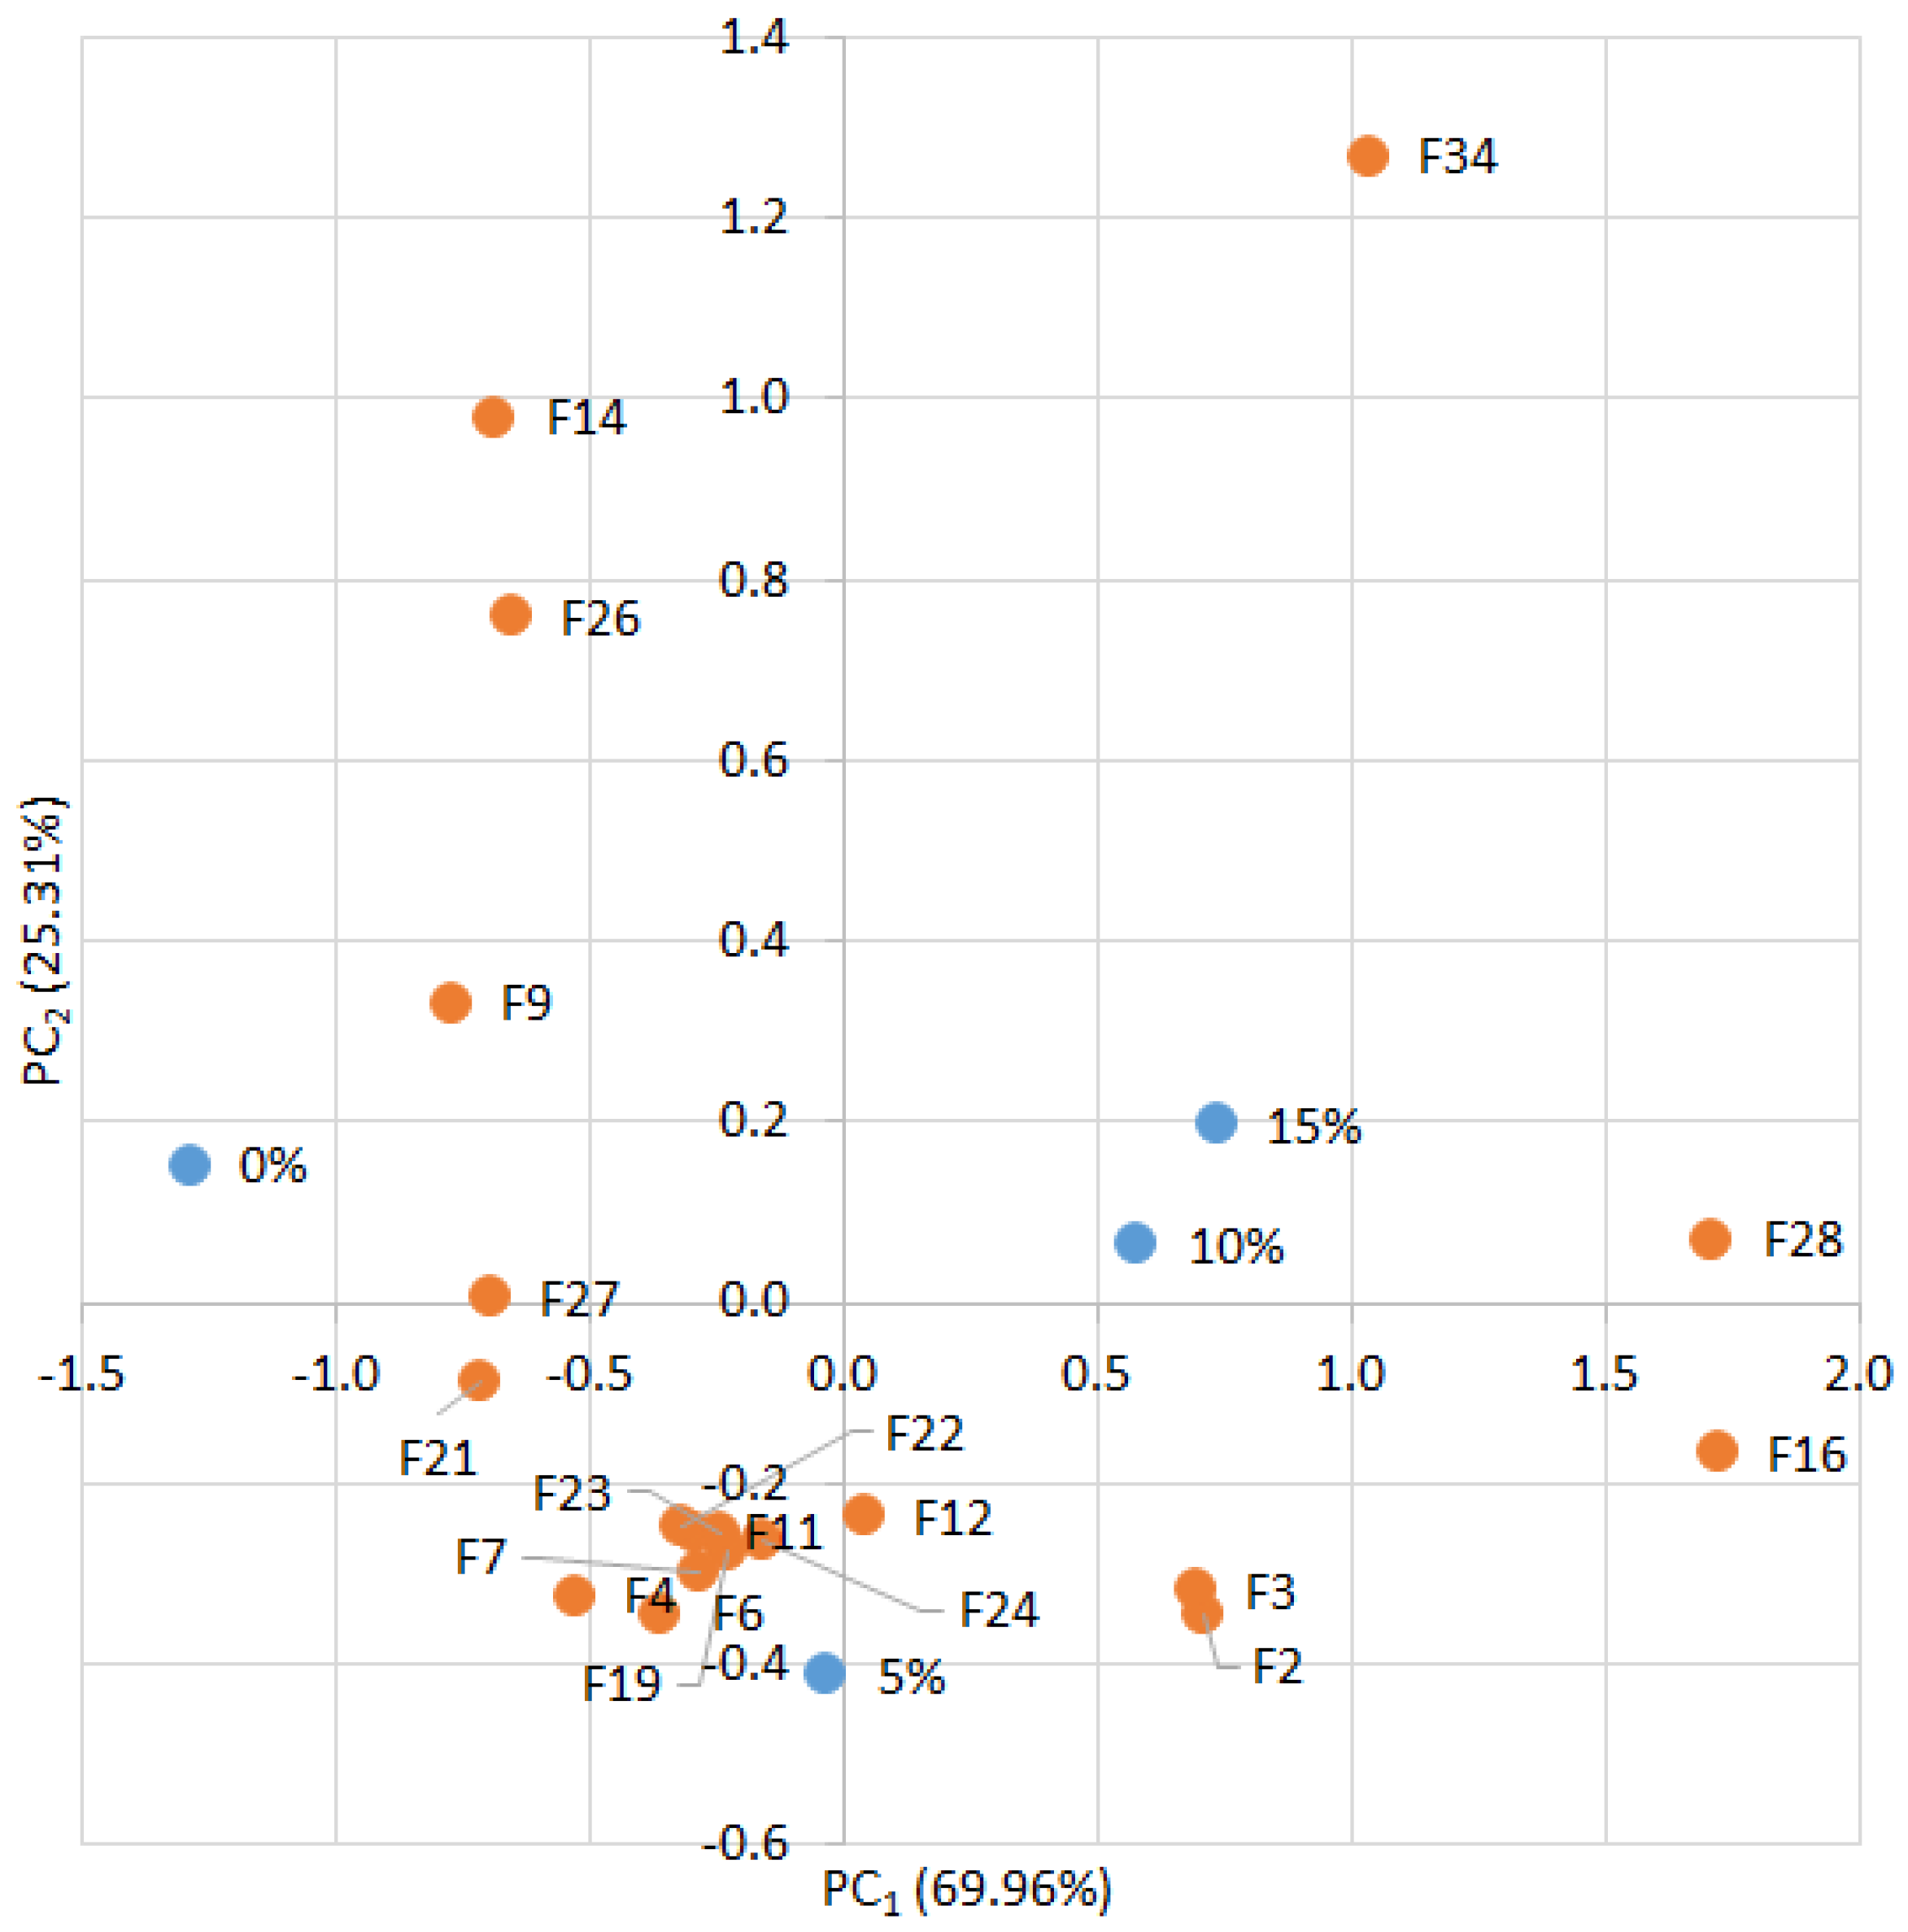
The results of the PCA are presented in
Figure 10. Increasing the proportion of amaranth flour in the biscuits was found to significantly influence several key characteristics, including the color difference of both the dough and biscuits (ΔE—F16, F28) and biscuit consistency (C—F34). Furthermore, as the level of supplementation increased from 0% to 15%, a positive shift in
PC1 was observed, indicating a pronounced effect of the additive on the overall product characteristics. Among these, the TDS of the dough (F6) exhibited a moderately positive response. Similarly, the EC values of the flour blends, dough, and biscuits (F3, F7, and F19) were moderately positively affected by the additive. Conversely, negative effects were observed in the ORP of the flour blends (F4) as well as in certain color attributes of the dough and biscuits, particularly lightness and browning (C1—F9 and F21). Overall,
PC1 accounted for the largest proportion of the additive’s influence on biscuit properties, explaining 69.96% of the total variance. This demonstrates the relevance of these parameters in describing the impact of the additive on biscuit quality.
These findings provide valuable insights for formulation strategies aimed at optimizing biscuit quality in accordance with the desired outcomes associated with the incorporation of amaranth flour.
A regression model of the form
%A =
f(
PC1,
PC2) was obtained. Non-informative coefficients with
p > α were removed. The model equation is as follows:
Table 15 presents the evaluation of the obtained model. The coefficient of determination was R
2 = 0.99. According to the Fisher criterion, F(5, 6) = 611.2 >> F_critical = 4.39, with a significance level of
p << 0.05. The standard error was SE = 0.35.
The regression model predicting %A from the two principal components, PC1 and PC2, and their interactions exhibits excellent predictive strength, with R2 = 0.99. This indicates that the model explains 99% of the variance in %A. All predictors and their interactions were significant at p < 0.001. PC1 has a positive effect on %A, whereas PC2 has a negative effect. The interaction terms PC12 and PC22 indicate that the effects of PC1 and PC2 increase or decrease with their respective magnitudes.
Residual analysis showed that the residuals closely align with a straight line on the normal probability plot and are approximately normally distributed. These results provide strong evidence that the regression model describes the experimental data with sufficient accuracy.
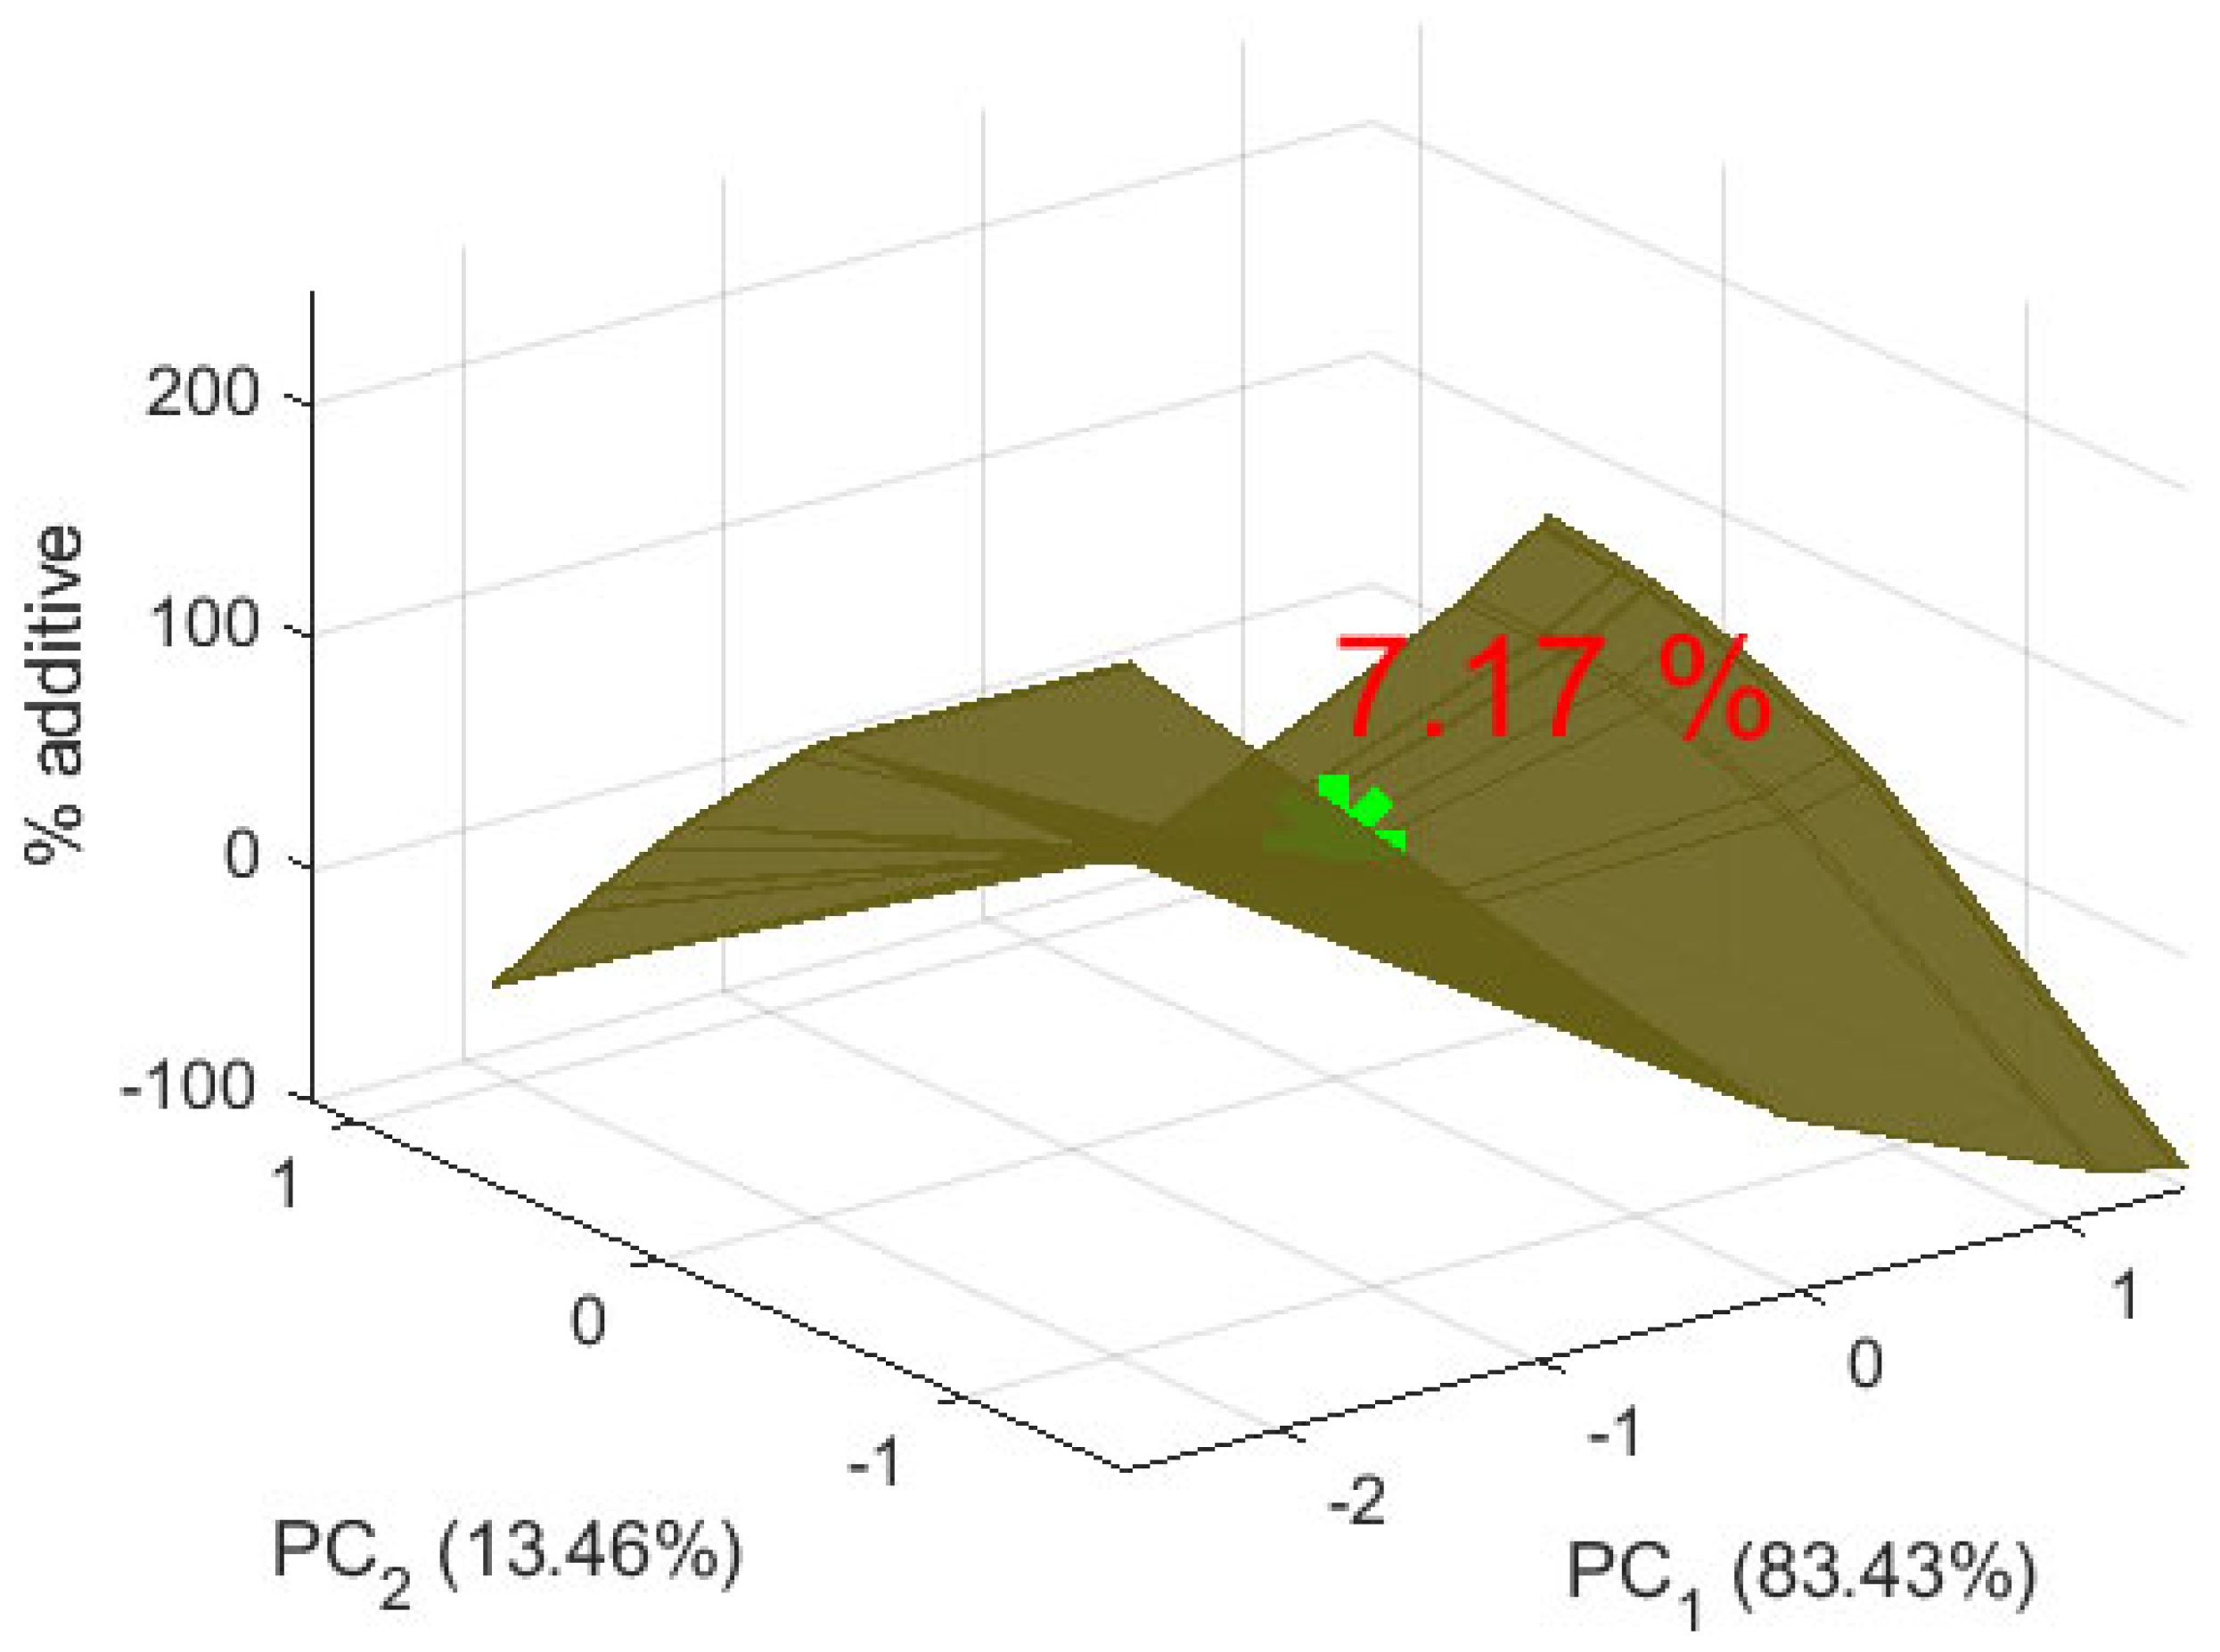
The appropriate amount of amaranth flour in the biscuits was determined, and the result is visualized in
Figure 11. The figure presents model form. The star is the point from the model with the appropriate amount of amaranth additive in wheat flour. The presented value is the appropriate amount of additive. The positive value of
PC1 indicates that the optimal 7.17% additive preserves certain properties more closely to the lower percentages (0%, 5%, 10%). This renders the supplemented biscuits more similar to the characteristics of the control sample. In this context, these properties are more closely associated with weight, diameter, spread ratio, and certain sensory attributes such as taste and aroma of the control sample. The second principal component,
PC2, is close to zero, indicating minimal or no deviation at the 7.17% additive level. This suggests that critical biscuit characteristics are maintained without extreme changes, resulting in a product that is neither over- nor under-modified while retaining the beneficial properties of the additive.
The results indicate that the addition of varying amounts of amaranth flour strongly influences the color and structure of the biscuits. As described in the analysis, increasing the level of supplementation leads to significant changes in certain biscuit characteristics, such as color difference and the organoleptic attribute of consistency. Positive changes in
PC1 suggest that the additive exerts an influence on the properties represented by this principal component, with a moderate positive effect on TDS and EC, and an impact on ORP and color attributes. These findings are consistent with previous reports on the role of amaranth flour in modulating the physical and sensory properties of biscuits [
47,
48].
Polyunsaturated fatty acids (PUFAs) have demonstrable effects on the texture and aroma of baked goods, and comparative studies support these claims.
The incorporation of PUFA-rich ingredients into baked goods has been shown to influence both texture and sensory perception. For instance, Martínez et al. [
49] demonstrated that reformulating puff pastry with oils derived from chia and poppy seeds, both rich in PUFAs, resulted in a softer crumb structure and enhanced aroma, attributed to the oxidative breakdown of unsaturated fatty acids during baking. Similarly, Dominguez et al. [
50] reported that structuring PUFA-rich oils with monoglycerides improved lipid dispersion and contributed to a more cohesive, less brittle texture in semisolid bakery matrices. These findings align with the current study’s observation that amaranth green powder, rich in PUFAs, subtly modifies the biscuit texture and aroma, suggesting that the lipid profile of the additive plays a functional role in shaping sensory outcomes.
Comparative sensory analyses further support the impact of PUFA-rich additives on aroma and mouthfeel. Pimdit et al. [
51] found that puff pastries formulated with salatrim, a fat replacer containing PUFAs, exhibited higher moisture retention and softer texture, though some sensory attributes were less pronounced compared to conventional fat formulations. Moreover, the American Society of Baking notes that PUFAs, despite their susceptibility to oxidation, are valued in commercial baking for their ability to enhance flavor complexity and contribute to a lighter mouthfeel [
52]. These parallels reinforce the current study’s findings that moderate inclusion of amaranth green powder (around 7%) optimizes both nutritional and sensory characteristics, aligning with broader trends in functional bakery product development.
The optimal additive level, determined as 7.17% via PCA, represents the point at which the desired properties closely resemble those of the control sample, maintaining close alignment with characteristics such as weight, diameter, and sensory attributes related to taste and aroma. These results complement observations by Karki et al. [
53] and Raihan et al. [
54], who reported that lower levels of amaranth flour better preserve sensory qualities while providing nutritional benefits [
53,
54]. Overall, the findings of this study suggest that 7.17% is the optimal level for balancing the nutritional advantages of amaranth flour with the preservation of the sensory quality of the biscuits.


