Abstract
A rapid targeted screening method for 22 compounds, including flavonoids, glycosides, and phenolics, in Dendrobium officinale was developed using UHPLC–MS/MS, demonstrating good linear correlation coefficients, precision, repeatability, and stability. D. officinale from the Guangnan and Maguan regions can be effectively classified into two distinct categories using PCA. In addition, OPLS-DA discriminant analysis enables clear separation between groups, with samples forming well-defined clusters. The 22 chemical components provide valuable origin-related information for D. officinale. The compounds with VIP values of >1 included eriodictyol, vanillic acid, protocatechuic acid, gentisic acid, and naringenin. The difference in naringenin content between D. officinale from the two production areas was minimal. By contrast, eriodictyol and vanillic acid were relatively abundant in D. officinale from Guangnan, while gentisic acid and protocatechuic acid were more prevalent in D. officinale from Maguan. The pathways with higher Kyoto Encyclopedia of Genes and Genomes enrichment were primarily associated with lipid metabolism and atherosclerosis, fluid shear stress and atherosclerosis, and nonalcoholic fatty liver disease. These findings suggest that D. officinale exhibits promising lipid-balancing properties and potential cardiovascular health benefits. Seven machine learning algorithms—Random Forest, XGBoost, Support Vector Machine, k-Nearest Neighbor, Backpropagation Neural Network, Random Tree, and CatBoost—demonstrated superior accuracy and precision in distinguishing D. officinale from the Guangnan and Maguan regions. The key compounds with higher weights—vanillic acid, chrysoeriol, trigonelline, isoquercitrin, gallic acid, 4-hydroxybenzaldehyde, eriodictyol, sweroside, apigenin, and homoeriodictyol—play a crucial role in model construction and the identification of D. officinale from the Guangnan and Maguan regions. The quantification of 22 compounds using UHPLC–MS/MS, combined with PCA, OPLS-DA, and machine learning, enables effective discrimination of D. officinale from these two Yunnan production areas.
1. Introduction
Dendrobium officinale, a member of the orchid family Dendrobium, is one of China’s distinctive medicinal herbs. In November 2023, the National Health Commission and the State Administration of Market Supervision and Administration included D. officinale in the catalog of medicinal and food substances [1]. Owing to its notable health benefits—including antioxidant [2], anti-inflammatory [3], blood-sugar- and blood-pressure-lowering [4,5], liver-protective [6], and antitumor properties [7]—D. officinale has been widely used as a raw material in the food industry.
D. officinale is primarily distributed across China’s Anhui, Zhejiang, Guangxi, Yunnan, and other regions, with Yunnan Province serving as one of its key production areas [8]. Guangnan County, located in Wenshan City, Yunnan, is distinguished by its unique karst landscape and a subtropical plateau monsoon climate characterized by high humidity, significant temperature variations between day and night, and slightly alkaline soil. These environmental conditions contribute to the slow growth of D. officinale in the region, promoting the accumulation of bioactive compounds that enhance its medicinal value and health benefits. In recent years, this has made D. officinale highly sought after by consumers [9].
Guangnan D. officinale has strong brand effect and active function; however, its limited geographical range and production capacity make it difficult to meet the growing market demand. Driven by economic interests, some dishonest growers substitute cheaper, lower-quality D. officinale from outside the Guangnan region—such as Maguan County in Wenshan City—falsely presenting it as Guangnan D. officinale. As these counterfeit products are difficult to distinguish by appearance alone, they pose a significant challenge to the high-quality development and economic growth of the Guangnam D. officinale industry [8,10].
In recent years, various methods have been used for identifying Dendrobium, including near-infrared spectroscopy [11,12,13], stable isotopic and elemental analysis [14], nucleic acid technology [15,16], mass spectrometry [17,18,19], and NMR [20]. Near-infrared spectroscopy effectively distinguishes different Dendrobium species but requires complex data processing [8]. Stable isotopic and elemental analysis detects only specific elements; however, the necessary instruments—especially stable isotope mass spectrometers—are costly and demand rigorous sample pretreatment [21]. NMR technology faces challenges owing to the complexity of nuclear magnetic spectrum analysis and limited instrument sensitivity [20]. Nucleic acid technology relies on DNA probes, which pose certain limitations in practical applications [22]. Mass spectrometry typically employs nontargeted screening, achieving superior identification results. However, it generates large datasets, which increases the workload for data analysis [23,24]. Given these challenges, establishing a simple and effective identification method is crucial.
Machine learning overcomes the drawbacks of manual feature variable selection, which is inefficient and highly subjective. Not only can it analyze large datasets more efficiently and objectively, but it also significantly enhances the efficiency and accuracy of identification [25,26]. The integration of machine learning with mass spectrometry technology has made identification more effective, efficient, and accurate, and its applications have become increasingly widespread in recent years [27,28,29]. In most cases, machine learning is employed for the analysis and classification of non-targeted metabolomics data. Given the substantial volume of non-targeted metabolomics datasets, the overall data processing workload is also considerable. Targeted metabolomics is a qualitative and quantitative approach for analyzing specific target compounds. It reduces the workload of the screening process, enhances accuracy and sensitivity, and offers better specificity and stability. In recent years, it has been widely applied in tracing and identifying agricultural products [30,31,32]. To analyze flavonoids, glycosides, and phenolics in D. officinale, UHPLC–MS/MS was employed for the targeted analysis of samples cultivated in the Guangnan and Maguan regions of Wenshan City, Yunnan Province. By integrating chemometrics and machine learning, this study aims to establish a rapid and effective identification method for D. officinale from these production areas.
2. Materials and Methods
2.1. Reagents and Solutions
Apigenin, chrysoeriol, epicatechin gallate, eriodictyol, gallic acid, gentisic acid, homoeriodictyol, hyperoside, isoquercitrin, lonicerin, myricitrin, naringenin, naringin, protocatechuic acid, quercetin, schaftoside, scutellarein, sweroside, syringin, trigonelline, vanillic acid, and 4-hydroxybenzaldehyde (purity > 98%) were purchased from Shanghai Yuanye Bio-Technology Co., Ltd. (Shanghai, China). Methanol and acetonitrile (HPLC grade) were obtained from Merck KGaA (Darmstadt, Germany), while formic acid (mass spectrometry grade) was sourced from Dikma Technologies Inc. (Beijing, China). Ultrapure water was prepared using Elga’s water purification system (Wycombe, UK).
2.2. D. officinale Collection
D. officinale samples were collected from Guangnan County and Maguan County, Wenshan City, Yunnan Province, China, as shown in Figure 1. A total of 45 D. officinale samples were obtained from each region, specifically from the aboveground stem parts of plants with a growth period of 3–4 years. Five branches were collected from each sample, with individual branches measuring approximately 15–20 cm in length. These were then cut into 2 cm segments, mixed, dried at 50 °C, crushed, and passed through a 0.28 μm sieve. Each sample was individually packaged in polyethylene bags and stored at 4 °C away from light.
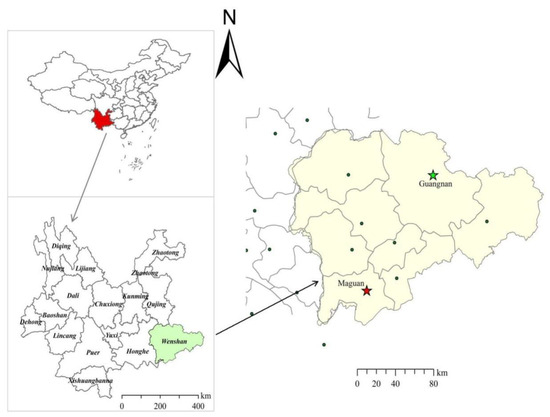
Figure 1.
D. officinale collection area.
2.3. Standard Solution Preparation
A total of 10 mg of each compound—apigenin, chrysoeriol, epicatechin gallate, eriodictyol, gallic acid, gentisic acid, homoeriodictyol, hyperoside, isoquercitrin, lonicerin, myricitrin, naringenin, naringin, protocatechuic acid, quercetin, schaftoside, scutellarein, sweroside, syringin, trigonelline, vanillic acid, 4-hydroxybenzoic acid, and 4-hydroxybenzaldehyde—was weighed. Each compound was dissolved in methanol, with the volume adjusted to 10 mL to prepare a 1 mg/mL standard solution. The solution was then transferred into 15 mL sealed brown reagent vials and stored at −4 °C away from light.
2.4. Sample Preparatison
A total of 2.5 g of D. officinale samples were weighed and mixed with 15 mL of aqueous methanol (8:2 ratio). The mixture was vortexed for 5 min, followed by sonication in a water bath for 30 min. This mixture was then centrifuged for 5 min, passed through a 0.22 μm filter membrane, and set aside for analysis.
2.5. UHPLC–MS/MS Parameters
The extracted D. officinale solution was injected into an AB QTRAP 5500 triple quadrupole mass spectrometer (Framingham, MA, USA) equipped with an ExionLC AD ultrahigh-performance liquid chromatograph (Framingham, MA, USA) and a Waters ACQUITY BEH C18 column (2.1 × 100 mm, 1.7 μm; Waters, Milford, MA, USA). The column temperature was maintained at 35 °C, with an injection volume of 2 μL. Gradient elution was performed using aqueous solution (A) containing 0.1% formic acid and 1 mmol/L ammonium acetate (B), acetonitrile (B), at a flow rate of 0.2 mL/min. The elution procedure was as follows: 0 min: 95% A, 3 min: 60% A, 5 min: 40% A, 8 min: 5% A, 10.2 min: 5% A, 10.3 min: 95% A, and 13 min: 95% A.
The mass spectrometry conditions were as follows: an ESI ion source operating in multiple reaction monitoring mode, with a spray voltage of 5500 V and an ion source temperature of 550 °C. The collision gas (CAD) was set to medium, with a gas flow rate of 20 L/h and a nebulizing gas flow rate of 55 L/h. Other mass spectrometry parameters are presented in Table 1.

Table 1.
Mass spectrometry parameters of 22 active compounds.
2.6. Method Validation
The 22 compounds in D. officinale examined in this study were diluted to varying concentrations using methanol, and their linear regression equations were calculated by plotting the mass concentration of each compound on the x-axis and the corresponding peak area on the y-axis. The limit of detection (LOD) and limit of quantification (LOQ) were determined at S/N = 3 and S/N = 10, respectively. As the 22 compounds are natural products, the experiment was conducted with reference to method validation from the literature [55], focusing on precision, reproducibility, and stability. The precision test was conducted using the same D. officinale sample extraction solution, with the sample injected six consecutive times. The content of each compound was recorded, and its RSD value was calculated. For the repeatability test, the same D. officinale sample extraction solution was used to prepare six parallel samples, which were then injected and analyzed. The content of each compound was recorded, and the RSD for the 22 measured compounds was calculated. The stability test was conducted using the same D. officinale sample extraction solution, with compound content recorded at different time intervals—0, 2, 4, 8, 16, and 24 h—following injection and analysis. The RSD values were then determined.
2.7. Data Processing
The content of 22 compounds in D. officinale was analyzed by quantifying them using standard solutions. Their concentrations were further examined through principal component analysis (PCA), volcano plots, and heat maps. Model fitness and predictive performance were evaluated using R2(cum) and Q2(cum) through cross-validation. Representative differential metabolites were then selected for metabolic pathway enrichment analysis using metabolic pathway databases such as the Kyoto Encyclopedia of Genes and Genomes (KEGG, www.genome.jp/kegg, accessed on 7 May 2025).
SPSS software (v. 25) was used to perform machine learning on the dataset, prior to machine learning, the dataset was partitioned. The training and test sets were randomly divided in a 7:3 ratio, with the independent test set used for external validation of the model’s accuracy. To identify the optimal model for the machine learning evaluation of D. officinale origin identification data, various algorithms were employed, including Random Forest (RF), XGBoost, Support Vector Machine (SVM), k-Nearest Neighbor (KNN), Backpropagation Neural Network (BPNN), Random Tree (RT), and Catoost.
3. Results and Discussion
3.1. Optimization of Mass Spectrometry Conditions
All 22 compounds were diluted to 1 μg/mL using methanol and injected into the mass spectrometer via a syringe pump at a flow rate of 10 μL/min. Each compound was analyzed to identify precursor and product ions and to optimize DP and CE. The appropriate scanning mode was selected based on the peak profile of the target compound in the D. officinale sample. For example, although apigenin exhibits a strong response in the positive ion mode, an interference peak appears at the target peak position when analyzing the D. officinale sample. By contrast, the negative ion mode eliminates this interference at the target peak position, despite its response being approximately 10 times lower than that in the positive ion mode. Owing to the high apigenin content in the D. officinale samples, the use of the negative ion mode did not affect characterization or quantification, and no interference peaks were observed. The chromatograms of the 22 compounds are shown in Figure S1.
3.2. Method Validation
As presented in Table 2, the linear range was 0.001–15 μg/mL, with an r2 value of >0.999. The LOQ ranged from 0.006 to 1.2 mg/kg, while the LOD ranged from 0.001 to 0.4 mg/kg. The RSD values for precision, repeatability, and stability tests were 0.86–7.50%, 0.80–8.30%, and 1.40–8.38%, respectively. Results demonstrated that the 22 compounds exhibited good linear correlation coefficients, precision, repeatability, and stability, making them suitable for the determining flavonoids/glycosides, phenols, and other active compounds in D. officinale.
Table 2.
Analytical parameters for each of the 22 compounds: linear range, correlation coefficient, LOD, LOQ, accuracy, and precision.
3.3. PCA and OPLS-DA for the Identification of D. officinale
The 22 chemical components in 90 D. officinale samples were analyzed using unsupervised PCA, with the results shown in Figure 2. PCA effectively classified D. officinale from Guangnan and Maguan into two distinct categories. PC1 explained 48.8% of the variance and PC2 contributed 27.1%, resulting in a combined variance of 0.759, which meets the acceptable threshold in bioinformatics. This suggests that the 22 selected chemical constituents in this study can, to some extent, serve as representative markers for determining the origin of D. officinale.
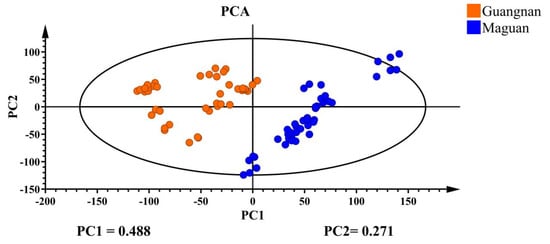
Figure 2.
PCA plot of D. officinale from Guangnan and Maguan.
Supervised OPLS-DA discriminant analysis was applied to analyze the data, with the results shown in Figure 3. The D. officinale samples with different origins were clustered into distinct groups and were completely separable, showing significantly better clustering than PCA. This suggests that the supervised learning model effectively differentiates D. officinale from Guangnan and Maguan. Cross-validation results (Figure 4) indicate that R2 and Q2 values exceed 0.8, demonstrating a highly interpretable model with high predictability, confirming its validity for this analysis.
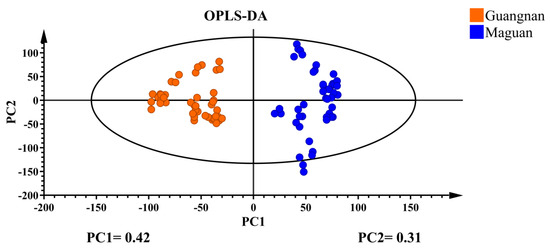
Figure 3.
OPLS-DA plot of D. officinale from Guangnan and Maguan.
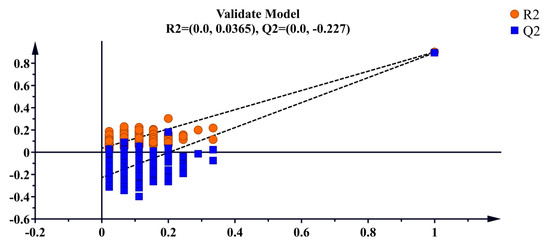
Figure 4.
Cross-validation plot for the OPLS-DA model.
The variable importance point (VIP) values of the 22 compounds were obtained through OPLS-DA, where a higher VIP value indicates a greater contribution of a compound in differentiating D. officinale from Guangnan and Maguan. Compounds with high VIP values were classified as differential compounds, as shown in Figure S2.
The compounds with VIP values of >1 were flavonoids and phenolic acids, including eriodictyol, vanillic acid, protocatechuic acid, gentisic acid, and naringenin. This indicates that flavonoids and phenolic acids—precursor compounds in the biosynthetic pathway of phytosynthesis—exhibit significant variation under different environmental conditions. Differential compounds were subjected to correlation analysis, with results shown in Figure 5. The correlation coefficient between protocatechuic acid and gentisic acid was 0.99, suggesting that phenolic acids may undergo hydroxylation and decarboxylation transformations in plants, although further confirmation is required. In addition, the correlation coefficient between eriodictyol and vanillic acid was 0.70, indicating a possible pathway in which the methoxy (–OCH3) group in vanillic acid is converted to a hydroxyl (–OH) group within the plant body by demethylases, such as cytochrome P450 enzymes. The resulting protocatechuic acid can then enter the phenylpropanoid pathway, where it may be further transformed into p-coumaric acid or its derivatives, eventually leading to the synthesis of eriodictyol.
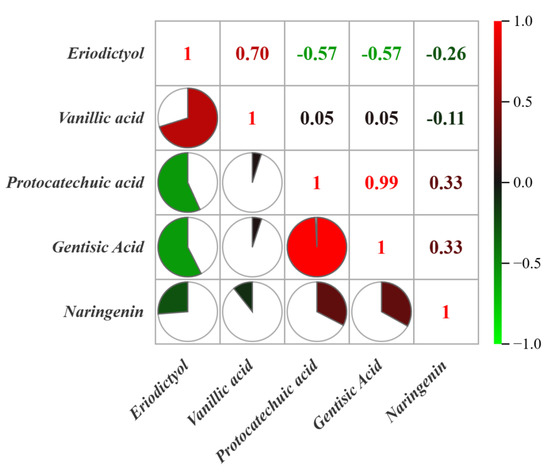
Figure 5.
Correlation analysis of chemical compounds in D. officinale from Guangnan and Maguan.
3.4. Heat Map and Volcano Plot Analyses for D. officinale Discrimination
The differences and correlations among the 22 compounds in D. officinale from Guangnan and Maguan were visualized using a heat map (Figure 6). Based on variations in compound content, the samples were clustered into two distinct groups, aligning with their geographical origins—Guangnan and Maguan. Overall, D. officinale from Guangnan contained higher levels of eriodictyol, homoeriodictyol, 4-hydroxybenzaldehyde, sweroside, apigenin, quercetin, vanillic acid, syringin, schaftoside, epicatechin gallate, and scutellarein. By contrast, samples from Maguan exhibited higher concentrations of hyperoside, lonicerin, naringin, naringenin, gallic acid, gentisic acid, protocatechuic acid, trigonelline, chrysoeriol, isoquercitrin, and myricitrin.
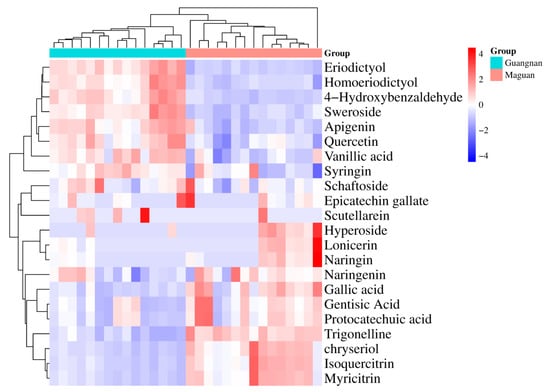
Figure 6.
Heat map analysis of 22 compounds in D. officinale from Guangnan and Maguan.
The results of the volcano plot analysis are shown in Figure S3. Among the 22 compounds, those with significant variations were eriodictyol, vanillic acid, protocatechuic acid, and gentisic acid, aligning with the findings of the VIP analysis. The violin plot (Figure S4) visualizes the differences in the content of five differential compounds in D. officinale from Guangnan and Maguan. The content of naringenin varied only slightly between the two regions, whereas eriodictyol and vanillic acid were relatively higher in D. officinale from Guangnan, while gentisic acid and protocatechuic acid had higher concentrations in samples from Maguan. These compounds may serve as active components distinguishing D. officinale from Guangnan and Maguan.
3.5. KEGG Pathway Analysis of Differential Metabolites in D. officinale from Guangnan and Maguan
The differential compounds—eriodictyol, vanillic acid, protocatechuic acid, gentisic acid, and naringenin—with VIP values of >1 were entered into the BATMAN-TCM database (http://bionet.ncpsb.org/batman-tcm, accessed on 5 May 2025) to identify their potential action targets using a score cutoff of 0.86 as the screening criterion. KEGG signaling pathway enrichment analysis of the potential targets was then performed using the clusterProfiler module in the R software (v. 4.2.3) package. A threshold of p < 0.05 was applied to filter the relevant signaling pathways and visualize the enrichment results. A total of 136 signaling pathways were identified through screening, and the top 20 pathways were selected for visualization using bar and dot plots (Figure 7). The most enriched pathways were related to lipid metabolism and atherosclerosis, suggesting that D. officinale may offer health benefits for lipid homeostasis and cardiovascular health, which aligns with findings reported in the literature [19]. The biological activities of these five differential compounds have been documented in relevant literature. As an example, eriodictyol functions as a regulator of lipid metabolism [56,57], while vanillic acid offers protective effects against lipid-metabolizing enzymes [58]. In addition, protocatechuic acid, gentisic acid, and naringenin are known to alleviate atherosclerosis [59,60,61,62,63] and may serve as key active compounds in the lipid and atherosclerosis pathway. Furthermore, enrichment analysis highlighted significant involvement in the fluid shear stress and atherosclerosis pathway as well as the nonalcoholic fatty liver disease pathway, reinforcing the potential cardiovascular protective effects of D. officinale. These findings provide valuable insight into the development of Dendrobium resources in Yunnan Province, China. However, in this experiment, the KEGG pathways of the compounds already identified cannot fully substantiate their biological effects. Further analysis is required to examine the correlation between the metabolic degradation levels of these compounds and their potential effect concentrations, which may necessitate subsequent investigations.
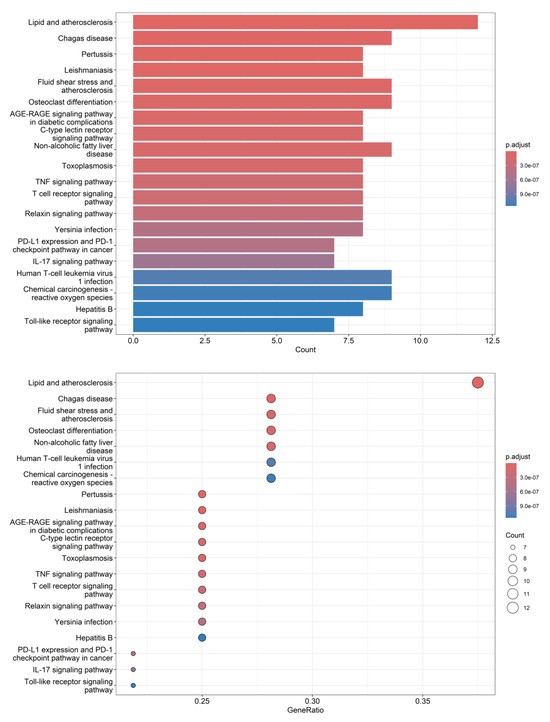
Figure 7.
Bar plot and dot plot visualization of KEGG enrichment pathways for differential metabolites.
3.6. Machine Learning
Machine learning, a generalized linear regression analysis model, effectively handles a large number of input features and is used for binary classification problems, making it a powerful tool in supervised learning [64,65]. In the experiments, accuracy, precision, recall, and F1 score were used to evaluate and compare the performance of different machine learning models in classifying training and testing sets of D. officinale samples from Guangnan and Maguan. Higher accuracy indicates better model performance in origin prediction. Precision represents the proportion of correctly predicted samples, with a higher precision reflecting the ability of the model to accurately identify the origin. Recall measures the percentage of correct predictions made by the origin identification model, with a higher recall indicating improved recognition of samples from different origins. The F1 score is the harmonic mean of precision and recall, ranging from 0 to 1. The closer the F1 score is to 1, the better the overall performance of the model. Results are presented in Table 3, showing that the accuracy and precision of the seven machine learning models were relatively high, which may be related to the significant variations in the content of the selected variables across different D. officinale from Guangnan and Maguan.
Table 3.
Comparison of classification accuracy across different machine learning models.
Among various machine learning methods, SVM and KNN are sensitive to feature scale and require Z-score standardization or normalization of data. In this experiment, both processed and unprocessed data achieved 100% prediction accuracy. Feature scaling had minimal impact on prediction results for RF, RT, XGBoost, BPNN, and CatBoost. Regardless of data processing, the prediction accuracy for the target variable class was 100%. To maintain consistency in the workflow, the “none” processing method was selected for all machine learning models used in this study. Other studies have also demonstrated that machine learning models such as RF [66], XGBoost [67], SVM [68], and KNN [69] exhibit excellent accuracy and precision, consistent with the findings of this research. The result indicates a significant difference in the chemical composition of D. officinale between the two origins. In addition, the application of various machine learning models effectively enhances the identification of D. officinale from Guangnan and Maguan.
The 22 measured compounds were modeled as independent variables, while class was modeled as the dependent variable. Compounds with weight values of >0 were selected for feature weight plots. As shown in Figure S5, the compounds with higher weights primarily included vanillic acid, chrysoeriol, trigonelline, isoquercitrin, gallic acid, 4-hydroxybenzaldehyde, eriodictyol, sweroside, apigenin, and homoeriodictyol. These compounds played a key role in model construction, suggesting they are critical for distinguishing D. officinale from Guangnan and Maguan. It also demonstrates that the flavonoids/glycosides and phenolic compounds selected from the D. officinale in the experiment were representative and can effectively trace the origin of D. officinale from Guangnan and Maguan with machine learning.
4. Conclusions
A rapid target screening method for 22 compounds, including flavonoids/glycosides and phenols, in D. officinale was developed using UHPLC–MS/MS. The linear ranges of the 22 compounds were 0.001–15 μg/mL, with r2 of >0.999. The LOQs ranged from 0.006 to 1.2 mg/kg, while the LODs ranged from 0.001 to 0.4 mg/kg. The RSD values were as follows: precision, 0.86–7.50%; repeatability, 0.80–8.30%; and stability, 1.40–8.38%, demonstrating strong reliability across tests. These results confirm that the 22 compounds demonstrated strong linear correlation coefficients, along with high precision, repeatability, and stability, enabling rapid and accurate screening of active compounds such as flavonoids/glycosides and phenols in D. officinale.
PCA effectively classified D. officinale from Guangnan and Maguan into two distinct categories, with PC1 and PC2 accounting for a combined variance of 0.759. Through OPLS-DA discriminant analysis, the samples exhibited intragroup aggregation and were completely separable between groups, demonstrating significantly better clustering than PCA. This indicates that the supervised learning model can effectively distinguish D. officinale from Guangnan and Maguan. Cross-validation results suggest that the model is highly interpretable and predictive, and the 22 chemical components serve as informative markers for determining the origin of D. officinale.
The compounds with VIP values of >1 include eriodictyol, vanillic acid, protocatechuic acid, gentisic acid, and naringenin. The correlation coefficient between protocatechuic acid and gentisic acid was 0.99, while the correlation coefficient between eriodictyol and vanillic acid was 0.70. Heat map analysis revealed that the 22 compounds could be clustered into two distinct groups based on differences in their content, aligning with the distribution of the two origins—Guangnan and Maguan. Volcano plot analysis identified eriodictyol, vanillic acid, protocatechuic acid, and gentisic acid as the compounds with significant variations, consistent with the VIP analysis results. The content of naringenin showed minimal differences between the two production areas. Overall, eriodictyol and vanillic acid were relatively high in D. officinale from Guangnan, while gentisic acid and protocatechuic acid were more abundant in samples from Maguan.
The KEGG signaling pathway enrichment analysis revealed that the most enriched pathways were related to lipid metabolism and atherosclerosis. In addition, significant enrichment was observed in fluid shear stress and atherosclerosis, nonalcoholic fatty liver disease, and other pathways, highlighting the potential health benefits of D. officinale in lipid homeostasis and cardiovascular health.
The seven machine learning models—RF, XGBoost, SVM, KNN, BPNN, RT, and CatBoost—demonstrated higher accuracy and precision in classification. The compounds with higher weights, including vanillic acid, chrysoeriol, trigonelline, isoquercitrin, gallic acid, 4-hydroxybenzaldehyde, eriodictyol, sweroside, apigenin, and homoeriodictyol, played a key role in the model construction and identification of D. officinale from Guangnan and Maguan.
Supplementary Materials
The following supporting information can be downloaded at: https://www.mdpi.com/article/10.3390/foods14193442/s1, Figure S1: Chromatograms of 22 compounds; Figure S2: VIP plots for OPLS-DA-based discrimination of D. officinale from Guangnan and Maguan; Figure S3: Volcano plot analysis of 22 compounds in D. officinale from Guangnan and Maguan; Figure S4: Violin plot analysis of differential metabolites in D. officinale from Guangnan and Maguan; Figure S5: Feature weight plot for different machine learning models.
Author Contributions
H.L. and Q.Y. supervised the project. T.L. and Y.Y. collaboratively designed the experiments. T.L. and Y.Y. prepared the schematic diagrams and drafted the manuscript. J.Z., J.W. and X.C. conducted the experiments and obtained the data. Z.H., K.Z.L. and Z.L. collected the samples. All authors have read and agreed to the published version of the manuscript.
Funding
This study was funded by the Yunnan Fundamental Research Projects (grant no. 202301BD070001-049), the Key Project of Natural Science Foundation of Yunnan Province (grant no. 202501AS070033) and the Yunnan Academician Expert Workstation (grant no. 202305AF150015).
Institutional Review Board Statement
Not applicable.
Informed Consent Statement
Not applicable.
Data Availability Statement
The original contributions presented in this study are included in the article/Supplementary Material. Further inquiries can be directed to the corresponding authors.
Conflicts of Interest
The authors declare no conflicts of interest.
References
- Announcement on 9 New Substances of Codonopsis Pilosula and Other New Substances which are Both Food and Traditional Chinese Medicines in accordance with Tradition. Available online: http://law.foodmate.net/show-225521.html (accessed on 5 October 2025).
- Wan, J.; Gong, X.; Wang, F.; Wen, C.; Wei, Y.; Han, B.; Ouyang, Z. Comparative analysis of chemical constituents by HPLC–ESI–MSn and antioxidant activities of Dendrobium huoshanense and Dendrobium officinale. Biomed. Chromatogr. 2022, 36, e5250. [Google Scholar] [CrossRef] [PubMed]
- Wan, Z.; Zheng, G.; Zhang, Z.; Ruan, Q.; Wu, B.; Wei, G. Material basis and core chemical structure of Dendrobium officinale polysaccharides against colitis-associated cancer based on anti-inflammatory activity. Int. J. Biol. Macromol. 2024, 262, 130056. [Google Scholar] [CrossRef] [PubMed]
- Chen, W.; Lu, J.; Zhang, J.; Wu, J.; Yu, L.; Qin, L.; Zhu, B. Traditional uses, phytochemistry, pharmacology, and quality control of Dendrobium officinale Kimura et. Migo. Front. Pharmacol. 2021, 12, 726528. [Google Scholar] [CrossRef] [PubMed]
- Wu, W.; Zhao, Z.; Zhao, Z.; Zhang, D.; Zhang, Q.; Zhang, J.; Fang, Z.; Bai, Y.; Guo, X. Structure, health benefits, mechanisms, and gut microbiota of Dendrobium officinale polysaccharides: A review. Nutrients 2023, 15, 4901. [Google Scholar] [CrossRef]
- Hui, A.; Xu, W.; Wang, J.; Liu, J.; Deng, S.; Xiong, B.; Zhang, W.; Wu, Z. A comparative study of pectic polysaccharides from fresh and dried Dendrobium officinale based on their structural properties and hepatoprotection in alcoholic liver damaged mice. Food Funct. 2023, 14, 4267–4279. [Google Scholar] [CrossRef]
- He, Y.; Jiang, P.; Bian, M.; Xu, G.; Huang, S.; Sun, C. Structural characteristics and anti-tumor effect of low molecular weight Dendrobium officinale polysaccharides by reconstructing tumor microenvironment. J. Funct. Foods 2024, 119, 106314. [Google Scholar] [CrossRef]
- Liu, W.; Qiu, X.; Jiang, L.; Fan, W.; Li, P.; Zhen, Y. Origin Traceability of Dendrobium candidum with Near Infrared Spectroscopy and Variable Selection-Partial Least Squares Discriminant Analysis. J. Instrum. Anal. 2025, 44, 246–252. [Google Scholar]
- Zhang, X.; Zhou, C.; Zhang, L.; Jiang, M.; Xie, Z.; Yuan, Y.; Huang, Y.; Luo, Y.; Wei, G. Isolation and Identification of Main Flavonoid Glycosides of Dendrobium officinale from Danxia Species and Yunnan Guangnan Species. Chin. J. Exp. Tradit. Med. Formulae 2019, 25, 29–34. [Google Scholar]
- Zhen, P.; Wen, M.; Wang, X.; Liu, Q.; He, X.; Zuo, Y. Establishment of Fingerprint Spectra for Fresh Dendrobium officinale from Different Origins and Research on Chemical Pattern Recognition. J. Chin. Med. Mater. 2024, 47, 3071–3075. [Google Scholar]
- Yang, Y.; She, X.; Cao, X.; Yang, L.; Huang, J.; Zhang, X.; Su, L.; Wu, M.; Tong, H.; Ji, X. Comprehensive evaluation of Dendrobium officinale from different geographical origins using near-infrared spectroscopy and chemometrics. Spectrochim. Acta A 2022, 277, 121249. [Google Scholar] [CrossRef]
- Han, J.; Hu, Q.; Wang, Y. Geographical origin identification of Dendrobium officinale based on FT-NIR and ATR-FTIR spectroscopy. Food Biosci. 2025, 63, 105753. [Google Scholar] [CrossRef]
- Li, G.; Hu, Q.; Wang, Y. Chemometrics and deep learning assisted infrared spectroscopic identification of Dendrobium species. J. Food Compos. Anal. 2025, 140, 107296. [Google Scholar] [CrossRef]
- Xiong, F.; Yuan, Y.; Li, C.; Lyu, C.; Wan, X.; Nie, J.; Li, H.; Yang, J.; Guo, L. Stable isotopic and elemental characteristics with chemometrics for the geographical origin authentication of Dendrobium officinale at two spatial scales. LWT 2022, 167, 113871. [Google Scholar] [CrossRef]
- Yuan, Y.H.; Hou, B.W.; Xu, H.J.; Luo, J.; Ding, X.Y. Identification of the geographic origin of Dendrobium thyrsiflorum on Chinese herbal medicine market using trinucleotide microsatellite markers. Biol. Pharm. Bull. 2011, 34, 1794–1800. [Google Scholar] [CrossRef][Green Version]
- Chen, W.; Chen, X.; Xu, J.; Cai, J.; Wang, X. Identification of Dendrobium officinale using DNA barcoding method combined with HRM and qPCR technology. Food Anal. Methods 2022, 15, 1–11. [Google Scholar] [CrossRef]
- Yuan, Y.; Li, C.; Qiu, S.; Yang, C.; Zhou, R.; Liu, S. Exploring the medicinal potential of Dendrobium: Uncovering the spatial distribution of flavonoids and alkaloids in 15 species of Dendrobium using MALDI-MSI. Sci. Hortic. 2024, 338, 113738. [Google Scholar] [CrossRef]
- Lin, T.; Chen, X.-L.; Wang, J.; Hu, Z.-X.; Wu, G.-W.; Sha, L.-J.; Cheng, L.; Liu, H.-C. Application of time of flight mass spectrometry in the identification of Dendrobium devonianum Paxt and Dendrobium officinale Kimura et Migo Grown in Longling Area of Yunnan, China. Separations 2022, 9, 108. [Google Scholar] [CrossRef]
- Lin, T.; Chen, X.; Du, L.; Wang, J.; Hu, Z.; Cheng, L.; Liu, Z.; Liu, H. Traceability Research on Dendrobium devonianum Based on SWATHtoMRM. Foods 2023, 12, 3608. [Google Scholar] [CrossRef]
- Gong, K.; Yin, X.; Ying, N.; Wu, M.; Lyu, Y.; Zheng, H.; Jiang, L. Rapid and accurate detection of Dendrobium officinale adulterated with lower-price species using NMR characteristic markers integrated with artificial neural network. J. Food Meas. Charact. 2024, 18, 4845–4852. [Google Scholar] [CrossRef]
- Li, X.; Mao, Q.; Yang, Q.; Li, Q.; Zhu, Y.; Shi, H.; Yan, L.; Liu, Y.; Hu, Y.; Xie, Q.; et al. Research progress on origin traceability technology of Chinese medicinal materials. Chem. Anal. Meterage 2025, 34, 142–152. [Google Scholar]
- Jing, S.; Zhou, Y.; Dou, X.; Luo, X.; Yu, B.; Liu, Y.; Xiang, T. Characterization of Dendrobium officinale Based on DNA Molecular Markers. Food Nutr. Chin. 2024, 1, 1–8. [Google Scholar]
- He, Q.; Lu, A.; Qin, L.; Zhang, Q.; Lu, Y.; Yang, Z.; Tan, D.; He, Y. An UPLC-Q-TOF/MS-Based Analysis of the Differential Composition of Dendrobium officinale in Different Regions. J. Anal. Methods Chem. 2022, 2022, 8026410. [Google Scholar] [CrossRef] [PubMed]
- Yang, J.; Han, X.; Wang, H.-Y.; Yang, J.; Kuang, Y.; Ji, K.-Y.; Yang, Y.; Pang, K.; Yang, S.-X.; Qin, J.-C. Comparison of metabolomics of Dendrobium officinale in different habitats by UPLC-Q-TOF-MS. Biochem. Syst. Ecol. 2020, 89, 104007. [Google Scholar] [CrossRef]
- Huang, P.; Zhang, T.; Liu, H.; Yuan, T. Research Progress of Chemical Fingerprint in the Origin Traceability of Traditional Chinese Medicine. Chem 2025, 1, 1–13. [Google Scholar]
- Li, J.; Qian, J.; Chen, J.; Ruiz-Garcia, L.; Dong, C.; Chen, Q.; Liu, Z.; Xiao, P.; Zhao, Z. Recent advances of machine learning in the geographical origin traceability of food and agro-products: A review. Compr. Rev. Food Sci. Food Saf. 2025, 24, e70082. [Google Scholar] [CrossRef]
- Beck, A.G.; Muhoberac, M.; Randolph, C.E.; Beveridge, C.H.; Wijewardhane, P.R.; Kenttamaa, H.I.; Chopra, G. Recent developments in machine learning for mass spectrometry. ACS Meas. Sci. Au 2024, 4, 233–246. [Google Scholar] [CrossRef]
- Chen, T.; Liang, W.; Zhang, X.; Wang, Y.; Lu, X.; Zhang, Y.; Zhang, Z.; You, L.; Liu, X.; Zhao, C. Screening and identification of unknown chemical contaminants in food based on liquid chromatography—High-resolution mass spectrometry and machine learning. Anal. Chim. Acta 2024, 1287, 342116. [Google Scholar] [CrossRef]
- Hansen, J.; Fransson, I.; Schrieck, R.; Kunert, C.; Seifert, S. Classification of Apples (Malus × domestica borkh.) According to Geographical Origin, Variety and Production Method Using Liquid Chromatography Mass Spectrometry and Random Forest. Foods 2025, 14, 2655. [Google Scholar] [CrossRef]
- Dossou, S.S.K.; Xu, F.; You, J.; Zhou, R.; Li, D.; Wang, L. Widely targeted metabolome profiling of different colored sesame (Sesamum indicum L.) seeds provides new insight into their antioxidant activities. Food Rev. Int. 2022, 151, 110850. [Google Scholar] [CrossRef]
- Zhang, Y.; Su, R.; Yuan, H.; Zhou, H.; Jiangfang, Y.; Liu, X.; Luo, J. Widely targeted volatilomics and metabolomics analysis reveal the metabolic composition and diversity of zingiberaceae plants. Metabolites 2023, 13, 700. [Google Scholar] [CrossRef]
- Zhou, J.; Fang, T.; Li, W.; Jiang, Z.; Zhou, T.; Zhang, L.; Yu, Y. Widely targeted metabolomics using UPLC-QTRAP-MS/MS reveals chemical changes during the processing of black tea from the cultivar Camellia sinensis (L.) O. Kuntze cv. Huangjinya. Food Rev. Int. 2022, 162, 112169. [Google Scholar] [CrossRef]
- Ishizaki, A.; Miura, A.; Kataoka, H. Determination of Luteolin and Apigenin in Herbal Teas by Online In-Tube Solid-Phase Microextraction Coupled with LC–MS/MS. Foods 2024, 13, 1687. [Google Scholar] [CrossRef]
- Shi, F.; Pan, H.; Lu, Y.; Ding, L. An HPLC–MS/MS method for the simultaneous determination of luteolin and its major metabolites in rat plasma and its application to a pharmacokinetic study. J. Sep. Sci. 2018, 41, 3830–3839. [Google Scholar] [CrossRef] [PubMed]
- Zhang, Q.-H.; Wang, W.-B.; Li, J.; Chang, Y.-X.; Wang, Y.-F.; Zhang, J.; Zhang, B.-L.; Gao, X.-M. Simultaneous determination of catechin, epicatechin and epicatechin gallate in rat plasma by LC–ESI-MS/MS for pharmacokinetic studies after oral administration of Cynomorium songaricum extract. J. Chromatogr. B 2012, 880, 168–171. [Google Scholar] [CrossRef] [PubMed]
- Baranowska, I.; Hejniak, J.; Magiera, S. LC-ESI-MS/MS method for the enantioseparation of six flavanones. Anal. Methods 2017, 9, 1018–1030. [Google Scholar] [CrossRef]
- Basu, S.; Patel, V.B.; Jana, S.; Patel, H. Liquid chromatography tandem mass spectrometry method (LC–MS/MS) for simultaneous determination of piperine, cinnamic acid and gallic acid in rat plasma using a polarity switch technique. Anal. Methods 2013, 5, 967–976. [Google Scholar] [CrossRef]
- Wang, L.; Halquist, M.S.; Sweet, D.H. Simultaneous determination of gallic acid and gentisic acid in organic anion transporter expressing cells by liquid chromatography–tandem mass spectrometry. J. Chromatogr. B 2013, 937, 91–96. [Google Scholar] [CrossRef]
- Zhao, Y.; Yu, Z.; Zhang, L.; Zhou, D.; Chen, X.; Bi, K. Simultaneous determination of homoeriodictyol-7-O-β-d-Glccopyranoside and its metabolite homoeriodictyol in rat tissues and urine by liquid chromatography–mass spectrometry. J. Pharm. Biomed. Anal. 2007, 44, 293–300. [Google Scholar] [CrossRef]
- Zhou, D.; Jin, Y.; Yao, F.; Duan, Z.; Wang, Q.; Liu, J. Validated LC-MS/MS method for the simultaneous determination of hyperoside and 2′′–O-galloylhyperin in rat plasma: Application to a pharmacokinetic study in rats. Biomed. Chromatogr. 2014, 28, 1057–1063. [Google Scholar] [CrossRef]
- Zhang, S.; Xie, Y.; Wang, J.; Geng, Y.; Zhou, Y.; Sun, C.; Wang, G. Development of an LC–MS/MS method for quantification of two pairs of isomeric flavonoid glycosides and other ones in rat plasma: Application to pharmacokinetic studies. Biomed. Chromatogr. 2017, 31, e3972. [Google Scholar] [CrossRef]
- Luo, Y.; Wu, S.; Li, X.; Li, P. LC-ESI-MS-MS determination of rat plasma protein binding of major flavonoids of Flos Lonicerae japonicae by centrifugal ultrafiltration. Chromatographia 2010, 72, 71–77. [Google Scholar] [CrossRef]
- Wang, Y.; Fan, Y.; Deng, Z.; Wu, W.; Liu, J.; Wang, H. Development of a LC-MS/MS Method for the Quantification of Myricitrin: Application to a Pharmacokinetic Study in Rats. Rev. Bras. Farmacogn. 2021, 31, 102–106. [Google Scholar] [CrossRef]
- Xu, D.; Zhang, G.-Q.; Zhang, T.-T.; Jin, B.; Ma, C. Pharmacokinetic comparisons of naringenin and naringenin-nicotinamide cocrystal in rats by LC-MS/MS. J. Anal. Methods Chem. 2020, 2020, 8364218. [Google Scholar] [CrossRef]
- Zeng, X.; Zheng, Y.; He, Y.; Peng, W.; Su, W. A rapid LC-MS/MS method for simultaneous determination of ten flavonoid metabolites of naringin in rat urine and its application to an excretion study. Foods 2022, 11, 316. [Google Scholar] [CrossRef] [PubMed]
- Li, W.; Zhou, H.; Chu, Y.; Wang, X.; Luo, R.; Yang, L.; Polachi, N.; Li, X.; Chen, M.; Huang, L. Simultaneous determination and pharmacokinetics of danshensu, protocatechuic aldehyde, 4-hydroxy-3-methyloxyphenyl lactic acid and protocatechuic acid in human plasma by LC–MS/MS after oral administration of compound danshen dripping pills. J. Pharm. Biomed. Anal. 2017, 145, 860–864. [Google Scholar] [CrossRef] [PubMed]
- He, J.; Feng, Y.; Ouyang, H.-Z.; Yu, B.; Chang, Y.-X.; Pan, G.-X.; Dong, G.-Y.; Wang, T.; Gao, X.-M. A sensitive LC–MS/MS method for simultaneous determination of six flavonoids in rat plasma: Application to a pharmacokinetic study of total flavonoids from mulberry leaves. J. Pharm. Biomed. Anal. 2013, 84, 189–195. [Google Scholar] [CrossRef] [PubMed]
- Sun, D.; Dong, L.; Guo, P.; Yan, W.; Wang, C.; Zhang, Z. Simultaneous determination of four flavonoids and one phenolic acid in rat plasma by LC–MS/MS and its application to a pharmacokinetic study after oral administration of the Herba desmodii Styracifolii extract. J. Chromatogr. B 2013, 932, 66–73. [Google Scholar] [CrossRef]
- Wang, X.; Xia, H.; Liu, Y.; Qiu, F.; Di, X. Simultaneous determination of three glucuronide conjugates of scutellarein in rat plasma by LC–MS/MS for pharmacokinetic study of breviscapine. J. Chromatogr. B 2014, 965, 79–84. [Google Scholar] [CrossRef]
- Suryawanshi, S.; Mehrotra, N.; Asthana, R.K.; Gupta, R.C. Liquid chromatography/tandem mass spectrometric study and analysis of xanthone and secoiridoid glycoside composition of Swertia chirata, a potent antidiabetic. Rapid Commun. Mass Spectrom. 2006, 20, 3761–3768. [Google Scholar] [CrossRef]
- Du, Y.; Li, C.; Xu, S.; Yang, J.; Wan, H.; He, Y. LC-MS/MS combined with blood-brain dual channel microdialysis for simultaneous determination of active components of astragali radix-safflower combination and neurotransmitters in rats with cerebral ischemia reperfusion injury: Application in pharmacokinetic and pharmacodynamic study. Phytomedicine 2022, 106, 154432. [Google Scholar]
- Szczesny, D.; Bartosińska, E.; Jacyna, J.; Patejko, M.; Siluk, D.; Kaliszan, R. Quantitative determination of trigonelline in mouse serum by means of hydrophilic interaction liquid chromatography–MS/MS analysis: Application to a pharmacokinetic study. Biomed. Chromatogr. 2018, 32, e4054. [Google Scholar] [CrossRef] [PubMed]
- Liang, Y.; Ma, T.; Li, Y.; Cai, N. A rapid and sensitive LC–MS/MS method for the determination of vanillic acid in rat plasma with application to pharmacokinetic study. Biomed. Chromatogr. 2022, 36, e5248. [Google Scholar] [CrossRef] [PubMed]
- Camont, L.; Collin, F.; Marchetti, C.; Jore, D.; Gardes-Albert, M.; Bonnefont-Rousselot, D. Liquid chromatographic/electrospray ionization mass spectrometric identification of the oxidation end-products of trans-resveratrol in aqueous solutions. Rapid Commun. Mass Spectrom. 2010, 24, 634–642. [Google Scholar] [CrossRef] [PubMed]
- Betz, J.M.; Brown, P.N.; Roman, M.C. Accuracy, precision, and reliability of chemical measurements in natural products research. Fitoterapia 2011, 82, 44–52. [Google Scholar] [CrossRef]
- Kwon, E.-Y.; Choi, M.-S. Dietary eriodictyol alleviates adiposity, hepatic steatosis, insulin resistance, and inflammation in diet-induced obese mice. Int. J. Mol. Sci. 2019, 20, 1227. [Google Scholar] [CrossRef]
- Lin, S.-X.; Li, X.-Y.; Chen, Q.-C.; Ni, Q.; Cai, W.-F.; Jiang, C.-P.; Yi, Y.-K.; Liu, L.; Liu, Q.; Shen, C.-Y. Eriodictyol regulates white adipose tissue browning and hepatic lipid metabolism in high fat diet-induced obesity mice via activating AMPK/SIRT1 pathway. J. Ethnopharmacol. 2025, 337, 118761. [Google Scholar] [CrossRef]
- Ashokkumar, N.; Vinothiya, K. Protective impact of vanillic acid on lipid profile and lipid metabolic enzymes in diabetic hypertensive rat model generated by a high-fat diet. Curr. Drug Discovery Technol. 2023, 20, 66–73. [Google Scholar] [CrossRef]
- Ding, H.; Liu, J.; Chen, Z.; Huang, S.; Yan, C.; Kwek, E.; He, Z.; Zhu, H.; Chen, Z.-Y. Protocatechuic acid alleviates TMAO-aggravated atherosclerosis via mitigating inflammation, regulating lipid metabolism, and reshaping gut microbiota. Food Funct. 2024, 15, 881–893. [Google Scholar] [CrossRef]
- Wang, D.; Wei, X.; Yan, X.; Jin, T.; Ling, W. Protocatechuic acid, a metabolite of anthocyanins, inhibits monocyte adhesion and reduces atherosclerosis in apolipoprotein E-deficient mice. J. Agric. Food. Chem. 2010, 58, 12722–12728. [Google Scholar] [CrossRef]
- Chen, T.; Wang, Y.; Yang, J.-L.; Ni, J.; You, K.; Li, X.; Song, Y.; Wang, X.; Li, J.; Shen, X. Gentisic acid prevents the development of atherosclerotic lesions by inhibiting SNX10-mediated stabilization of LRP6. Pharmacol. Res. 2024, 210, 107516. [Google Scholar] [CrossRef]
- Assini, J.M.; Mulvihill, E.E.; Sutherland, B.G.; Telford, D.E.; Sawyez, C.G.; Felder, S.L.; Chhoker, S.; Edwards, J.Y.; Gros, R.; Huff, M.W. Naringenin prevents cholesterol-induced systemic inflammation, metabolic dysregulation, and atherosclerosis in Ldlr−/− mice. J. Lipid Res. 2013, 54, 711–724. [Google Scholar] [CrossRef]
- Wang, J.; Wu, R.; Hua, Y.; Ling, S.; Xu, X. Naringenin ameliorates vascular senescence and atherosclerosis involving SIRT1 activation. J. Pharm. Pharmacol. 2023, 75, 1021–1033. [Google Scholar] [CrossRef]
- Ye, W.; Yan, T.; Zhang, C.; Duan, L.; Chen, W.; Song, H.; Zhang, Y.; Xu, W.; Gao, P. Detection of pesticide residue level in grape using hyperspectral imaging with machine learning. Foods 2022, 11, 1609. [Google Scholar] [CrossRef] [PubMed]
- Han, H.; Hu, M.; Wang, Z.; Sha, R.; Huang, J.; Mao, J.; Cui, Y. Metabolomics Combined with Machine Learning for Geographical Origin Tracing of Garlic. Sci. Technol. Food Ind. 2024, 45, 1–8. [Google Scholar]
- Lebanov, L.; Tedone, L.; Ghiasvand, A.; Paull, B. Random Forests machine learning applied to gas chromatography—Mass spectrometry derived average mass spectrum data sets for classification and characterisation of essential oils. Talanta 2020, 208, 120471. [Google Scholar] [CrossRef] [PubMed]
- Nie, W.; Alimujiang, S.; Zhang, Y.; Zhang, S.; Li, W. A Multi-omics approach combining GC-MS, LC-MS, and FT-NIR with chemometrics and machine learning for metabolites systematic profiling and geographical origin tracing of Artemisia argyi Folium. J. Chromatogr. A 2025, 1757, 466138. [Google Scholar] [CrossRef]
- Chen, G.; Zhang, H.; Jiang, J.; Chen, S.; Zhang, H.; Zhang, G.; Zheng, C.; Xu, H. Metabolomics approach to growth-age discrimination in mountain-cultivated ginseng (Panax ginseng CA Meyer) using ultra-high-performance liquid chromatography coupled with quadrupole-time-of-flight mass spectrometry. J. Sep. Sci. 2023, 46, 2300445. [Google Scholar] [CrossRef]
- Chahal, S.; Tian, L.; Bilamjian, S.; Balogh, F.; De Leoz, L.; Anumol, T.; Cuthbertson, D.; Bayen, S. Robust Multiclass Feature Selection for the Authentication of Honey Botanical Origin via Nontargeted LC-MS Analysis. Anal. Chem. 2025, 97, 12521–12530. [Google Scholar] [CrossRef]
Disclaimer/Publisher’s Note: The statements, opinions and data contained in all publications are solely those of the individual author(s) and contributor(s) and not of MDPI and/or the editor(s). MDPI and/or the editor(s) disclaim responsibility for any injury to people or property resulting from any ideas, methods, instructions or products referred to in the content. |
© 2025 by the authors. Licensee MDPI, Basel, Switzerland. This article is an open access article distributed under the terms and conditions of the Creative Commons Attribution (CC BY) license (https://creativecommons.org/licenses/by/4.0/).