Article

DNA Barcoding for Tracing Biodiversity in Mixed Crop Food Products: A Proof of Concept Within the BioValue Project

by
Maria-Dimitra Tsolakidou
1,
Nikolaos Nikoloudakis
1,*,
Cyril Tisseyre
2,
Marija Knez
3,4,
Eleonora Barilli
5,
Konstadinos Mattas
6 and
Andreas Katsiotis
1,*
1
Department of Agricultural Sciences, Biotechnology and Food Science, Cyprus University of Technology, 3603 Limassol, Cyprus
2
ECOZEPT France SAS, Le Barcelone, Bât. 12, 145 Rue Guillaume Janvier, FR-34070 Montpellier, France
3
Capacity Development in Nutrition, 11000 Belgrade, Serbia
4
Center of Research Excellence in Nutrition and Metabolism, Group for Nutrition and Metabolism, Institute for Medical Research, National Institute of Republic of Serbia, University of Belgrade, 11000 Belgrade, Serbia
5
Solintagro SL, Calle Escritora Rosa Chacel 4 Local 2, 14004 Cordoba, Spain
6
Department of Agricultural Economics, Aristotle University of Thessaloniki, 54124 Thessaloniki, Greece
*
Authors to whom correspondence should be addressed.
Foods 2025, 14(18), 3256; https://doi.org/10.3390/foods14183256
Submission received: 21 August 2025 / Revised: 12 September 2025 / Accepted: 17 September 2025 / Published: 19 September 2025

Abstract

In a world of rapidly globalizing food markets, biodiversity, authenticity, and the safety of food products have become a universal concern. DNA barcoding is a widely used molecular-based method that can identify biological material and is used for the traceability of both raw materials and ingredients in processed food. In the present study, contacted within the framework of the BioValue Horizon Project, which promotes the role of agrobiodiversity in sustainable food systems, DNA barcoding using the ITS and rbcL markers was employed as a proof-of-concept approach to reveal the biodiversity and authenticity of ten commercial plant-based products. Following successful DNA amplification and sequencing using six products as a proof-of-concept, a diverse range of plant genera and species were identified, verifying biodiversity. A strong correlation between ITS and rbcL-based markers was demonstrated, supporting their combined use for reliable species-level biodiversity assessment. Finally, heat map analysis of label contents and sequencing-based genera identification confirmed high concordance between label claims and sequencing results in most cases, though undeclared species and absent labeled taxa were also detected, highlighting potential mislabeling or cross-contamination.

Graphical Abstract

1. Introduction

The food supply chain is widely recognized as a multidisciplinary and complex sector that integrates various elements across multiple levels and stakeholders, and its sustainability and biodiversity are central themes of current research initiatives such as the BioValue Horizon Project (https://www.biovalue-project.eu/, accessed on 17 September 2025). Throughout the different stages of production, there are critical checkpoints that are vital for ensuring product quality. Farm (and Fork) biodiversity in particular is increasingly seen as a key indicator of eco-friendly farming practices, significantly affecting the final product. Biodiversity is the full spectrum of taxa diversity at genetic, species, and ecosystem levels that sustains and enriches food production systems and diets, making it foundational to global food security, nutrition, sustainability, and ecosystem health [1,2]. Food biodiversity includes domesticated plants and animals, wild relatives of domesticated species, wild species harvested for food and other products, and a vast range of organisms that live in and around food and agricultural production systems, sustaining them and contributing to their output [1].
Over the past few years, it has been clearly demonstrated that biodiversity is essential for sustaining food systems, ensuring that they provide nutritious food with minimal negative impacts on the environment, and promoting human well-being [3,4]. However, the genetic diversity in crops and animals, which ensures the production of sufficient and nutritious food and the resilience of agroecosystems against different environmental stresses, is rapidly declining due to climate change, monoculture (as the outcome of green revolution), and the uncontrollable agricultural expansion [5,6,7]. Biodiversity loss could undermine the resilience of food systems and the stability of food production, leading to negative effects for food security [8].
The ongoing global pressure to meet rising food demand has contributed to biodiversity loss worldwide, which has been accelerating in recent decades due to the reliance on conventional food systems [9,10]. This creates a paradox scheme in which biodiversity is essential for sustaining food systems, yet at the same time, conventional food systems are one of the most important threats to biodiversity [9]. According to FAO, 75% of plant genetic diversity has been lost and two-thirds of global plant-derived food is provided by only three major crops—maize (Zea mays), wheat (Triticum aestivum), and rice (Oryza sativa) [1,11]. Moreover, the constantly increasing demand and consumption of processed and ultra-processed food products manufactured with ingredients derived from these few high-yielding plant crops has a negative impact on biodiversity, and their contribution to plant biodiversity is often unclear or underreported [12,13].
Given these circumstances, food labeling may not always reflect the true botanical composition of a product, particularly when ingredients are processed into forms that obscure morphological identification [14,15]. To ensure transparency and traceability for customers, regulators, and researchers aiming to promote plant and food biodiversity, reliable identification systems are necessary to guarantee adequate authenticity checkpoints throughout the entire supply chain and distribution networks. Accurate identification of genera, species, and the varieties used is essential not only to retrieve information on their origin but also to authenticate the raw materials and related processed products distributed both at the local and global scale [16].
DNA barcoding is a molecular scheme that has been used in recent years to identify wild and cultivated plant species and has served as an indicator of biological diversity [17,18]. This method relies on identifying species using specific regions of their DNA and over the last decade has emerged as a key tool in food authentication, mislabeling, food fraud, allergens detection, and biodiversity assessment [14,16,19,20]. Although DNA barcoding involves laboratory procedures and expert analysis, the use of open-access databases and decreasing sequencing costs make this approach increasingly feasible for the food industry, particularly for verifying authenticity and traceability of high-value or complex products. DNA barcoding is particularly useful for identifying plant species in food products, especially when the physical or morphological characteristics of the ingredients are altered during processing, allowing the detection and verification of the plant species used, even in complex or highly processed products [21]. In plants, among the most commonly used regions for barcoding are the chloroplastic ribulose-bisphosphate carboxylase (RuBisCo) enzyme (rbcL), and the nuclear internal transcribed spacer (ITS), as their combination offers precise species-level identification [15]. rbcL gene is highly conserved across plant species, making it ideal for broad taxonomic identification whereas ITS genes offer high variability enabling species identification [22,23].
In this context, the scope of the present study was to develop a proof-of-concept scheme, using DNA barcoding, for identifying different taxa within plant-based food products and assess the contribution of biodiversity in the biological value (BioValue) of these products. The term BioValue in this work comes from the acronym of the BioValue Horizon project (https://www.biovalue-project.eu/, accessed on 17 September 2025). BioValue is a research initiative that aims to emphasize the role of agrobiodiversity in strengthening sustainable food systems, the agro-food value chain, the environment, and consumer preferences and health. Within this framework, besides composition reflecting food biodiversity, products were also selected based on the degree of processing to assess the combined effect on DNA-based identification and traceability. A range of products, including legumes, seeds, vegetable mixes, pasta, and tomato-based products, were selected, as they represent both biodiversity-rich foods and different processing levels (dried, frozen, canned, and thermally processed), thereby ensuring that the study evaluated DNA barcoding performance under realistic market conditions. The main DNA extraction methods were evaluated, and ITS/rbcL gene regions were amplified across six selected plant-based food products. Amplicons were sequenced and compared against databases to assess the degree of biodiversity in each product.

2. Materials and Methods

2.1. Plant-Based Food Products

For the assessment of biodiversity, a comprehensive screening was conducted on a wide assortment of plant-based commercial food products (aligned with BIOVALUE) with diverse ingredient composition and processing methods. The selected commodities that varied in salt and sugar contents, additives, and thermal processing techniques are shown in Table 1. All products were purchased from commercial food markets. Dried legumes, seed mixtures, and pasta products were homogenized with a grinder and stored at −20 °C, while the frozen blend and the canned mix of legumes and vegetables were homogenized with a mortar and pestle in the presence of liquid nitrogen and then stored in a deep freezer. Tomato-based products were also homogenized using a mortar and pestle and stored at −20 °C. In all cases, the entire package content was used to ensure representativeness. From each homogenized sample, 10–30 mg of dried products and100–200 mg of frozen, canned, or raw products were used for DNA extraction.

2.2. DNA Extraction

To identify the most effective DNA extraction method, three techniques were employed, considering that thermal processing and additives can impact DNA integrity and isolation. Two commercial silica column-based kits, as well as a CTAB-based protocol [24], were evaluated. To mitigate the interference of phenolic compounds, which can inhibit DNA isolation, all samples were pre-washed with Sorbitol Washing Buffer twice before extraction as previously reported [25]. For the two commercial kits used, the manufacturers’ protocols were followed. The CTAB-based method was performed with slight modifications. One hundred mg of tissue per sample was homogenized with 1 mL of CTAB buffer and incubated at 65 °C for 20 min with agitation at 600 rpm in a thermo-mixer (HCM100-PRO, DLAB Scientific Co., Ltd., Beijing, China). Subsequently, 5 µL of RNase (10 mg/mL) was added, and the mixture was incubated at room temperature for 15 min to remove RNA traces. Then, 700 µL of phenol-chloroform-isoamyl alcohol (25:24:1) was added, and the solution was vortexed vigorously. The mixture was centrifuged at 10,000 rpm for 15 min at 4 °C, and the upper aqueous phase was collected. To further purify the DNA, an additional step was introduced. Half volume of 5 M NaCl was added to the sample, mixed gently by inversion, followed by the addition of 3 volumes of cold 95% ethanol [26]. The mixture was then placed in a −20 °C freezer and incubated for 1 h to precipitate the DNA. After incubation and centrifugation (15 min at 4 °C), the liquid was discarded, and the DNA pellet was washed with 70% ethanol. Finally, the dried pellet was dissolved in 20–30 µL of deionized water (ddH2O). The quality and quantity of the extracted DNA samples were evaluated using a Nano Drop 2000 spectrophotometer (Thermo Scientific, Waltham, MA, USA).

2.3. PCR Amplification

To identify the presence of the different taxa within the tested products, PCR amplification was employed to construct DNA libraries. For accurate sequencing results, amplification targeted two distinct DNA regions: the Internal Transcribed Spacers (ITS1 and ITS2) of the ribosomal DNA (rDNA) gene, and the chloroplastic gene rbcL, which facilitates the refinement of phylogenies among seed plants. For both amplified regions, universal interspecies primers were used (forward primer 18S: 5′-ACG-AAT-TCA-TGG-TCC-GGT-GAA-GTG-TTC-G-3′, reverse primer 26S: 5′-TAG-AAT-TCC-CCG-GTT-CGC-TCG-CCG-TTA-C-3′, rbcL-1F: 5′-TG-TCA-CCA-CAA-ACA-GAA-AC-3′, and rbcL-724R: 5′-TCG-CAT-GTA-CCT-GCA-GTA-GC-3′) as previously reported [27,28,29,30,31,32]. PCR amplification was carried out using KAPA DNA polymerase (KAPA Biosystems) with 20 ng of template DNA per reaction. Reaction mixtures were prepared following the manufacturer’s instructions, with a final primer concentration of 0.8 μM. The PCR conditions were set as follows: an initial denaturation at 94 °C for 5 min was performed to ensure complete disassociation of DNA. This was followed by 44 cycles of denaturation at 94 °C for 40 s, annealing at 55 °C for 40 s, and extension at 72 °C for 40 s. A final extension step was conducted at 72 °C for 60 s to complete the amplification process.

2.4. Long-Read Nanopore Sequencing of ITS and rbcL rRNA Regions

Next Generation Sequencing (NGS) was performed using a standard protocol as provided by BioISI Genomics (Lisbon, Portugal). Amplification products were purified using the Solid Phase Reversible Immobilization (SPRI) technique with magnetic beads [33]. PCR product purity was assessed by absorbance at 260 nm using a NanoDrop 1000 Spectrophotometer (Thermo Fischer Scientific, Waltham, MA, USA), and the concentration by Qubit™ 4 Fluorometer (Thermo Fischer Scientific, Waltham, MA, USA). The library was prepared from 200 fmol input DNA from each sample using the Sequencing Native Barcoding Kit V14 (SQK-NBD114.96) (Oxford Nanopore Technologies, Oxford, UK) in accordance with the manufacturer’s protocol. Sequencing runs were performed using R10.4.1 flow cells on a PromethION sequencing platform, and sequencing data were acquired in real time using MinKNOW 24.02.10 software.

2.5. Bioinformatic Analysis

Sequencing data were derived from ITS and rbcL amplicons, with the exclusion of low-quality reads. The remaining reads underwent size selection, retaining those with lengths between 800 bps and 1200 bps, accomplished through prinseq-lite [34]. Taxonomic classification employed a Lowest Common Ancestor approach, utilizing an index based on k-mers that map to the lowest common ancestor of all genomes known to encompass a specific k-mer [35]. Genera and species plots were generated by microbiome R package (version 1.30.0).

2.6. Statistical Analysis

Statistical analysis was performed using IBM SPSS Statistics 25 software. ITS and rbcL-based sequencing data were subjected to Pearson correlation analysis. The Pearson correlation coefficient (r) and associated p-value were calculated to assess the strength and statistical significance of the correlation.

3. Results and Discussion

3.1. DNA Extraction and PCR Performance Are Affected by Food Processing and Additives

The products included in the present study were selected to reflect a broad range of plant-based ingredients, promoting biodiversity, and different processing levels. Different DNA extraction methods were performed to determine the most effective protocol tailor-made for various commodities. Among the methods tested, the modified CTAB-based protocol provided the highest quality and higher levels of DNA quantity, particularly for products with higher thermal processing and complex additive composition as proven previously [36,37,38,39]. This was further confirmed by Nanodrop readings, where the CTAB method consistently yielded better A260/A280 and A260/A230 ratios, indicating higher purity and concentration of the extracted DNA (Supplementary Table S1). In particular, all ten products demonstrated higher DNA yields, and the 260/230 ratio was profoundly higher compared to the results obtained using silica column-based DNA extraction, revealed by Nanodrop. However, it was evident that products subjected to excessive thermal processing (e.g., Product 5: lentil pasta) or contained additives (e.g., Products 7, 8, 10: canned and dried tomatoes) still presented challenges for DNA extraction even with the CTAB method, which had otherwise produced better results.
Based on these results, it was demonstrated that products with high concentrations of phenolic compounds, salts, sugars, and additives such as canned tomatoes, legumes, and vegetables along with those subjected to excessive thermal processing, like pasta or pre-cooked meals, presented significant restrictions for both DNA isolation and PCR amplification (Supplementary Figure S1) [40]. These components act as potential inhibitors, complicating the extraction and amplification processes. This is one of the major limitations of DNA barcoding, as high-heat cooking, chemical treatments, or long-term storage results in DNA degradation and reduces the ability of DNA barcoding to recover intact sequences for analysis [41]. According to Lorusso and colleagues, this limitation means that DNA barcoding may not always provide accurate results for highly processed foods, when the DNA quality is compromised [42]. As a result, products 1–6 (Table 1) that demonstrated high DNA quality and successful PCR amplification of both the ITS and rbcL genes were selected for further sequencing analysis. The six selected products contained legumes, vegetable and seed mixtures and processed products (lentil, wheat pasta, and ready frozen meals). No canned products were included as they did not give any DNA of acceptable integrity, or PCR amplification was inhibited.

3.2. DNA Barcoding Using ITS and rbcL Genes Reveals Consistently Diverse Taxonomic Composition in Commercial Plant-Based Products

Following the successful PCR amplification of the ITS and rbcL genes from the six selected products, the samples were subjected to sequencing analysis. The genera composition plot of all samples revealed a diverse taxonomic composition, with the 10 most abundant genera prominently displayed in Figure 1A. These included Lens, Cicer, Phaseolus, Pisum, Triticum, Lathyrus, Vigna, Chenopodium, and Cucurbita. Among the species identified, Lens culinaris (lentil), Phaseolus vulgaris (common bean), Pisum sativum (pea), Triticum aestivum (wheat), Vigna angularis (adzuki bean), Vigna radiata (mung bean), Vigna unguiculata (cowpea), and Zea mays (corn) were the most abundant (Figure 1B). The remaining genera and species in lower abundance were grouped into the ‘Other’ category, while the ‘Unknown’ category reflects reads whose taxonomy ID corresponds to a higher taxonomic group, making precise genus and species identification uncertain. Species discrimination in plants is more difficult than in animals due to greater levels of gene tree paraphyly, as well as a lesser amount of deposited data [43]. In animals, the most common marker for DNA barcoding is the cytochrome c oxidase 1 (CO1) gene derived from the mitochondrial genome; however, in plants, a similar generic barcode is lacking due to its slow evolution and limited divergence [44,45,46]. Over the past years, several individual regions such as matK, rbcL, trnH-psbA, ITS, trnL-F, 5S-rRNA, and 18S-rRNA genes have been evaluated as individual candidates for their discriminatory properties in plant species identification [14]. A very common combination that has been broadly used are the rbcL and ΜatK regions as the rbcL gene is highly conserved, making it ideal for broad taxonomic identification. while MatK, can often provide extended variability [18,22,23,47,48]; however, it is underrepresented in GenBank libraries. Nonetheless, in closely related species, the discriminating ability of these two markers can be less informative [49,50]. Therefore, the addition of nuclear ITS (Internal Transcribed Spacers) region in combination to either the matK or the rbcL sequences, has been suggested as plant barcode in order to achieve maximum identification rates even in closely related species [14,15,51]. In the present study, the rbcL and ITS regions were selected to represent markers from both the chloroplast and nuclear genomes, ensuring that potential challenges in DNA extraction would not compromise the results. Based on data, shown in Figure 1, the rbcL and ITS markers were able to discriminate the genera’s contribution in biodiversity to a great extent; however, at the species level, a significant portion remained unresolved.
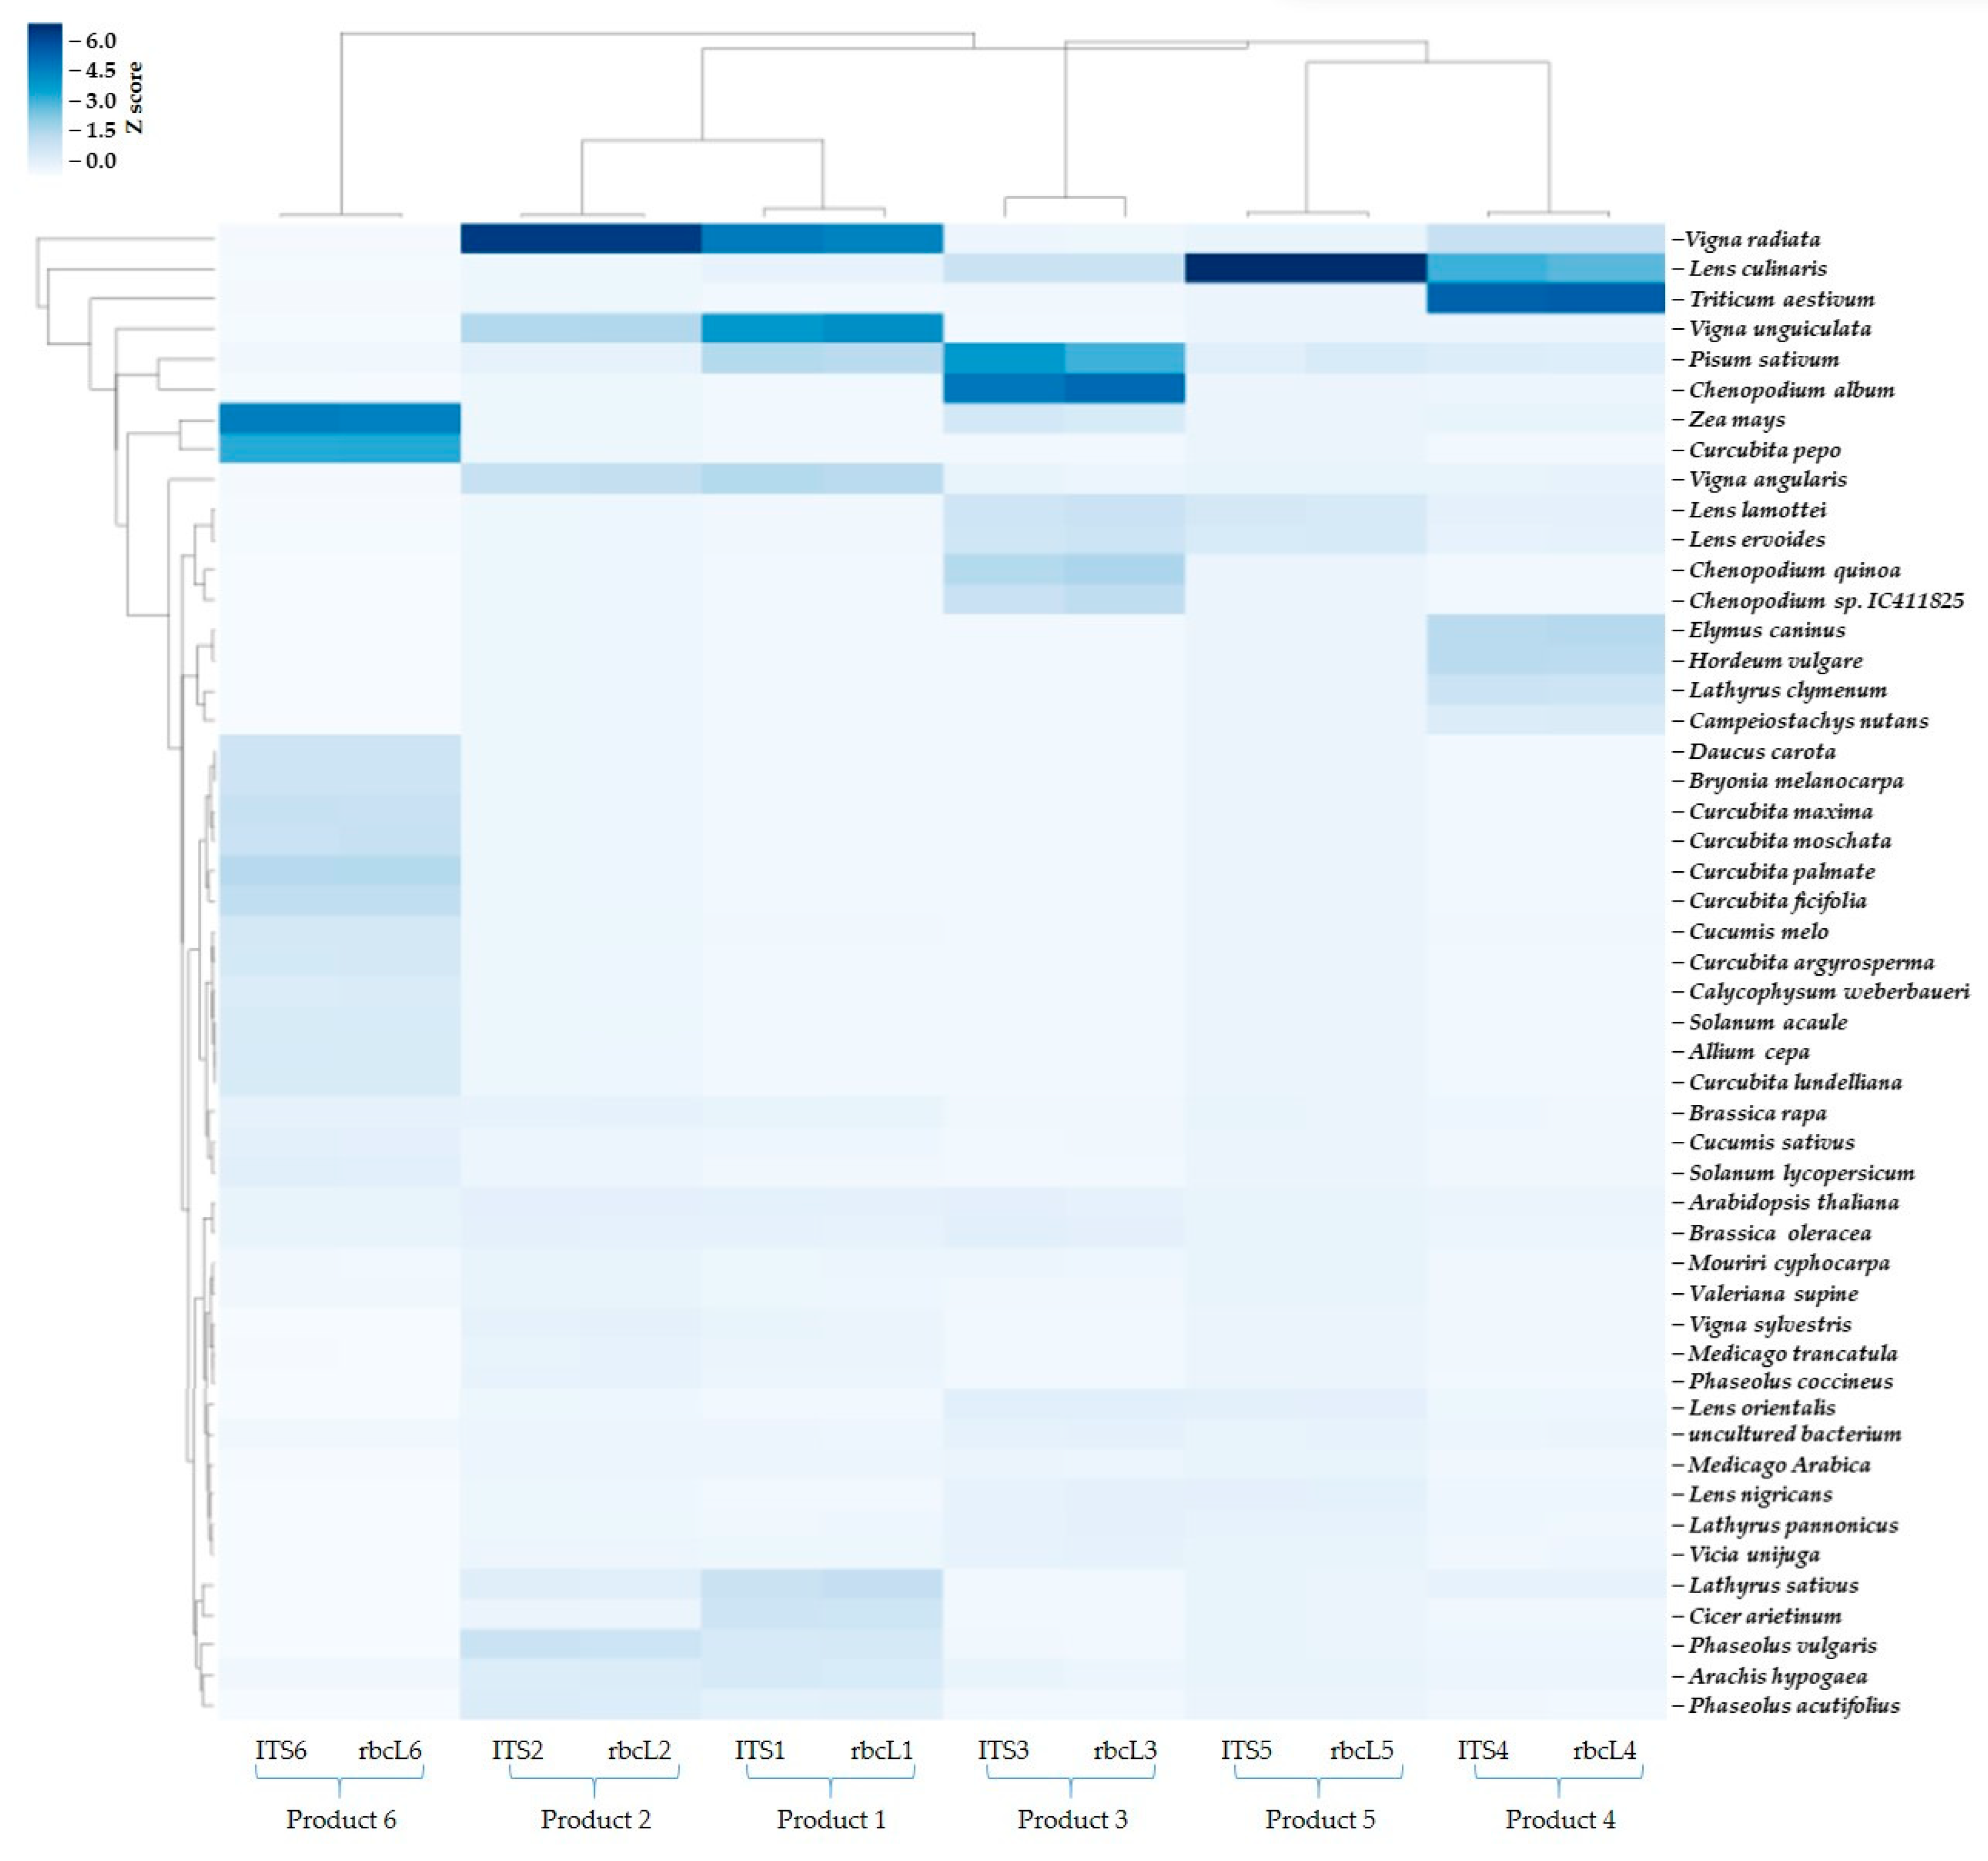
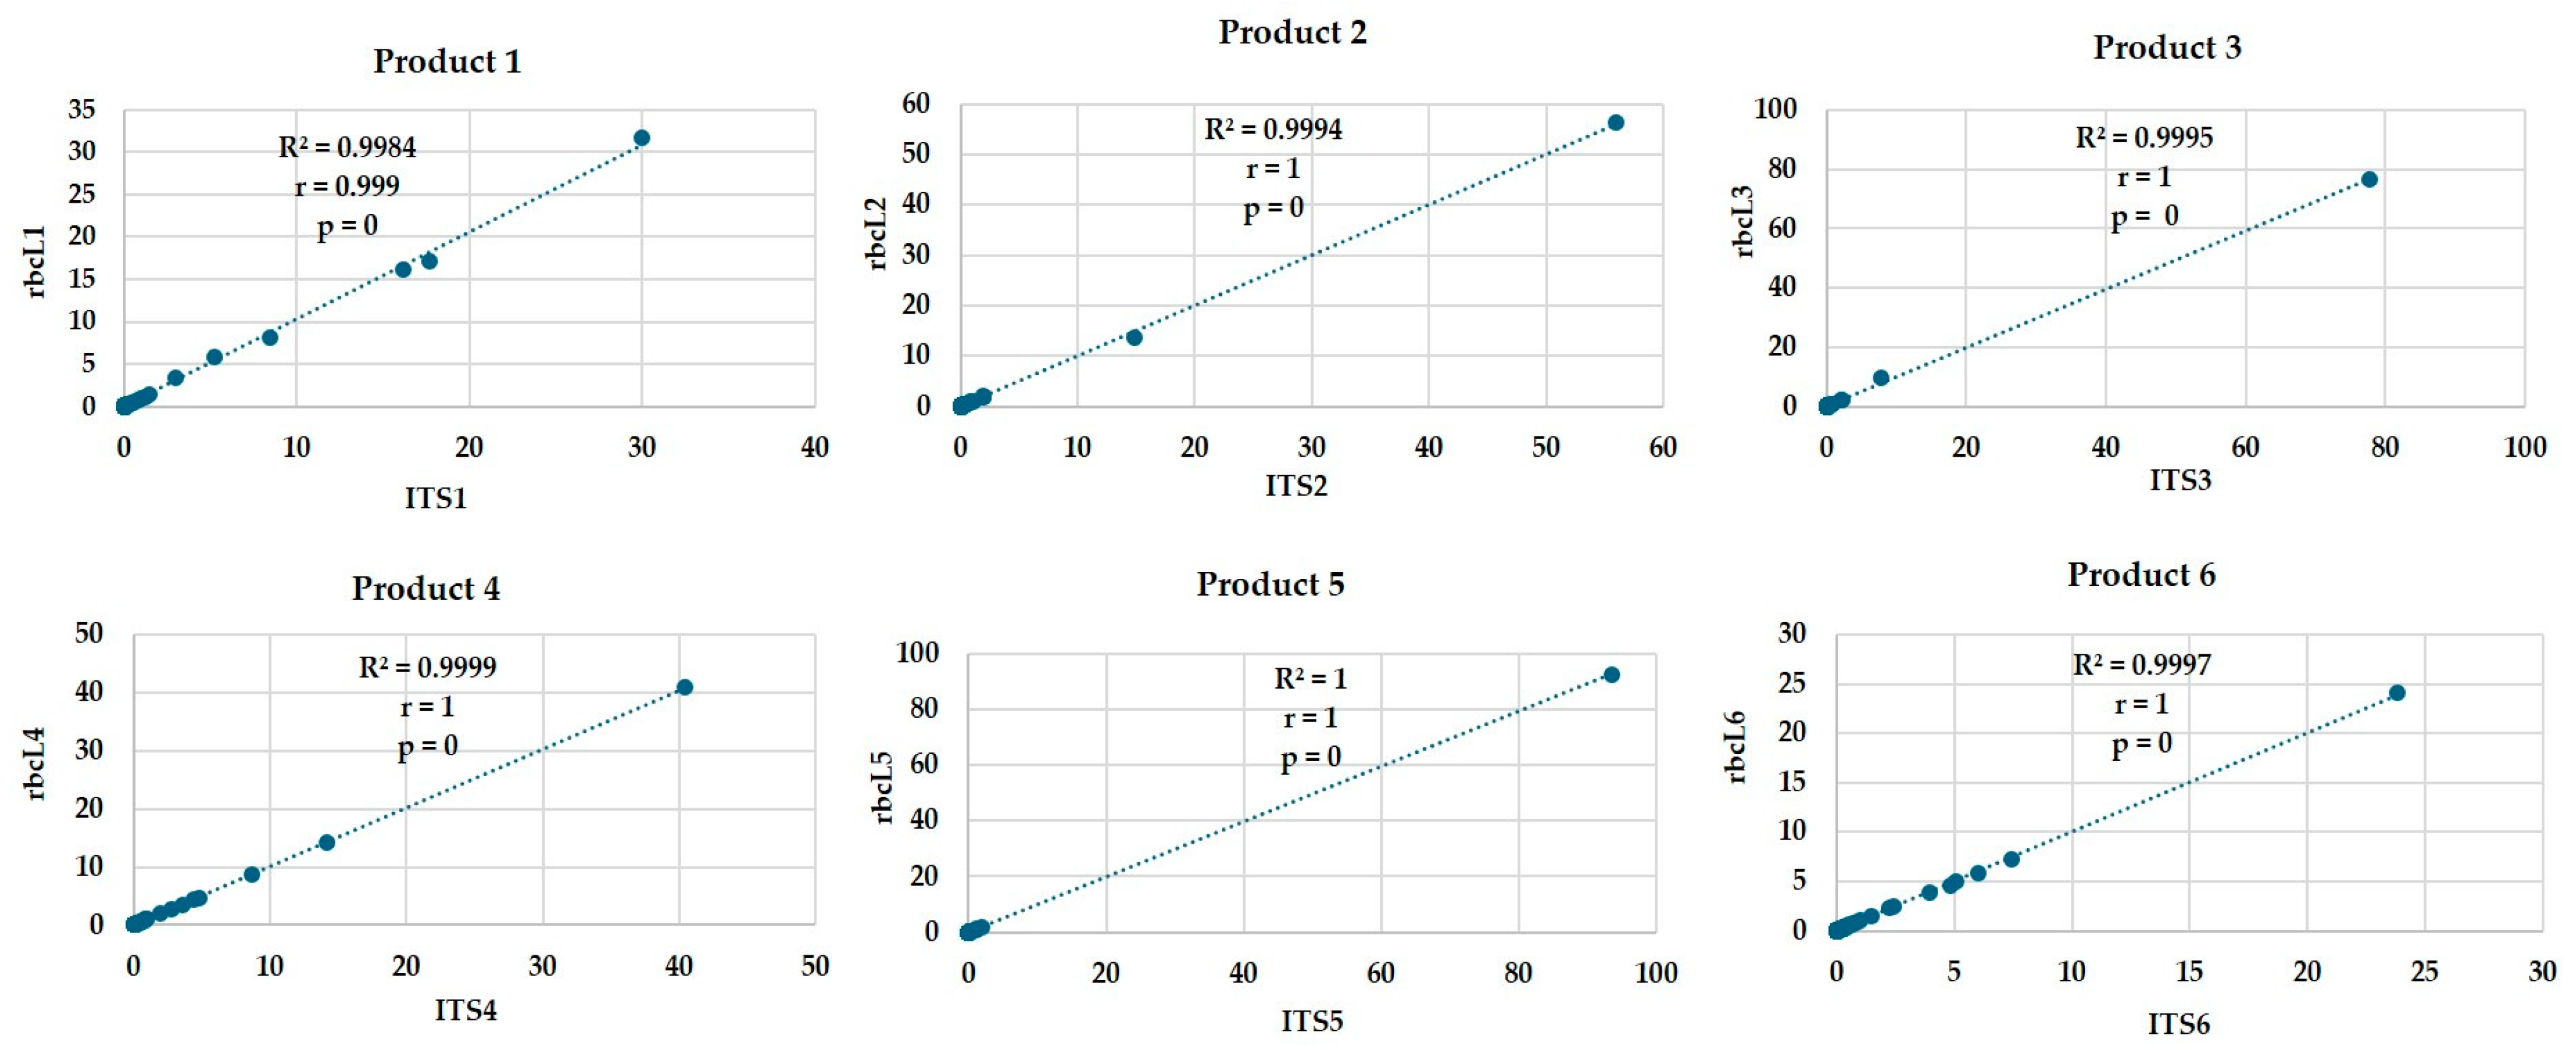
The sequencing data were also used to demonstrate the highest read count operational taxonomic units (OTUs) and illustrate their distribution across the samples. The OTUs heat map revealed significant variation among the products, underscoring the diversity in plant species present across the samples. A total of 50 OTUs with the highest sum of read counts in all six samples for the two different genes sequenced are depicted in Figure 2. Among the OTUs shown, Vigna radiata, Lens culinaris, Vigna unguiculata, Pisum sativum, Zea mays, Chenopodium quinoa, several Curcubita species, Phaseolus, Lathyrus clymenum, and Hordeum vulgare demonstrated higher Z-score (intense blue color), indicating a higher relative abundance or read counts of a particular OTU in the sample compared to others. At the same time species such as Daucus carota, Solanum lycopersicum, Allium cepa, Brassica rapa and B. oleracea, and Cicer arietinum were detected in all products but with lower Z score. This highlights the sensitivity of the sequencing method, as it was able to detect and identify not only dominant species but also those present in traces such as Arachis hypogea, the common peanut, which is often present in small quantities in various products. The ability to sequence and analyze even species with low percentage in the samples demonstrates the sensitivity of the technique, making it an invaluable tool for comprehensive biodiversity assessments, provided that a GenBank library is available. This variation also validates the effectiveness of the ITS and rbcL genes for identifying the contribution of different plant taxa. It was also noted (Figure 2) that the OTUs for each gene were quite similar, demonstrating consistency in the taxonomic identification provided by these markers. This congruence further supports the reliability of the methods used in capturing and analyzing the biodiversity within the tested products. The consistency of the taxonomic composition identified by the two markers was further confirmed through Pearson correlation analysis, which yielded r values close to 1 and p values of 0, validating a strong and statistically significant correlation (Figure 3). This indicates that both markers produced highly similar read distributions, validating their combined use for reliable genus-level biodiversity assessment.
However, among the different species identified that were in accordance with the products ingredients, some unexpected species were also identified such as Medicago truncatula, Sesbania bispinosa or even some uncultured bacteria sequences. The detection of such species could be attributed to various factors such as potential contamination of the products during production or cross contact during processing but could also indicate the lack of reference sequences in reference databases. While some taxonomic groups are well represented in such databases, many others remain under-characterized, limiting accurate identification [16]. Furthermore, DNA barcoding of herbal or multi-species food products presents particular challenges, often due to variable PCR efficiency caused by degraded DNA, differing gene copy numbers, or PCR amplification bias [43]. The identification of the species Abrus precatorius and Sesbania bispinosa in the present study, both members of the Fabaceae family, like many legumes, could illustrate some of the DNA barcoding limitations, at least with the markers and/or the taxonomic family used. While Sesbania bispinosa is a widespread weed, Abrus precatorius is a herbaceaous flowering plant known for its toxic seeds. Therefore, it is highly likely that the identification of this species is misleading, as it does not probably represent a true ingredient. Similar findings need to be further analyzed using additional DNA barcoding markers or alternative combinations that will validate their accuracy and rule out potential false positives.

3.3. Comparison of Label Composition and Sequencing-Based Genera Identification

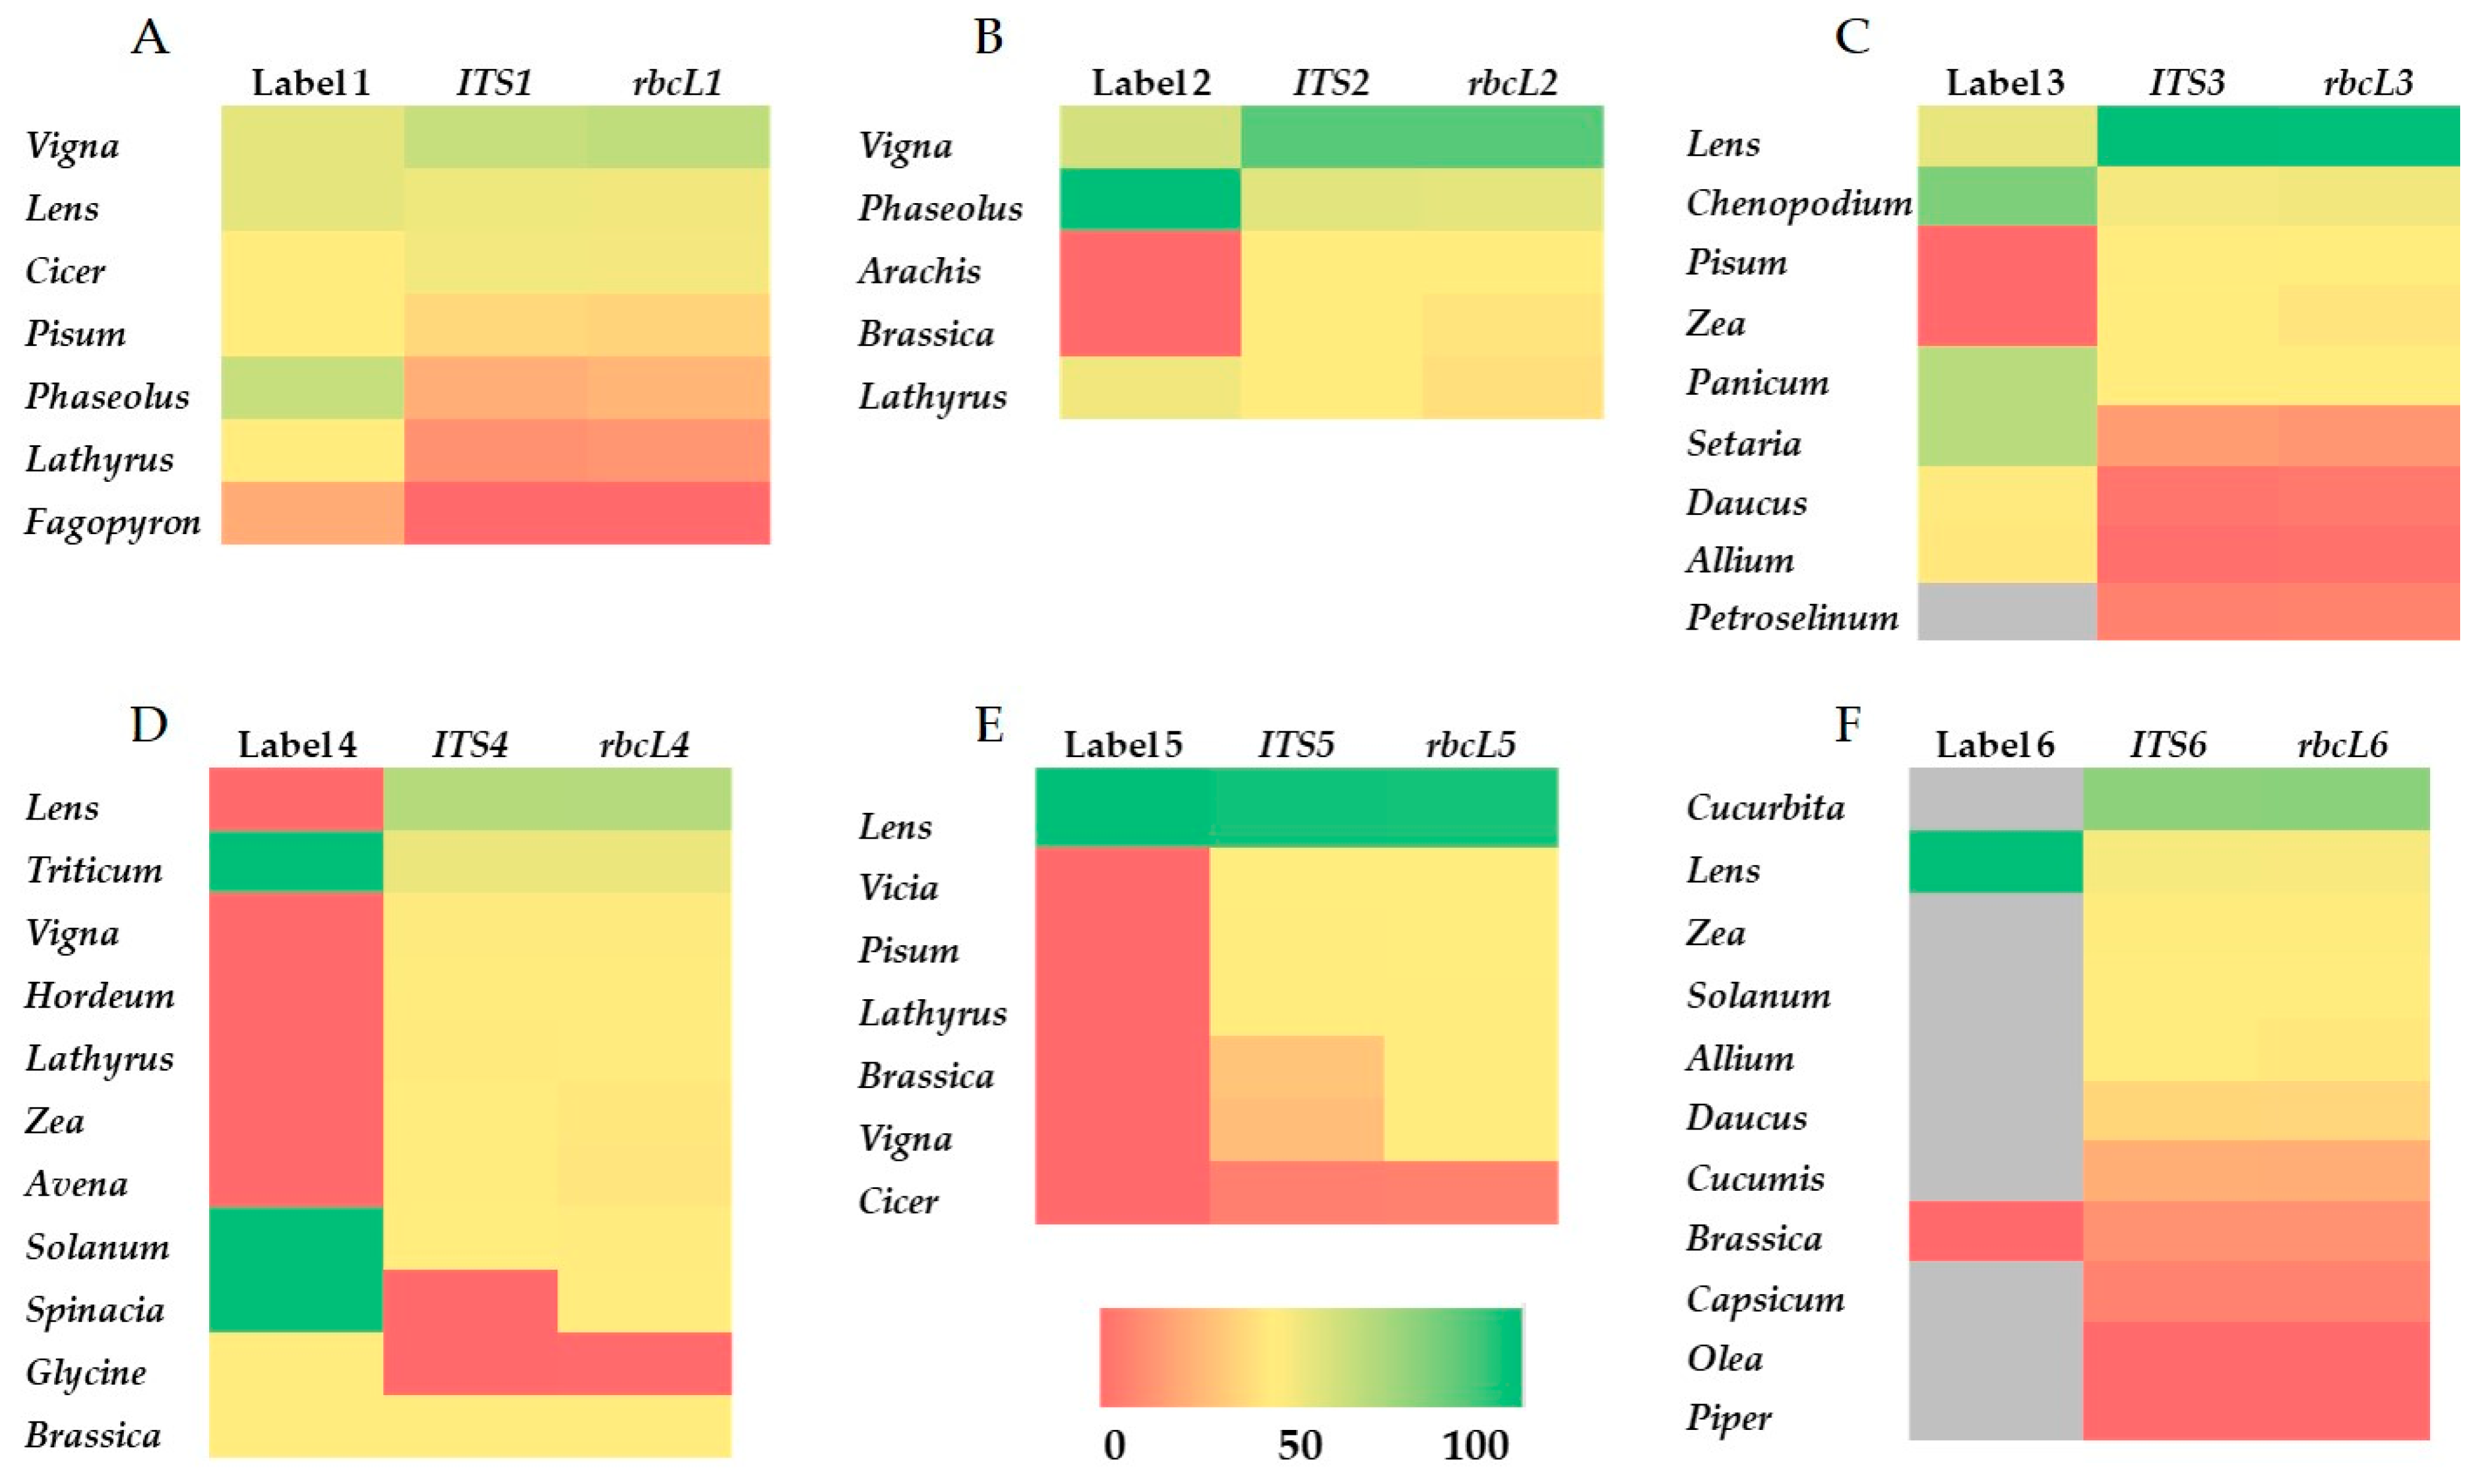
Beyond biodiversity assessment, DNA barcoding can serve as a powerful tool in food traceability and authentication, providing reliable identification of species. To evaluate the accuracy and limitations of DNA barcoding in reflecting actual ingredient composition, we compared the declared label content of all six products with the taxonomic profiles obtained through ITS and rbcL-based sequencing. For each product, a heat map was generated to compare the declared ingredients percentage by weight (% w/w) in each label with the corresponding percentage of the ITS and rbcL read abundances (Figure 4). Only species listed on the product label or species showing high abundance were included in the heat map, allowing us to focus specifically on the accuracy of ingredient representation and to detect any potential mislabeling. The molecular data strongly supported the ingredient composition with minor exceptions. More specifically, in Product 1 the genera Phaseolus, Lens, Cicer, Pisum and Lathyrus were identified, while genus Fagopyron which was also listed on the label, was not detected (Figure 4A). In Products 2 and 3, all labeled genera were identified. Additionally, low levels of Arachis and Brassica were detected in Product 2 while traces of Pisum and Zea were found in Product 3 although not declared on the label (Figure 4B,C). In Product 6 all labeled ingredients were molecularly identified, even those in traces (Figure 4F). In contrast, Product 5, which listed genus Lens as the only ingredient, showed presence for several other genera such as Vicia, Pisum, Brassica, Lathyrus, Vigna and Cicer, suggesting possible cross-contamination or mislabeling (Figure 4E). Finally, in Product 4 (pasta made from wheat with tomato and spinach), although all genera were identified through ITS and rbcL sequencing, the main expected genera, Triticum was underrepresented in the sequence data (% abundance) compared to the percentage of the label. Instead, other genera such as Lens, Vigna, Hordeum, Lathyrus, Zea and Avena were identified, indicating potential substitution of wheat flour with alternative cereal or legume flours (Figure 4D). These results provide strong evidence for the application of DNA barcoding and especially ITS and rbcL markers not only in biodiversity assessment but also in food authentication, enabling the detection of mislabeled products and fraudulent substitutions [18,44,52]. In the food supply sector, the misrepresentation of species origin is a common problem. DNA barcoding enables the identification of food products at a molecular level, verifying whether the genera and species listed on the label match the actual ingredient contents [53,54]. During the last years, numerous studies have been conducted to address the biodiversity, authentication, and mislabeling of plant-based medicinal and food products [47]. Standard barcode regions, including ITS and rbcL markers used in the present study, have been employed to discriminate herbal and medicinal plant-based products, spices, herbal infusions, salad and seeds mixtures, as well as to authenticate the Designation of Origin of plant products as saffron or to detect adulteration in plant products [55,56,57,58,59,60,61]. However, in some cases, the complexity of the mixtures or the excessive food processing could affect the ability of DNA barcoding to recover intact sequences for analysis [41]. These observations suggest that sequencing read abundance is not directly proportional to ingredient weight, even under controlled sample preparation conditions. For example, in the case of plants, successful PCR of barcoding regions is often inhibited by the presence of secondary metabolites. However, modifications in extraction methods, primer sequences, and the use of an enhanced DNA polymerase can usually overcome such problems. The combining of barcodes from multiple loci has also been used successfully [14]. Collectively, these findings demonstrate that the complementary use of ITS and rbcL markers enables reliable genus-level identification across a wide range of plant-based commercial products, while ITS contributes valuable species-level resolution. By applying ITS and rbcL DNA barcoding to a range of commercially available plant-based products with different processing levels, we were able to assess the consistency between the two markers, evaluate the impact of processing on DNA identification, and compare results with product labels. These findings provide practical insights into using DNA barcoding for biodiversity assessment and food authentication in complex commercial products.

4. Conclusions

This study highlights the use of DNA barcoding as a robust and sensitive method for revealing plant-based product biodiversity and ensuring ingredient authenticity. The use of rbcL and ITS markers successfully profiled the plant composition of six plant-based commercial products that have undergone different levels of processing. Major genera such as Lens, Cicer, Lathyrus, Chenopodium, Phaseolus, Pisum, Vigna, and Triticum were dominant; however, genera and species of lower abundance were also identified, significantly contributing to product biodiversity. The approach proved sensitive enough to detect both major and trace species, providing a detailed snapshot of taxonomic diversity. However, limitations at the species level were evident, with some taxa remaining unidentified or misassigned, pointing to the need for additional markers or the deposition of more taxa sequences in GenBank libraries as references. The strong correlation between ITS and rbcL sequencing data was indicated by OTUs distribution and Pearson correlation, supporting their combined use for reliable genus-level biodiversity assessment. Heat map analyses confirmed high concordance between label claims and sequencing results in most cases, though undeclared species and absent labeled taxa were also observed, highlighting potential mislabeling or cross-contamination. Overall, this proof-of-concept study confirms that DNA barcoding can be a valuable tool, not only for food traceability and authentication but also for the in-depth characterization of plant biodiversity in complex food matrices, taking into account the ongoing accumulation of molecular reference data. The focus was on providing the first step toward uncovering and visualizing the biodiversity present in mixed crop food products. By making this diversity visible, our work provides baseline information that can later be translated into more complex BIOVALUE metrics, combining biodiversity with nutritional and functional values. In this context, future perspectives include expanding this approach to a broader range of commercial products, integrating additional DNA barcoding markers to improve species-level resolution, developing dedicated reference databases for food biodiversity, and combining biodiversity data with nutritional and functional information to better assess the overall value of food products.

Supplementary Materials

The following supporting information can be downloaded at: https://www.mdpi.com/article/10.3390/foods14183256/s1, Figure S1: PCR amplification of the ~800 bp of the ITS gene fragment in plant-based food products. Each lane corresponds to the amplification of the gene in products 1–10, respectively, with the last lane representing the negative control. No amplification was observed in Products 7–10 indicating the inhibition of PCR in these samples. Table S1: DNA quality and yield assessment using different DNA extraction methods.

Author Contributions

Author Contributions: Conceptualization, N.N., C.T. and A.K.; Methodology, N.N., C.T., M.K., E.B. and A.K.; Validation, M.-D.T., N.N. and A.K.; Investigation, M.-D.T. and N.N.; Data curation, M.-D.T., N.N., C.T., M.K., E.B., K.M. and A.K.; Writing—original draft, M.-D.T.; Writing—review and editing, M.-D.T., N.N., C.T., M.K., E.B., K.M. and A.K.; Visualization, M.-D.T., N.N. and A.K.; Supervision, N.N. and A.K.; Project administration, N.N., K.M. and A.K.; Funding acquisition, N.N., K.M. and A.K. All authors have read and agreed to the published version of the manuscript.

Funding

This research was funded by the BIOVALUE project “Fork-to-farm agent-based simulation tool augmenting BIOdiversity in the agri-food VALUE chain”, that received funding from the European Union’s Horizon 2020 research and innovation program under the Grant Agreement No. 101000499.

Institutional Review Board Statement

Not applicable.

Informed Consent Statement

Not applicable.

Data Availability Statement

The original contributions presented in this study are included in the article/Supplementary Material. Further inquiries can be directed to the corresponding authors.

Acknowledgments

This research was supported by the Ministry of Science, Technological Development and Innovation, Republic of Serbia, for M.K. (Grant No. 451-03-136/2025-03/200015).

Conflicts of Interest

All co-authors are part of the BioValue (https://www.biovalue-project.eu/) consortium (BioValue is a program funded by EU). All co-authors have participated in the formation of the procedures (selection of products, protocols, interpretation of results etc) we used to create a certification/traceability scheme for mixed plant foods that is a WP in our proposal. Authors such as Cyril Tisseyre and Eleonora Barilli participated, but there is no conflict of interest since they are part of the proposal, and there is no association of their companies with the aim or the procedures presented here. They are coauthors because of their expertise, and not for reasons of any affiliation(s). As a result, their participation did not affect the impartiality and objectivity of our research. And we declare for all authors that there are no commercial or financial relationships that could be construed as a potential conflict of interest.

References

  1. FAO. The State of the World’s Biodiversity for Food and Agriculture; Bélanger, J., Pilling, D., Eds.; FAO Commission on Genetic Resources for Food and Agriculture Assessments: Rome, Italy, 2019. [Google Scholar]
  2. Dawson, I.K.; Powell, W.; Hendre, P.; Bančič, J.; Hickey, J.M.; Kindt, R.; Hoad, S.; Hale, I.; Jamnadass, R. The role of genetics in mainstreaming the production of new and orphan crops to diversify food systems and support human nutrition. New Phytol. 2019, 224, 37–54. [Google Scholar] [CrossRef]
  3. Hawkins, I.W. Promoting Biodiversity in Food Systems, 1st ed.; CRC Press: Boca Raton, FL, USA, 2018; ISBN 9780367732974. [Google Scholar]
  4. García-Martín, M.; Huntsinger, L.; Ibarrola-Rivas, M.J.; Penker, M.; D’Ambrosio, U.; Dimopoulos, T.; Fernández-Giménez, M.E.; Kizos, T.; Muñoz-Rojas, J.; Abson, D.J.; et al. Landscape products for sustainable agricultural landscapes. Nat. Food 2022, 3, 814–821. [Google Scholar] [CrossRef]
  5. Martin, G.; Magne, M.A. Agricultural diversity to increase adaptive capacity and reduce vulnerability of livestock systems against weather variability—A farm-scale simulation study. Agric. Ecosyst. Environ. 2015, 199, 301–311. [Google Scholar] [CrossRef]
  6. Córdoba Vargas, C.A.; Hortúa Romero, S.; León Sicard, T. Key points of resilience to climate change: A necessary debate from agroecological systems. Clim. Dev. 2020, 12, 564–574. [Google Scholar] [CrossRef]
  7. Elouafi, I. Why biodiversity matters in agriculture and food systems. Science 2024, 386, eads8197. [Google Scholar] [CrossRef] [PubMed]
  8. Roe, D.; Seddon, N.; Elliott, J. Biodiversity loss is a development issue A rapid review of evidence Issue Paper. Lancet Planet. Health 2019, 3, 1–24. [Google Scholar]
  9. Jarzebski, M.P.; Su, J.; Abrahamyan, A.; Lee, J.; Kawasaki, J.; Chen, B.; Andriatsitohaina, R.N.N.; Ocen, I.; Sioen, G.B.; Lambino, R.; et al. Developing biodiversity-based solutions for sustainable food systems through transdisciplinary Sustainable Development Goals Labs (SDG-Labs). Front. Sustain. Food Syst. 2023, 7, 1144506. [Google Scholar] [CrossRef]
  10. IPBES. Summary for Policymakers of the Global Assessment Report on Biodiversity and Ecosystem Services; IPBES: Bonn, Germany, 2019; Volume 45, ISBN 9783947851133. [Google Scholar]
  11. Cheng, A.; Mayes, S.; Dalle, G.; Demissew, S.; Massawe, F. Diversifying crops for food and nutrition security—A case of teff. Biol. Rev. 2017, 92, 188–198. [Google Scholar] [CrossRef] [PubMed]
  12. Fardet, A.; Rock, E. Ultra-processed foods and food system sustainability: What are the links? Sustainability 2020, 12, 6280. [Google Scholar] [CrossRef]
  13. Leite, F.H.M.; Khandpur, N.; Andrade, G.C.; Anastasiou, K.; Baker, P.; Lawrence, M.; Monteiro, C.A. Ultra-processed foods should be central to global food systems dialogue and action on biodiversity. BMJ Glob. Health 2022, 7, 10–13. [Google Scholar] [CrossRef] [PubMed]
  14. Mishra, P.; Kumar, A.; Nagireddy, A.; Mani, D.N.; Shukla, A.K.; Tiwari, R.; Sundaresan, V. DNA barcoding: An efficient tool to overcome authentication challenges in the herbal market. Plant Biotechnol. J. 2016, 14, 8–21. [Google Scholar] [CrossRef]
  15. Techen, N.; Parveen, I.; Pan, Z.; Khan, I.A. DNA barcoding of medicinal plant material for identification. Curr. Opin. Biotechnol. 2014, 25, 103–110. [Google Scholar] [CrossRef] [PubMed]
  16. Campanaro, A.; Tommasi, N.; Guzzetti, L.; Galimberti, A.; Bruni, I.; Labra, M. DNA barcoding to promote social awareness and identity of neglected, underutilized plant species having valuable nutritional properties. Food Res. Int. 2019, 115, 1–9. [Google Scholar] [CrossRef] [PubMed]
  17. Casiraghi, M.; Labra, M.; Ferri, E.; Galimberti, A.; de Mattia, F. DNA barcoding: A six-question tour to improve users’ awareness about the method. Brief Bioinform. 2010, 11, 440–453. [Google Scholar] [CrossRef] [PubMed]
  18. Galimberti, A.; De Mattia, F.; Losa, A.; Bruni, I.; Federici, S.; Casiraghi, M.; Martellos, S.; Labra, M. DNA barcoding as a new tool for food traceability. Food Res. Int. 2013, 50, 55–63. [Google Scholar] [CrossRef]
  19. Hubert, N.; Hanner, R. DNA Barcoding, species delineation and taxonomy: A historical perspective. DNA Barcodes 2016, 3, 44–58. [Google Scholar] [CrossRef]
  20. Liberty, J.T.; Lin, H.; Kucha, C.; Sun, S.; Alsalman, F.B. Innovative approaches to food traceability with DNA barcoding: Beyond traditional labels and certifications. Ecol. Genet. Genom. 2025, 34, 100317. [Google Scholar] [CrossRef]
  21. Antil, S.; Abraham, J.S.; Sripoorna, S.; Maurya, S.; Dagar, J.; Makhija, S.; Bhagat, P.; Gupta, R.; Sood, U.; Lal, R.; et al. DNA barcoding, an effective tool for species identification: A review. Mol. Biol. Rep. 2023, 50, 761–775. [Google Scholar] [CrossRef] [PubMed]
  22. Hollingsworth, P.M.; Forrest, L.L.; Spouge, J.L.; Hajibabaei, M.; Ratnasingham, S.; van der Bank, M.; Chase, M.W.; Cowan, R.S.; Erickson, D.L.; Fazekas, A.J.; et al. A DNA barcode for land plants. Proc. Natl. Acad. Sci. USA 2009, 106, 12794–12797. [Google Scholar] [CrossRef]
  23. Watson, G.M.F.; Tabita, F.R. Microbial ribulose 1,5-bisphosphate carboxylase/oxygenase: A molecule for phylogenetic and enzymological investigation. FEMS Microbiol. Lett. 1997, 146, 13–22. [Google Scholar] [CrossRef]
  24. Doyle, J.J.; Doyle, J.L. A Rapid Dna Isolation Procedure for Small Quantities of Fresh Leaf Tissue. Phytochem. Bull. 1987, 19, 11–15. [Google Scholar]
  25. Grigoriou, A.; Tsaniklidis, G.; Hagidimitriou, M.; Nikoloudakis, N. The cypriot indigenous grapevine germplasm is a multi-clonal varietal mixture. Plants 2020, 9, 1034. [Google Scholar] [CrossRef]
  26. Healey, A.; Furtado, A.; Cooper, T.; Henry, R.J. Protocol: A simple method for extracting next-generation sequencing quality genomic DNA from recalcitrant plant species. Plant Methods 2014, 10, 21. [Google Scholar] [CrossRef]
  27. Corvalán, L.C.J.; de Melo-Ximenes, A.A.; Carvalho, L.R.; e Silva-Neto, C.D.M.; Diniz-Filho, J.A.F.; Telles, M.P.D.C.; Nunes, R. Is There a Key Primer for Amplification of Core Land Plant DNA Barcode Regions (rbcL and matK)? Ecol. Evol. 2025, 15, e70961. [Google Scholar] [CrossRef]
  28. Fay, M.F.; Swensen, S.M.; Chase, M.W. Taxonomic Affinities of Medusagyne oppositifolia (Medusagynaceae). Kew Bull. 1997, 52, 111–120. [Google Scholar] [CrossRef]
  29. Robinson, J.P.; Harris, S.A.; Juniper, B.E. Taxonomy of the genus Malus Mill. (Rosaceae) with emphasis on the cultivated apple, Malus domestica Borkh. Plant Syst. Evol. 2001, 226, 35–58. [Google Scholar] [CrossRef]
  30. Oshingboye, A.D.; Ogundipe, O.T. Exploring the DNA barcoding potential of Nigerian arid-land Mimosoideae using a multigene tiered approach. S. Afr. J. Bot. 2018, 117, 288–300. [Google Scholar] [CrossRef]
  31. Peng, Y.; Chen, Y.; Ding, H.; Liu, X.; Cao, F.; Xu, L. From Phenotypes to Genotypes: Enhancing the Identification of Cymbidium Species with DNA Barcoding. Plants 2025, 14, 619. [Google Scholar] [CrossRef]
  32. Nikoloudakis, N.; Skaracis, G.; Katsiotis, A. Evolutionary insights inferred by molecular analysis of the ITS1-5.8S-ITS2 and IGS Avena sp. sequences. Mol. Phylogenet. Evol. 2008, 46, 102–115. [Google Scholar] [CrossRef] [PubMed]
  33. Stortchevoi, A.; Kamelamela, N.; Levine, S.S. SPRI beads-based size selection in the range of 2-10kb. J. Biomol. Tech. 2020, 31, 7–10. [Google Scholar] [CrossRef]
  34. Schmieder, R.; Edwards, R. Quality control and preprocessing of metagenomic datasets. Bioinformatics 2011, 27, 863–864. [Google Scholar] [CrossRef] [PubMed]
  35. Wood, D.E.; Lu, J.; Langmead, B. Improved metagenomic analysis with Kraken 2. Genome Biol. 2019, 20, 257. [Google Scholar] [CrossRef]
  36. Gorini, T.; Mezzasalma, V.; Deligia, M.; De Mattia, F.; Campone, L.; Labra, M.; Frigerio, J. Check Your Shopping Cart: DNA Barcoding and Mini-Barcoding for Food Authentication. Foods 2023, 12, 2392. [Google Scholar] [CrossRef] [PubMed]
  37. Mafra, I.; Silva, S.A.; Moreira, E.J.M.O.; da Silva, C.S.F.; Beatriz, M.; Oliveira, P.P. Comparative study of DNA extraction methods for soybean derived food products. Food Control 2008, 19, 1183–1190. [Google Scholar] [CrossRef]
  38. Ren, Y.; Ma, Y.; Li, Y.; Song, Y.; Zhao, W.; Huang, X.; Yu, D.; Li, J.; Xu, Z.; Zhao, W. Comparative evaluation of various DNA extraction methods and analysis of DNA degradation levels in commercially marketed Chestnut rose juices and beverages. BMC Biotechnol. 2025, 25, 9. [Google Scholar] [CrossRef]
  39. Singh, M.; Sodhi, K.K.; Paliwal, A.; Sharma, S.; Randhawa, G. Efficient DNA Extraction Procedures for Processed Food Derivatives—A Critical Step to Ensure Quality for GMO Analysis. Food Anal. Methods 2021, 14, 2249–2261. [Google Scholar] [CrossRef]
  40. Filipa-Silva, A.; Castro, R.; Rebelo, M.; Mota, M.J.; Almeida, A.; Valente, L.M.P.; Gomes, S. Enhancing the authenticity of animal by-products: Harmonization of DNA extraction methods from novel ingredients. Front. Chem. 2024, 12–2024, 1350433. [Google Scholar] [CrossRef] [PubMed]
  41. Shokralla, S.; Spall, L.J.; Gibson, F.J.; Hajibabaei, M. Next-generation sequencing technologies for environmental DNA research. Mol. Ecol. 2012, 21, 1794–1805. [Google Scholar] [CrossRef]
  42. Lorusso, L.; Shum, P.; Piredda, R.; Mottola, A.; Maiello, G.; Cartledge, E.L.; Neave, E.F.; Di Pinto, A.; Mariani, S. Mismanagement and poor transparency in the European processed seafood supply revealed by DNA metabarcoding. Food Res. Int. 2024, 194, 114901. [Google Scholar] [CrossRef]
  43. Fazekas, A.J.; Kesanakurti, P.R.; Burgess, K.S.; Percy, D.M.; Graham, S.W.; Barrett, S.C.H.; Newmaster, S.G.; Hajibabaei, M.; Husband, B.C. Are plant species inherently harder to discriminate than animal species using DNA barcoding markers? Mol. Ecol. Resour. 2009, 9, 130–139. [Google Scholar] [CrossRef]
  44. Hebert, P.D.N.; Ratnasingham, S.; DeWaard, J.R. Barcoding animal life: Cytochrome c oxidase subunit 1 divergences among closely related species. Proc. R. Soc. B Biol. Sci. 2003, 270, 96–99. [Google Scholar] [CrossRef] [PubMed]
  45. Kress, W.J.; Erickson, D.L. A Two-Locus Global DNA Barcode for Land Plants: The Coding rbcL Gene Complements the Non-Coding trnH-psbA Spacer Region. PLoS ONE 2007, 2, e508. [Google Scholar] [CrossRef]
  46. Kress, W.J.; Erickson, D.L. DNA barcodes: Genes, genomics, and bioinformatics. Proc. Natl. Acad. Sci. USA 2008, 105, 2761–2762. [Google Scholar] [CrossRef]
  47. Lanubile, A.; Stagnati, L.; Marocco, A.; Busconi, M. DNA-based techniques to check quality and authenticity of food, feed and medicinal products of plant origin: A review. Trends Food Sci. Technol. 2024, 149, 104568. [Google Scholar] [CrossRef]
  48. Robertson, J.M.; Damaso, N.; Meiklejohn, K.A. DNA-Based Analysis of Plant Material in Forensic Investigations; Springer: Singapore, 2021; ISBN 9789811593642. [Google Scholar]
  49. Singh, H.; Parveen, I.; Raghuvanshi, S.; Babbar, S.B. The loci recommended as universal barcodes for plants on the basis of floristic studies may not work with congeneric species as exemplified by DNA barcoding of Dendrobium species. BMC Res. Notes 2012, 5, 42. [Google Scholar] [CrossRef]
  50. Cameron, K.M.; Chase, M.W.; Whitten, W.M.; Kores, P.J.; Jarrell, D.C.; Albert, V.A.; Yukawa, T.; Hills, H.G.; Goldman, D.H. A phylogenetic analysis of the Orchidaceae: Evidence from rbcL nucleotide sequences. Am. J. Bot. 1999, 86, 208–224. [Google Scholar] [CrossRef] [PubMed]
  51. Li, D.Z.; Gao, L.M.; Li, H.T.; Wang, H.; Ge, X.J.; Liu, J.Q.; Chen, Z.D.; Zhou, S.L.; Chen, S.L.; Yang, J.B.; et al. Comparative analysis of a large dataset indicates that internal transcribed spacer (ITS) should be incorporated into the core barcode for seed plants. Proc. Natl. Acad. Sci. USA 2011, 108, 19641–19646. [Google Scholar] [CrossRef]
  52. Nehal, N.; Choudhary, B.; Nagpure, A.; Gupta, R.K. DNA barcoding: A modern age tool for detection of adulteration in food. Crit. Rev. Biotechnol. 2021, 41, 767–791. [Google Scholar] [CrossRef]
  53. Brooks, C.; Parr, L.; Smith, J.M.; Buchanan, D.; Snioch, D.; Hebishy, E. A review of food fraud and food authenticity across the food supply chain, with an examination of the impact of the COVID-19 pandemic and Brexit on food industry. Food Control 2021, 130, 108171. [Google Scholar] [CrossRef]
  54. Raja, H.A.; Baker, T.R.; Little, J.G.; Oberlies, N.H. DNA barcoding for identification of consumer-relevant mushrooms: A partial solution for product certification? Food Chem. 2017, 214, 383–392. [Google Scholar] [CrossRef]
  55. Bosmali, I.; Ordoudi, S.A.; Tsimidou, M.Z.; Madesis, P. Greek PDO saffron authentication studies using species specific molecular markers. Food Res. Int. 2017, 100, 899–907. [Google Scholar] [CrossRef] [PubMed]
  56. Ganopoulos, I.; Bazakos, C.; Madesis, P.; Kalaitzis, P.; Tsaftaris, A. Barcode DNA high-resolution melting (Bar-HRM) analysis as a novel close-tubed and accurate tool for olive oil forensic use. J. Sci. Food Agric. 2013, 93, 2281–2286. [Google Scholar] [CrossRef] [PubMed]
  57. Intharuksa, A.; Sasaki, Y.; Ando, H.; Charoensup, W.; Suksathan, R.; Kertsawang, K.; Sirisa-ard, P.; Mikage, M. The combination of ITS2 and psbA-trnH region is powerful DNA barcode markers for authentication of medicinal Terminalia plants from Thailand. J. Nat. Med. 2020, 74, 282–293. [Google Scholar] [CrossRef] [PubMed]
  58. Khilare, V.; Tiknaik, A.; Prakash, B.; Ughade, B.; Korhale, G.; Nalage, D.; Ahmed, N.; Khedkar, C.; Khedkar, G. Multiple tests on saffron find new adulterant materials and reveal that Ist grade saffron is rare in the market. Food Chem. 2019, 272, 635–642. [Google Scholar] [CrossRef]
  59. Mosa, K.A.; Soliman, S.; El-Keblawy, A.; Ali, M.A.; Hassan, H.A.; Tamim, A.A.B.; Al-Ali, M.M. Using DNA Barcoding to Detect Adulteration in Different Herbal Plant- Based Products in the United Arab Emirates: Proof of Concept and Validation. Recent Pat. Food Nutr. Agric. 2018, 9, 55–64. [Google Scholar] [CrossRef]
  60. Tripodi, P. Application of High-Resolution Melting and DNA Barcoding for Discrimination and Taxonomy Definition of Rocket Salad (Diplotaxis spp.) Species. Genes 2023, 14, 1594. [Google Scholar] [CrossRef]
  61. Zhang, W.; Sun, Y.; Liu, J.; Xu, C.; Zou, X.; Chen, X.; Liu, Y.; Wu, P.; Yang, X.; Zhou, S. DNA barcoding of Oryza: Conventional, specific, and super barcodes. Plant Mol. Biol. 2021, 105, 215–228. [Google Scholar] [CrossRef]
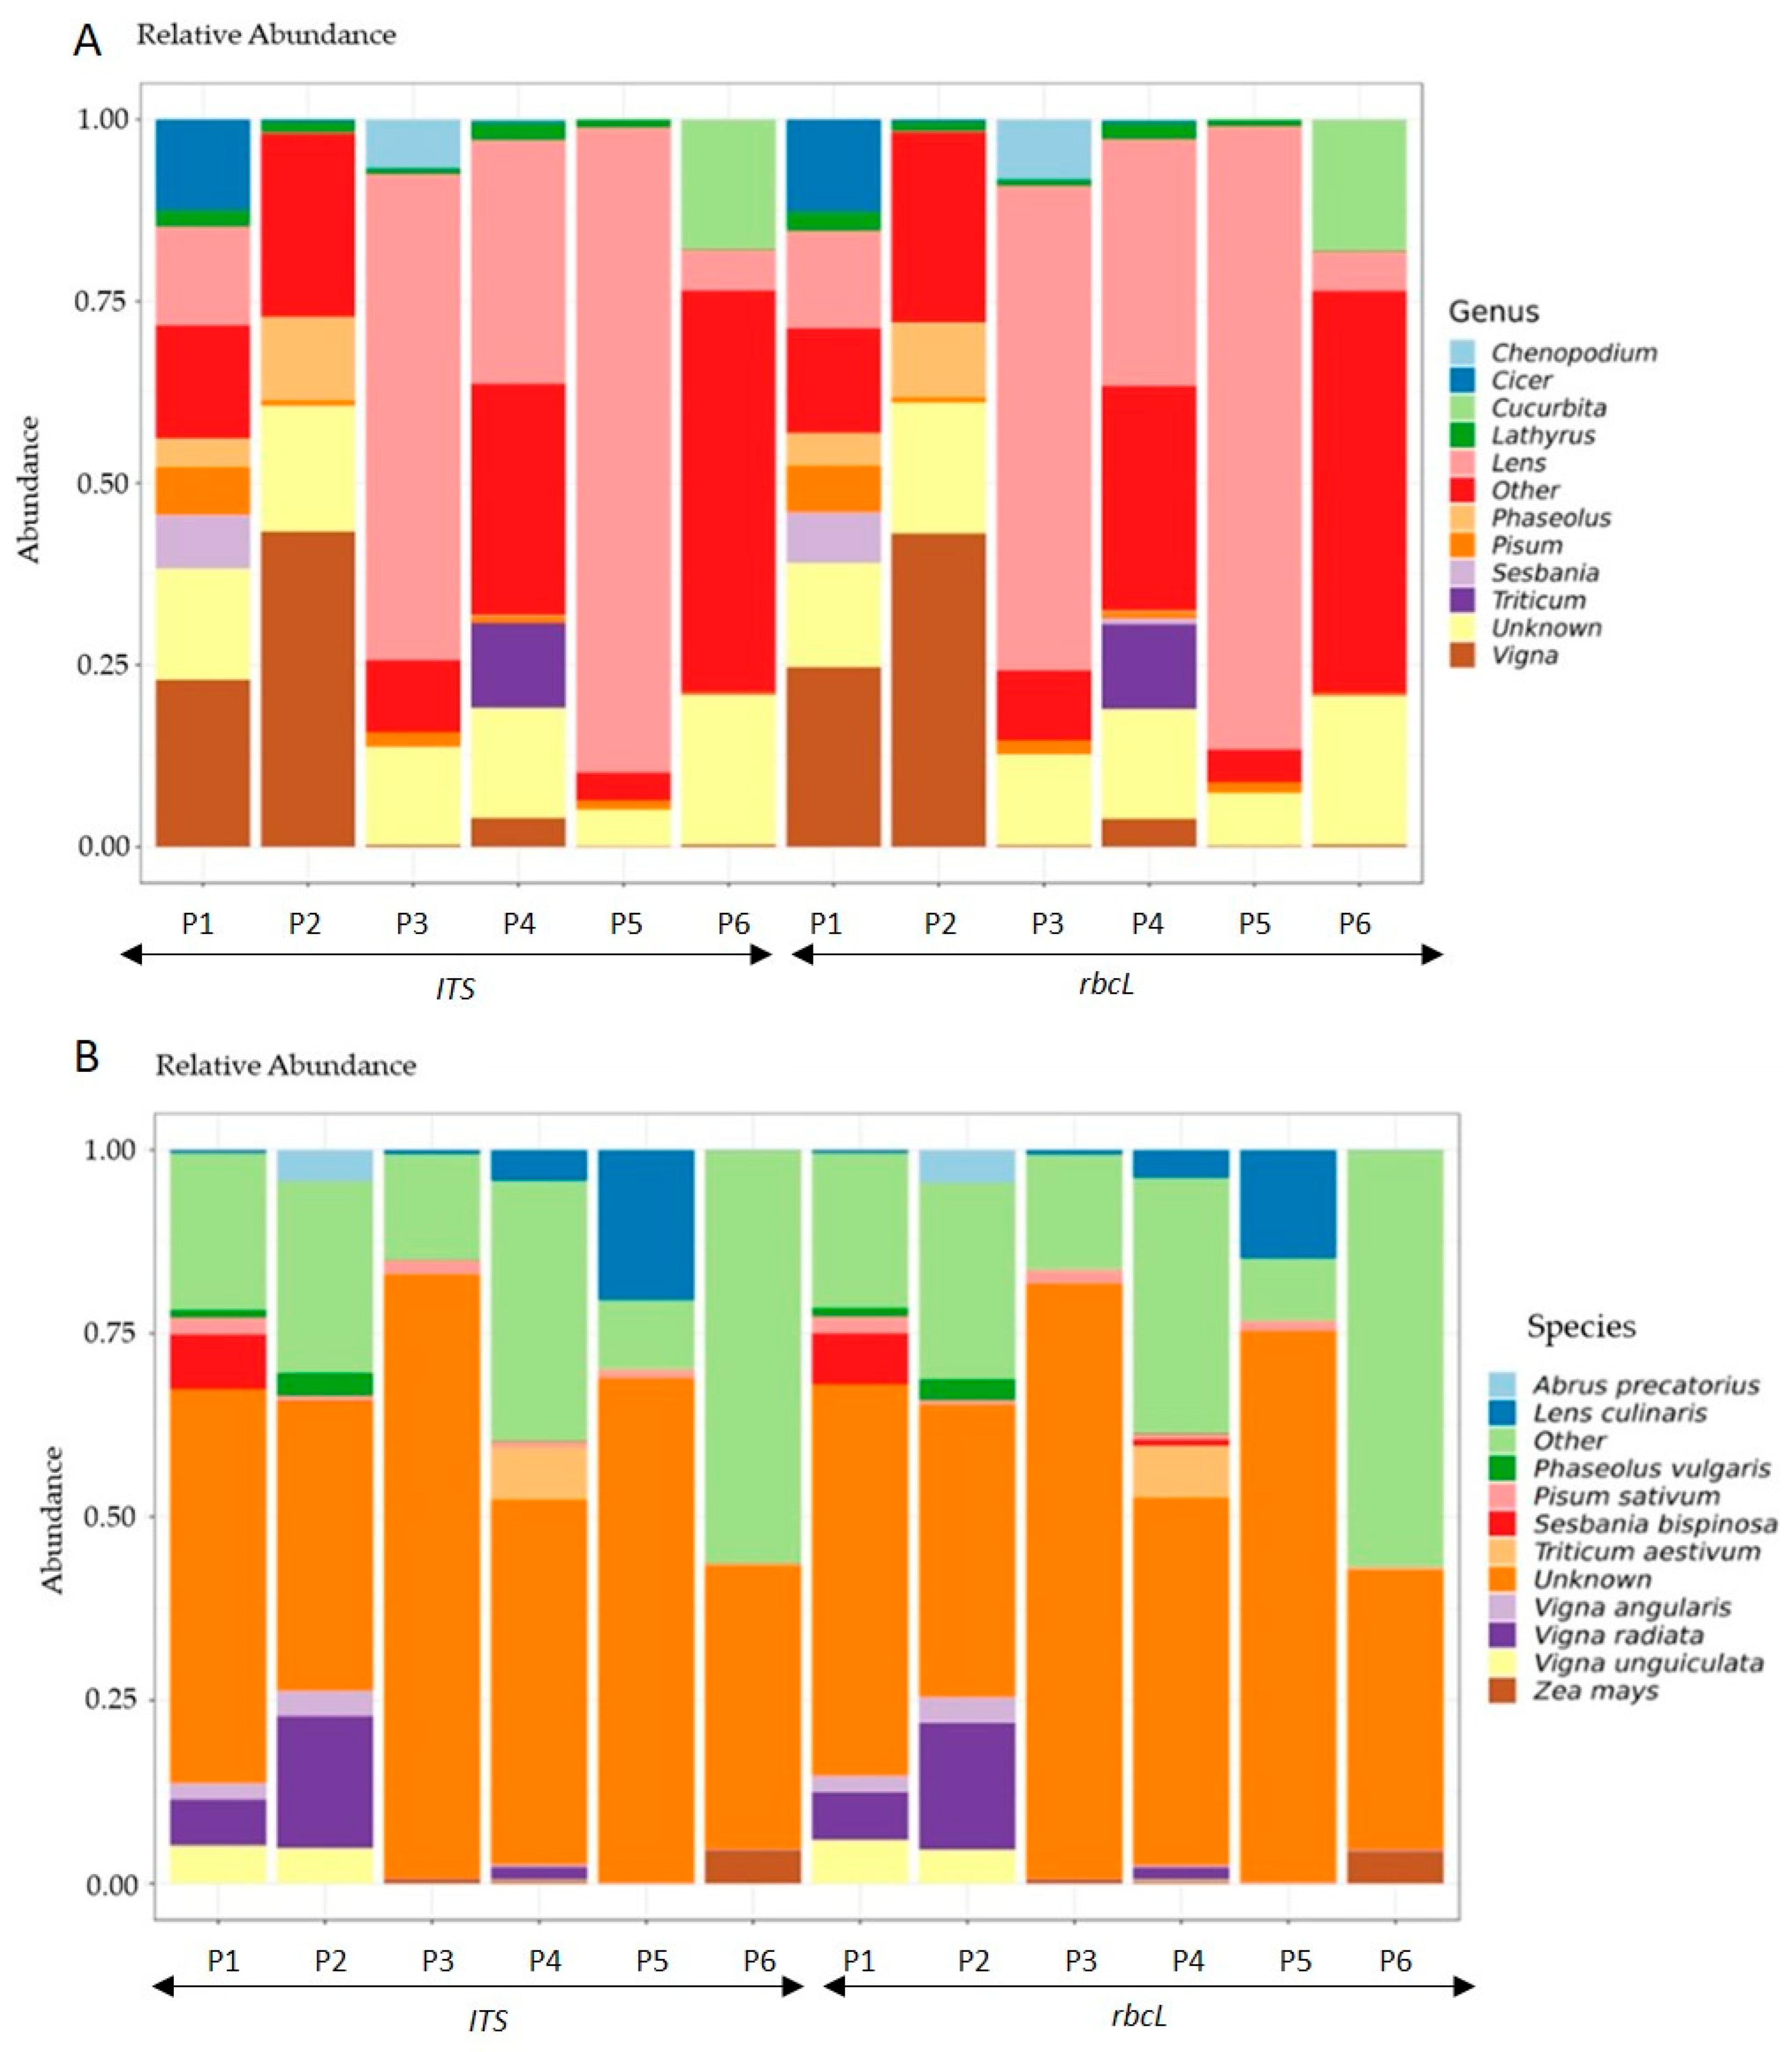
Figure 1. (A) Genera and (B) Species composition plot of all samples. The plot was generated by microbiome R package. The genera and species shown are the 11 most abundant. The remaining are included in the ‘Other’ category. The ‘Unknown’ is the abundance of reads whose genus is unknown because the taxonomy ID associated with them corresponds to a higher taxonomy group. The abundance in the y-axis represents the relative abundances in [0, 1] (microbiome R package).
Foods 14 03256 g001
Figure 2. OTUs heat map with the 50 OTUs with the highest sum of read counts in all six samples for the two different genes sequenced. A higher Z-score (deep blue color) indicates a higher relative abundance or read count of a particular OTU in the sample compared to others.
Foods 14 03256 g002
Figure 3. Correlation between ITS and rbcL genera read abundances across six plant-based food products. Scatterplots demonstrate the positive correlation between the ITS and rbcL relative read abundances for each genus per product. The correlations are shown in each graph with Pearson correlation coefficient and p-value.
Foods 14 03256 g003
Figure 4. Comparison of label composition and ITS, rbcL-based genus detection across six plant-based food products. Heat maps show the correlation between the labeled weight percentage (% w/w, column 1) of each ingredient and its corresponding ITS and rbcL read abundance (columns 2 and 3). Panels (AF) correspond to Products 1–6, respectively. Color scale ranges from red to green, with green, yellow and red representing no, intermediate and strong match between read abundance and weight percentage, respectively. Gray color represents lack of labeled weight percentage.
Foods 14 03256 g004
Table 1. Selection of final products tested for DNA extraction efficiency. The array includes commodities with varying ingredient compositions and processing methods, such as different salt and sugar contents, additives, and thermal processing techniques. Products 1 to 3 were dried mixtures of legumes and seeds, products 4 and 5 were types of pasta, made with wheat, lentils, herbs, and vegetables. Product 6 was a frozen blend of legumes and vegetables. Products 7, 8, and 10 were tomato-based items processed to different extents, and product 9 was a canned mix of legumes and vegetables. Each product represents a distinct category, ensuring a comprehensive assessment of the DNA extraction process.
SamplesIngredientsThermal Processing or Additives
Product 110% chickpeas, 10% lathyrus seeds, 10% Beluga lentils, 10% red lentils, 10% red beans, 10% black-eyed beans, 10% white beans, 10% green beans, 10% crashed peas, 5% fagopyrum seeds, 5% black beans, 5% borlotti beansno
Product 240% white beans, 30% borlotti beans, 10% lathyrus seeds, 10% black-eyed beans, 10% mung bean (Vigna radiata)no
Product 338% white quinoa, 31% millet, 13% red lentils, 13% red quinoa, 4% dehydrated carots, 0.5% dehydrated leeks, Dehydrated parsleyno
Product 4Durum wheat semolina, 4% dehydrated tomatoes, 3% dehydrated spinach, traces of soya and mustardyes
Product 5Red lentils flouryes
Product 636.5% lentils, red pepper, corn, onion, carrots, zucchini, tomato, extra virgin oil, salt and black pepperyes
Product 728–30% tomato juice solids, saltyes
Product 860% peeled plum tomatoes, 40% slightly concentrated tomato juice, acidity regulator, citric acidyes
Product 9beans, green beans, carrots, white turnip, saltyes
Product 10sun dried tomatoes, sulfur dioxide, saltyes
Disclaimer/Publisher’s Note: The statements, opinions and data contained in all publications are solely those of the individual author(s) and contributor(s) and not of MDPI and/or the editor(s). MDPI and/or the editor(s) disclaim responsibility for any injury to people or property resulting from any ideas, methods, instructions or products referred to in the content.