Article

Process Optimization for Polyphenol Extraction from Macroalgae Residues and Assessment of Their Compositions, Antioxidant Activities, and Glycosidase Inhibition

College of Public Health, Dali University, Dali 671000, China
*
Author to whom correspondence should be addressed.
Foods 2025, 14(17), 3055; https://doi.org/10.3390/foods14173055
Submission received: 30 July 2025 / Revised: 22 August 2025 / Accepted: 28 August 2025 / Published: 29 August 2025
(This article belongs to the Special Issue Nutrition, Safety and Storage of Seafoods)

Abstract

Macroalgae are often used to produce sodium alginate, but their by-products have not been fully utilized. This study aimed to optimize the extraction of bound polyphenols (BPs) from Macrocystis pyrifera (L.) residues, analyze the composition of free polyphenols (FPs) and BPs, and evaluate their antioxidant activities and ability to inhibit glycosidase activity. The optimal conditions for extracting BPs achieved by the response surface method were as follows: 50 °C, a solid–liquid ratio of 1:50, an alkaline hydrolysis time of 2.38 h, and a NaOH concentration of 8 mol/L. Polyphenol content determination results indicated that FPs had significantly higher total polyphenols (13.02 ± 0.05 μg GAE/mg) and phlorotannin (3.44 ± 0.04 μg PE/mg) than BPs (6.57 ± 0.07 μg GAE/mg and 1.32 ± 0.20 μg PE/mg). HPLC/ESI-QTOF-MS showed distinct profiles: FPs had one polyhydroxy phenol, nine flavonoids, and four additional compounds, whereas BPs had five flavonoids and four other compounds. Antioxidant activity was found to be higher in FPs than in BPs (DPPH: 3.03 vs. 1.79 μg TE/mg; FRAP: 19.40 vs. 7.43 μg TE/mg). Furthermore, FPs exhibited 4.59- and 11-fold higher inhibition capacity toward α-amylase and α-glucosidase, respectively, compared to BPs. The results provide valuable basic data for the application of macroalgae residues in the marine biological industry and reveal their potential hypoglycemic ability.

1. Introduction

Polyphenols are the most significant group of compounds that determine the biomedical importance of marine algae [1]. Algae have been demonstrated to contain large amounts of polyphenols [2], which exhibit various bioactive properties, including antitumor [3], anti-inflammatory [4], and anti-diabetic [5] effects. These findings underscore the necessity for more comprehensive and multidimensional investigations into the polyphenolic compounds in algae. Polyphenols are divided into free polyphenols (FPs) and bound polyphenols (BPs) according to solubility and extraction methods [6]. The extraction of BPs is usually more complicated than that of FPs, often requiring chemical or enzymatic hydrolysis [7,8]. There is research showing the potential antioxidant and anti-inflammatory activities of BPs in algae, which are beneficial to human health [9]. Consequently, optimizing extraction techniques for BPs in algae warrants systematic investigation to fully exploit their bioactive potential.
Macroalgae are aquatic photosynthetic organisms that are mainly classified as green, red, or brown algae [10,11]. Macrocystis pyrifera (L.) Ag. is an alga of the genus Macrocystis under the family Laminariaceae, which is part of the order Laminariales within the phylum Heterokontophyta [12]. Macroalgae are rich in nutrients such as flavonoids, tannins, and polysaccharides, which are often used to extract sodium alginate. Sodium alginate is a macroalgae extract that exhibits significant antioxidant activity and has broad application prospects [13]. Research has shown that sodium alginate helps prevent diseases such as cardiovascular disease, diabetes, and non-alcoholic fatty liver disease (NAFLD) due to its richness in bioactive compounds like polyphenols and flavonoids [14,15]. Beyond their ecological roles, macroalgae are commercially utilized in food processing and agricultural applications [16,17]. However, studies have shown that about 30–50% of the raw materials in the macroalgae industry eventually become residues [18]. As a by-product of the extraction process of sodium alginate, macroalgae residue is mainly used for feed, fertilizers, and biological refining [19], as it is still rich in polyphenols, dietary fiber, and other active components, which have not been fully utilized. There is a significant research gap regarding the methodological optimization of macrocystis residue extraction and subsequent analysis of their biological properties.
The hyperglycemia potential of algal polyphenols has been extensively investigated [5], while studies on the bioactivity of polyphenols from macroalgae residues currently remain limited. Investigating the inhibitory activities of α-amylase and α-glucosidase from macroalgae residues will facilitate future exploration of their potential beneficial effects on diabetes management. The present study focuses on achieving the reuse of active ingredients in the macroalgae residue by optimizing the extraction of polyphenols from these residues, investigating their composition via high-performance liquid chromatography–electrospray ionization–quadrupole time-of-flight tandem mass spectrometry (HPLC-ESI-QTOF-MS/MS), and evaluating their antioxidant activity and ability to inhibit glycosidase, thereby uncovering the potential uses of macroalgae residue as a source of natural antioxidants that are suitable for functional food formulations or pharmaceutical products aimed at hyperglycemia management.

2. Materials and Methods

2.1. Materials and Chemicals

2.1.1. Samples

The macroalgae residue obtained after alginate extraction was derived from Macrocystis pyrifera (provided by Qingdao Mingyue Seaweeds Group Co., Ltd., Qingdao, Shandong, China). The residue was dried at 55 °C, crushed into a powder by a grinder, and sieved through a 60-mesh sieve.

2.1.2. Reagents and Equipment

Folin’s phenol reagent (1 mol/L), 3,5-Dinitrosalicylic acid (DNS), α-amylase (3.7 U/mg, Bacillus), and 1,1-diphenyl-2-trinitrophenylhydrazine (≥98%) were purchased from Solarbio Science & Technology Co., Ltd. (Beijing, China). Formic acid (98.0%) was purchased from Sigma-Aldrich. Gallic acid (99%), resorcinol (>99.0%), 2,4-dimethoxybenzaldehyde (DMBA) (98%), and pNPG (99%) were purchased from Macklin Biochemical Co., Ltd. (Shanghai, China). 2,4,6-Tripyridyl-s-triazine (98%) and a-glucosidase (33 U/mg, Saccharomyces) were purchased from Yuanye Bio-Technology Co., Ltd. (Shanghai, China). 4-Nitrophenyl octanoate (90%) was purchased from Aladdin Biochemical Technology Co., Ltd. (Shanghai, China). Other reagents were purchased from Sinopharm Chemical Reagent Co., Ltd. (Shanghai, China).

2.2. Extraction of FPs

The approach used in this study is illustrated in Figure 1. FPs were obtained via extraction with ethanol and water. The conditions for extracting free phenols from the macroalgae residue include an ethanol volume fraction of 85%, a solid–liquid ratio of 1:10, and magnetic stirring at 55 °C for 6 h. After extraction and filtration, we repeated the extraction process with ethanol twice and retained the filtrate. We then dried the filter residue at 55 °C and stored it.

2.3. Single-Factor Extraction Experiments for BPs

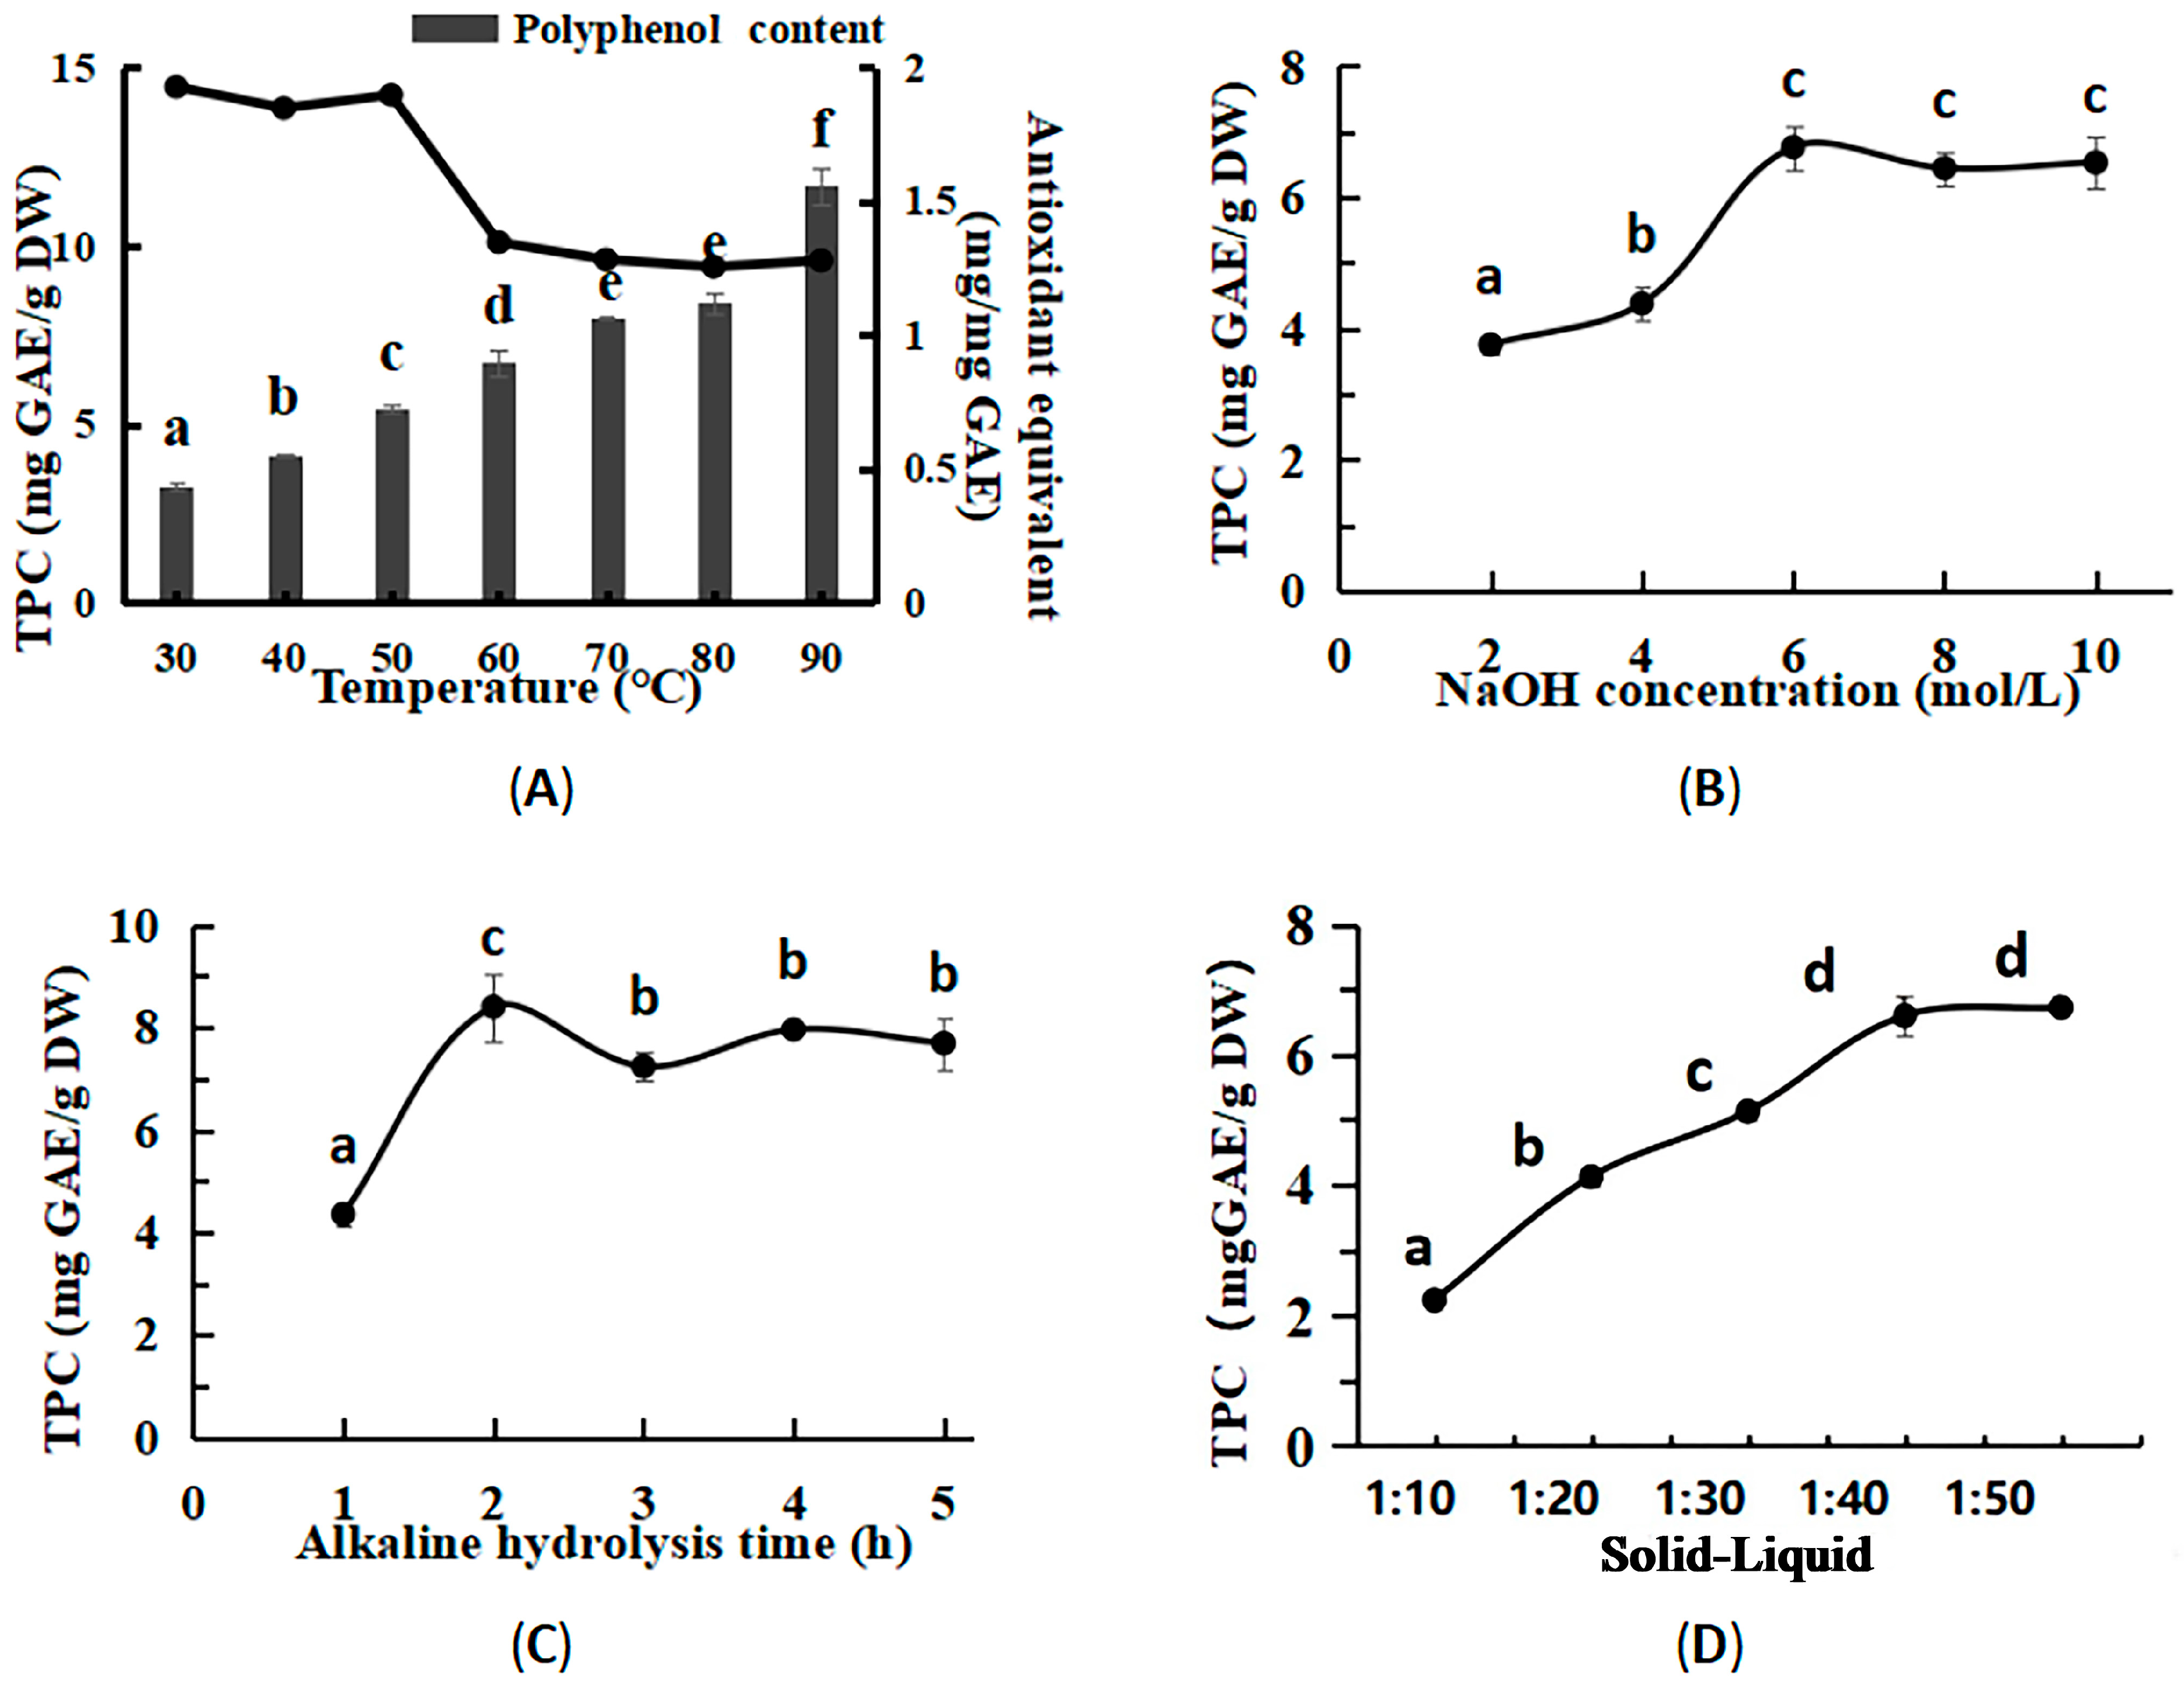
The extraction process for BPs was optimized using alkaline hydrolysis followed by ethanol precipitation. Firstly, the Macrocystis pyrifera residue was added to a specified volume of NaOH solution at a predetermined concentration, and the mixture was hydrolyzed at a controlled temperature. Subsequently, two volumes of 95% ethanol were added, and extraction was carried out for 1 h with continuous shaking. The extract was then centrifuged at 1118× g for 15 min, and the supernatant was collected for bound polyphenol quantification. Taking the rate of BP extraction as the outcome, we fixed other parameters and investigated the effects of four factors: temperature (30, 40, 50, 60, 70, 80, and 90 °C); NaOH concentration (2, 4, 6, 8, and 10 mol/L); alkaline hydrolysis time (1, 2, 3, 4, and 5 h); and liquid–solid ratio (1:10, 1:20, 1:30, 1:40, and 1:50), The specific experimental methods are shown in Table 1.

2.4. Optimization of Extraction Conditions and Quantification of Total Phenolic Contents

The optimal method for extracting BPs from the macroalgae residue was determined via the Box–Behnken response surface method (RSM). A three-factor and three-plane heart cube design was used, including 16 experimental runs. The NaOH concentration (A, mol/L), extraction time (B, h) and liquid–solid ratio (C) at 50 °C were altered, and the response variable was the polyphenol content (Y). The specific experimental scheme and results are shown in Table 2.
The total phenol and phlorotannin (phloroglucinol as the standard) contents of the samples extracted under the optimized conditions were determined simultaneously. The total phenol content (TPC) test method was a modified version of the Folin–Ciocalteu method, and the DMBA assay was modified from the phlorotannin content test [20]. Given the thermolability of polyphenolic antioxidant activity, single-factor tests additionally incorporated temperature effects. The experimental data was analyzed using Design Expert software (version 8.0.6).

2.5. Qualitative Analysis of Phenolic Compounds by HPLC-ESI-QTOF-MS/MS

Samples were dissolved in 100 μL of methanol and centrifuged at 1610× g and 4 °C for 10 min using a Microfuge 22R Centrifuge (Beckman Coulter, Brea, CA, USA). Then, the supernatant was extracted and used in the subsequent steps.
Capillary HPLC (Ultimate 3000, Thermo Fisher, Waltham, MA, USA) with a C18 column was used for gradient elution, with the mass spectrometer (TripleTOF5600 +, AB SCIEX, Redwood, CA, USA) in positive/negative ion mode. A Sepax GP-C18 (1.8 µm, 120Å, 2.1 mm×150 mm) column (Sepax Technologies, Newark, DE, USA) was employed for separation. The flow rate employed was 0.3 mL/min and the column was held at a constant temperature of 40 °C. The gradient elution parameters were as follows: 0~10 min with 5% B, 10~17 min with 70% B, 17~18 min with 100% B, 18~19 min with 100% B, and 19~21 min with 5% B. The ESI source was operated in positive and negative ion modes. The data were imported into MS-DIAL 4.70 software for data processing and compared with data from three libraries: MassBank, Respect, and GNPS (14,951 records in total).

2.6. Antioxidant Activity and Glycosidase Activity Inhibition Assay

2.6.1. Antioxidant Activity Assay

The antioxidant activity of free and bound polyphenol extracts was evaluated via the DPPH and FRAP methods, respectively. The antiradical activity of DPPH was determined using an assay, as explained elsewhere [21,22]. Aliquots of 0.5 mL of Trolox standard solutions at varying concentrations were transferred to 1.5 mL microcentrifuge tubes, followed by the addition of 0.5 mL of a freshly prepared 0.2 mmol/L DPPH methanolic solution. After mixing, the reaction was carried out for 0.5 h in the dark, and absorbance was measured at 520 nm. All samples, blanks, and controls were prepared in triplicate. The radical scavenging activity of DPPH was calculated as follows:
Scavenging rate (%) = [(Ac − An + Ab)/Ac] × 100%
The FRAP method was modified from Rumpf et al.’s work [23]. A total of 0.05 mL of the Trolox gradient solution was added to 1.45 mL of the FRAP working solution. The reaction was carried out in a water bath at 37 °C for 10 min, and absorbance was measured at 593 nm with a microplate reader. All samples, blanks, and reference substances were prepared in parallel and in triplicate. From the Trolox calibration curve, the results of the antioxidant activity assays were expressed as the concentration in Trolox equivalent (TE), and the calculation formula was as follows:
TE = (An/AT) × CT

2.6.2. Glycosidase Activity Inhibition Assay

Both FPs and BPs extracts inhibited the activities of α-glucosidase and α-amylase The method for determining the inhibitory activity of α-amylase was modified from Liu et al.’s study [24]. The diluted free and bound polyphenol extracts were added to different tubes with either 0.05 mL of the α-amylase solution (0.1 U/mL), 0.1 M pH 6.8 PBS, or 0.05 mL of an inhibitor, and then shaken at 37 °C for 15 min. Then, 0.1 mL of a starch solution (1%) was added to each tube and the reaction was carried out at 50 °C for 10 min. Each tube was supplemented with 0.4 mL of a DNS solution in a boiling water bath for 10 min, and then cooled to room temperature. Then, 1 mL of water was added to each tube, and the absorbance at 540 nm was measured. All samples, blanks, and reference substances were prepared in parallel and in triplicate. The inhibition rate was calculated using Formula (3) [25].
Inhibition rate (%) = [1 − (ODA − ODa)/(ODB − ODb)] × 100
The methodology for assessing the inhibitory activity of α-glucosidase has been described by Yang et al. [26]. First, we added 0.1 M phosphate buffer, an inhibitor, and α-glucosidase to the experimental group, the control group, and the blank group according to the protocol. The mixture was incubated in a water bath at 37 °C for 10 min. Subsequently, 0.1 mL of pNPG (5 mmol/L) was added to each group, and the samples were incubated at 37 °C for 1 h. Then, 1 mL of a 1 mol/L sodium carbonate solution was added. All samples, blanks, and controls were prepared in parallel and in triplicate. Absorbance was measured at 405 nm. The formula for calculating the inhibition rate is shown in Formula (3).

2.7. Statistical Analysis

Three separate extraction experiments were performed to determine the results, which are presented as the mean ± standard deviation. SPSS 16.0 software was used to analyze the data, and one-way ANOVA followed by the LSD (least significant difference) mean test was applied. A p-value of p < 0.05 was considered statistically significant.

3. Results and Discussion

3.1. Quantification of Free Polyphenols from the Macroalgae Residue

Through extraction and assays, it was determined that the crude extract yield of FPs from the macroalgae residue was 4.5%. The polyphenol content was 13.02 ± 0.07 μg GAE/mg and 3.45 ± 0.04 μg PE/mg. In contrast, the rate of BP extraction varied under different experimental conditions.

3.2. Optimized Conditions for Bound Polyphenols

In the single-factor experiments, the influence of various factors on the extraction rate and antioxidant activity of BPs from macroalgae residue was evaluated. The design and results of the Box–Behnken experiments are shown in Table 3. As shown in Figure 2A, the efficiency of BP extraction exhibited a positive correlation with the alkaline hydrolysis temperature from 30 °C to 90 °C. This enhancement is attributed to increased molecular mobility and accelerated solvent diffusion at higher temperatures, which reduce viscosity and improve the solubility and extraction yield of polyphenols [27]. The extract maintained high antioxidant activity within the temperature range of 30 °C to 50 °C, beyond which a continuous decline was observed from 60 °C to 90 °C. The optimal extraction effect was observed at an alkali hydrolysis temperature of 50 °C. Additionally, according to Figure 2B–D, the optimal extraction conditions for BPs were a solid–liquid ratio of 1:40, a NaOH concentration of 6 mol/L, and an alkaline hydrolysis time of 2 h.
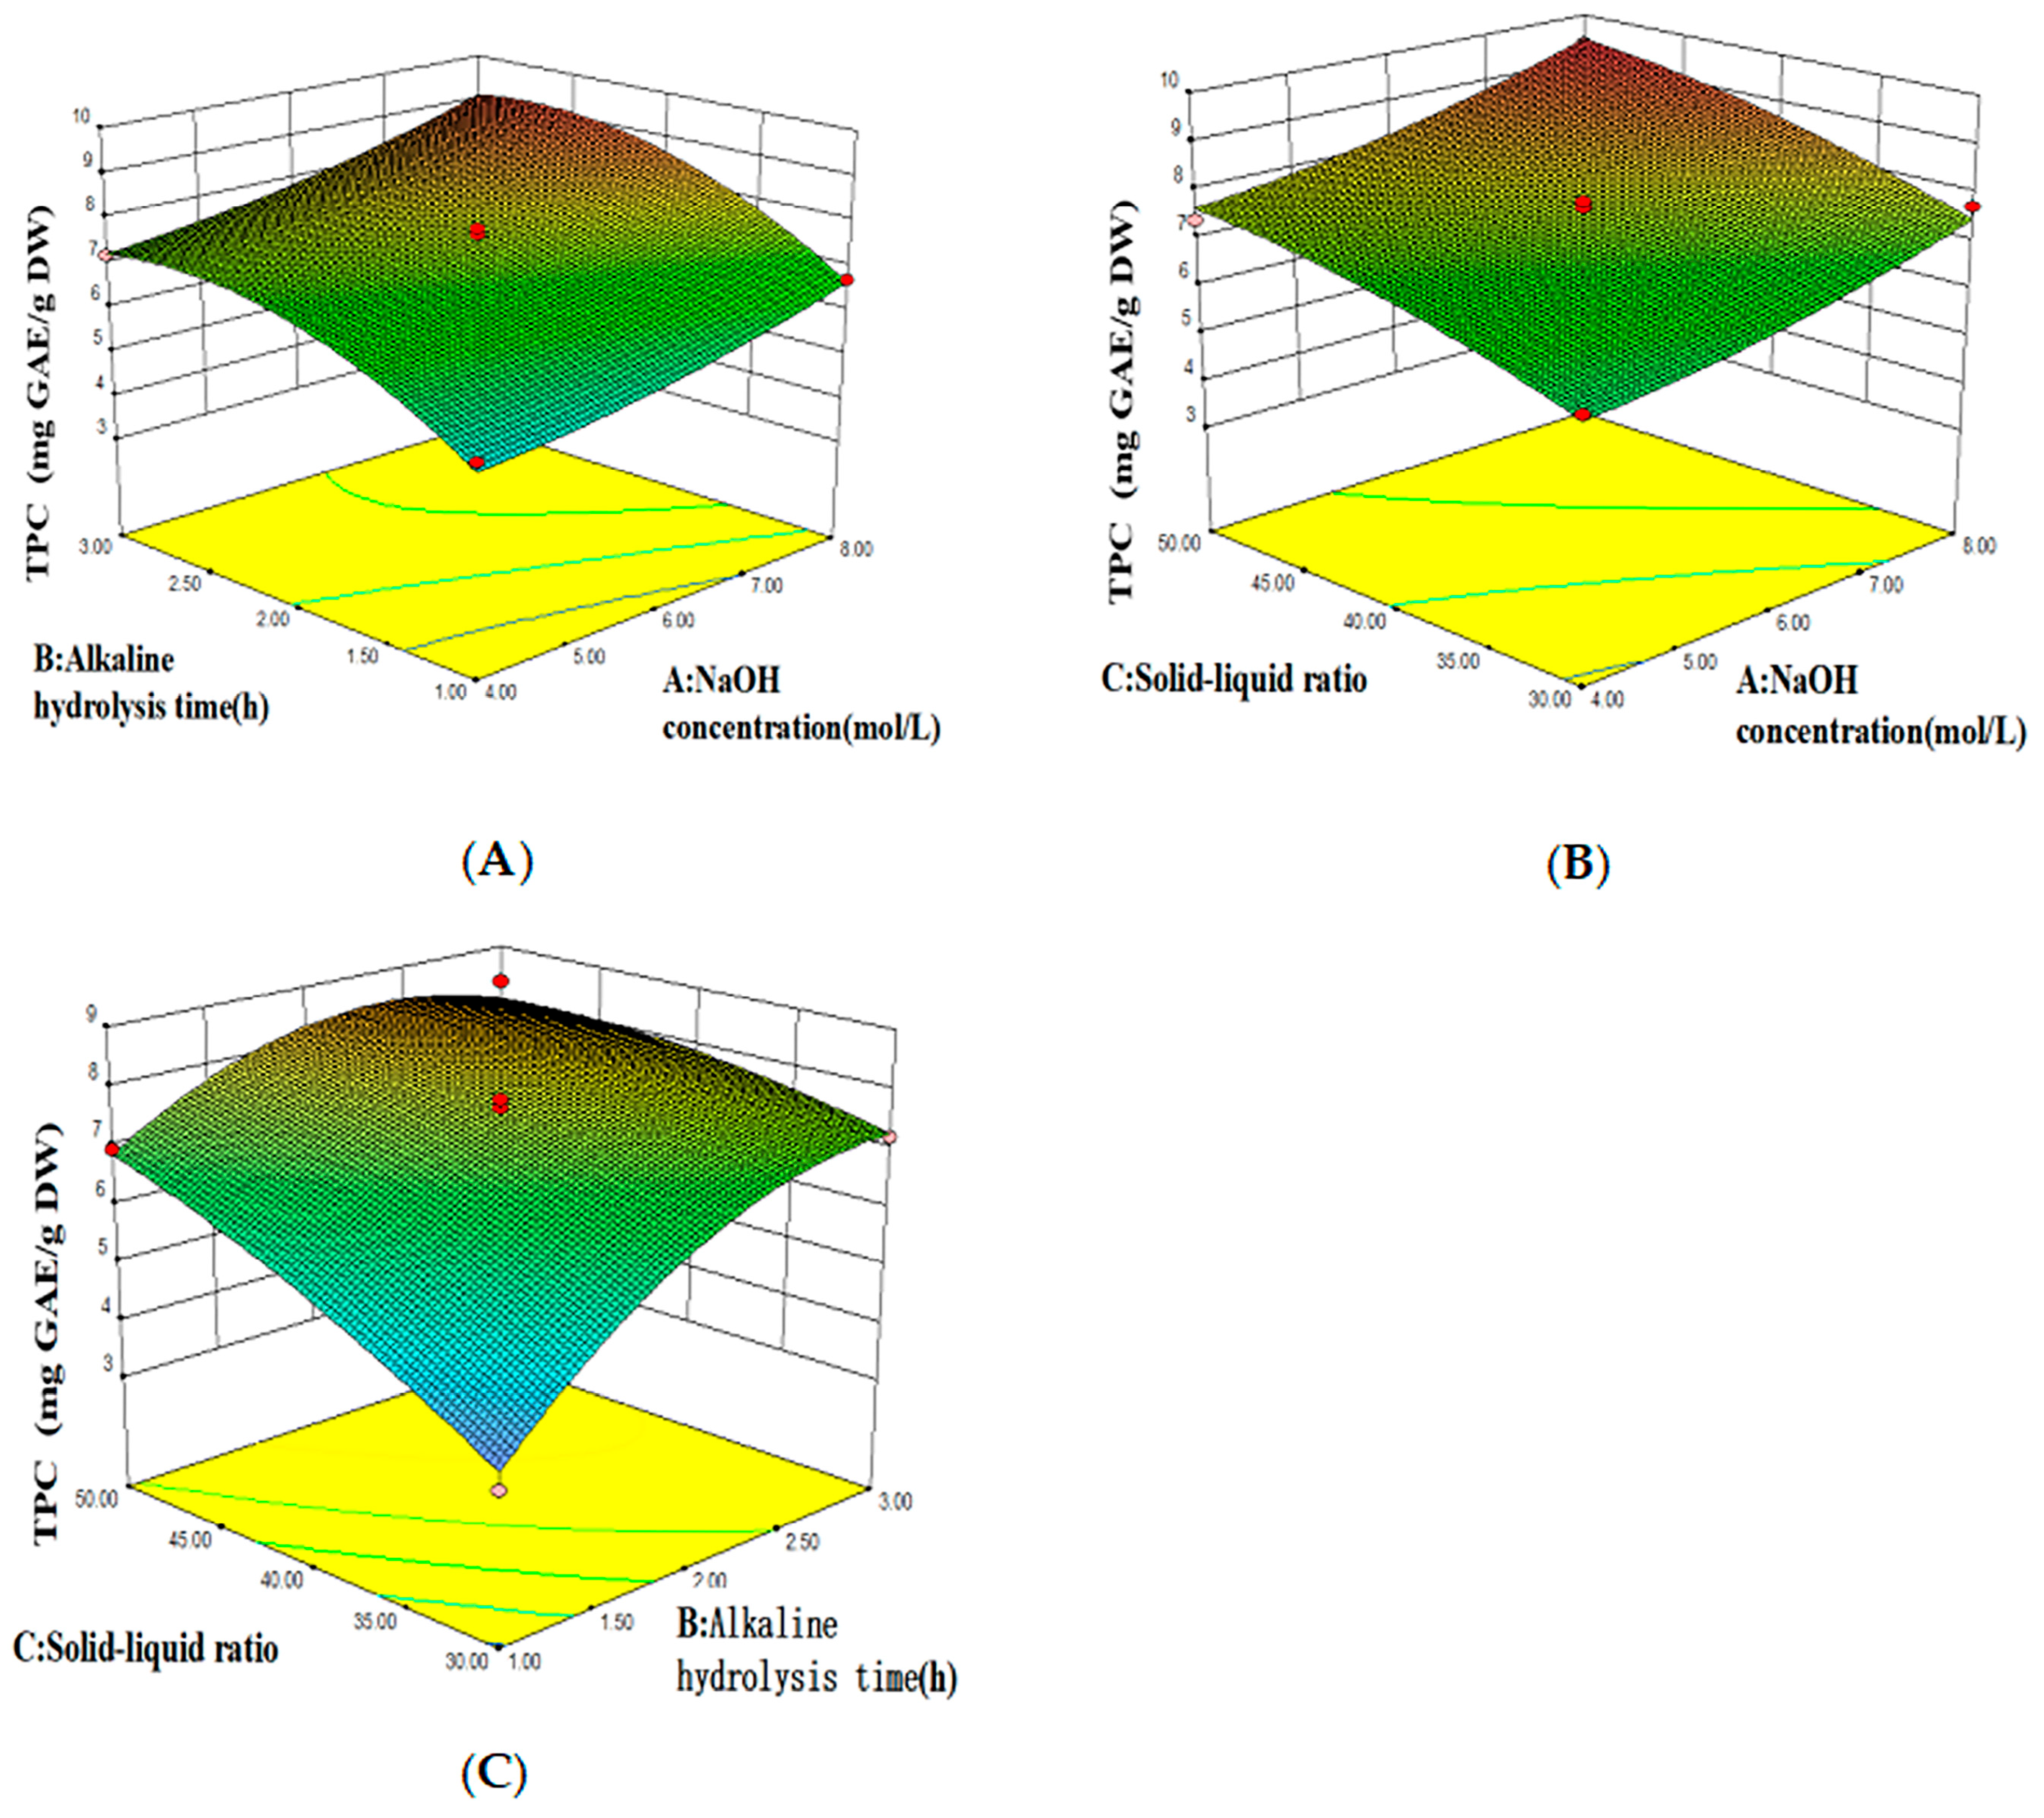
As evidenced by the ANOVA results presented in Table 4, the established model demonstrates statistical significance (p < 0.05), confirming its validity. The significance of the factors on the response value was determined to decrease in the order C > B > A. The lack-of-fit test yielded a p-value of 0.0547, indicating that the lack-of-fit error is negligible compared to the pure error. The regression model, representing the amount of BPs extracted from macroalgae residues as a function of the NaOH concentration (Figure 3A), extraction time (B), and solid-to-liquid ratio (C), is given by the following equation:
Y = −9.75 − 0.47A + 6.63B − 0.39C + 0.035AB − (3.21119E − 003) AC − 0.05541BC + 0.058A2 − 0.87B2 − (2.57172E − 003) C2
The steepness of the slope in the response surface 3D plot reflects the strength of the interaction between the two factors; a steeper slope indicates a stronger influence on the response value, while a gentler slope suggests a weaker effect [28]. Four parallel experiments were carried out. The optimal extraction rate was achieved with a solid–liquid ratio of 1:50, alkaline hydrolysis time of 2.38 h and a NaOH concentration of 8 mol/L at 50 °C. The purity of BPs was 9.34 μg GAE/mg, and 97.19% of the predicted value could be achieved.
After extracting FPs, BPs were extracted under the optimal extraction conditions. The BP content was 6.51 ± 0.45 μg GAE/mg and 1.32 ± 0.20 μg PE/mg.

3.3. Characterization of the Two Polyphenol Extracts

Characterization of Polyphenol Extracts by HPLC-ESI-QTOF-MS/MS and Comparison with MSn Data from an Online Database

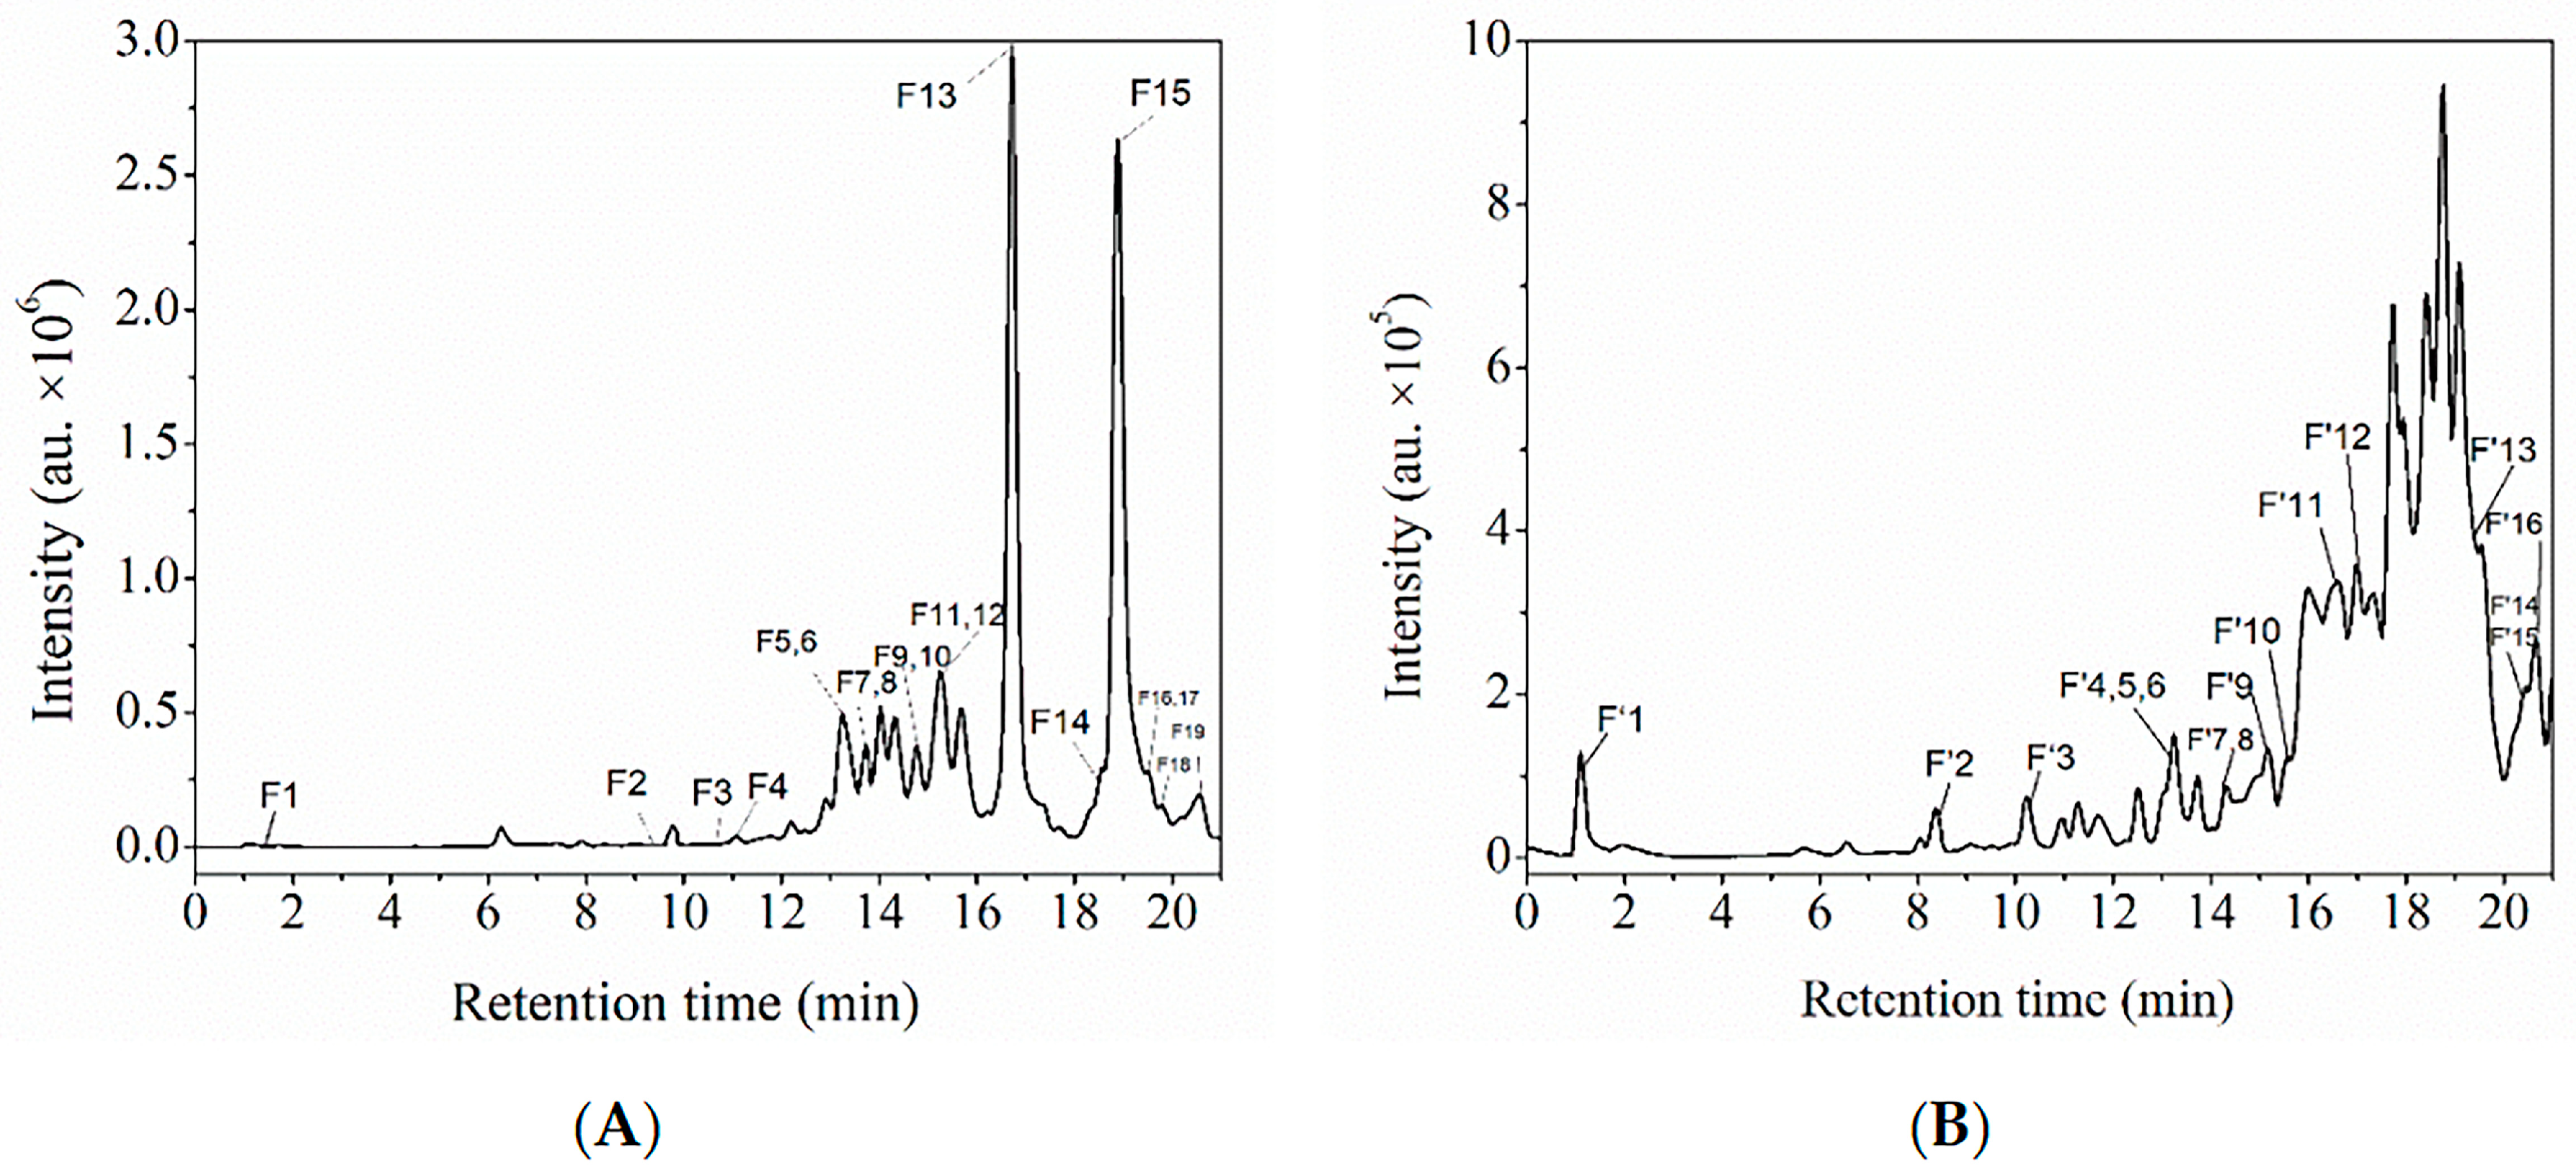
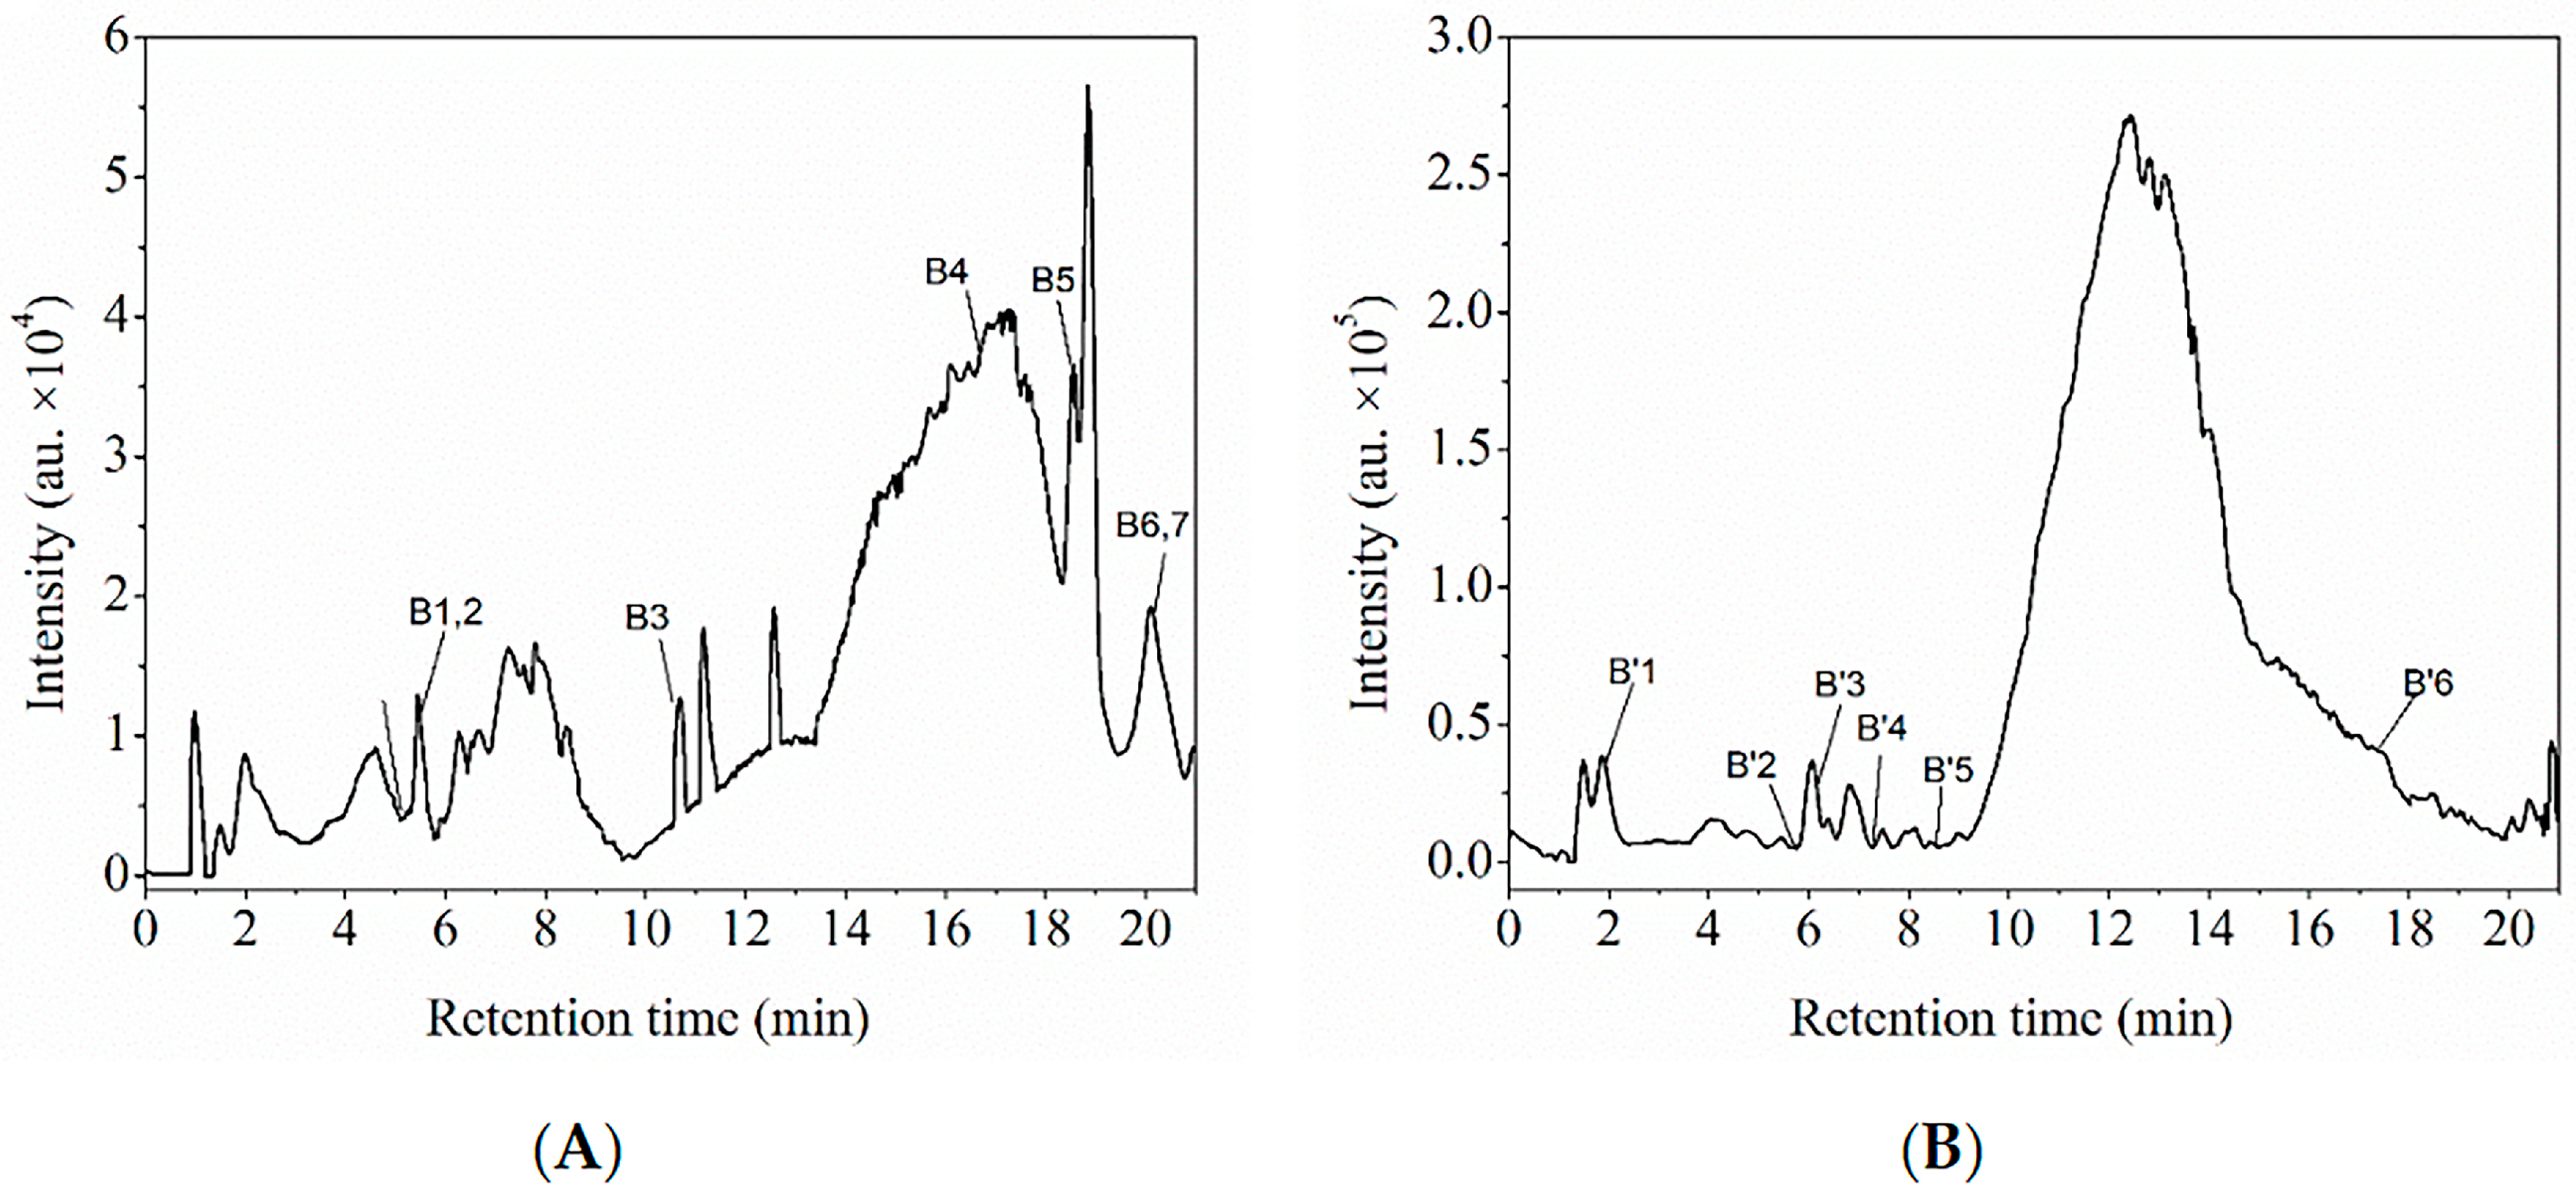
The total ion chromatograms (TICs) of FPs and BPs, obtained from the HPLC analysis, are shown in Figure 4 and Figure 5, respectively. The TIC profiles display well-resolved peaks, indicating the presence of multiple compounds in the sample. FPs were predominantly ionized in negative mode, whereas BPs were ionized in both positive and negative modes.
In this study, FPs and BPs from the macroalgae residue were analyzed using HPLC-ESI-QTOF-MS/MS and the retention times (Rt), formulae, and accurate mass spectral data were compared with online databases and the literature (Table 5). The FPs contained 14 identifiable compounds, including 1 polyhydroxy phenol, 9 flavonoids, and 4 other phenolic substances. In contrast, the BPs comprised nine compounds, consisting of five flavonoids and four other phenolic components. FPs contain more flavonoids and other substances than BPs. This difference may be attributed to the decomposition of some heat-sensitive flavonoids caused by the alkaline hydrolysis conditions in the BP extraction process [29]. The phlorotannin components in FPs and BPs were identified by matching data from the literature (Table 6). Fuhalols and eckols were identified in both FPs and BPs, but more phlorotannin species were detected in FPs. These compounds are easily detected in positive ion mode, while phenolic acids are more easily detected in negative ion mode. It may be that phlorethols were not detected in BPs because the polyhydroxy phenol group in the BPs formed an ether bond with the cell wall polysaccharide, shielding the ionization site and resulting in blocked negative ionization [30]. A comparison with published mass spectrometry data on fucoidan polyphenols showed that the polyphenols extracted from macroalgae residues were most similar to those found in Sargassum fusiforme, Sargassum muticum, Laminaria digitata, and Fucus vesiculosus.

3.4. Antioxidant Activity and Inhibitory Effect on Glycosidase Activity

Table 7 shows the differences in antioxidant capacity and glycosidase inhibition between the two polyphenols. The DPPH scavenging activity assay on the macroalgae residue revealed that the antioxidant capacity in FPs was higher (3.03 μg TE/mg) than that in BPs (1.79 μg TE/mg). The FRAP test results showed a consistent trend (FPs: 1.49 μg TE/mg vs. BPs: 1.14 μg TE/mg) in that the macroalgae residue’s antioxidant capacity is higher than that of the macroalgae edulis (0.66 ± 0.02 μg TE/mg) [31]. The high content of phenolic compounds and flavonoids was considered to be an important cause of antioxidant capacity in previous studies [32]. Therefore, FPs may exhibit better FRAP antioxidant capacity due to their high contents of flavonoid species and unique polyhydroxy phenols. The DPPH assay measures the free radical scavenging ability using the electron-providing ability, while the FRAP assay evaluates the reducing ability via electron transfer [33].
The inhibitory activity of polyphenols against α-amylase and α-glucosidase is closely related to their structural properties [34]. Experimental results revealed that FPs showed a higher capacity of glycosidase activity inhibition (α-amylase inhibition rate: 47.22%, 0.11 mg AE/mg; α-glucosidase inhibition rate: 82.85%, 21.53 μg AE/g) than BPs (α-amylase activity inhibited by 32.88%, 0.01 mg AE/mg; α-glucosidase inhibition rate: 44.71%, 0.99 μg AE/g). The α-glucosidase inhibition rate of FPs extracted from the macroalgae residue was higher than that of the Nannochloropsis oculata extract (α-glucosidase inhibition rate: 80.42%) [35]. Studies have shown that FPs’ ability to inhibit glycosidase activity is stronger than that of BPs, which is consistent with the results of this experiment [36]. Notably, the disparity in glycosidase inhibitory activity between FPs and BPs was markedly greater than that observed for their antioxidant activities, and this phenomenon may arise from the difference in hypoglycemic activity of key differential constituents between these two polyphenols [8].

4. Conclusions

The optimized alkaline hydrolysis conditions led to a high BP extraction efficiency, demonstrating the effectiveness of this method for liberating cell-wall-bound bioactive compounds. A total of 23 polyphenols were identified, with 14 species for FPs and 9 species for BPs. This compositional divergence aligns with previous reports on algal polyphenol profiles, in which flavonoids dominated the free fraction. FPs exhibited greater abundance, and they contained one additional compound, potentially leading to a superior antioxidant ability and a higher glycosidase inhibition efficacy in FPs‌. There was a strong positive correlation between TPC, antioxidant activity, and glycosidase inhibition ability. This study verified macroalgae residues as a sustainable source of bioactive polyphenols, providing a preliminary understanding of their hypoglycemic activity and emphasizing their value as underutilized resources. Future research should focus on the quantitative determination of flavonoids and on elucidating the mechanism of the hypoglycemic effect and other biological activities.

Author Contributions

Conceptualization, methodology, and writing—review and editing: X.D.; investigation and writing—original draft preparation: X.L. (Xianxian Luo); software: H.C.; investigation: J.M.; data curation: X.L. (Xinyan Li); data curation: Z.W.; validation and project administration: Y.J. All authors have read and agreed to the published version of the manuscript.

Funding

This research was funded by the Yunnan Provincial Education Department Science Research Fund Project under grant number 2025J0809 and the Yunnan Provincial Science and Technology Department Basic Research Program under grant number 202501AU070182.

Data Availability Statement

The original contributions presented in this study are included in the article. Further inquiries can be directed to the corresponding author.

Acknowledgments

The authors gratefully acknowledge the Qingdao Mingyue Seaweeds Group Co., Ltd. for generously providing the macroalgae residues used in this study. Their support was essential for the completion of this research. We also appreciate the anonymous reviewers for their constructive comments. The authors have reviewed and edited the output and take full responsibility for the content of this publication.

Conflicts of Interest

The authors declare no conflicts of interest.

References

  1. Besednova, N.N.; Andryukov, B.G.; Zaporozhets, T.S.; Kryzhanovsky, S.P.; Kuznetsova, T.A.; Fedyanina, L.N.; Makarenkova, I.D.; Zvyagintseva, T.N. Algae Polyphenolic Compounds and Modern Antibacterial Strategies: Current Achievements and Immediate Prospects. Biomedicines 2020, 8, 342. [Google Scholar] [CrossRef] [PubMed]
  2. Kumari, A.; Garima; Bharadvaja, N. A Comprehensive Review on Algal Nutraceuticals as Prospective Therapeutic Agent for Different Diseases. 3 Biotech 2023, 13, 44. [Google Scholar] [CrossRef]
  3. Alves, C.; Silva, J.; Pinteus, S.; Gaspar, H.; Alpoim, M.C.; Botana, L.M.; Pedrosa, R. From Marine Origin to Therapeutics: The Antitumor Potential of Marine Algae-Derived Compounds. Front. Pharmacol. 2018, 9, 777. [Google Scholar] [CrossRef] [PubMed]
  4. Barbalace, M.C.; Malaguti, M.; Giusti, L.; Lucacchini, A.; Hrelia, S.; Angeloni, C. Anti-Inflammatory Activities of Marine Algae in Neurodegenerative Diseases. Int. J. Mol. Sci. 2019, 20, 3061. [Google Scholar] [CrossRef] [PubMed]
  5. Abo-Shady, A.M.; Gheda, S.F.; Ismail, G.A.; Cotas, J.; Pereira, L.; Abdel-Karim, O.H. Antioxidant and Antidiabetic Activity of Algae. Life 2023, 13, 460. [Google Scholar] [CrossRef]
  6. Dong, R.; Yu, Q.; Liao, W.; Liu, S.; He, Z.; Hu, X.; Chen, Y.; Xie, J.; Nie, S.; Xie, M. Composition of Bound Polyphenols from Carrot Dietary Fiber and Its in Vivo and in Vitro Antioxidant Activity. Food Chem. 2021, 339, 127879. [Google Scholar] [CrossRef]
  7. Zhang, X.; Zhu, K.; Xie, J.; Chen, Y.; Tan, L.; Liu, S.; Dong, R.; Zheng, Y.; Yu, Q. Optimization and Identification of Non-Extractable Polyphenols in the Dietary Fiber of Jackfruit (Artocarpus heterophyllus Lam.) Pulp Released by Alkaline, Acid and Enzymatic Hydrolysis: Content, Composition and Antioxidant Activities. LWT 2021, 138, 110400. [Google Scholar] [CrossRef]
  8. Zheng, Y.; Liu, S.; Xie, J.; Chen, Y.; Dong, R.; Zhang, X.; Liu, S.; Xie, J.; Hu, X.; Yu, Q. Antioxidant, α-Amylase and α-Glucosidase Inhibitory Activities of Bound Polyphenols Extracted from Mung Bean Skin Dietary Fiber. LWT 2020, 132, 109943. [Google Scholar] [CrossRef]
  9. Suwal, S.; Perreault, V.; Marciniak, A.; Tamigneaux, É.; Deslandes, É.; Bazinet, L.; Jacques, H.; Beaulieu, L.; Doyen, A. Effects of High Hydrostatic Pressure and Polysaccharidases on the Extraction of Antioxidant Compounds from Red Macroalgae, Palmaria Palmata and Solieria Chordalis. J. Food Eng. 2019, 252, 53–59. [Google Scholar] [CrossRef]
  10. Anjana, K.; Arunkumar, K. Brown Algae Biomass for Fucoxanthin, Fucoidan and Alginate; Update Review on Structure, Biosynthesis, Biological Activities and Extraction Valorisation. Int. J. Biol. Macromol. 2024, 280, 135632. [Google Scholar] [CrossRef]
  11. Chapman, R.L. Algae: The World’s Most Important “Plants”—An Introduction. Mitig. Adapt. Strateg. Glob. Chang. 2013, 18, 5–12. [Google Scholar] [CrossRef]
  12. AlgaeBase. Available online: https://www.algaebase.org/ (accessed on 15 August 2025).
  13. Zheng, H.; Zhao, Y.; Guo, L. A Bioactive Substance Derived from Brown Seaweeds: Phlorotannins. Mar. Drugs 2022, 20, 742. [Google Scholar] [CrossRef]
  14. González-Arceo, M.; Gómez-Zorita, S.; Aguirre, L.; Portillo, M.P. Effect of Microalgae and Macroalgae Extracts on Non-Alcoholic Fatty Liver Disease. Nutrients 2021, 13, 2017. [Google Scholar] [CrossRef]
  15. Murray, M.; Dordevic, A.L.; Ryan, L.; Bonham, M.P. An Emerging Trend in Functional Foods for the Prevention of Cardiovascular Disease and Diabetes: Marine Algal Polyphenols. Crit. Rev. Food Sci. Nutr. 2018, 58, 1342–1358. [Google Scholar] [CrossRef] [PubMed]
  16. Cotas, J.; Leandro, A.; Monteiro, P.; Pacheco, D.; Figueirinha, A.; Gonçalves, A.M.M.; Da Silva, G.J.; Pereira, L. Seaweed Phenolics: From Extraction to Applications. Mar. Drugs 2020, 18, 384. [Google Scholar] [CrossRef] [PubMed]
  17. Pereira, A.P.; Woodman, T.J.; Chuck, C.J. An Integrated Biorefinery to Produce 5-(Hydroxymethyl)Furfural and Alternative Fuel Precursors from Macroalgae and Spent Coffee Grounds. Sustain. Energy Fuels 2021, 5, 6189–6196. [Google Scholar] [CrossRef]
  18. Kumar, S.; Sahoo, D. A Comprehensive Analysis of Alginate Content and Biochemical Composition of Leftover Pulp from Brown Seaweed Sargassum Wightii. Algal Res. 2017, 23, 233–239. [Google Scholar] [CrossRef]
  19. Pereira, L. Macroalgae. Encyclopedia 2021, 1, 177–188. [Google Scholar] [CrossRef]
  20. Singleton, Y.I.; Rossi, J.A. Colorimetry of Total Phenolics with Phosphomolybdic-Phosphotungstic Acid Reagents | American Journal of Enology and Viticulture. Available online: https://www.ajevonline.org/content/16/3/144 (accessed on 12 March 2025).
  21. Marić, B.; Abramović, B.; Ilić, N.; Bodroža-Solarov, M.; Pavlić, B.; Oczkowski, M.; Wilczak, J.; Četojević-Simin, D.; Šarić, L.; Teslić, N. UHPLC-Triple-TOF-MS Characterization, Antioxidant, Antimicrobial and Antiproliferative Activity of Raspberry (Rubus Idaeus L.) Seed Extracts. Foods 2022, 12, 161. [Google Scholar] [CrossRef]
  22. Yamauchi, M.; Kitamura, Y.; Nagano, H.; Kawatsu, J.; Gotoh, H. DPPH Measurements and Structure—Activity Relationship Studies on the Antioxidant Capacity of Phenols. Antioxidants 2024, 13, 309–325. [Google Scholar] [CrossRef]
  23. Quan, N.; Wang, Y.-D.; Li, G.-R.; Liu, Z.-Q.; Feng, J.; Qiao, C.-L.; Zhang, H.-F. Ultrasound-Microwave Combined Extraction of Novel Polysaccharide Fractions from Lycium Barbarum Leaves and Their In Vitro Hypoglycemic and Antioxidant Activities. Molecules 2023, 28, 3880. [Google Scholar] [CrossRef] [PubMed]
  24. Liu, L.; Jia, W.; Jiang, S.; Zhang, G.; Zhao, J.; Xu, J.; Wang, L.; Wu, D.; Tao, J.; Yue, H.; et al. Inhibitory Activities and Rules of Plant Gallotannins with Different Numbers of Galloyl Moieties on Sucrase, Maltase and α-Amylase In Vitro and In Vivo. Phytomedicine 2023, 120, 155063. [Google Scholar] [CrossRef] [PubMed]
  25. Zhao, Y.; Gong, Y.; Wang, D.; Fan, L.; Zhao, X. Changes in Phenols, Antioxidant Ability, in Vitro Hypoglycemic Activity of Flos Sophorae Immaturus During Different Drying Methods. J. Food Meas. Charact. 2024, 18, 8540–8554. [Google Scholar] [CrossRef]
  26. Yang, Q.; Gu, C.; Zhang, X.; Hu, X.; Li, M.; Guan, W.; Kong, Y.; Gao, H. The Research on Metabolomics Mechanism of Calcium Ion-Induced Whole Black Bean Polyphenols and Biological Activities. LWT 2024, 195, 115851. [Google Scholar] [CrossRef]
  27. Emire, S.A.; Hagos, A.D.; Eun, J.B.; Dadi, D.W. Effect of Ultrasound-Assisted Extraction of Moringa Stenopetala Leaves on Bioactive Compounds and Their Antioxidant Activity. Food Technol. Biotechnol. 2019, 57, 77–86. [Google Scholar] [CrossRef]
  28. Fan, K.; Yang, X.; Zhou, C.; Mei, X.; Yang, X.; Fu, Q.; Li, Y.; Lin, Y.; Yang, C. Optimization of the Extraction Process of Polyphenols from Allium Cepa Using Response Surface Methodology and Assessment of Its Antioxidant and Lipid-Lowering Action. J. Food Meas. Charact. 2022, 16, 1171–1183. [Google Scholar] [CrossRef]
  29. Kabir, M.S.; Kanan, M.K.A.; Ahmed, J.; Hossain, M.A.; Akter, M.S.; Ahmed, K.S.; Hossain, H.; Alam, M.; Mozumder, N.H.M.R.; Ahmed, M. Free and Insoluble-Bound Phenolic Compounds in Parboiled and Non-Parboiled Rice (Oryza sativa L): Impact of Hydrothermal Treatments. LWT 2025, 228, 118091. [Google Scholar] [CrossRef]
  30. Zhuang, J.; Dai, X.; Zhu, M.; Zhang, S.; Dai, Q.; Jiang, X.; Liu, Y.; Gao, L.; Xia, T. Evaluation of Astringent Taste of Green Tea through Mass Spectrometry-Based Targeted Metabolic Profiling of Polyphenols. Food Chem. 2020, 305, 125507. [Google Scholar] [CrossRef]
  31. Kumar, Y.; Singhal, S.; Tarafdar, A.; Pharande, A.; Ganesan, M.; Badgujar, P.C. Ultrasound Assisted Extraction of Selected Edible Macroalgae: Effect on Antioxidant Activity and Quantitative Assessment of Polyphenols by Liquid Chromatography with Tandem Mass Spectrometry (LC-MS/MS). Algal Res. 2020, 52, 102114. [Google Scholar] [CrossRef]
  32. Yu, X.; Shao, F.; Zhang, J.; Long, Y.; Dong, W. The Composition and Bioactivity of Bound Polyphenols from Coffee Dietary Fiber During in Vitro Simulating Digestion. Food Res. Int. 2025, 199, 115390. [Google Scholar] [CrossRef]
  33. Rumpf, J.; Burger, R.; Schulze, M. Statistical Evaluation of DPPH, ABTS, FRAP, and Folin-Ciocalteu Assays to Assess the Antioxidant Capacity of Lignins. Int. J. Biol. Macromol. 2023, 233, 123470. [Google Scholar] [CrossRef]
  34. Xiao, J.; Mao, F.; Yang, F.; Zhao, Y.; Zhang, C.; Yamamoto, K. Interaction of Dietary Polyphenols with Bovine Milk Proteins: Molecular Structure–Affinity Relationship and Influencing Bioactivity Aspects. Mol. Nutr. Food Res. 2011, 55, 1637–1645. [Google Scholar] [CrossRef]
  35. Deepa, P.K.; Subramanian, A.; Manjusha, W.A. Phytochemical Screening and Evaluation of Antidiabetic Activity of the Marine Microalgae: Nannochloropsis Sp.: Life Sciences-Marine Biology for Medical Therapy. Int. J. Life Sci. Pharma Res. 2022, 10, L36–L40. [Google Scholar] [CrossRef]
  36. Xing, M.; Xie, F.; Wang, G.; Yuan, C.; Huang, S.; Zhou, T.; Song, Z.; Ai, L. The Inhibitory Effects of Free and Bound Phenolics from Phyllanthus Emblica Linn. on α-Amylase: A Comparison Study. J. Sci. Food Agric. 2024, 104, 9719–9728. [Google Scholar] [CrossRef]
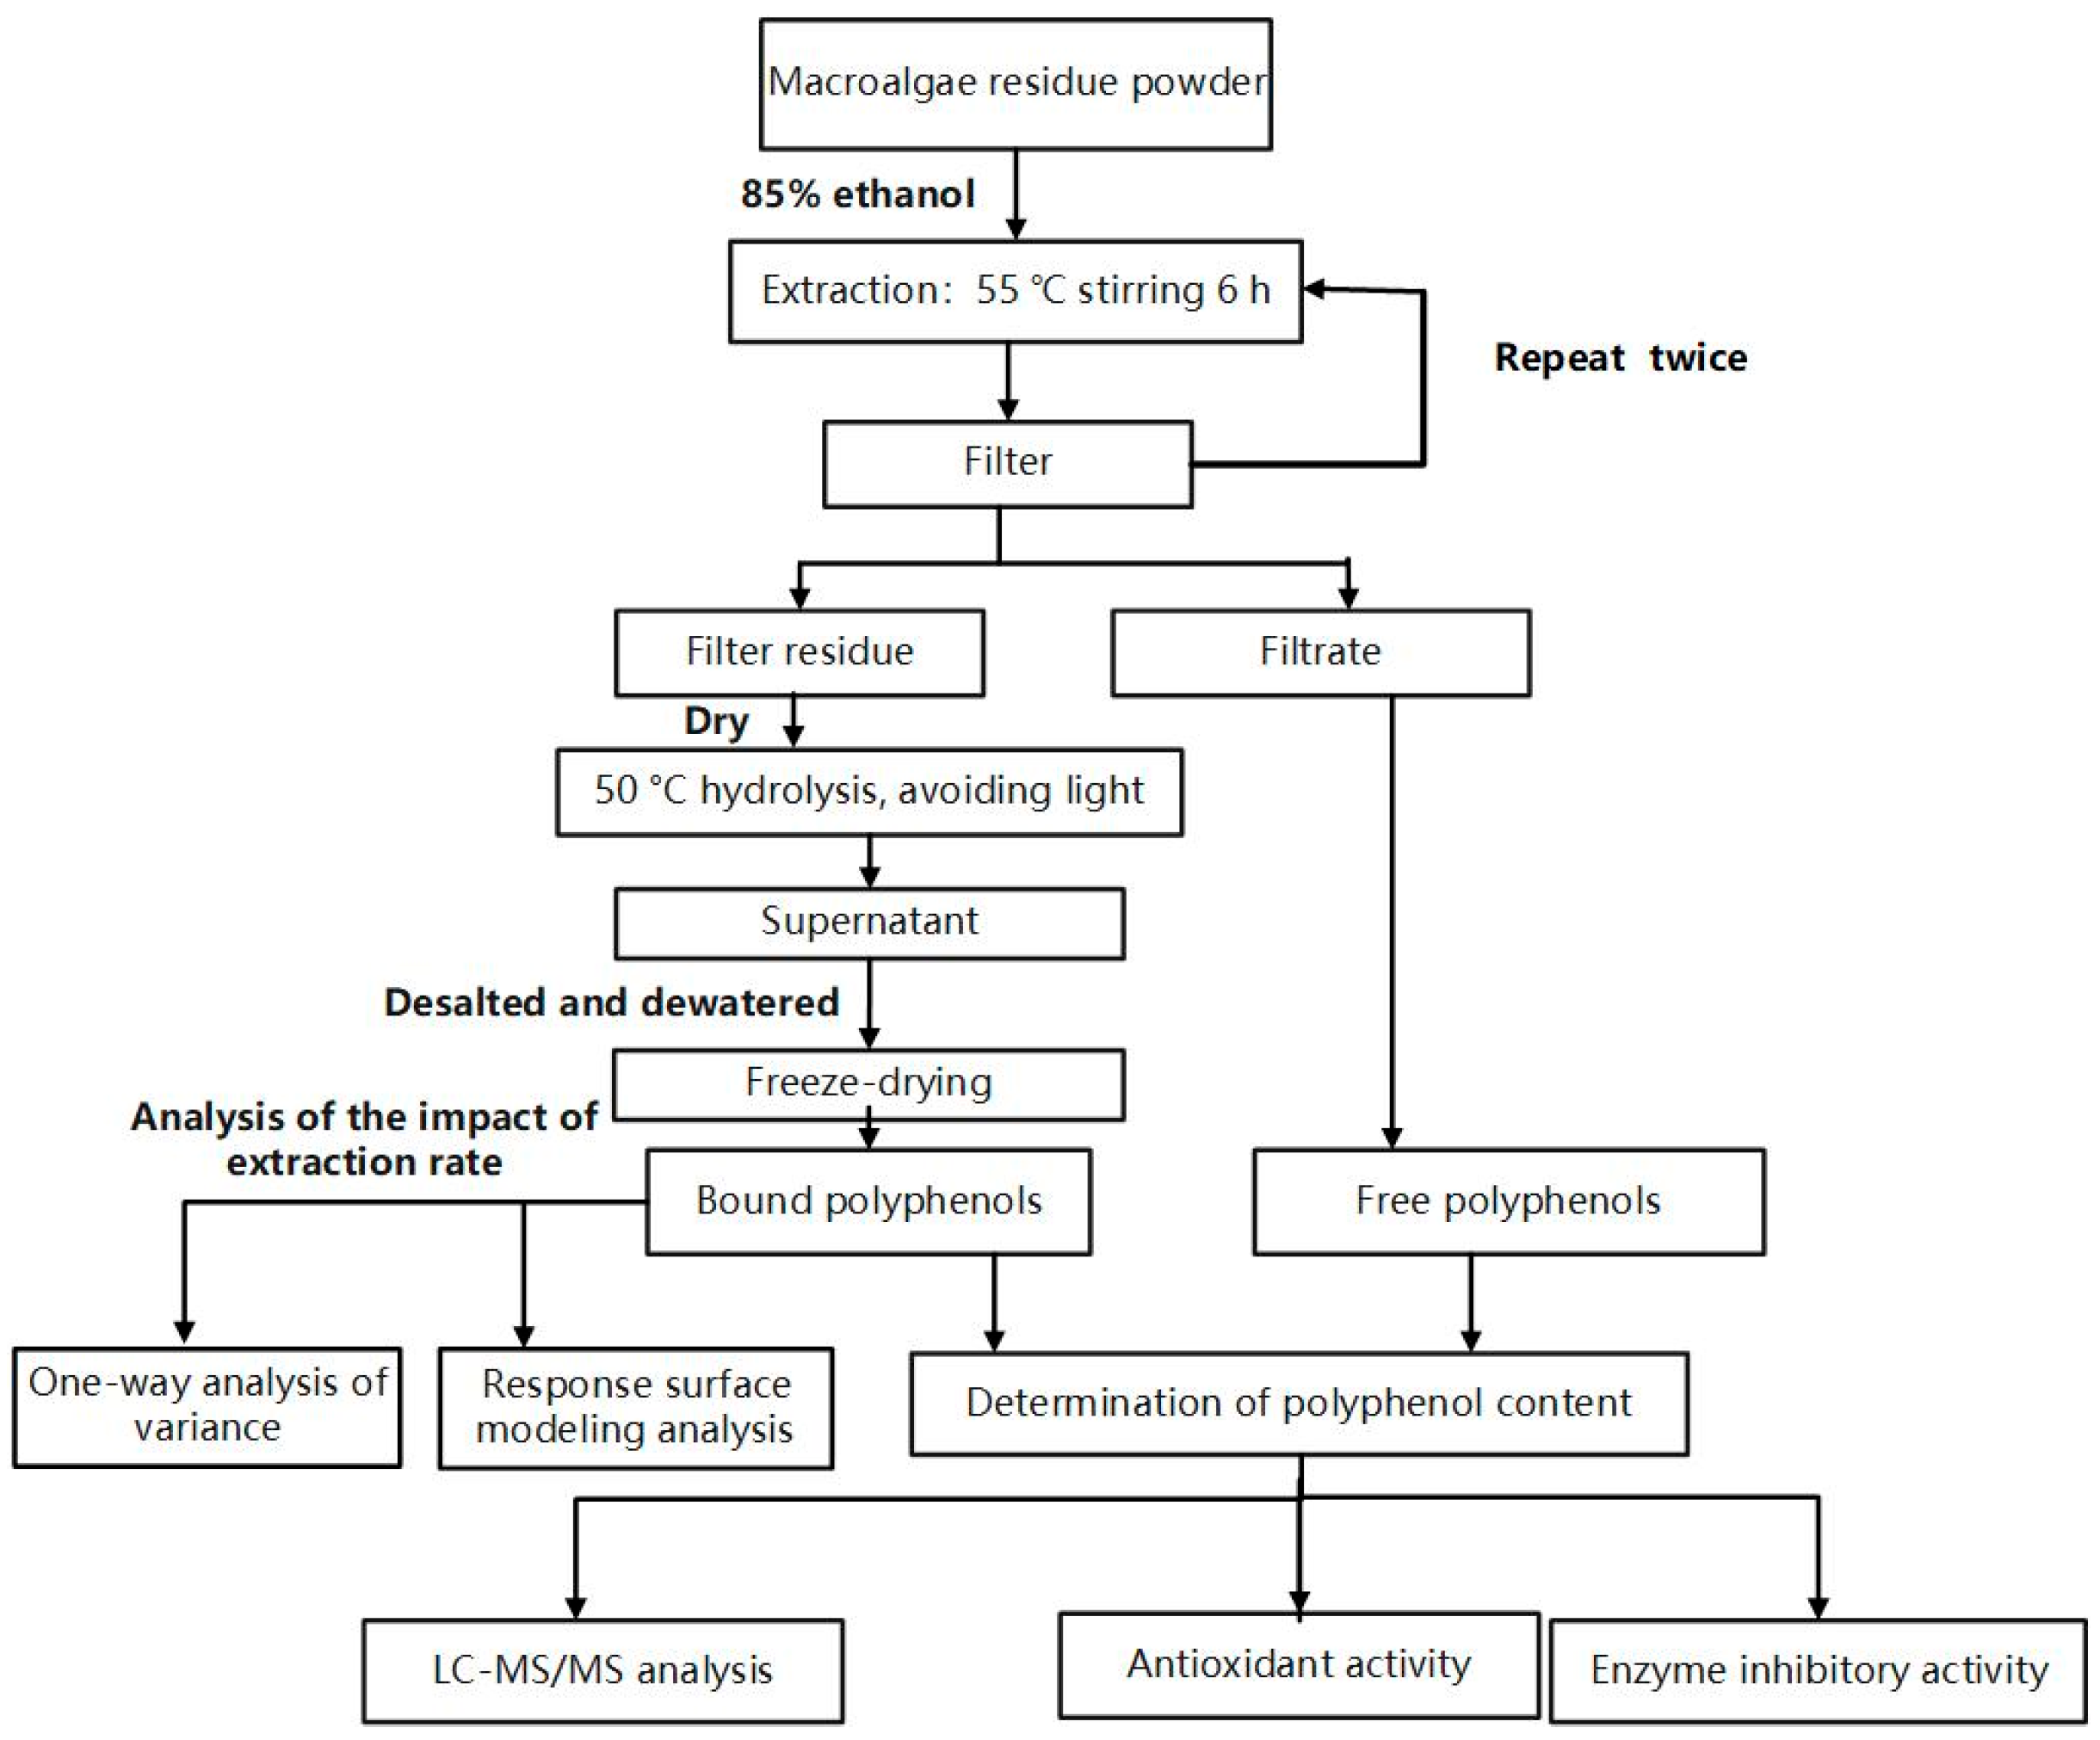
Figure 1. Technical flowchart.
Foods 14 03055 g001
Figure 2. The effect of various factors on BP extraction from the macroalgae residue. The effects of temperature on BP content and antioxidant equivalents extracted from macroalgae residue through alkaline hydrolysis (4 mol/L NaOH, 1 h, and a 1:40 solid–liquid ratio). (A) The effects of NaOH concentration on BP content extracted from the macroalgae residue through alkaline hydrolysis (1 h, 50 °C, and a 1:40 solid–liquid ratio). (B) The effects of extract time on BP content extracted from the macroalgae residue through alkaline hydrolysis (4 mol/L NaOH, 50 °C, and a 1:40 solid–liquid ratio). (C) The effects of the solid–liquid ratio on BP content extracted from the macroalgae residue through alkaline hydrolysis (4 mol/L NaOH, 50 °C, and 1 h). (D). Note: Different superscript characters reveal the significant differences (p < 0.05).
Foods 14 03055 g002
Figure 3. Response surface plot of variables and their mutual interactions. Contour plots of cross-interaction between NaOH concentration and (A) alkaline hydrolysis time and (B) the solid–liquid ratio and (C) between the alkaline hydrolysis time and the solid–liquid ratio.
Foods 14 03055 g003
Figure 4. HPLC chromatograms of FPs from the macroalgae residue in the positive (A) and negative (B) ion modes.
Foods 14 03055 g004
Figure 5. HPLC chromatograms of BPs from the macroalgae residue in the positive (A) and negative (B) ion modes.
Foods 14 03055 g005
Table 1. Single-factor experimental scheme.
No.Liquid–Solid RatioNaOH Concentration (mol/L)Alkaline Hydrolysis Time (h)Alkaline Hydrolysis Temperature (°C)
11:404130, 40, 50, 60, 70, 80, 90
21:402, 4, 6, 8, 10150
31:4041, 2, 3, 4, 550
41:10, 1:20, 1:30, 1:40, 1:504250
Table 2. Factors and levels of the RSM.
LevelA: NaOH Concentration (mol/L)B: Alkaline Hydrolysis (h)C: Liquid–Solid Ratio
−1411:30
0621:40
1831:50
Table 3. The design and results of the Box–Behnken experiments.
No.NaOH ConcentrationAlkaline Hydrolysis Time (B)Liquid–Solid Ratio (C)Total Polyphenol
Content (Y)
14 (−1)1 (−1)40 (0)5.27
28 (1)1 (−1)40 (0)6.69
34 (−1)3 (1)40 (0)7.18
48 (1)3 (1)40 (0)8.88
54 (−1)2 (0)30 (−1)5.98
68 (1)2 (0)30 (−1)7.72
74 (−1)2 (0)50 (1)7.38
88 (1)2 (0)50 (1)9.38
96 (0)1 (−1)30 (−1)3.57
106 (0)3 (1)30 (−1)7.20
116 (0)1 (−1)50 (1)6.94
126 (0)3 (1)50 (1)8.35
136 (0)2 (0)40 (0)7.49
146 (0)2 (0)40 (0)7.67
156 (0)2 (0)40 (0)7.80
166 (0)2 (0)40 (0)7.60
Table 4. Variance analysis of the model.
SourceSum of SquaresDegree of FreedomMean SquareF-Valuep-Value Significant
Model28.2793.1439.540.0001**
A5.8715.8773.860.0001**
B10.44110.44131.48<0.0001**
C7.1917.1990.54<0.0001**
AB0.01910.0190.240.6409
AC0.01610.0160.210.6646
BC1.2311.2315.470.0077**
A20.2210.222.730.1496*
B23.0213.0237.980.0008**
C20.2610.263.330.1178
Residual0.4860.079
Lack of fit0.4330.148.670.0547
Pure error0.04930.016
Cor. total28.7415
Note: ** indicates p < 0.01, which means a highly significant difference; * indicates p < 0.05, which means a significant difference.
Table 5. Characterization of polyphenol extracts via HPLC-ESI-QTOF-MS/MS and comparison with MSn data from an online database.
IdentityFormulaRetention Time (min)Addition Ionm/zReference (m/z)Peak
Free Polyphenols
Polyhydroxybenzene
5-{8(Z),11(Z)-pentadecadienyl}resorcinolC21H32O214.0939[M−H]315.3153315.3175F′8
Flavonoids
6,8-dihydroxy-2,2,4,4-tetramethyl-7-(3-methylbutanoyl)-9-(2-methylpropyl)-9H-xanthene-1,3-dioneC26H34O620.41[M−H]441.3863441.3867F′15
5-O-methylgenisteinC16H12O516.68[M−H]283.3203283.3212F′11
Epiafzelechin (2R,3R)(-)C15H14O59.148[M−H]273.1768273.1747F′2
5-hydroxy-2′,4′,7,8-tetramethoxyflavoneC19H18O720.18[M−H]339.3171339.3141F′14
7,4′-dimethoxysoflavoneC17H14O420.65[M−H]281.3031281.2998F′16
CatechinC15H14O61.25[M−H]289.127289.1219F′1
3-[(Z)-heptadec-10-enyl]benzene-1,2-diolC23H38O215.65[M−H]345.2745345.2799F′10
NeobavaisoflavoneC20H18O410.64[M+H]+345.1133345.11F3
2′′-O-rhamnosyl icariside II C33H40O1415.4[M+H]+683.2292683.23F12
Others
FraxinC16H18O1014.82[M+H]+409.0553409.0532F10
α-TochopherolC29H50O215.33[M−H]429.3738429.3738F′9
EsculinC15H16O91.4[M+H]+363.0636363.06F1
2-hydroxy-6-pentadecylbenzoic acid C22H36O313.53[M−H]347.2638347.258F′6
Bound polyphenols
Flavonoids
2′,5′-dihydroxy-4-methoxychalconeC16H14O48.52[M−H]269.1664269.1674B′5
5-O-methylgenisteinC16H12O517.35[M−H]283.3191283.3212B′6
Quercetin 3,7-dimethyl etherC17H14O71.88[M−H]329.0576329.062B′7
Licoflavone AC20H18O410.69[M+Na]+345.1138345.11B3
LicoricidinC26H32O520.79[M+H]+447.2125447.21B7
Others
JugloneC10H6O35.03[M+H]+212.9939212.9949B1
Alpha-estradiol C18H24O25.58[M+H]+255.1714255.1744B2
3-methoxy-2-(3-methylbut-2-enyl)-5-pentylphenol C17H26O26.15[M−H]261.1752261.1783B′3
Atalaphylline C23H25NO47.28[M−H]378.2395378.2336B′4
Table 6. Characterization of polyphenol extracts via by HPLC-ESI-QTOF-MS/MS and comparison with MSn data from the literature.
IdentityAddition IonMeasured Mass (m/z)MS/MS Fragment Detected (m/z)Algae SourcePeak
Free polyphenols
Fuhalols
2-(1)[M+H]+267.2141Sargassum fusiformeF5
3-(1)[M+H]+391.3125Sargassum fusiformeF6
5-(1)[M+H]+639.3388Sargassum fusiformeF17
5-(2)[M+H]+655.3527, 389Sargassum fusiformeF8
6-(3)[M+H]+795.3667Sargassum fusiformeF14
Dihydroxytetrafuhalol[M+H]+547.4529Sargassum muticumF11
Dihydroxypentafuhalol[M+H]+671.3625, 623, 607, 527, 465, 402, 341, and 263Sargassum muticumF4
Dihydroxyhexafuhalol[M+H]+795.3777, 749, 731, 653, and 465Sargassum muticumF14
Pentafuhalol[M+H]+639.3621, 513, 385, and 373Sargassum muticumF15
Hydroxytetrafuhalol[M+H]+655.3637, 527, and 389Sargassum muticumF8
Bifuhalol trimer[M+H]+795.3515Carpophyllum flexuosumF14
Octafuhalol[M+H]+1011.7621Sargassum muticumF7
nd[M+H]+653.3607 and 465Laminaria digitataF16
nd[M+H]+653.3607 and 465Laminaria digitataF18
Dihydroxypentafuhalol[M−H]669.6625Sargassum muticumF′13
Dihydroxyhexafuhalol[M−H]793.6465Sargassum muticumF′12
Hydroxytrifuhalol[M−H]405.2154Carpophyllum flexuosumF′3
Eckols
3-(1)[M+H]+389.2329, 245, and 123Sargassum fusiformeF2
Eckol[M−H]371.2335Sargassum fusiformeF′7
Eckol derivative[M−H]401.3371Fucus vesiculosusF′5
Others
Tetramer[M+H]+499.4481 and 233Fucus vesiculosusF9
Fucol[M+H]+623.3495, 479, 461, 373, and 355Laminaria digitataF13
Pentaphlorethol[M+H]+623.3603 and 493Sargassum muticumF19
Pentamer[M+H]+623.3605, 497, 434, and 356Fucus vesiculosusF13
Phlorethol[M−H]745.5477Laminaria digitataF′4
Bound polyphenols
Fuhalols
3-(1)[M+H]+391.3123Sargassum fusiformeB5
6-(3)[M+H]+795.5667 and 389Sargassum fusiformeB6
Dihydroxyhexafuhalol[M+H]+795.5777, 749, 731, 513, 511, 485, 483, and 385Sargassum muticumB6
Trifuhalol[M+H]+391.3251Sargassum muticumB5
Bifuhalol trimer[M+H]+795.5515 and 261Carpophyllum flexuosumB6
Eckols
6-(3)[M+H]+793.5747 and 385Sargassum fusiformeB4
2-(1)[M−H]263.2245 and 219Sargassum fusiformeB′2
Others
Fucol[M+H]+623.3477 and 371Fucus vesiculosusB4
Fucophlorethol[M+H]+623.3461, 373, and 355Fucus vesiculosusB4
Pentaphlorethol[M+H]+623.3493Sargassum muticumB4
5[M+H]+623.3605, 373, 356, 355, and 340Sargassum muticumB4
Table 7. Comparison chart of antioxidant and enzyme inhibitory activity.
Polyphenol TypeDPPH
(μg TE/mg)
FRAP
(μg TE/mg)
Anti-Amylase
(mg AE/mg)
Anti-Glucosidase
(μg AE/g)
Free3.0319.400.1121.53
Bound1.797.430.010.99
Disclaimer/Publisher’s Note: The statements, opinions and data contained in all publications are solely those of the individual author(s) and contributor(s) and not of MDPI and/or the editor(s). MDPI and/or the editor(s) disclaim responsibility for any injury to people or property resulting from any ideas, methods, instructions or products referred to in the content.