
Eutectic Mixtures Based on Oleic Acid and Pulsed Electric Fields: A Strategy for the Extraction of Astaxanthin from Dry Biomass of Xanthophyllomyces dendrorhous

 , , and
Abstract

1. Introduction
2. Materials and Methods
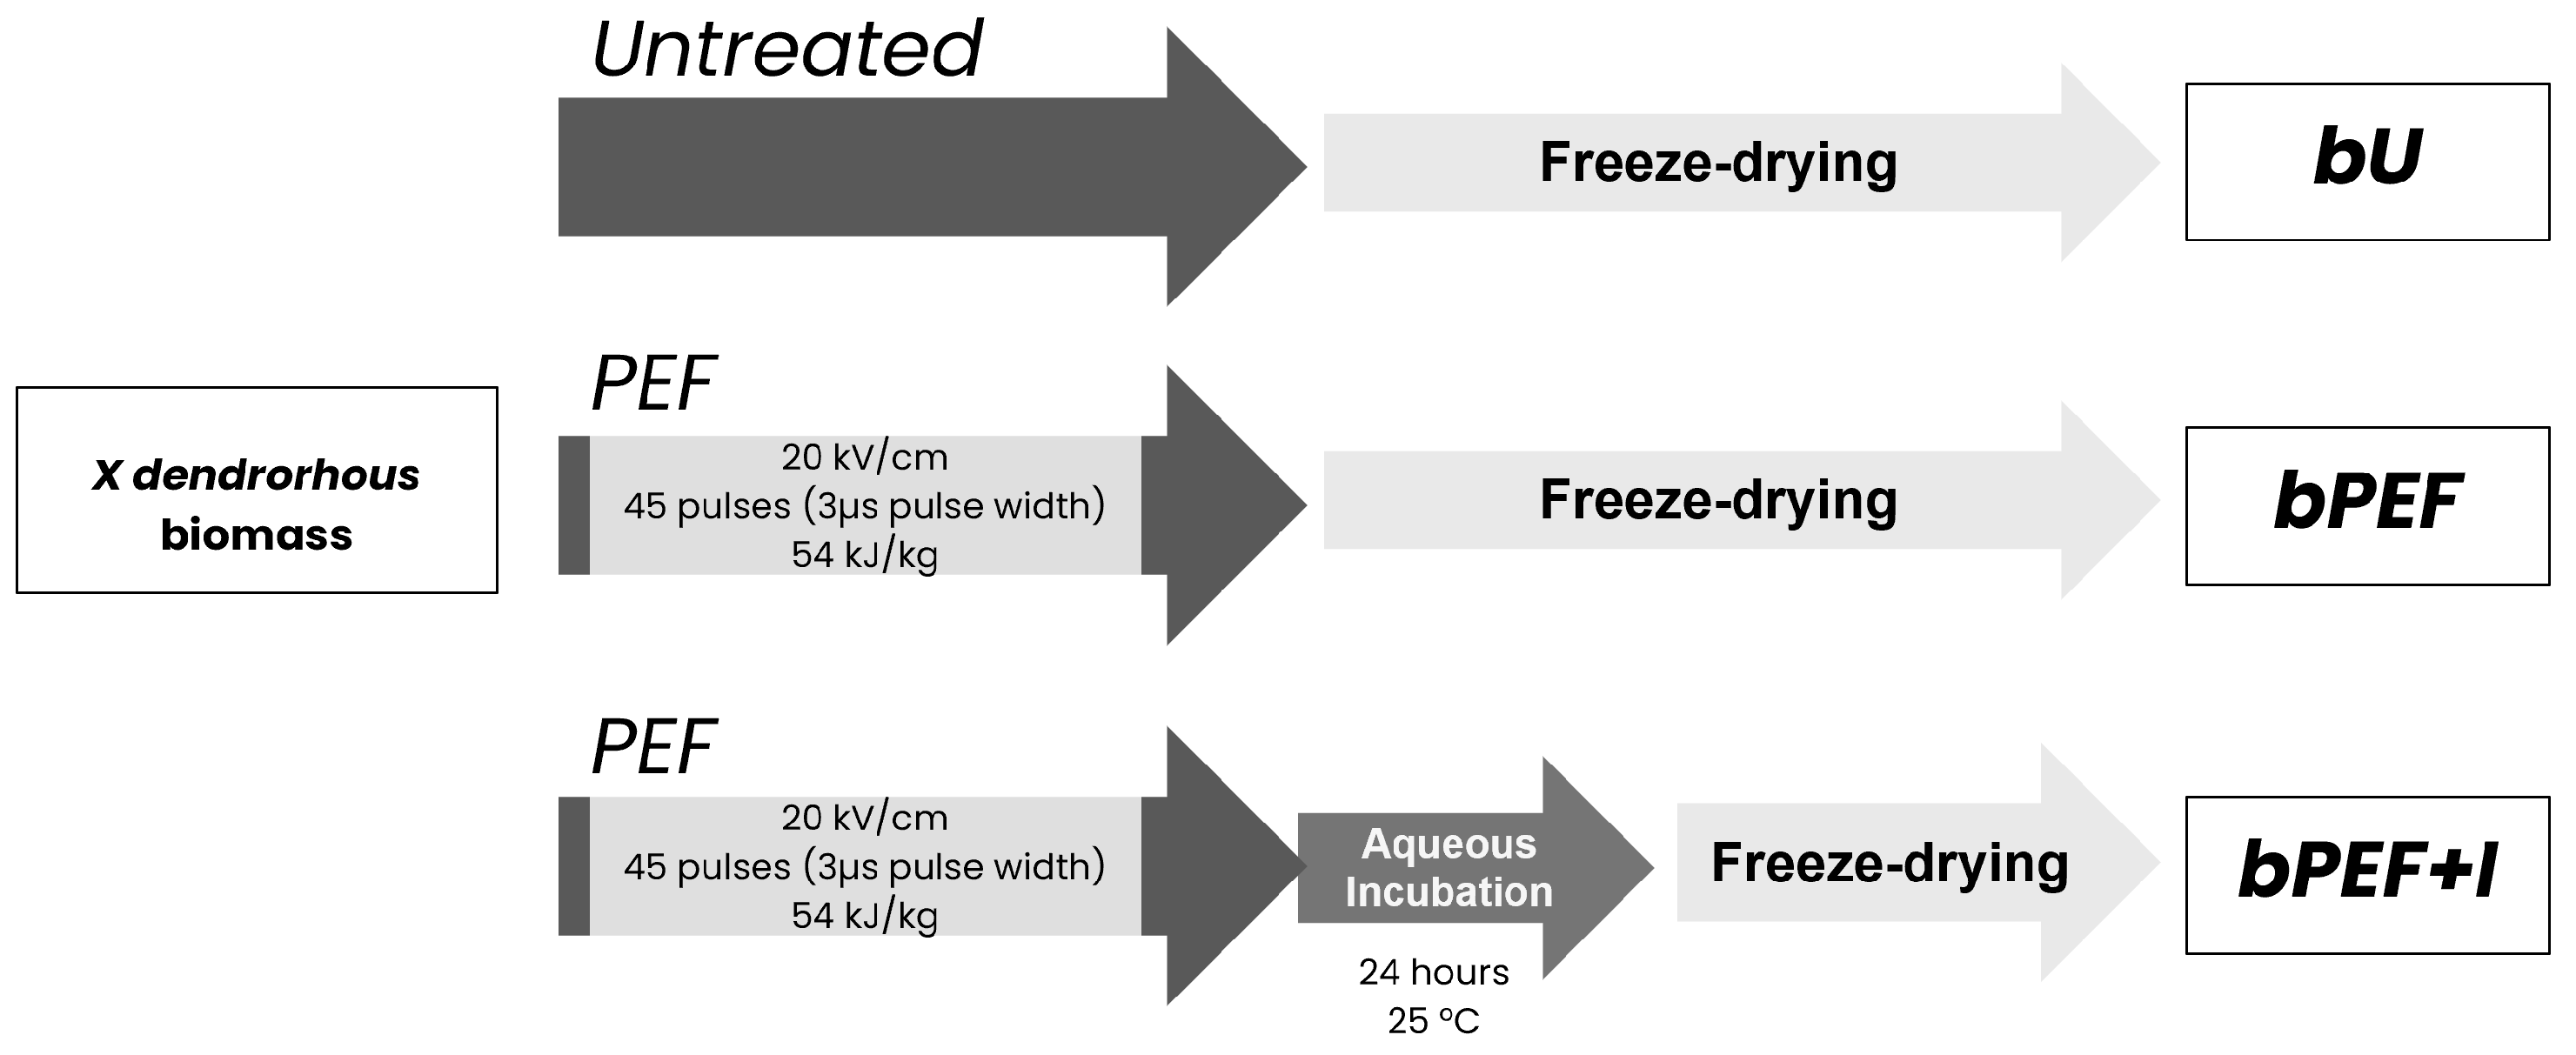
2.1. Biomass Cultivation and Treatment
2.1.1. Strain, Media, and Growth Conditions
2.1.2. PEF Treatment
2.2. Biomass Characterization
2.2.1. Determination of Dry Weight
2.2.2. Determination of Glutathione (GSH) Content
2.2.3. Determination of Free α-Amino Nitrogen (FAN) Content
2.2.4. Determination of Proteins Content
2.2.5. Determination of Total AST Content
2.2.6. Determination of Antioxidant Capacity
2.3. Extraction of AST from Dry X. dendrorhous Biomass
2.3.1. Hydrophobic Eutectic Solvents Preparation and Characterization
2.3.2. Extraction of AST from Biomass
2.4. Data Treatment
2.4.1. Experimental Design and Mathematical Modeling
2.4.2. Statistical Analysis
2.5. Molecular Dynamics
3. Results and Discussion
3.1. Characterization
3.1.1. Biomass Characterization
3.1.2. Hydrophobic Eutectic Solvents Characterization
3.2. Extraction of AST from X. dendrorhous Freeze-Dried Biomass Using Different hESs
3.2.1. Effect of the Pulsed Electric Field (PEF) on the Extraction Process
3.2.2. Effect of the hESs Composition on the Extraction Process
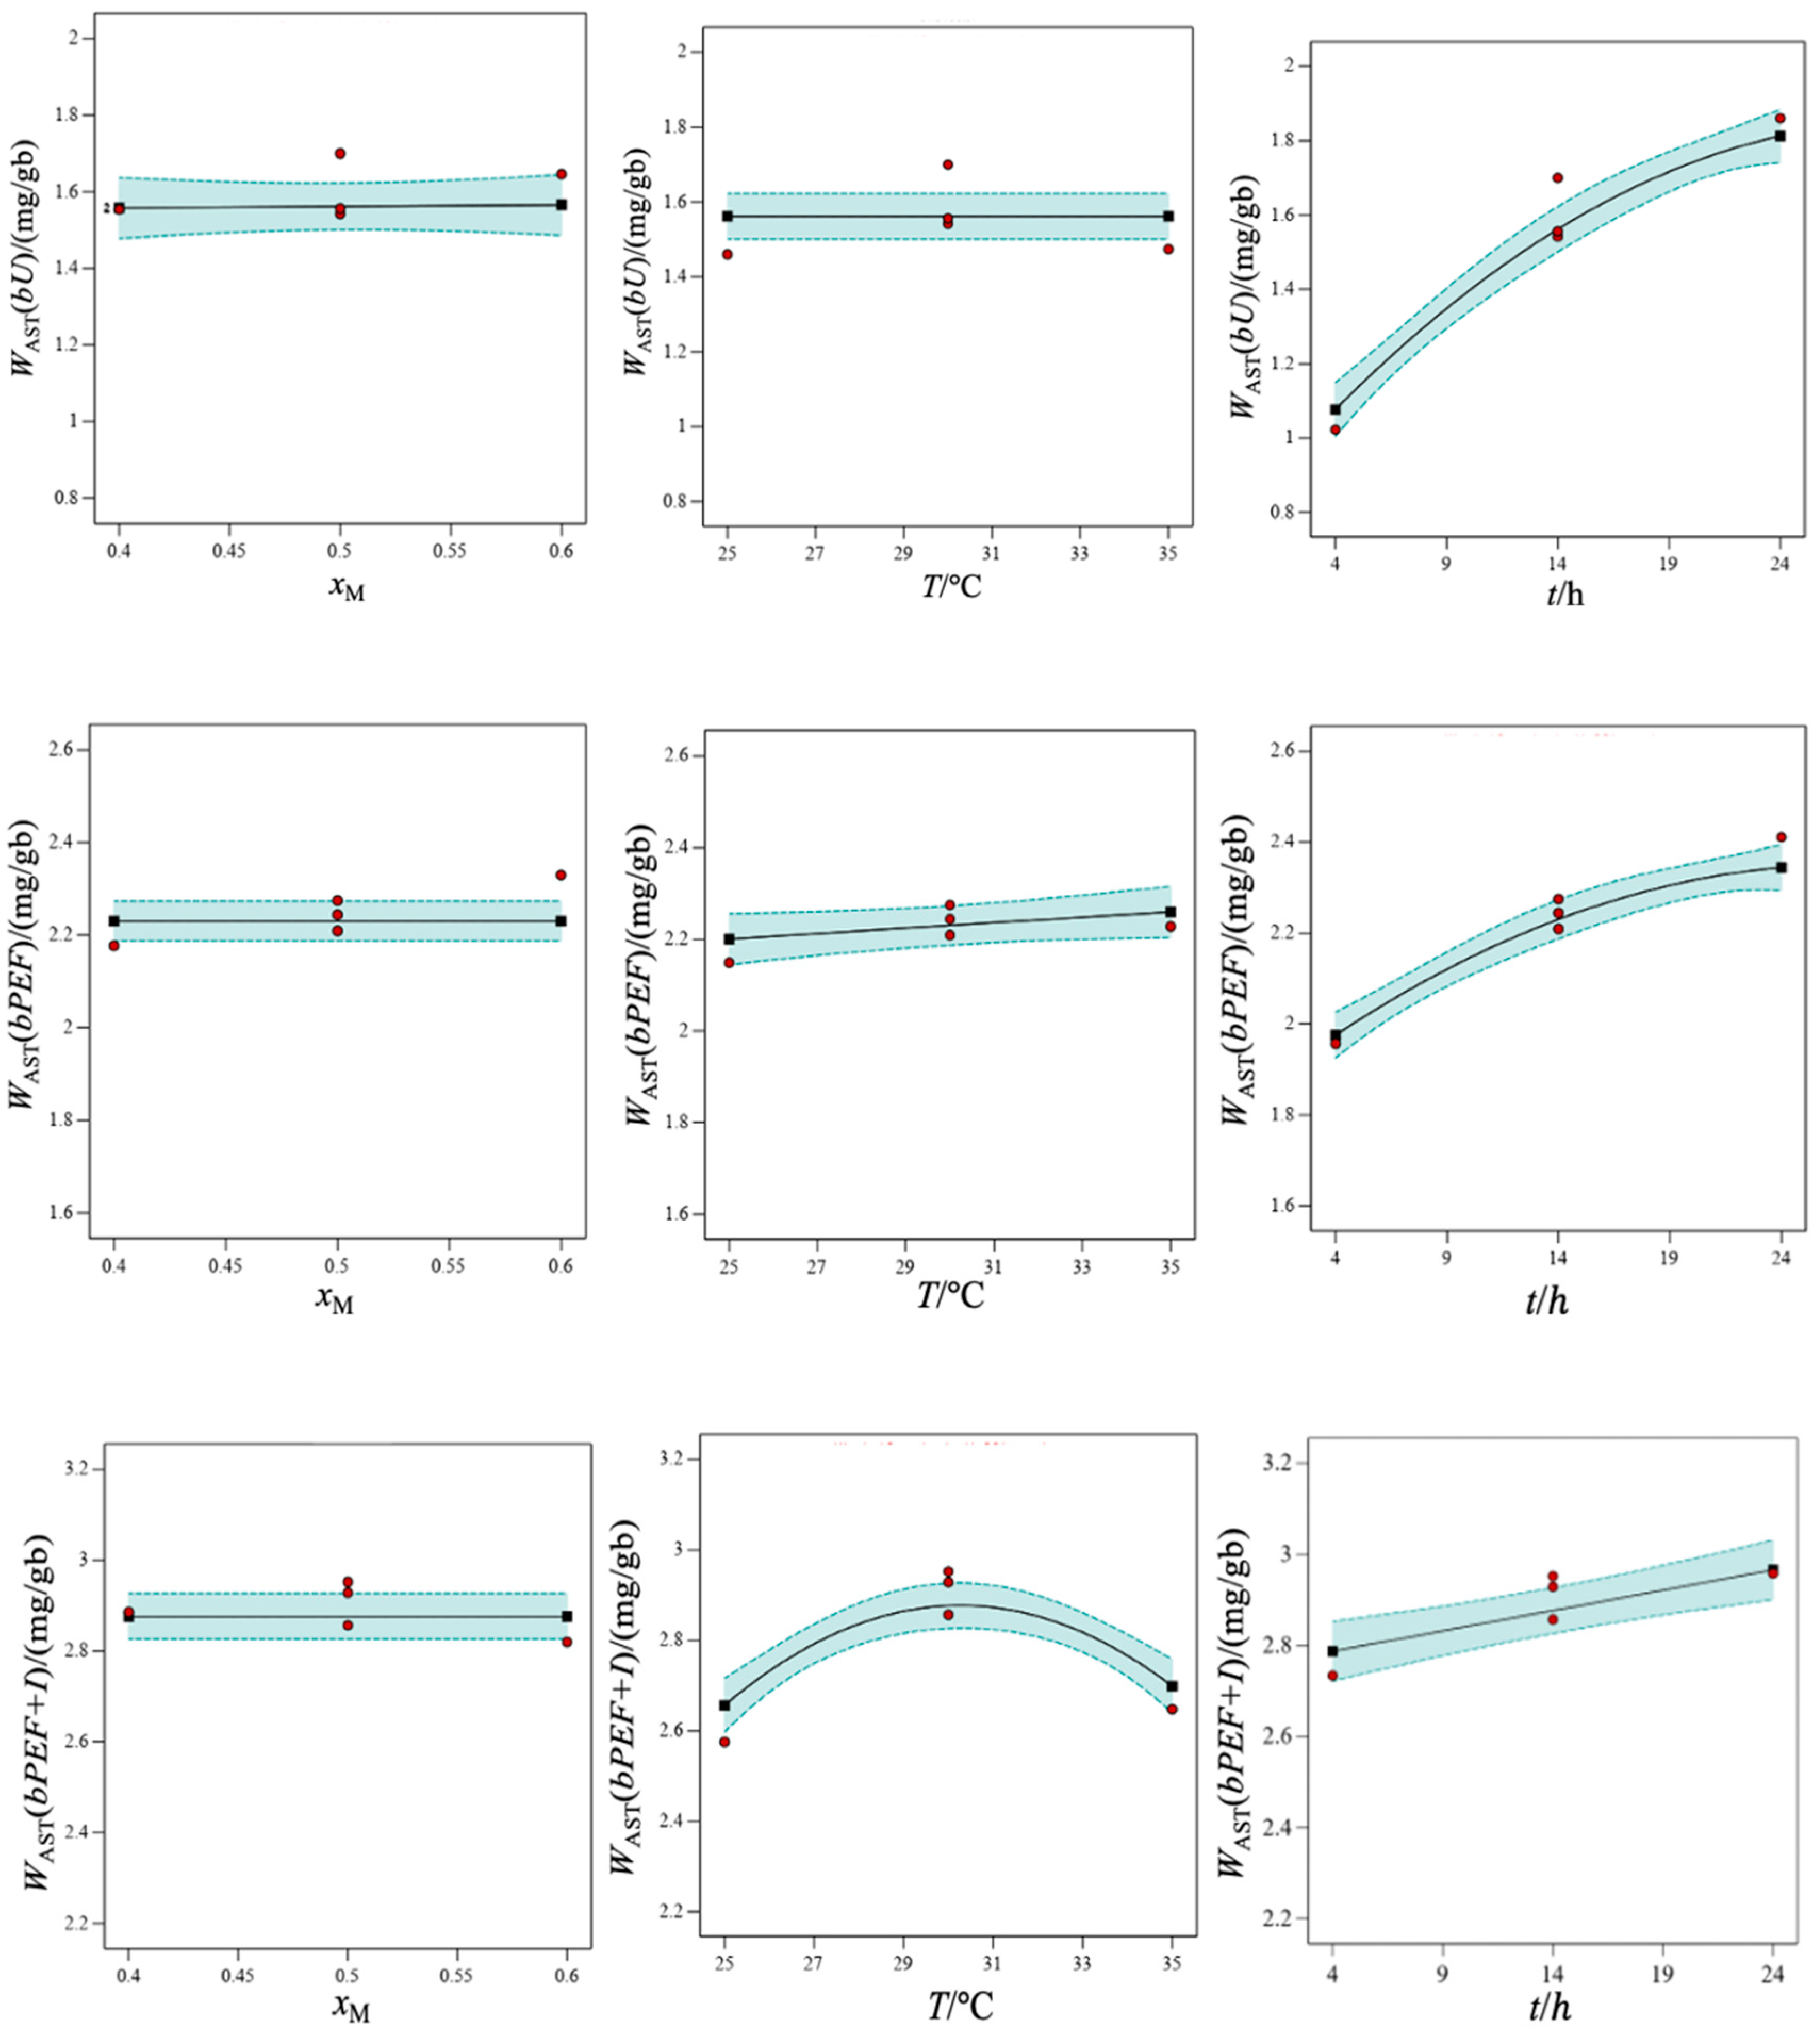
3.3. Evaluation of the Extraction Conditions of AST from X. dendrorhous Freeze-Dried Biomass Using the Best Solvent
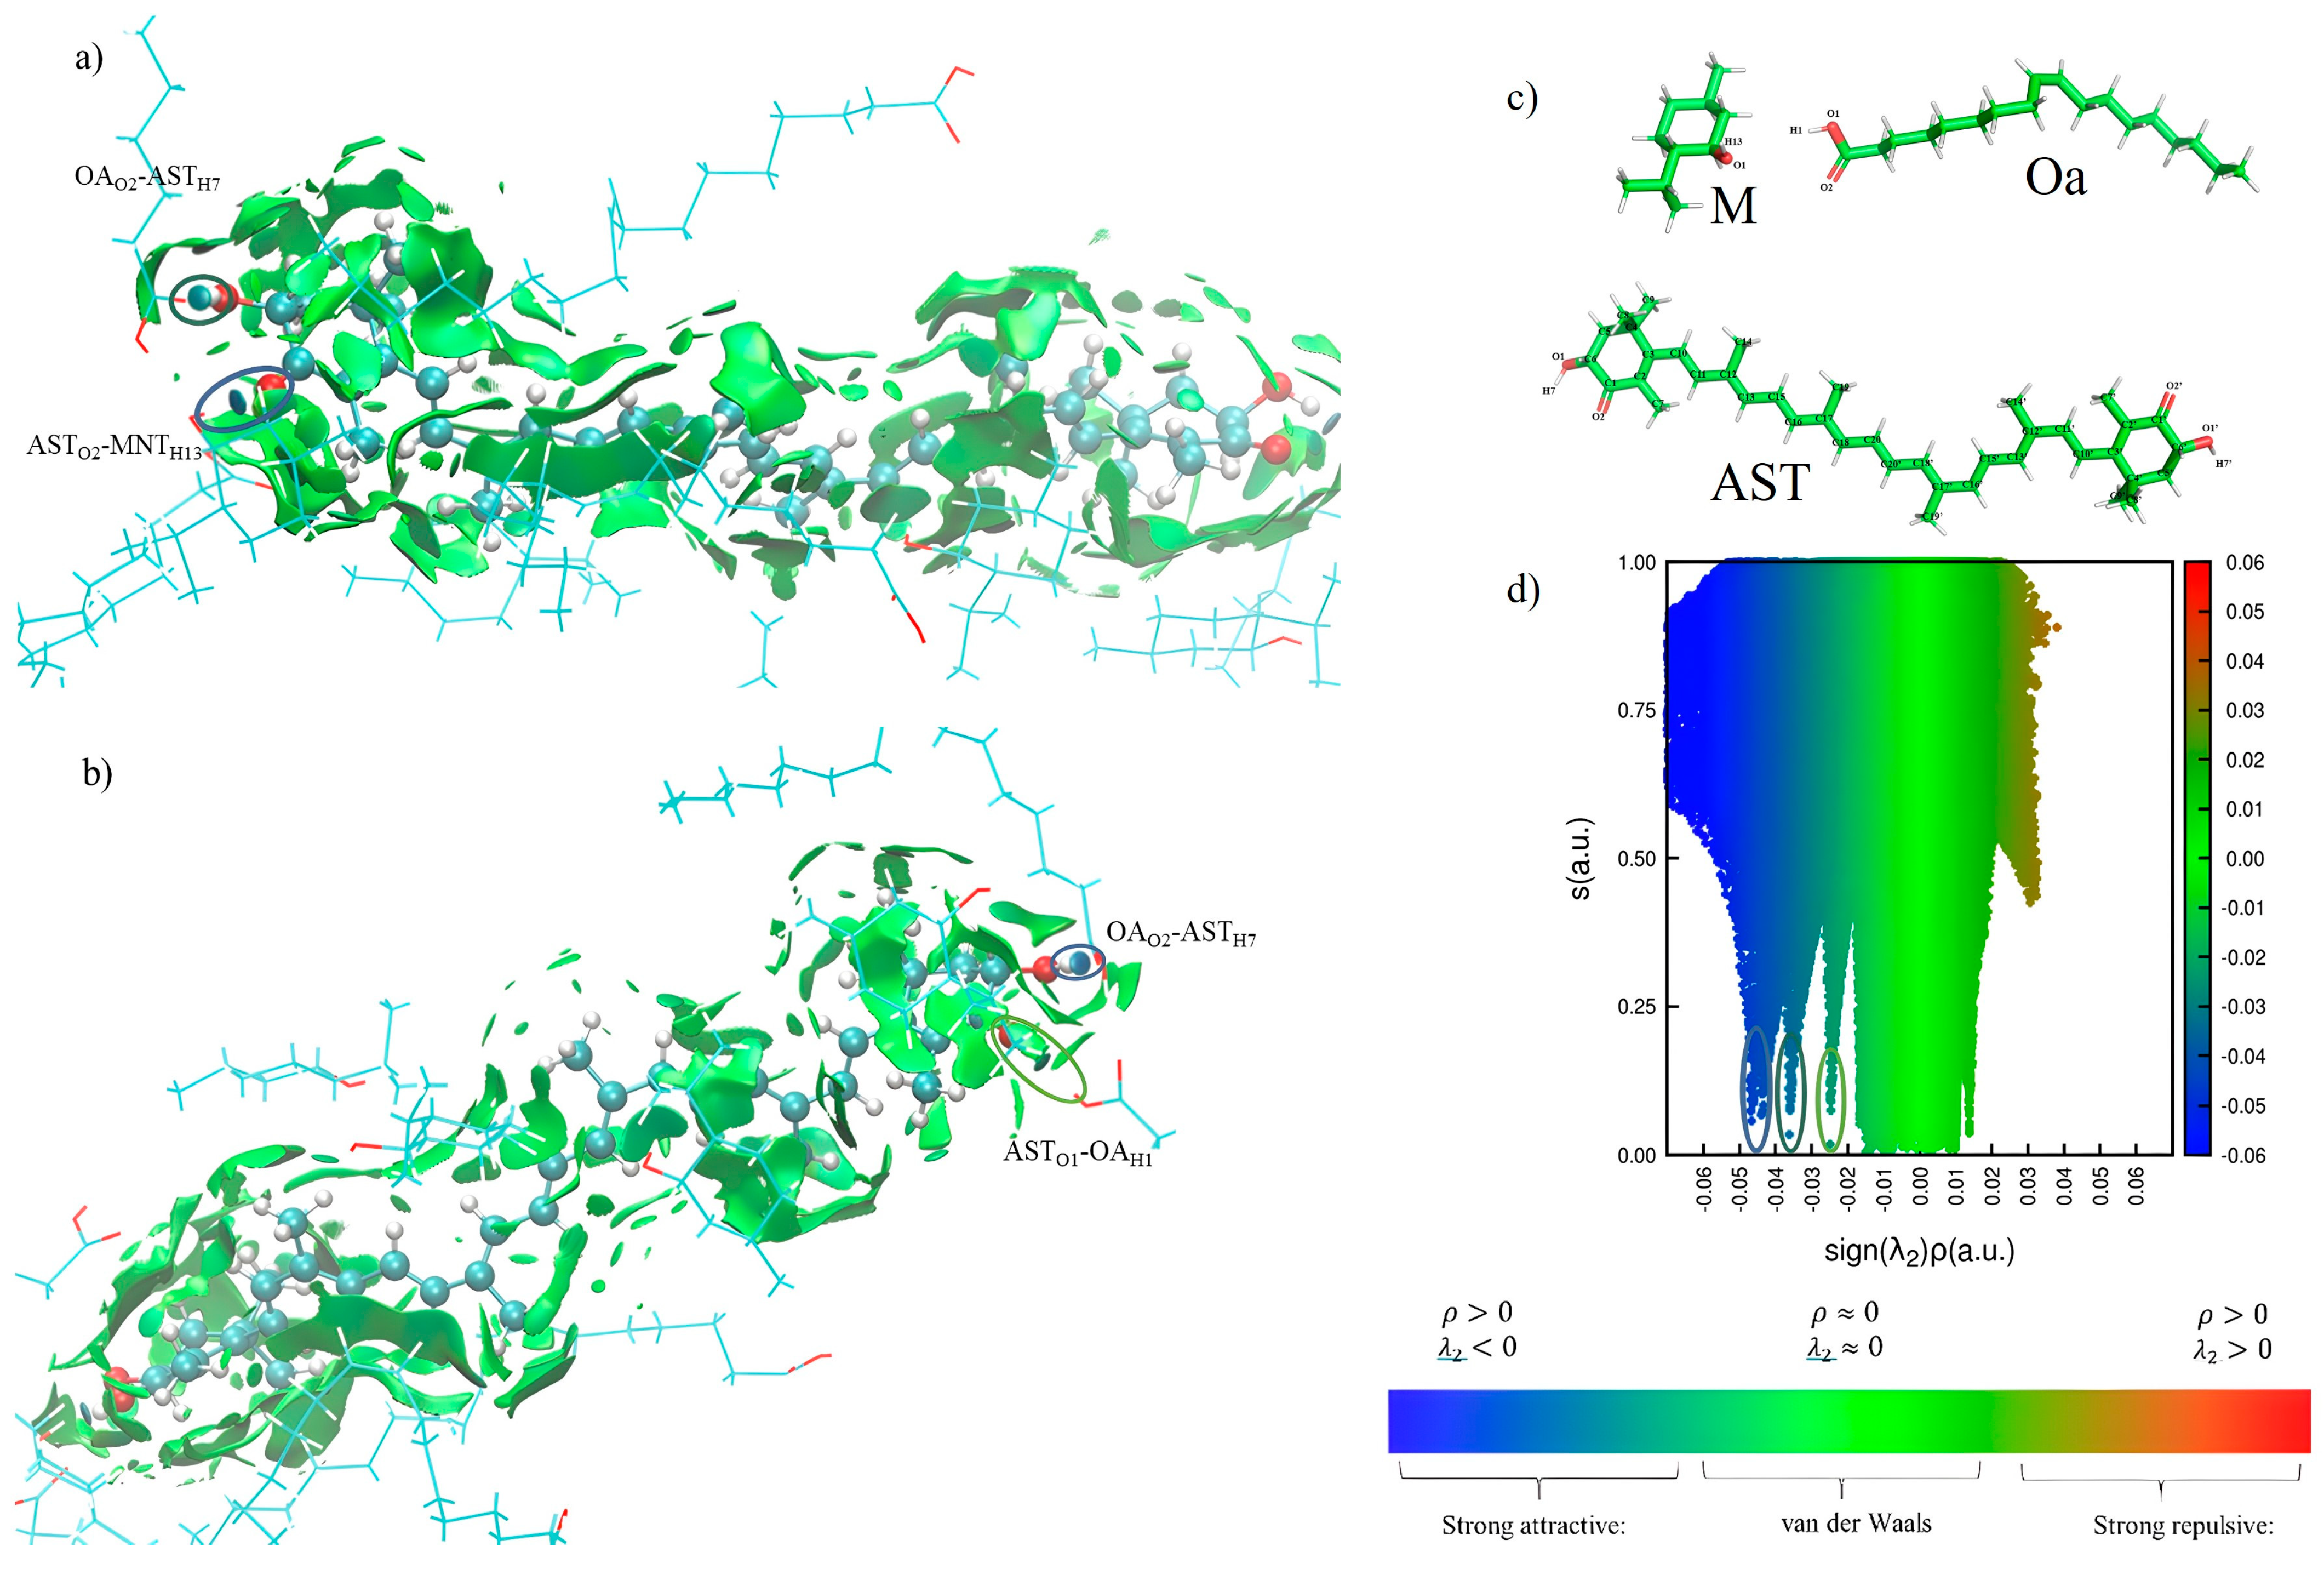
3.4. Analysis of the Interaction of AST–MOa by Molecular Dynamics (MD)
4. Conclusions
Supplementary Materials
Author Contributions
Funding
Data Availability Statement
Acknowledgments
Conflicts of Interest
References
- Nishida, Y.; Berg, P.; Shakersain, B.; Hecht, K.; Takikawa, A.; Tao, R.; Kakuta, Y.; Uragami, C.; Hashimoto, H.; Misawa, N.; et al. Astaxanthin: Past, Present, and Future. Mar. Drugs 2023, 21, 514. [Google Scholar] [CrossRef]
- Khalid, S.; Chaudhary, K.; Aziz, H.; Amin, S.; Sipra, H.M.; Ansar, S.; Rasheed, H.; Naeem, M.; Onyeaka, H. Trends in Extracting Protein from Microalgae Spirulina Platensis, Using Innovative Extraction Techniques: Mechanisms, Potentials, and Limitations. Crit. Rev. Food Sci. Nutr. 2024, 1–17. [Google Scholar] [CrossRef]
- Martínez, J.M.; Delso, C.; Álvarez, I.; Raso, J. Pulsed Electric Field-assisted Extraction of Valuable Compounds from Microorganisms. Compr. Rev. Food Sci. Food Saf. 2020, 19, 530–552. [Google Scholar] [CrossRef]
- Roobab, U.; Aadil, R.M.; Kurup, S.S.; Maqsood, S. Comparative Evaluation of Ultrasound-Assisted Extraction with Other Green Extraction Methods for Sustainable Recycling and Processing of Date Palm Bioresources and by-Products: A Review of Recent Research. Ultrason. Sonochem. 2025, 114, 107252. [Google Scholar] [CrossRef] [PubMed]
- Llavata, B.; Quiles, A.; Rosselló, C.; Cárcel, J.A. Enhancing Ultrasonic-Assisted Drying of Low-Porosity Products through Pulsed Electric Field (PEF) Pretreatment: The Case of Butternut Squash. Ultrason. Sonochem. 2025, 112, 107155. [Google Scholar] [CrossRef]
- Lai, X.-J.; Chen, J.-Q.; Nie, J.; Guo, P.-F.; Faisal Manzoor, M.; Huang, Y.-Y.; Li, J.; Lin, S.-Y.; Zeng, X.-A.; Wang, R. Enhancement of Extraction Efficiency and Functional Properties of Chickpea Protein Isolate Using Pulsed Electric Field Combined with Ultrasound Treatment. Ultrason. Sonochem. 2024, 111, 107089. [Google Scholar] [CrossRef] [PubMed]
- Meng, X.; Wang, Y.; Conte, A.J.; Zhang, S.; Ryu, J.; Wie, J.J.; Pu, Y.; Davison, B.H.; Yoo, C.G.; Ragauskas, A.J. Applications of Biomass-Derived Solvents in Biomass Pretreatment—Strategies, Challenges, and Prospects. Bioresour. Technol. 2023, 368, 128280. [Google Scholar] [CrossRef]
- del Mar Contreras-Gámez, M.; Galán-Martín, Á.; Seixas, N.; da Costa Lopes, A.M.; Silvestre, A.; Castro, E. Deep Eutectic Solvents for Improved Biomass Pretreatment: Current Status and Future Prospective towards Sustainable Processes. Bioresour. Technol. 2023, 369, 128396. [Google Scholar] [CrossRef]
- Isci, A.; Kaltschmitt, M. Recovery and Recycling of Deep Eutectic Solvents in Biomass Conversions: A Review. Biomass. Convers. Biorefin. 2022, 12, 197–226. [Google Scholar] [CrossRef]
- Ferreira, C.; Sarraguça, M. A Comprehensive Review on Deep Eutectic Solvents and Its Use to Extract Bioactive Compounds of Pharmaceutical Interest. Pharmaceuticals 2024, 17, 124. [Google Scholar] [CrossRef]
- Sportiello, L.; Favati, F.; Condelli, N.; Di Cairano, M.; Caruso, M.C.; Simonato, B.; Tolve, R.; Galgano, F. Hydrophobic Deep Eutectic Solvents in the Food Sector: Focus on Their Use for the Extraction of Bioactive Compounds. Food Chem. 2023, 405, 134703. [Google Scholar] [CrossRef]
- Tapia-Quirós, P.; Granados, M.; Sentellas, S.; Saurina, J. Microwave-Assisted Extraction with Natural Deep Eutectic Solvents for Polyphenol Recovery from Agrifood Waste: Mature for Scaling-Up? Sci. Total Environ. 2024, 912, 168716. [Google Scholar] [CrossRef]
- Mussagy, C.U.; Santos-Ebinuma, V.C.; Herculano, R.D.; Coutinho, J.A.P.; Pereira, J.F.B.; Pessoa, A. Ionic Liquids or Eutectic Solvents? Identifying the Best Solvents for the Extraction of Astaxanthin and β-Carotene from Phaffia rhodozyma Yeast and Preparation of Biodegradable Films. Green Chem. 2022, 24, 118–123. [Google Scholar] [CrossRef]
- Mussagy, C.U.; Remonatto, D.; Picheli, F.P.; Paula, A.V.; Herculano, R.D.; Santos-Ebinuma, V.C.; Farias, R.L.; Onishi, B.S.D.; Ribeiro, S.J.L.; Pereira, J.F.B.; et al. A Look into Phaffia rhodozyma Biorefinery: From the Recovery and Fractionation of Carotenoids, Lipids and Proteins to the Sustainable Manufacturing of Biologically Active Bioplastics. Bioresour. Technol. 2022, 362, 127785. [Google Scholar] [CrossRef] [PubMed]
- Abdelquader, M.M.; Li, S.; Andrews, G.P.; Jones, D.S. Therapeutic Deep Eutectic Solvents: A Comprehensive Review of Their Thermodynamics, Microstructure and Drug Delivery Applications. Eur. J. Pharm. Biopharm. 2023, 186, 85–104. [Google Scholar] [CrossRef] [PubMed]
- Artigas-Hernández, D.; Berzosa, A.; Aguilar-Machado, D.; Raso, J.; Artal, M. Using Eutectic Solvents for Extracting Astaxanthin from Dry Biomass of Xanthophyllomyces dendrorhous Pretreated by Pulsed Electric Fields. Sep. Purif. Technol. 2023, 324, 124496. [Google Scholar] [CrossRef]
- Zubair, M.; Shahzad, S.; Hussain, A.; Pradhan, R.A.; Arshad, M.; Ullah, A. Current Trends in the Utilization of Essential Oils for Polysaccharide-and Protein-Derived Food Packaging Materials. Polymers 2022, 14, 1146. [Google Scholar] [CrossRef]
- Chen, C.; He, L.; Tian, Y.; Xie, J. Improving the Preparation Process to Enhance the Retention of Cinnamon Essential Oil in Thermoplastic Starch/PBAT Active Film and Its Antimicrobial Activity. Ind. Crops Prod. 2025, 230, 120990. [Google Scholar] [CrossRef]
- Ahuja, A.; Rastogi, V.K. Physicochemical and Thermal Characterization of the Edible Shellac Films Incorporated with Oleic Acid to Enhance Flexibility, Water Barrier and Retard Aging. Int. J. Biol. Macromol. 2024, 269, 132136. [Google Scholar] [CrossRef]
- Roy, S.; Deshmukh, R.K.; Tripathi, S.; Gaikwad, K.K.; Das, S.S.; Sharma, D. Recent Advances in the Carotenoids Added to Food Packaging Films: A Review. Foods 2023, 12, 4011. [Google Scholar] [CrossRef]
- Mussagy, C.U.; Farias, F.O.; Sasaki, J.C.; Scontri, M.; Picheli, F.; Santos-Ebinuma, V.C.; de Azeredo, H.M.C.; Pessoa, A.; Herculano, R.D. Eutectic Solvent-Based Bioactive Films Functionalized with Microbial Astaxanthin Extends Shelf Life of Fresh Strawberries. Mater. Today Chem. 2023, 33, 101721. [Google Scholar] [CrossRef]
- Aguilar-Machado, D.; Delso, C.; Martinez, J.M.; Morales-Oyervides, L.; Montañez, J.; Raso, J. Enzymatic Processes Triggered by PEF for Astaxanthin Extraction From Xanthophyllomyces dendrorhous. Front. Bioeng. Biotechnol. 2020, 8, 857. [Google Scholar] [CrossRef] [PubMed]
- Ganeva, V.; Angelova, B.; Galutzov, B.; Goltsev, V.; Zhiponova, M. Extraction of Proteins and Other Intracellular Bioactive Compounds From Baker’s Yeasts by Pulsed Electric Field Treatment. Front. Bioeng. Biotechnol. 2020, 8, 552335. [Google Scholar] [CrossRef]
- Dimopoulos, G.; Stefanou, N.; Andreou, V.; Taoukis, P. Effect of Pulsed Electric Fields on the Production of Yeast Extract by Autolysis. Innov. Food Sci. Emerg. Technol. 2018, 48, 287–295. [Google Scholar] [CrossRef]
- Gulcin, İ. Antioxidants: A Comprehensive Review. Arch. Toxicol. 2025, 99, 1893–1997. [Google Scholar] [CrossRef]
- Paloncýová, M.; Valério, M.; Dos Santos, R.N.; Kührová, P.; Šrejber, M.; Čechová, P.; Dobchev, D.A.; Balsubramani, A.; Banáš, P.; Agarwal, V.; et al. Computational Methods for Modeling Lipid-Mediated Active Pharmaceutical Ingredient Delivery. Mol. Pharm. 2025, 22, 1110–1141. [Google Scholar] [CrossRef]
- Silva, L.A.; Correia, J.C.G. GEMS-Pack: A Graphical User Interface for the Packmol Program. J. Chem. Inf. Model. 2020, 60, 439–443. [Google Scholar] [CrossRef]
- Loncharich, R.J.; Brooks, B.R.; Pastor, R.W. Langevin Dynamics of Peptides: The Frictional Dependence of Isomerization Rates of N-acetylalanyl- N′-methylamide. Biopolymers 1992, 32, 523–535. [Google Scholar] [CrossRef]
- Spivak, M.; Stone, J.E.; Ribeiro, J.; Saam, J.; Freddolino, L.; Bernardi, R.C.; Tajkhorshid, E. VMD as a Platform for Interactive Small Molecule Preparation and Visualization in Quantum and Classical Simulations. J. Chem. Inf. Model. 2023, 63, 4664–4678. [Google Scholar] [CrossRef]
- Roe, D.R.; Brooks, B.R. MPI-parallelization of the Grid Inhomogeneous Solvation Theory Calculation. J. Comput. Chem. 2024, 45, 633–637. [Google Scholar] [CrossRef]
- Jacob, F.F.; Hutzler, M.; Methner, F.-J. Comparison of Various Industrially Applicable Disruption Methods to Produce Yeast Extract Using Spent Yeast from Top-Fermenting Beer Production: Influence on Amino Acid and Protein Content. Eur. Food Res. Technol. 2019, 245, 95–109. [Google Scholar] [CrossRef]
- Martínez, J.M.; Cebrián, G.; Álvarez, I.; Raso, J. Release of Mannoproteins during Saccharomyces Cerevisiae Autolysis Induced by Pulsed Electric Field. Front. Microbiol. 2016, 7, 1435. [Google Scholar] [CrossRef] [PubMed]
- Maza, M.A.; Delso, C.; Álvarez, I.; Raso, J.; Martínez, J.M. Effect of Pulsed Electric Fields on Mannoproteins Release from Saccharomyces Cerevisiae during the Aging on Lees of Caladoc Red Wine. LWT 2020, 118, 108788. [Google Scholar] [CrossRef]
- Prausnitz, J.M.; Lichtenthaler, R.N.; Azevedo, E.G. Molecular Thermodynamics of the Fluid Phase Equilibria; Prentice-Hall: Hoboken, NJ, USA, 1986; ISBN 978-0139777455. [Google Scholar]
- Chanioti, S.; Katsouli, M.; Tzia, C. Novel Processes for the Extraction of Phenolic Compounds from Olive Pomace and Their Protection by Encapsulation. Molecules 2021, 26, 1781. [Google Scholar] [CrossRef]
- Puértolas, E.; Luengo, E.; Álvarez, I.; Raso, J. Improving Mass Transfer to Soften Tissues by Pulsed Electric Fields: Fundamentals and Applications. Annu. Rev. Food Sci. Technol. 2012, 3, 263–282. [Google Scholar] [CrossRef] [PubMed]
- Mussagy, C.U.; Caicedo-Paz, A.V.; Figueroa, D.; Santander, C.; González, F.; Tropea, A.; Mondello, L.; Spadaro, D.; Trocino, S.; Piazza, R.D.; et al. Maximizing Haematococcus Biorefineries: Ionic Liquid-Based Astaxanthin Recovery, Biocosmetic Formulation, Solar Cell Applications, and Biofertilizer Valorization. Bioresour. Technol. 2025, 426, 132347. [Google Scholar] [CrossRef]
- Pitacco, W.; Samorì, C.; Pezzolesi, L.; Gori, V.; Grillo, A.; Tiecco, M.; Vagnoni, M.; Galletti, P. Extraction of Astaxanthin from Haematococcus pluvialis with Hydrophobic Deep Eutectic Solvents Based on Oleic Acid. Food Chem. 2022, 379, 132156. [Google Scholar] [CrossRef]
- Mussagy, C.U.; Kot, A.; Dufossé, L.; Gonçalves, C.N.D.P.; Pereira, J.F.B.; Santos-Ebinuma, V.C.; Raghavan, V.; Pessoa, A. Microbial Astaxanthin: From Bioprocessing to the Market Recognition. Appl. Microbiol. Biotechnol. 2023, 107, 4199–4215. [Google Scholar] [CrossRef]
- Kim, B.; Youn Lee, S.; Lakshmi Narasimhan, A.; Kim, S.; Oh, Y.K. Cell Disruption and Astaxanthin Extraction from Haematococcus pluvialis: Recent Advances. Bioresour. Technol. 2022, 343, 126124. [Google Scholar] [CrossRef]
- Khoo, K.S.; Chew, K.W.; Yew, G.Y.; Manickam, S.; Ooi, C.W.; Show, P.L. Integrated Ultrasound-Assisted Liquid Biphasic Flotation for Efficient Extraction of Astaxanthin from Haematococcus pluvialis. Ultrason. Sonochem. 2020, 67, 105052. [Google Scholar] [CrossRef]
- Yuan, C.; Jin, Z.; Xu, X.; Zhuang, H.; Shen, W. Preparation and Stability of the Inclusion Complex of Astaxanthin with Hydroxypropyl-β-Cyclodextrin. Food Chem. 2008, 109, 264–268. [Google Scholar] [CrossRef] [PubMed]
- Kongpol, K.; Chaihao, P.; Shuapan, P.; Kongduk, P.; Chunglok, W.; Yusakul, G. Therapeutic Hydrophobic Deep Eutectic Solvents of Menthol and Fatty Acid for Enhancing Anti-Inflammation Effects of Curcuminoids and Curcumin on RAW264.7 Murine Macrophage Cells. RSC Adv. 2022, 12, 17443–17453. [Google Scholar] [CrossRef] [PubMed]
- Valente, S.; Oliveira, F.; Ferreira, I.J.; Paiva, A.; Sobral, R.G.; Diniz, M.S.; Gaudêncio, S.P.; Duarte, A.R.C. Hydrophobic DES Based on Menthol and Natural Organic Acids for Use in Antifouling Marine Coatings. ACS Sustain. Chem. Eng. 2023, 11, 9989–10000. [Google Scholar] [CrossRef] [PubMed]
- Mussagy, C.U.; Farias, F.O.; Santos-Ebinuma, V.C.; Pereira, J.F.B.; Pessoa, A. Sustainable One-Pot Platform for the Green Recovery of Carotenoids from Phaffia rhodozyma Yeast and Their Use as Natural Additives in Soap Formulation. Environ. Technol. Innov. 2023, 29, 103029. [Google Scholar] [CrossRef]
- Tretiakov, S.; Nigam, A.; Pollice, R. Studying Noncovalent Interactions in Molecular Systems with Machine Learning. Chem. Rev. 2025, 125, 5776–5829. [Google Scholar] [CrossRef]
 ), LOa; (
 ), MOa; (
 ), EOa; (
 ), GOa; (
 ), COa; (
 ), TOa2. Error bars, 95% C.I.
), LOa; (), MOa; (), EOa; (), GOa; (), COa; (), TOa2. Error bars, 95% C.I.
), TOa2. Error bars, 95% C.I.
), LOa; (), MOa; (), EOa; (), GOa; (), COa; (), TOa2. Error bars, 95% C.I.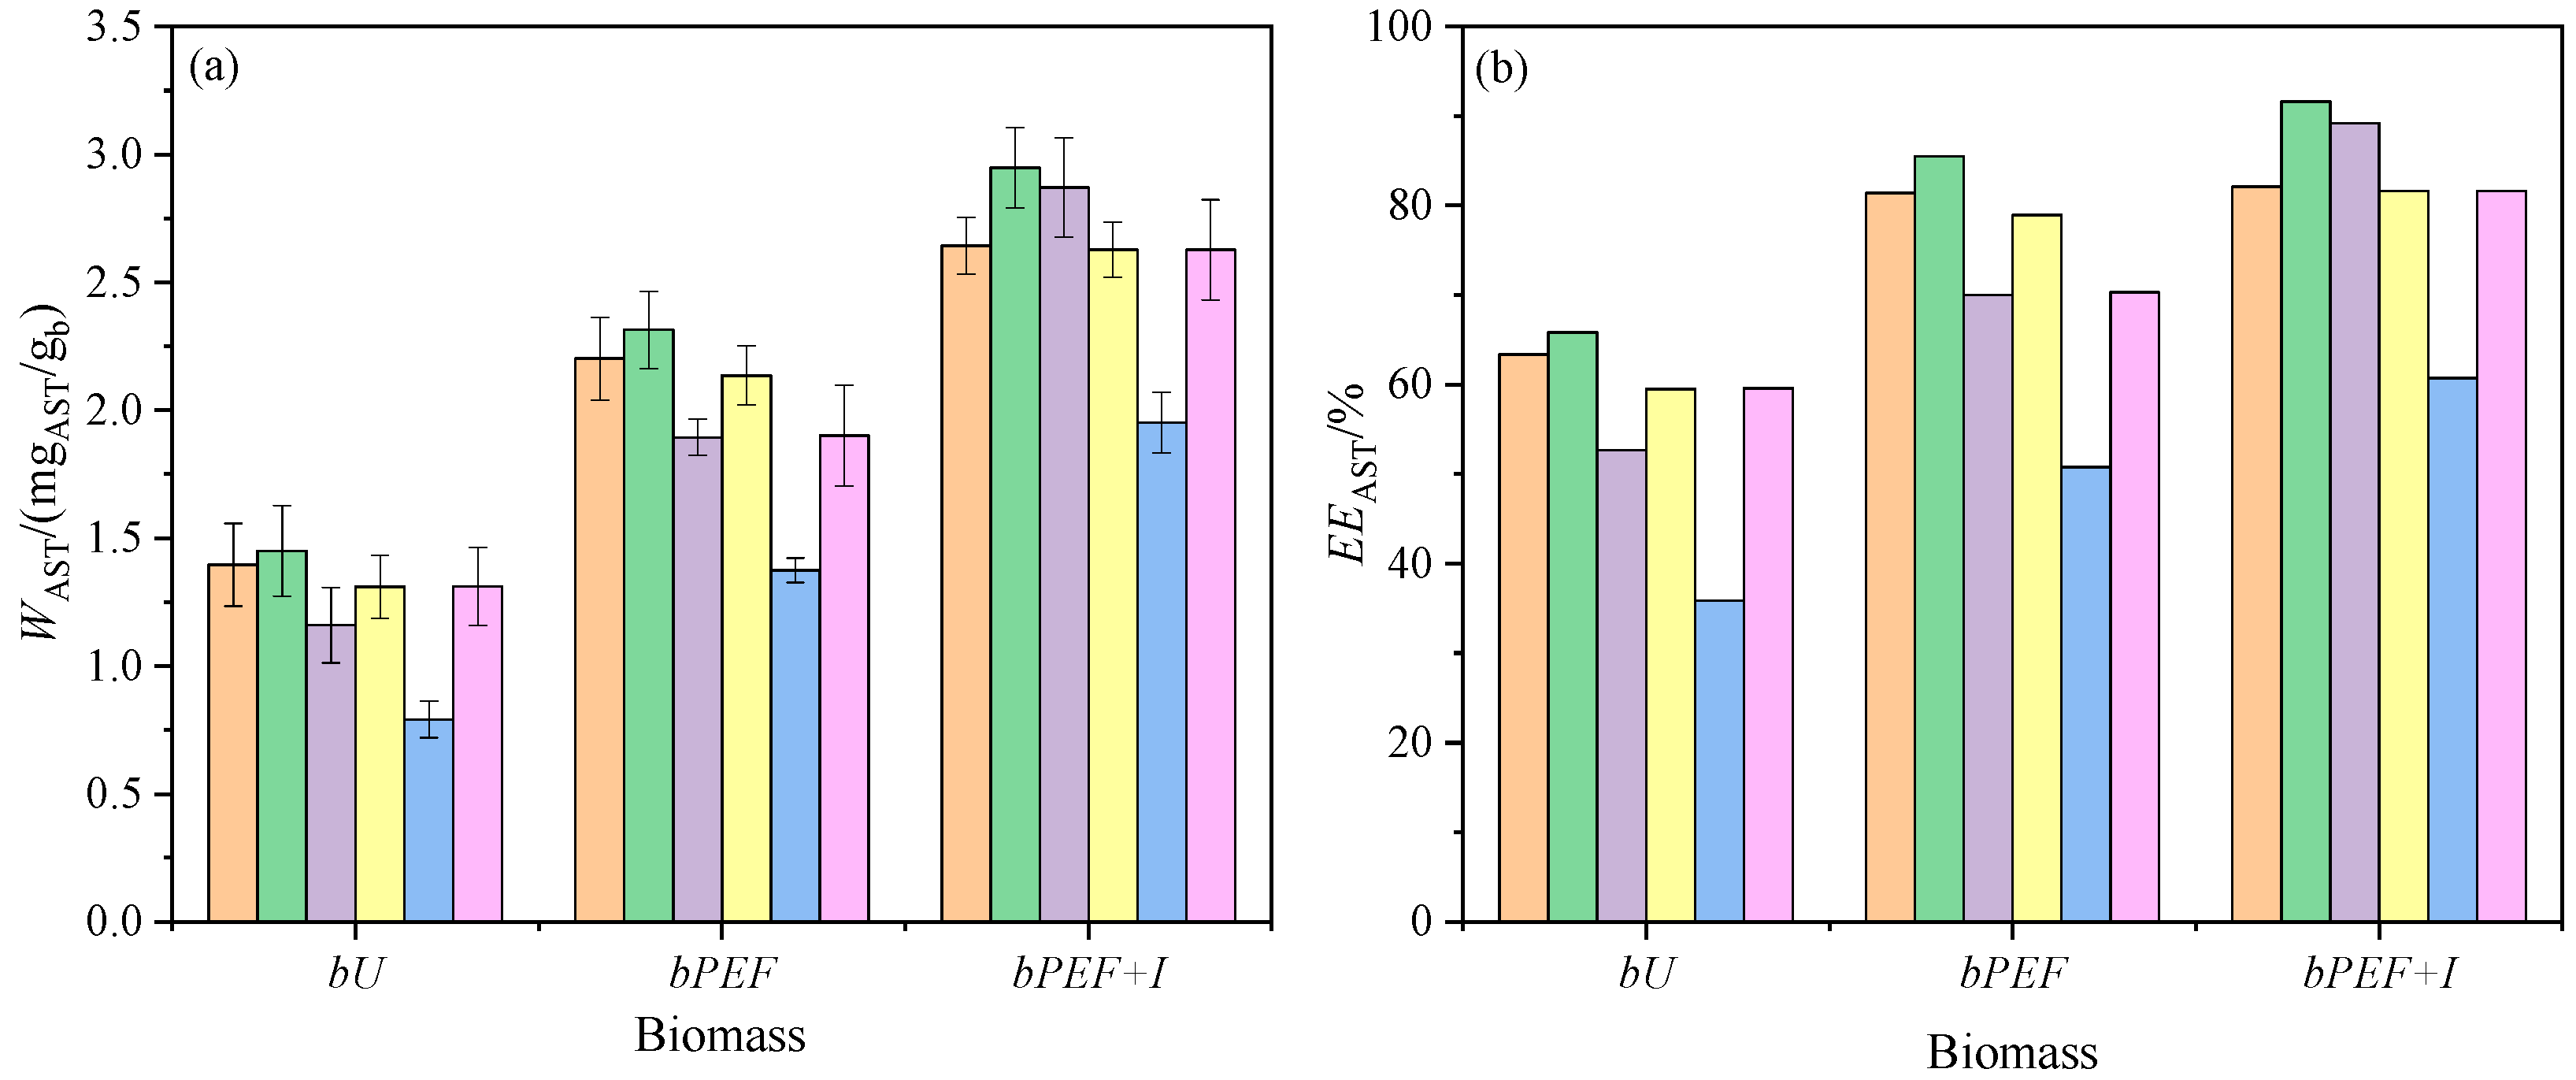

| Parameter | Biomass | |||
|---|---|---|---|---|
| bU | bPEF | bPEF + I | Bead-Mill | |
| Dry weight/ (gdry/gwet) | 0.0272 ± 0.0004 | 0.0248 ± 0.0006 | 0.0215 ± 0.0006 | 0.0125 ± 0.0008 |
| Total AST/ (gdry/gwet) | 2.201 ± 0.012 | 2.704 ± 0.025 | 3.217 ± 0.020 | ---- |
| Glutathione/ (mgGSH/gb) | ----- | ---- | 0.882 ± 0.009 | 6.373 ± 0.110 |
| α-amino acid/ (mgeq.L-Alanine/gb) | 7.34 ± 0.16 | 37.47 ± 2.82 | 90.62 ± 5.85 | 33.65 ± 4.48 |
| Proteins/ (mgeq.Albumin/gb) | 7.48 ± 0.12 | 16.45 ± 0.74 | 20.98 ± 5.17 | 191.50 ± 6.22 |
| DPPH/ (mgeq.Trolox/gb) | 0.332 ± 0.005 | 0.527 ± 0.017 | 0.663 ± 0.003 | 1.065 ± 0.032 |
| hESs | ||||||
|---|---|---|---|---|---|---|
| Property | LOa | MOa | EOa | GOa | COa | TOa2 |
| °C | −2.7 | 3.67 | 1.85 | ---g | 3.85 | 12.6 |
| Tm/°C | −5.1 | −0.23 | 3.52 | 1.48 | 5.51 | 4.48 |
| ρ/kg‧m−3 | 885.12 | 891.11 | 944.50 | 883.92 | 933.61 | 908.64 |
| u/m‧s−1 | 1387.34 | 1404.22 | 1427.46 | 1418.85 | 1463.58 | 1421.59 |
| κs/TPa−1 | 587.11 | 569.10 | 519.95 | 561.97 | 500.04 | 544.63 |
| Lf/Å | 0.479 | 0.471 | 0.451 | 0.469 | 0.442 | 0.461 |
| nD | 1.45947 | 1.45967 | 1.48421 | 1.46498 | 1.49421 | 1.47411 |
| Rm/cm3‧mol−1 | 67.50 | 67.38 | 67.67 | 68.29 | 64.90 | 73.74 |
| fm/% | 72.64 | 72.63 | 71.38 | 72.48 | 70.79 | 69.23 |
| η/mPa‧s | 16.87 | 30.10 | 18.63 | 16.19 | 26.76 | 25.77 |
Disclaimer/Publisher’s Note: The statements, opinions and data contained in all publications are solely those of the individual author(s) and contributor(s) and not of MDPI and/or the editor(s). MDPI and/or the editor(s) disclaim responsibility for any injury to people or property resulting from any ideas, methods, instructions or products referred to in the content. |
© 2025 by the authors. Licensee MDPI, Basel, Switzerland. This article is an open access article distributed under the terms and conditions of the Creative Commons Attribution (CC BY) license (https://creativecommons.org/licenses/by/4.0/).
Share and Cite
Marañés, J.; Berzosa, A.; Bergua, F.; Marín-Sánchez, J.; Raso, J.; Artal, M. Eutectic Mixtures Based on Oleic Acid and Pulsed Electric Fields: A Strategy for the Extraction of Astaxanthin from Dry Biomass of Xanthophyllomyces dendrorhous. Foods 2025, 14, 2371. https://doi.org/10.3390/foods14132371
Marañés J, Berzosa A, Bergua F, Marín-Sánchez J, Raso J, Artal M. Eutectic Mixtures Based on Oleic Acid and Pulsed Electric Fields: A Strategy for the Extraction of Astaxanthin from Dry Biomass of Xanthophyllomyces dendrorhous. Foods. 2025; 14(13):2371. https://doi.org/10.3390/foods14132371
Chicago/Turabian StyleMarañés, Javier, Alejandro Berzosa, Fernando Bergua, Javier Marín-Sánchez, Javier Raso, and Manuela Artal. 2025. "Eutectic Mixtures Based on Oleic Acid and Pulsed Electric Fields: A Strategy for the Extraction of Astaxanthin from Dry Biomass of Xanthophyllomyces dendrorhous" Foods 14, no. 13: 2371. https://doi.org/10.3390/foods14132371
APA StyleMarañés, J., Berzosa, A., Bergua, F., Marín-Sánchez, J., Raso, J., & Artal, M. (2025). Eutectic Mixtures Based on Oleic Acid and Pulsed Electric Fields: A Strategy for the Extraction of Astaxanthin from Dry Biomass of Xanthophyllomyces dendrorhous. Foods, 14(13), 2371. https://doi.org/10.3390/foods14132371