Article

Multi-Mycotoxin Analyses by UPLC-MS/MS in Wheat: The Situation in Belgium in 2023 and 2024

1
Walloon Agricultural Research Centre, 5030 Gembloux, Belgium
2
Research Institute for Agriculture, Fisheries and Food, 9820 Merelbeke-Melle, Belgium
3
Laboratory of Food Analysis, Fundamental and Applied Research for Animal & Health, Veterinary Public Health, University of Liège, 4000 Liège, Belgium
*
Author to whom correspondence should be addressed.
Foods 2025, 14(13), 2300; https://doi.org/10.3390/foods14132300
Submission received: 26 May 2025 / Revised: 24 June 2025 / Accepted: 26 June 2025 / Published: 28 June 2025

Abstract

This work proposes an insight into the mycotoxins detected in wheat from the 2023 and 2024 harvests in Belgium and highlights the link between agronomic conditions and mycotoxin contamination. The study utilized samples from a Belgian trial network, covering nine locations in 2023 and eight in 2024, ensuring diverse pedoclimatic contexts and including 11 different varieties. Sowing and harvest dates, previous crops and meteorological data were collected for these locations. A validated UPLC-MS/MS multi-mycotoxin method able to detect 20 mycotoxins, regulated or not, was used. Deoxynivalenol, zearalenone, and enniatins B and B1 were detected in the 2023 and 2024 samples. Enniatin A1 was only detected in the 2024 samples. Mycotoxin contamination was higher in 2024 compared to 2023, in terms of both the number of contaminated samples and the contamination levels. Enniatins B and B1, non-regulated mycotoxins, were widely detected in the 2024 wheat samples, with enniatin B detected in 68 out 88 samples ranging from 12 to 488 µg/kg. Differences between the wheat varieties were observed, with some varieties showing significantly higher contamination. Additionally, geographic location appeared to influence contamination levels, which could be related to previous crops or meteorological events. In conclusion, this research provides a comprehensive analysis of mycotoxin co-contamination in wheat samples from diverse pedoclimatic contexts in Belgium based over 2 years. It shows the importance of weather conditions on mycotoxin contamination. It also emphasizes the importance of variety selection to manage mycotoxin contamination.

1. Introduction

Mycotoxins are secondary metabolites produced by fungal genera such as Aspergillus spp., Alternaria spp., Fusarium ssp. and Penicillium spp. [1,2]. More than 300 mycotoxins have been reported in the literature. Among mycotoxins, the most studied compounds are aflatoxins (AFs), deoxynivalenol (DON), ochratoxin A (OTA) and zearalenone (ZEA), because of their toxicity to both animals and humans, their occurrence and because they are regulated [3,4]. In addition, some emerging mycotoxins, such as enniatins (ENNs), beauvericin (BEA) or sterygmatocystin (STE), defined as not regulated or not routinely monitored mycotoxins, are currently more frequently observed in raw agricultural products, used as food or feed [5,6].
DON, also called vomitoxin, is mainly produced by Fusarium graminearum. The main Fusarium species that produce ZEA are F. graminearum, F. crookwellense, F. sporotrichioides and F. culmorum. DON and ZEA can co-occur as they are produced by the same Fusarium species [7].
Ochratoxins A and B (OTB) are produced by species of genera Aspergillus and Penicillium [8]. The main producers of AFs are Aspergillus flavus and Aspergillus parasiticus. Among the AFs, the most widespread and the most dangerous molecule is aflatoxin B1 (AFB1) [9,10].
ENNs are produced by different Fusarium species such as F. avenaceum, F. oxysporum, F. poae or F. tricinctum [11]. Currently, ENNs are not regulated. The last European Food Safety Authority (EFSA) report concluded that there was a lack of acute toxicity and genotoxicity data [12].
Mycotoxins can be found in various foodstuffs such as coffee, beans, nuts, spices, maize, wheat, etc. [13]. Mycotoxin contamination is a worldwide issue for human and animal health, crop cultivation and meat production [10,14]. Mycotoxins are thermally stable, meaning that they are not destroyed during food processing [15,16,17]. Consumption of contaminated products may lead to bioaccumulation of the toxins in the organs, leading to acute or chronic effects on humans and animals depending on the dose and duration of exposure [10,15,18]. The possible effects can be mutagenic, teratogenic, carcinogenic, hepatotoxic, cytotoxic or immunosuppressive [6,7,8]. Therefore, some mycotoxin concentrations are regulated worldwide and controlled in food [2]. In the European Union, the Commission Regulation 2023/915 [19] and its amendments [20,21] define the maximum levels (MLs) of mycotoxins in food. For unprocessed cereals, the ML for AFB1 is set at 2 µg/kg, while the total concentration of AFs must not exceed 4 µg/kg. The combined concentration of fumonisins B1 and B2 (FUM) is limited to 1000 µg/kg. Additionally, the MLs are 5 µg/kg for OTA, 1000 µg/kg for DON, 100 µg/kg for ZEA and 50 µg/kg for the sum of T-2 and HT-2 toxins. In feed, Directive 2002/32/EC of the European Parliament and its amendments define maximum contents for certain mycotoxins [22]. The MLs are 250 µg/kg for OTA, 8000 µg/kg for DON, and 2000 µg/kg for ZEA. These regulations are updated in line with advances in knowledge about mycotoxins’ toxic effects.
Mycotoxin contamination can occur during pre-harvest, harvest and storage stages if the conditions are appropriate [13,23]. Infections by toxigenic fungi are influenced by weather conditions, especially humidity and temperature, agricultural practices, insect damage and storage conditions [5,23,24]. In cereals, heavy rains, leading to high air humidity, during flowering can induce Fusarium infection of ears, which can lead to higher mycotoxin content in the plants [25]. Fusarium growth increases at temperatures between 20 °C and 30 °C and in a matrix with water activity above 0.88 [25]. The probability of contamination with ZEA increases with heavy precipitation and long cool periods [23]. In addition, late harvest coupled with favorable weather conditions may enhance ZEA production [26]. On the other hand, Aspergillus growth is enhanced under warm temperatures, between 25 °C and 35 °C, and dry weather [27]. Aspergillus mycotoxin and FUM productions are higher above 22 °C [27]. Dry weather and late season rains may lead to FUM production [25].
Wheat is one of the most widely cultivated crops in the world [28]. It is a major source of carbohydrates and essential micro-nutrients in the human diet [28,29]. In 2023, the Food and Agriculture Organization (FAO) estimated the global cereal production at 2847 million tons [30]. In Europe, an average of 26 million hectares of wheat is cultivated, leading to the production of approximatively 254.6 million tons for food and feed ingredients [30]. The worldwide average amount of wheat consumption per capita is 65.6 kg annually, and it is the second most consumed cereal after rice [28]. In Europe, 43.8% of the wheat produced is used for food and 36% for feed, while the other 20.2% is used for seed, processing and other uses, or subjected to losses [28]. In Wallonia, the southern part of Belgium, the situation is different, as only 10% of the wheat is used for food, 45% for feed and 45% for fuel [31].
The most prevalent mycotoxins in wheat are DON, ZEA, AFB1, OTA, HT2, T2, AFs and FUMs [24]. In addition, some emerging mycotoxins have also been detected in wheat, such as ENNs, BEA and moniliformin [7]. Co-occurrence of mycotoxins is a common phenomenon, as fungal species can produce multiple mycotoxins [3].
Mycotoxins are one of the most important issues regarding food safety, as they are observed worldwide in crops and can cause adverse effects on human health [32]. In addition, fungal infection and mycotoxin contamination have a huge economic impact on agriculture and the food industry, as they can lead to a decrease in production yield or destruction of contaminated products [23,24,33]. Up to 60 to 80% of food crops are contaminated with mycotoxins, depending on the mycotoxin [34]. Furthermore, due to climate change, mycotoxin contamination patterns tend to evolve, and mycotoxin contamination is expected to increase [24,35,36]. Therefore, continuous monitoring and analysis of conventional and emerging mycotoxins is of paramount importance.
Different methods allow mycotoxin detection in food matrices. Many chromatographic technics can be used for this purpose [37]. More specifically, liquid chromatography (LC) coupled with tandem mass spectrometry (UPLC-MS/MS) is one of the most widely used analytical methods for multi-targeted mycotoxin monitoring, thanks to its accuracy, even in complex matrices [38]. Modern chromatographic technics can also be used to analyze mycotoxins such as nano-LC to increase sensibility and decrease sample volume. However, such technics require a higher clean-up of the sample to avoid system clogging [37]. For untargeted analysis, high-resolution liquid chromatography is generally used.
Currently, mycotoxin contamination patterns in Belgium remain poorly understood. As these patterns are likely to evolve with climate change, it is important to investigate the current situation. This study provides an overview of the occurrence of mycotoxins in wheat harvested in Belgium in 2023 and 2024, two agronomic years characterized by markedly different rainfall patterns during anthesis and harvest, which are critical periods for fungal contamination and mycotoxin production. Various wheat samples were collected at diverse locations and analyzed using a validated multi-mycotoxin analysis method by UPLC-MS/MS.

2. Materials and Methods

2.1. Chemicals and Reagents

All chemicals and reagents used in this study were of analytical grade: Milli-Q water (Milli-Q® IQ 7010 purification system) (MilliporeSigma, Burlington, MA, USA), acetonitrile AR (Biosolve, Dieuze, France), acetonitrile MS/MS grade (Biosolve, Dieuze, France), acetic acid AR (Fisher Chemical, Merelbeke, Belgium), methanol MS/MS grade (Biosolve, Dieuze, France), formic acid (Avantor, VWR, Leuven, Belgium), ammonium acetate (Fluka, Mint Street, NC, USA), MgSO4 (Roth, Karlsruhe, Germany) and NaCl (Roth, Karlsruhe, Germany).
Mycotoxin standard solutions of known concentration for 15-acetyldeoxynivalenol (15Ac-DON), 3-acetyldeoxynivalenol (3Ac-DON), DON, HT2, alternariol (AOH), alternariol-monomethyl-ether (AME), T2, ZEA, OTA, OTB, FUM B1 and STE were purchased from Romer-Labs (Romer-Labs, Getzersdorf, Austria). ENNs (A, A1, B and B1) standards were purchased from Merck (Merck KGaA, Darmstadt, Germany).

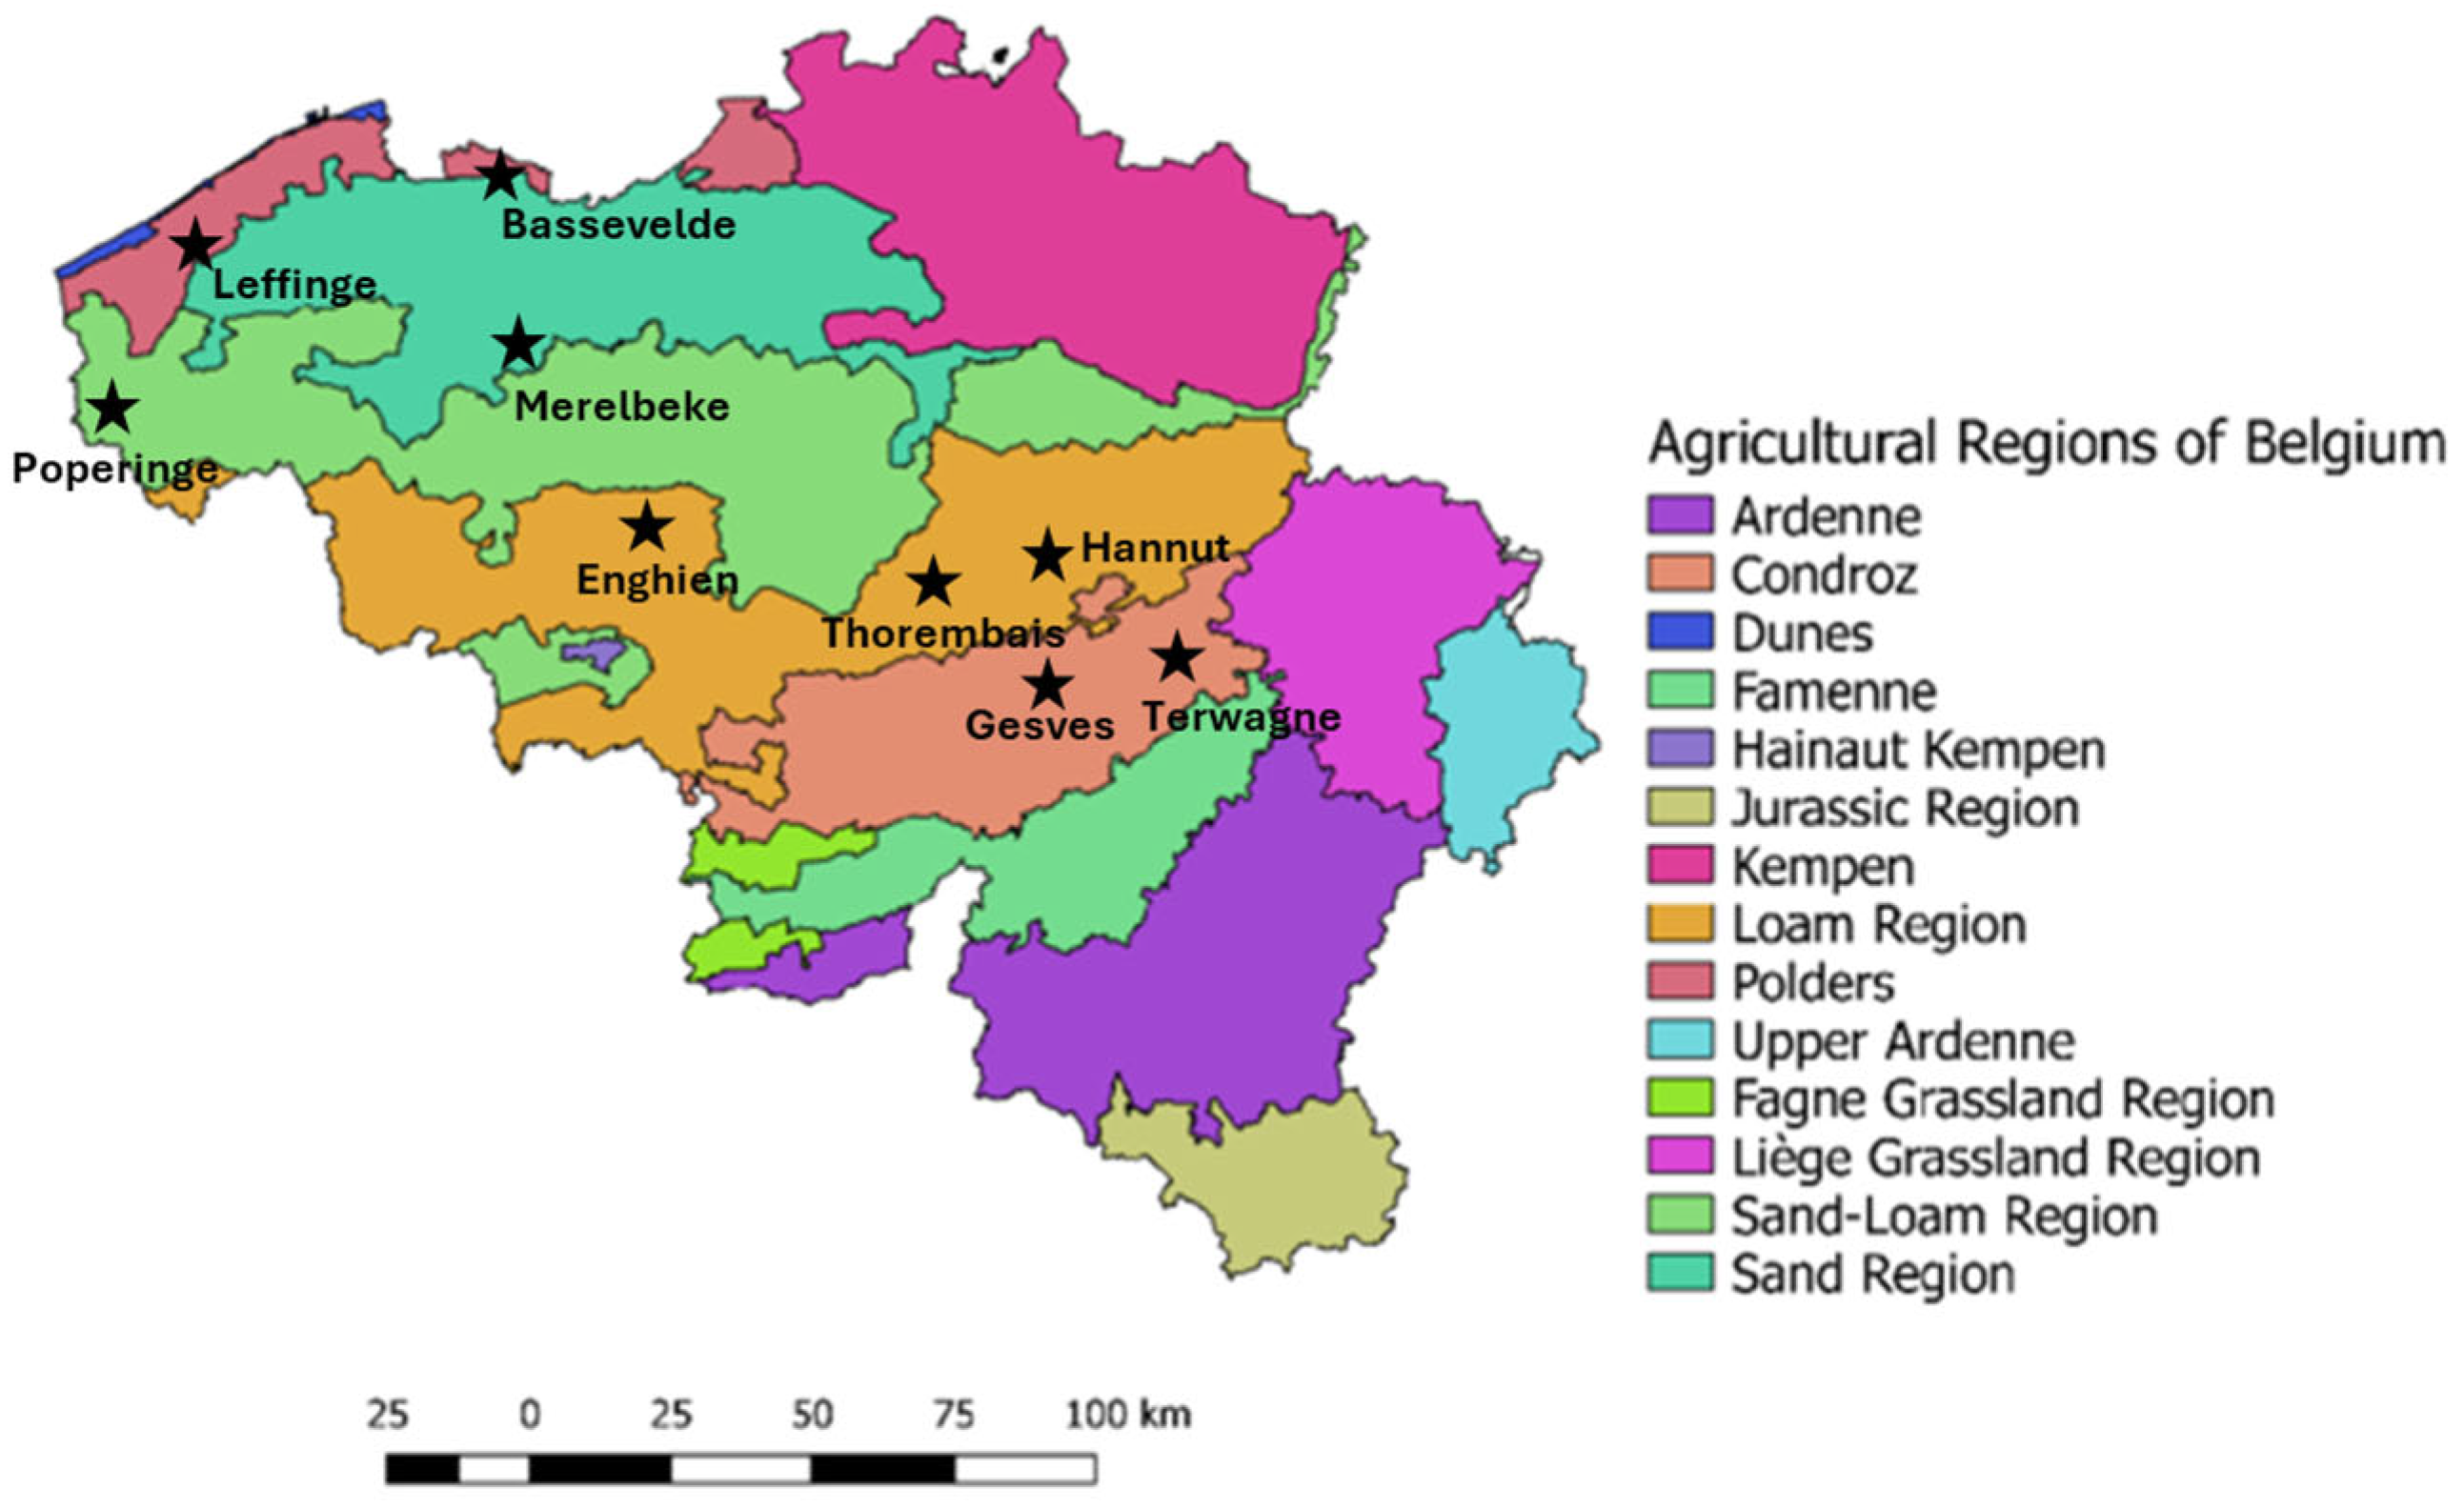
2.2. Sample Collection

A total of 45 samples of wheat grains from the 2023 harvest and 88 samples from the 2024 harvest were analyzed.
In 2023, the samples came from a trial network having nine different locations distributed across Belgian territory (Thorembais, Hannut, Gesves, Terwagne, Enghien, Leffinge, Poperinge, Merelbeke and Bassevelde). This trial network was set up by CRA-W and ILVO for variety registration in Belgium. These trials aim to compare varieties in contrasting pedoclimatic growth conditions and are conducted without fungicide protection or growth regulator. Varieties are cultivated in microplots (11 to 15 m2, depending on the trials) and are harvested using a special combine harvester, which allows the separate harvesting of each plot and avoids mixing the samples taken from each plot. From each location, five varieties were analyzed.
In 2024, the samples were collected from the same trial network from only eight different locations, as the Bassevelde field could not be sown due to poor climatic conditions in winter 2023. For each location, 11 varieties were collected. The different locations of sample collection are presented in Figure 1.
The trials were sown between October and December and the samples were harvested in July and August, depending on the location. The sowing and harvest dates, the presence or absence of ploughing, and previous crops cultivated on the field are presented in Table 1.
Flowering and maturity dates have been estimated based on the Phénoblé tool (CRA-W, Gembloux, Belgium). In 2023, wheat flowering occurred between the 7th and the 10th of June, and the wheat reached maturity around the 20th of July. In 2024, flowering occurred between the 2nd and the 4th of June, and maturity was reached around the 22nd of July.

2.3. Meteorological Considerations

During the first season of sampling, October and November 2022 were dry and warm in Belgium, while December was marked by several days of frost. Precipitation remained within normal levels. On average, January 2023 was mild and wet, whereas February was particularly dry. The spring of 2023 was extremely rainy, with a colder-than-average April. From mid-May to the end of June, at the time of ear emergence and flowering of wheat crops, the weather was very dry and sunny. Late July and early August had significant rainfall, delaying much of the harvest.
During the second season of sampling, rain returned from mid-October 2023 onward, delaying most sowing activities. The winter was very wet and generally mild, except for a period of frost and snow in mid-January. Spring of 2024 was extremely rainy, as was June. However, precipitation decreased in July and August, allowing for a successful wheat harvest under good conditions.
Daily temperatures and precipitations in May and June 2023 and 2024 are presented in Figure 2.

2.4. Sample Preparation

The mycotoxin analysis was performed on whole-wheat flour, obtained after milling approximately 50 g of wheat grains using a laboratory mill (Cyclotec, FOSS, Nanterre, France). The resulting flour had a particle size under 1 mm.
The extraction procedure was adapted from the QuEChERS method [40,41,42,43,44].
Five grams of whole-wheat flour was weighed in Falcon tubes (50 mL) and 10 mL of water was added. After a one-hour rest, 10 mL of acetonitrile solution containing 1% acetic acid was introduced in each tube. The samples were then agitated using a Mixer Mill MM400 (Retsch GmbH, Aartselaar, Belgium) for 10 min at 10 Hz. Thereafter, 4 g of MgSO4 and 1 g of NaCl were added to the tubes. The tubes were hand shaken and then agitated using a Mixer Mill MM400 for 2 min at 10 Hz. After stirring, the samples were centrifuged for 5 min at 3000 g (Centrifuge 5810 R, Eppendorf, Leipzig, Germany).
A volume of 100 µL of the supernatants was collected and diluted with 900 µL of a 50:50 (v/v) solution of water and methanol into injection vials.

2.5. Standard Solutions and Calibration

Two mycotoxin pools were constituted by diluting the initial individual standard solution in acetonitrile. The first pool was composed of 15Ac-DON, 3Ac-DON, DON, HT2, AOH, AME, T2, ZEA, OTA and OTB, with 15Ac-DON, 3Ac-DON, DON, HT2, AOH, AME, T2, ZEA at 100 µg/kg, DON at 1000 µg/kg and OTA and OTB at 5 µg/kg. The second pool was prepared including the following emerging mycotoxins: ENNs (A, A1, B, B1), FUM B1 and STE, all at 100 µg/kg.
To address potential matrix effects, matrix-matched calibration curves were established by spiking mycotoxins into a sample extract free of the targeted mycotoxins.
Two different calibration curves were produced, one with each mycotoxin pool. The whole-wheat flour (used as a “blank” matrix) was extracted as described above. Specified volumes of blank matrix extract were introduced in 1.5 mL Eppendorf tubes. Then, specific volumes of the mycotoxin pool solution were added to the Eppendorf tubes to make a total volume of 1 mL. A volume of 100 µL of the obtained solution was sampled and 900 µL of a 50:50 (v/v) solution of water and methanol was added. Then, the solutions were transferred into injection vials. The mycotoxin concentrations used for the calibration curves are shown in Table 2.

2.6. UPLC-MS/MS Conditions

The UPLC-MS/MS conditions were optimized based on different studies such as [40,41,42,43].
The samples were injected into a Waters Acquity I-Class (Waters, Milford, MA, USA) UPLC system equipped with a BEH C18 column (2.1mm × 50 mm, 1.7 μm), coupled to a Xevo TQ-xS mass spectrometer (Waters, Milford, MA, USA). Mobile phase A was a 10 mM ammonium acetate–water solution containing 0.1% formic acid, and mobile phase B was methanol with 0.1% formic acid. The column temperature was set at 50 °C, the flow rate was 0.3 mL/min and the injection volume was 2 µL. The elution gradient started at 10% B, held for 3 min and increased linearly to 30% in 7 min; then increased again to 10% in 10 s and kept constant for 2 min. Finally, B decreased to 10% in 10 s and equilibrated for 3 min.
The mass spectrometer was used in Multiple Reaction Monitoring (MRM) under positive ionization modes. Two transitions were selected for each mycotoxin, one for quantification and another for qualification. Regarding the mass spectrometer parameters, the capillary voltage was 3.4 kV, the desolvation temperature was 400 °C, the desolvation gas flow was 800 L/Hr, the cone gas flow was 150 L/Hr and the nebuliser pressure was 7 bar. The cone voltage and the collision energy were optimized for each transition by direct infusion. The transitions used for each mycotoxin and the associated energies and cone voltages are presented in Table 3. Examples of mass spectra for the DON and ENN B are shown in Figure 3.

2.7. Data Treatment

For each sample, the peaks from the obtained chromatograms were integrated using TargetLynx V4.2 (Waters, USA). The calibration curves were determined by plotting the peak area of the quantification transition versus the mycotoxin concentration and using the linear regression equation y = ax + b. An average calibration curve, calculated from the calibration curves injected before and after the samples (bracketed calibration), was used for quantification.
The sample concentrations were calculated based on the average calibration curve for each mycotoxin and corrected using the exact mass of the sample intake and the recovery of each mycotoxin determined during method validation.
Recoveries were determined by spiking samples with known amounts of each mycotoxin. Samples were spiked to obtain three levels of concentration according to the MLs for the regulated mycotoxins, ML/2, ML and 1.5× ML. For non-regulated mycotoxins, the central value was 100 µg/kg. The spiked samples were then extracted as described above. For each level of concentration and for each individual sample, the recovery, expressed as a percentage, was calculated as the ratio between the calculated concentration and theoretical concentration. These recoveries are presented in Table 4. The lowest points of calibration used as the limit of quantification (LOQ) and the limit of detection (LOD) determined during method validation are also presented in Table 4. For OTA and OTB, the second-lowest point of calibration was used as the LOQ, because signal-to-noise (S/N) ratio was too low for the lowest point of calibration. The LOD was determined by extrapolating a concentration corresponding to a S/N of 3, then experimentally verified by spiking standard solutions in blank matrices to adjusted concentrations until this ratio was achieved.
Each sample was extracted and analyzed twice. The difference between the two calculated concentrations was required not to exceed 20%. Otherwise, the sample was re-extracted in duplicate.
All the statistical analyses were conducted using RStudio, version 2024.12.0 (Posit software PBC, Boston, MA, USA). The differences between the wheat varieties and the wheat cultivation sites were assessed through a Kruskal–Wallis test followed by a Dunn test.

3. Results

3.1. Mycotoxin Occurrence in Samples Collected in 2023 and 2024

A total of 133 samples were analyzed using the UPLC-MS/MS multi-mycotoxins analytical method. In 2023 (Table 5), nine out of 45 samples, corresponding to one-fifth of the total, were contaminated with mycotoxins at concentrations exceeding the LOQ. The mycotoxins detected were DON, ZEA and ENN B; the other mycotoxins included in the method were not detected in these samples. Only two samples showed co-contamination by at least two mycotoxins.
In 2024 (Table 6), 74 out of 88 samples displayed higher concentrations than the LOQ for at least one mycotoxin, meaning that 84% of the samples contained quantifiable amounts of mycotoxins. DON, ZEA, ENN A1, ENN B and ENN B1 were the mycotoxins detected by UPLC-MS/MS. Co-contamination occurred in 59 samples. ENN B was the most prevalent mycotoxin in the 2024 samples. It was detected in 68 samples with concentrations ranging from 12 to 488 µg/kg. DON was detected in 52 samples, ENN B1 in 49, ENN A1 in 17 and ZEA in 10 samples. One sample was contaminated with DON at 1479 µg/kg, exceeding the level of 1000 µg/kg fixed by the European regulation for grains intended to be used for food [20]. No sample was over the limit for ZEA as the maximum level detected was 55 µg/kg, while the ML set in the European legislation is 100 µg/kg [19]. The maximum levels detected for ENN A1, B and B1 were 49, 488 and 185 µg/kg, respectively. Currently, ENNs are not regulated in Europe. Mycotoxin contamination was higher in 2024 than in 2023, in terms of both the number of contaminated samples and the contamination levels.
As few samples from the 2023 harvest were positive or had mycotoxin concentrations exceeding the LOQ, no further data analysis was performed. In 2024, most of the samples were contaminated by at least one mycotoxin, allowing for an assessment of the differences in contamination between varieties and cultivation sites. All the data are in the Supplementary Materials (Tables S1 and S2).

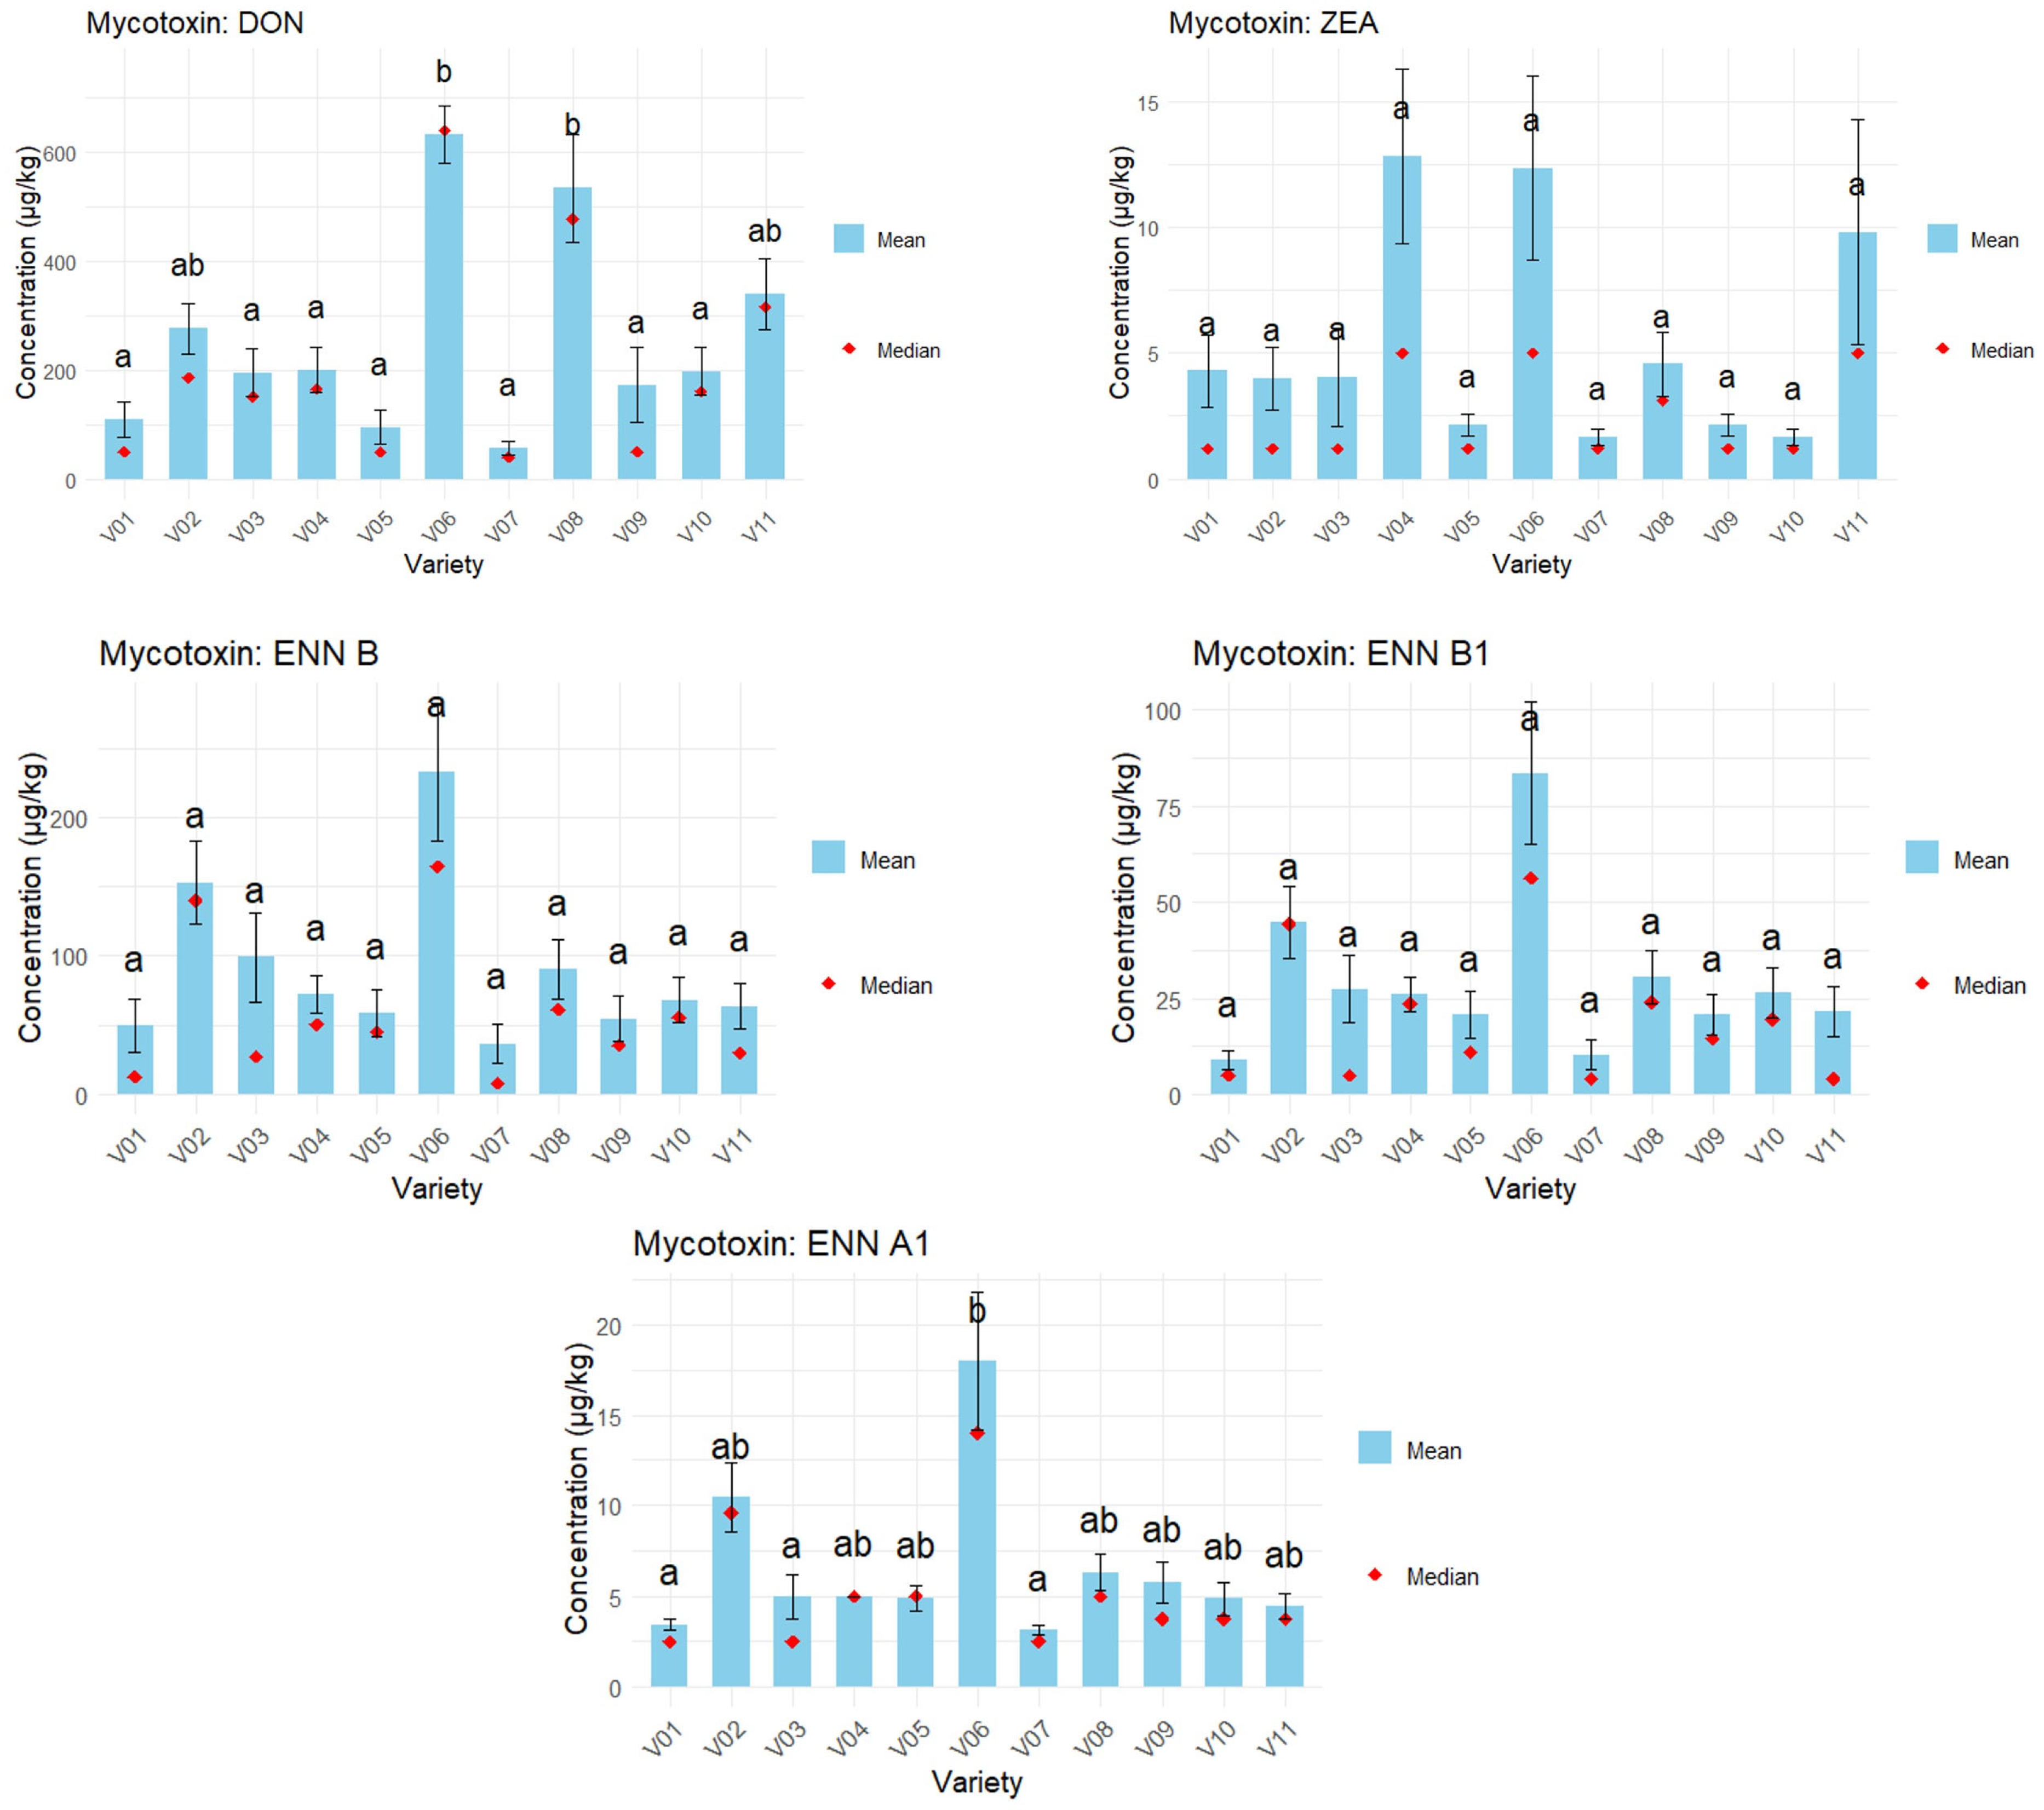
3.2. Differences in Concentration Between the Varieties in 2024 Wheat Samples

For each mycotoxin, the differences in mycotoxin concentration between the varieties were assessed, as 11 different varieties of wheat were cultivated in each location. Hence, eight samples of each variety were available to be analyzed by UPLC-MS/MS. The results are shown in Figure 4 and the Supplementary Material (Table S2). The significance of the differences between the varieties was evaluated by performing a Kruskal–Wallis test (Table 7).
For ENN B, there was no significant difference in concentration between the varieties (p < 0.05). For the other mycotoxins (DON, ZEA, ENN B1 and ENN A1), a significant difference between the varieties was found.
Statistically, the DON concentration was higher in varieties 06 and 08. In addition, variety 06 was more contaminated with ENN A1 than the other varieties. For ENN B, ENN B1 and ZEA, the mycotoxin concentrations in the different varieties could not be statistically differentiated. However, variety 06 had the higher means among the analyzed varieties for ENN B and ENN B1. Therefore, within the scope of this work, considering the specific conditions of the 2024 study, variety 06 appears to be at a higher risk for mycotoxin contamination. On the other hand, variety 07 is among the least contaminated varieties for each mycotoxin; this variety seems to be more resistant to mycotoxin contamination. In addition, field observations are consistent with these results, as almost no wheat ears showed symptoms from Fusarium infection. However, these results should be confirmed with additional trials during subsequent years.

3.3. Differences in Mycotoxin Concentration Between the Cultivation Sites in 2024 Wheat Samples

The location effect was studied by comparing the contamination level for each mycotoxin among the 11 varieties harvested in each location (Figure 5). The significance of the differences between the locations was evaluated by a Kruskal–Wallis test (Table 8).
For each mycotoxin, the cultivation site had a significant effect on the concentration. Within the scope of this work, for DON contamination, the most critical cultivation site was Gesves, and for ZEA it was Terwagne. For ENNs, mycotoxin contamination was significantly higher in Gesves, Hannut, Terwagne and Merelbeke. In 2024, Gesves seemed to be the most affected growing site for all mycotoxins. On the other hand, for ENNs, Enghien, Leffinge, Poperinge and Thorembais were less affected by mycotoxin contamination. For DON and ZEA, the sites the least affected by mycotoxin contamination were Enghien and Thorembais. Poperinge was not subjected to ZEA contamination at all.

4. Discussion

4.1. Effect of the Year of Harvest of Wheat on the Mycotoxin Contamination

Samples collected from the 2024 harvest were more contaminated by mycotoxins in terms of number of contaminated samples and level of contamination. However, only one sample was contaminated at a level exceeding the European regulation for food. As reported in the literature [25,27,45], rainy conditions and high relative humidity during the flowering of the wheat may enhance fungal contamination and mycotoxin production. Hence, the higher contamination of the 2024 samples (approximatively 86%) compared to those from 2023 (20% of positive samples) may be explained by weather conditions, as the period from mid-May to June 2023 was dry in Belgium, whereas the spring of 2024 was rainy. However, European data on mycotoxin contamination in cereals are available and indicate no significant difference in contamination levels between 2023 and 2024. For example, for DON, Cargill reported that 88% of samples were contaminated in both 2023 and 2024, while dsm-Firmenich reported 77% in 2023 and 76% in 2024 [46,47]. In contrast, the present study, conducted within a more geographically restricted area, reveals greater interannual variation, likely due to the stronger influence of local weather conditions on fungal development and mycotoxin production.
Other factors may explain the difference in mycotoxin contamination of wheat between these two years. Climate change is often cited as a factor influencing mycotoxin contamination patterns, as shifts in temperature and seasonal variations can alter the wheat growth cycle, potentially making it more susceptible to contamination [48,49,50]. However, to have a better understanding of the impact of climate changes on mycotoxin contamination of wheat in Belgium, this study should be continued for several years.
Both in 2023 and 2024, the same mycotoxins were detected except for ENN A1, which was detected only in 2024. DON and ZEA are commonly present in wheat [45], and this study confirms this observation. ENNs were the most prevalent mycotoxins in the samples harvested in 2024, whereas they were only detected in seven samples in 2023. ENNs are considered emerging mycotoxins as they are not regulated or routinely analyzed. However, there is a growing concern about these mycotoxins as they are more often detected and at a higher concentration [50]. dsm-Firmenich highlights a notable global presence of ENN B, supporting the observation made in this study of increased ENN B levels in Belgian wheat samples from 2024 [47]. The EFSA report from 2014 indicates that acute exposure to ENNs is not a concern for human health [12]. However, the data are not sufficient to draw firm conclusions about the chronic exposure for these mycotoxins. Therefore, it is relevant to gather contamination data if a new risk assessment is performed.

4.2. Differences in Mycotoxin Concentration Between the Wheat Varieties

Significant differences in concentration for DON, ZEA, ENN A1 and ENN B1 were observed between the wheat varieties (p < 0.05). For each mycotoxin, the differences in mycotoxin concentration between the varieties were assessed, as 11 different varieties of wheat were cultivated in each location. Hence, eight samples of each variety were available to be analyzed by UPLC-MS/MS. The results are shown in Figure 4 and the Supplementary Material (Table S2). The significance of the differences between the varieties was evaluated by performing a Kruskal–Wallis test (Table 7). This highlights that certain varieties may be more susceptible to mycotoxin contamination than others. For example, studies showed that lower anther retention is linked with high resistance to fungal infection [51]. These trials should be repeated over several years to confirm that the observations are due to varietal effect and not only an annual effect. Such differences in susceptibility could be attributed to genetic factors influencing fungal infection and toxin production. These findings emphasize the importance of selecting and breeding varieties with enhanced fungal resistance, which is one of the criteria for the acceptance and commercialization of new varieties. Incorporating resistance traits into breeding programs contributes to reducing mycotoxin contamination and improving the overall safety and quality of harvested grains. The selection of mycotoxin-resistant varieties represents a more effective strategy than fungicide application for reducing the risk of contamination.

4.3. Differences in Mycotoxin Concentration Between the Wheat Cultivation Sites

There is a significant effect of location on the mycotoxin presence in wheat. The location effect was studied by comparing the contamination level for each mycotoxin among the 11 varieties harvested in each location (Figure 5). The significance of the differences between the locations was evaluated by a Kruskal–Wallis test (Table 8).
The most impacted site in 2024 was Gesves, which had been subjected to heavy rainfall and mudflows that had damaged the cultivation site. Other significantly affected sites included Hannut, Terwagne and Merelbeke. Each site belongs to a different pedological region, except for Gesves and Terwagne, which are situated in Condroz. From these data, no clear relationship can be established between the pedological region and mycotoxin contamination. Based on crop history data from the past 7 years, the Terwagne site has frequently been cultivated with wheat and silage maize. This cropping pattern may have contributed to the buildup of a local inoculum. In contrast, silage maize was not present at the other Walloon sites.
At this stage, no obvious link can be established with the previous crop, sowing, ploughing or harvest dates. It could be interesting to investigate whether the same sites are the most affected by fungal contamination and mycotoxin presence each year, while others appear to be better preserved. Therefore, more data should be collected in the coming years to draw broader conclusions about the link between mycotoxin contamination and agricultural factors, helping to mitigate specific effects.

5. Conclusions

This study provides updated data on mycotoxin contamination in wheat harvested in Belgium during the 2023 and 2024 growing seasons. A total of 113 samples were analyzed, revealing a higher occurrence of mycotoxins in 2024, particularly ENNs. Notably, one sample exceeded the European ML for DON in 2024, while all the samples from 2023 remained below the regulatory thresholds. These findings underscore the strong influence of weather conditions, especially the rainy period during wheat flowering in 2024, which likely promoted fungal growth and subsequent mycotoxin production. Although climate change is frequently cited as a driver of such contamination patterns, long-term monitoring will be essential to better evaluate its specific impact in Belgium.
The results also highlight the importance of wheat variety selection and cultivation site conditions in managing mycotoxin risk. Certain varieties showed different levels of susceptibility to contamination, reinforcing the need for breeding programs focused on improving resistance to fungal pathogens. Additionally, annual variations in climate can significantly influence mycotoxin development, making some locations appear more or less favorable depending on specific weather events rather than inherent site characteristics.
By providing a two-year comparative dataset, this study provides an overview of mycotoxin occurrence in wheat in Belgium. Multiple factors may influence the mycotoxin presence in crops, such as weather (temperature and humidity), agricultural practices, previous crops, pests, etc., making it difficult to fully understand the underlying mechanisms. To better understand these trends and develop effective mitigation strategies, further data collection over multiple years is essential. This will provide a clearer picture of potential contamination patterns and help refine agricultural practices to minimize mycotoxin risks and ensure safer wheat production in the future.

Supplementary Materials

The following supporting information can be downloaded at https://www.mdpi.com/article/10.3390/foods14132300/s1, Table S1: Mycotoxin concentrations of 2023 wheat samples; Table S2: Mycotoxin concentration of 2024 wheat samples.

Author Contributions

Conceptualization, S.G. and C.J.; methodology, J.P., D.E., C.J. and S.G.; validation, C.J. and S.G.; formal analysis, J.P., D.E., C.J., S.G. and A.C.; investigation, J.P., D.E., C.J. and S.G.; resources, D.E. and J.P.; data curation, C.J.; writing—original draft preparation, C.J.; writing—review and editing, A.C., M.-L.S. and C.D.; visualization, C.J.; supervision, B.G.; project administration, B.G.; funding acquisition, B.G. All authors have read and agreed to the published version of the manuscript.

Funding

This research was funded by the ValCerWal project funded by the Walloon region (Plan de Relance de la Wallonie-Project 204/2). The APC was funded by MDPI.

Data Availability Statement

The original contributions presented in this study are included in the article/Supplementary Material. Further inquiries can be directed to the corresponding author(s).

Acknowledgments

The samples used in this study come from trials financed by the Walloon and Flemish regions in the context of the registration of field crop varieties in the Belgian Catalogue. The authors would also like to thank the technical teams involved in the trials and their harvesting. In addition, the authors kindly thank Marie Dubray and Athina Rega for their work in the analysis of mycotoxins in the collected samples.

Conflicts of Interest

The authors declare no conflicts of interest. The funders had no role in the design of the study; in the collection, analyses, or interpretation of data; in the writing of the manuscript; or in the decision to publish the results.

Abbreviations

The following abbreviations are used in this manuscript:
15Ac-DON15-acetyldeoxynivalenol
3Ac-DON3-acetyldeoxynivalenol
AFaflatoxin
AFB1aflatoxin B1
AMEalternariol-monomethyl-ether
AOHalternariol
BEAbeauvericin
dfdegree of freedom
DONdeoxynivalenol
EFSAEuropean Food Safety Authority
ENNenniatin
FAOFood and Agriculture Organization
FUMfumonisin
HT2HT2 toxin
LCliquid chromatography
LODlimit of detection
LOQlimit of quantification
MLmaximum level
MRMMultiple Reaction Monitoring
NDnon-detected
OTAochratoxin A
OTBochratoxin B
S/Nsignal-to-noise ratio
STEsterygmatocystin
T2T2 toxin
UPLC-MS/MSUltra Performance Liquid Chromatography coupled with tandem mass spectrometry
ZEAzearalenone

References

  1. WHO (World Health Organization). Mycotoxins. Available online: https://www.who.int/news-room/fact-sheets/detail/mycotoxins (accessed on 19 May 2025).
  2. Tola, M.; Kebede, B. Occurrence, Importance and Control of Mycotoxins: A Review. Cogent Food Agric. 2016, 2, 1191103. [Google Scholar] [CrossRef]
  3. Smith, M.-C.; Madec, S.; Coton, E.; Hymery, N. Natural Co-Occurrence of Mycotoxins in Foods and Feeds and Their In Vitro Combined Toxicological Effects. Toxins 2016, 8, 94. [Google Scholar] [CrossRef]
  4. Pereira, V.L.; Fernandes, J.O.; Cunha, S.C. Mycotoxins in Cereals and Related Foodstuffs: A Review on Occurrence and Recent Methods of Analysis. Trends Food Sci. Technol. 2014, 36, 96–136. [Google Scholar] [CrossRef]
  5. Kolawole, O.; Siri-Anusornsak, W.; Petchkongkaew, A.; Elliott, C. A Systematic Review of Global Occurrence of Emerging Mycotoxins in Crops and Animal Feeds, and Their Toxicity in Livestock. Emerg. Contam. 2024, 10, 100305. [Google Scholar] [CrossRef]
  6. De Felice, B.; Spicer, L.J.; Caloni, F. Enniatin B1: Emerging Mycotoxin and Emerging Issues. Toxins 2023, 15, 383. [Google Scholar] [CrossRef] [PubMed]
  7. Ekwomadu, T.I.; Akinola, S.A.; Mwanza, M. Fusarium Mycotoxins, Their Metabolites (Free, Emerging, and Masked), Food Safety Concerns, and Health Impacts. Int. J. Environ. Res. Public Health 2021, 18, 11741. [Google Scholar] [CrossRef]
  8. EFSA Panel on Contaminants in the Food; Schrenk, D.; Bodin, L.; Chipman, J.K.; del Mazo, J.; Grasl-Kraupp, B.; Hogstrand, C.; Hoogenboom, L.; Leblanc, J.-C.; Nebbia, C.S. Risk Assessment of Ochratoxin a in Food. EFSA J. 2020, 18, e06113. [Google Scholar] [CrossRef] [PubMed]
  9. IARC. Some Naturally Occurring Substances: Food Items and Constituents, Heterocyclic Aromatic Amines and Mycotoxins; International Agency for Research on Cancer, Ed.; This Publication Represents the Views and Expert Opinions of an IARC Working Group on the Evaluation of Carcinogenic Risks to Humans, Which Met in Lyon, 9–16 June 1992; IARC monographs on the evaluation of the carcinogenic risk of chemicals to humans; IARC: Lyon, France, 1993; ISBN 978-92-832-1256-0. [Google Scholar]
  10. Zain, M.E. Impact of Mycotoxins on Humans and Animals. J. Saudi Chem. Soc. 2011, 15, 129–144. [Google Scholar] [CrossRef]
  11. Gruber-Dorninger, C.; Novak, B.; Nagl, V.; Berthiller, F. Emerging Mycotoxins: Beyond Traditionally Determined Food Contaminants. J. Agric. Food Chem. 2017, 65, 7052–7070. [Google Scholar] [CrossRef]
  12. EFSA Panel on Contaminants in the Food. Scientific Opinion on the Risks to Human and Animal Health Related to the Presence of Beauvericin and Enniatins in Food and Feed. EFSA J. 2014, 12, 3802. [Google Scholar] [CrossRef]
  13. Marin, S.; Ramos, A.J.; Cano-Sancho, G.; Sanchis, V. Mycotoxins: Occurrence, Toxicology, and Exposure Assessment. Food Chem. Toxicol. 2013, 60, 218–237. [Google Scholar] [CrossRef]
  14. Pleadin, J.; Frece, J.; Markov, K. Mycotoxins in Food and Feed. Adv. Food Nutr. Res. 2019, 89, 297–345. [Google Scholar] [CrossRef] [PubMed]
  15. Mousavi Khaneghah, A.; Fakhri, Y.; Gahruie, H.H.; Niakousari, M.; Sant’Ana, A.S. Mycotoxins in Cereal-Based Products During 24 Years (1983–2017): A Global Systematic Review. Trends Food Sci. Technol. 2019, 91, 95–105. [Google Scholar] [CrossRef]
  16. Ji, F.; He, D.; Olaniran, A.O.; Mokoena, M.P.; Xu, J.; Shi, J. Occurrence, Toxicity, Production and Detection of Fusarium Mycotoxin: A Review. Food Prod. Process. Nutr. 2019, 1, 6. [Google Scholar] [CrossRef]
  17. Bullerman, L.B.; Bianchini, A. Stability of Mycotoxins During Food Processing. Int. J. Food Microbiol. 2007, 119, 140–146. [Google Scholar] [CrossRef]
  18. Sun, L.-H.; Lei, M.; Zhang, N.-Y.; Zhao, L.; Krumm, C.S.; Qi, D.-S. Hepatotoxic Effects of Mycotoxin Combinations in Mice. Food Chem. Toxicol. 2014, 74, 289–293. [Google Scholar] [CrossRef] [PubMed]
  19. European Commission. Commission Regulation (EU) 2023/915 of 25 April 2023 on Maximum Levels for Certain Contaminants in Food and Repealing Regulation (EC) No 1881/2006; European Commission: Brussels, Belgium, 2023; Volume L119, pp. 103–157. [Google Scholar]
  20. European Commission. Commission Regulation (EU) 2024/1022 of 8 April 2024 Amending Regulation (EU) 2023/915 as Regards Maximum Levels of Deoxynivalenol in Food; European Commission: Brussels, Belgium, 2024; Volume 9.4.2024, pp. 1–4. [Google Scholar]
  21. European Commission. Commission Regulation (EU) 2024/1038 of 9 April 2024 Amending Regulation (EU) 2023/915 as Regards Maximum Levels of T-2 and HT-2 Toxins in Food; European Commission: Brussels, Belgium, 2024; Volume 10.4.2024, pp. 1–5. [Google Scholar]
  22. European Commission. Directive 2002/32/EC of the European Parliament and of the Council of 7 May 2002 on Undesirable Substances in Animal Feed—Council Statement; European Commission: Brussels, Belgium, 2002; Volume L140, pp. 10–21. [Google Scholar]
  23. Mahato, D.K.; Devi, S.; Pandhi, S.; Sharma, B.; Maurya, K.K.; Mishra, S.; Dhawan, K.; Selvakumar, R.; Kamle, M.; Mishra, A.K.; et al. Occurrence, Impact on Agriculture, Human Health, and Management Strategies of Zearalenone in Food and Feed: A Review. Toxins 2021, 13, 92. [Google Scholar] [CrossRef]
  24. Khodaei, D.; Javanmardi, F.; Khaneghah, A.M. The Global Overview of the Occurrence of Mycotoxins in Cereals: A Three-Year Survey. Curr. Opin. Food Sci. 2021, 39, 36–42. [Google Scholar] [CrossRef]
  25. Marroquín-Cardona, A.G.; Johnson, N.M.; Phillips, T.D.; Hayes, A.W. Mycotoxins in a Changing Global Environment—A Review. Food Chem. Toxicol. 2014, 69, 220–230. [Google Scholar] [CrossRef]
  26. Moraes, W.B.; Madden, L.V.; Gillespie, J.; Paul, P.A. Environment, Grain Development, and Harvesting Strategy Effects on Zearalenone Contamination of Grain from Fusarium Head Blight-Affected Wheat Spikes. Phytopathology 2023, 113, 225–238. [Google Scholar] [CrossRef]
  27. Platzer, A.; Cherkaoui, Y.; Novak, B.; Schatzmayr, G. Investigating the Correlations Between Weather Factors and Mycotoxin Contamination in Corn: Evidence from Long-Term Data. Toxins 2025, 17, 77. [Google Scholar] [CrossRef]
  28. Erenstein, O.; Jaleta, M.; Mottaleb, K.A.; Sonder, K.; Donovan, J.; Braun, H.-J. Global Trends in Wheat Production, Consumption and Trade. In Wheat Improvement: Food Security in a Changing Climate; Reynolds, M.P., Braun, H.-J., Eds.; Springer International Publishing: Cham, Germany, 2022; pp. 47–66. ISBN 978-3-030-90673-3. [Google Scholar]
  29. Sarmast, E.; Fallah, A.A.; Jafari, T.; Mousavi Khaneghah, A. Occurrence and Fate of Mycotoxins in Cereals and Cereal-Based Products: A Narrative Review of Systematic Reviews and Meta-Analyses Studies. Curr. Opin. Food Sci. 2021, 39, 68–75. [Google Scholar] [CrossRef]
  30. FAO Cereal Supply and Demand Brief | Food and Agriculture Organization of the United Nations. Available online: https://www.fao.org/worldfoodsituation/csdb/en/ (accessed on 19 June 2024).
  31. Delcour, A.; Stilmant, D.; Burny, P.; Rabier, F.; Louppe, H.; Goffart, J.-P. État des lieux des flux céréaliers en Wallonie selon différentes filières d’utilisation. Biotechnol. Agron. Soc. Environ. 2014, 18, 181–192. [Google Scholar]
  32. Alshannaq, A.; Yu, J.-H. Occurrence, Toxicity, and Analysis of Major Mycotoxins in Food. Int. J. Environ. Res. Public Health 2017, 14, 632. [Google Scholar] [CrossRef] [PubMed]
  33. Pitt, J.I.; Miller, J.D. A Concise History of Mycotoxin Research. J. Agric. Food Chem. 2017, 65, 7021–7033. [Google Scholar] [CrossRef] [PubMed]
  34. Eskola, M.; Kos, G.; Elliott, C.T.; Hajšlová, J.; Mayar, S.; Krska, R. Worldwide Contamination of Food-Crops with Mycotoxins: Validity of the Widely Cited ‘FAO Estimate’ of 25%. Crit. Rev. Food Sci. Nutr. 2020, 60, 2773–2789. [Google Scholar] [CrossRef]
  35. Wang, X.; Liu, C.; Van Der Fels-Klerx, H.J. Regional Prediction of Multi-Mycotoxin Contamination of Wheat in Europe Using Machine Learning. Food Res. Int. 2022, 159, 111588. [Google Scholar] [CrossRef]
  36. Casu, A.; Camardo Leggieri, M.; Toscano, P.; Battilani, P. Changing Climate, Shifting Mycotoxins: A Comprehensive Review of Climate Change Impact on Mycotoxin Contamination. Compr. Rev. Food Sci. Food Saf. 2024, 23, e13323. [Google Scholar] [CrossRef]
  37. Vargas Medina, D.A.; Bassolli Borsatto, J.V.; Maciel, E.V.S.; Lanças, F.M. Current Role of Modern Chromatography and Mass Spectrometry in the Analysis of Mycotoxins in Food. TrAC Trends Anal. Chem. 2021, 135, 116156. [Google Scholar] [CrossRef]
  38. Turner, N.W.; Bramhmbhatt, H.; Szabo-Vezse, M.; Poma, A.; Coker, R.; Piletsky, S.A. Analytical Methods for Determination of Mycotoxins: An Update (2009–2014). Anal. Chim. Acta 2015, 901, 12–33. [Google Scholar] [CrossRef]
  39. De Frutos Cachorro, J.; Gobin, A.; Buysse, J. Farm-Level Adaptation to Climate Change: The Case of the Loam Region in Belgium. Agric. Syst. 2018, 165, 164–176. [Google Scholar] [CrossRef]
  40. Zhang, J.-M.; Wu, Y.-L.; Lu, Y.-B. Simultaneous Determination of Carbamate Insecticides and Mycotoxins in Cereals by Reversed Phase Liquid Chromatography Tandem Mass Spectrometry Using a Quick, Easy, Cheap, Effective, Rugged and Safe Extraction Procedure. J. Chromatogr. B 2013, 915–916, 13–20. [Google Scholar] [CrossRef] [PubMed]
  41. Sun, J.; Li, W.; Zhang, Y.; Hu, X.; Wu, L.; Wang, B. QuEChERS Purification Combined with Ultrahigh-Performance Liquid Chromatography Tandem Mass Spectrometry for Simultaneous Quantification of 25 Mycotoxins in Cereals. Toxins 2016, 8, 375. [Google Scholar] [CrossRef] [PubMed]
  42. Annunziata, L.; Stramenga, A.; Visciano, P.; Schirone, M.; De Colli, L.; Colagrande, M.N.; Campana, G.; Scortichini, G. Simultaneous Determination of Aflatoxins, T-2 and HT-2 Toxins, and Fumonisins in Cereal-Derived Products by QuEChERS Extraction Coupled with LC-MS/MS. Anal. Bioanal. Chem. 2017, 409, 5143–5155. [Google Scholar] [CrossRef] [PubMed]
  43. Solfrizzo, M.; Gambacorta, L.; Bibi, R.; Ciriaci, M.; Paoloni, A.; Pecorelli, I. Multimycotoxin Analysis by LC-MS/MS in Cereal Food and Feed: Comparison of Different Approaches for Extraction, Purification, and Calibration. J. AOAC Int. 2018, 101, 647–657. [Google Scholar] [CrossRef]
  44. González-Jartín, J.M.; Rodríguez-Cañás, I.; Alfonso, A.; Sainz, M.J.; Vieytes, M.R.; Gomes, A.; Ramos, I.; Botana, L.M. Multianalyte Method for the Determination of Regulated, Emerging and Modified Mycotoxins in Milk: QuEChERS Extraction Followed by UHPLC–MS/MS Analysis. Food Chem. 2021, 356, 129647. [Google Scholar] [CrossRef]
  45. Perrone, G.; Ferrara, M.; Medina, A.; Pascale, M.; Magan, N. Toxigenic Fungi and Mycotoxins in a Climate Change Scenario: Ecology, Genomics, Distribution, Prediction and Prevention of the Risk. Microorganisms 2020, 8, 1496. [Google Scholar] [CrossRef]
  46. Cargill. Cargill World Mycotoxin Report. 2024. Available online: https://mycotoxins.com/assets/content/knowledgecenter/survey/2024%20Cargill%20World%20Mycotoxin%20Report.pdf (accessed on 18 May 2025).
  47. DSM-Firmenich. World Mycotoxin Survey: The Global Threat–January–December 2024. 2024. Available online: https://www.dsm-firmenich.com/content/dam/dsm/anh/en/documents/REP_MTXsurvey_Q4_0525_63898.pdf (accessed on 18 May 2025).
  48. Medina, Á.; Rodríguez, A.; Magan, N. Climate Change and Mycotoxigenic Fungi: Impacts on Mycotoxin Production. Curr. Opin. Food Sci. 2015, 5, 99–104. [Google Scholar] [CrossRef]
  49. Liu, C.; Van der Fels-Klerx, H.J. Quantitative Modeling of Climate Change Impacts on Mycotoxins in Cereals: A Review. Toxins 2021, 13, 276. [Google Scholar] [CrossRef]
  50. Medina, A. Chapter 22—Emerging Mycotoxin Risks Due to Climate Change. What to Expect in the Coming Decade? In Present Knowledge in Food Safety; Knowles, M.E., Anelich, L.E., Boobis, A.R., Popping, B., Eds.; Academic Press: Cambridge, MA, USA, 2023; pp. 309–314. ISBN 978-0-12-819470-6. [Google Scholar]
  51. Michel, S.; Steiner, B.; Buerstmayr, H. Efficiency of Indirect Selection for Fusarium Head Blight Resistance and Mycotoxin Accumulation in Winter Wheat (Triticum aestivum L.). Plant Breed. 2024, 143, 34–43. [Google Scholar] [CrossRef]
Figure 1. Pedologic map of Belgium with the location of the cultivation sites. Adapted from reference [39].
Foods 14 02300 g001
Figure 2. Temperature (°C) and precipitation (mm) in May and June 2023 (a) and 2024 (b) in Gembloux. Data from IRM station in Gembloux.
Foods 14 02300 g002
Figure 3. Mass spectra for DON (a) and ENN B (b).
Foods 14 02300 g003
Figure 4. Mycotoxin contamination depending on the variety (n = 8 per variety) for 2024 wheat samples. Significance letters were assigned using a Dunn test performed after a Kruskal–Wallis test. Varieties sharing the same letter (a, ab or b) are not significantly different (p > 0.05). For the calculation of the mean, the middle-bound approach was used, meaning that for samples where the mycotoxin was not detected, the values were LOD/2 and for samples < LOQ, the values were LOQ/2.
Foods 14 02300 g004
Figure 5. Mycotoxin contamination depending on the location for 2024 wheat samples (n = 11 per location). Significance letters were assigned using a Dunn test performed after a Kruskal–Wallis test. Varieties sharing the same letter (a, ab or b) are not significantly different (p > 0.05). For the calculation of the mean, the middle-bound approach was used, meaning that for samples where the mycotoxin was not detected, the values were LOD/2 and for samples < LOQ, the values were LOQ/2.
Foods 14 02300 g005
Table 1. Agricultural data for the trial network in 2023 (a) and 2024 (b).
(a)
Harvest 2023
Sowing DateHarvest DatePrevious CropPloughing
Gesves5 November 202210 August 2023PotatoesNo
Terwagne31 October 202214 August 2023Sugar beetNo
Hannut25 October 202213 August 2023FlaxNo
Thorembais26 October 202211 August 2023FlaxYes
Enghien16 October 202220 July 2023FlaxNo
Merelbeke18 October 202218 July 2023PotatoesYes
Poperinge19 October 202218 July 2023Corn silageYes
Leffinge19 October 202226 July 2023PotatoesYes
Bassevelde19 October 202219 July 2023Grain cornYes
(b)
Harvest 2024
Sowing DateHarvest DatePrevious CropPloughing
Gesves18 December 202312 August 2024PotatoesYes
Terwagne17 October 202306 August 2024RapeseedNo
Hannut18 December 202306 August 2024Sugar beetNo
Thorembais22 November 202330 July 2024FlaxYes
Enghien1 December 202330 July 2024Canned peasYes
Merelbeke18 October 202329 July 2024PotatoesYes
Poperinge18 December 202330 July 2024Sugar beetYes
Leffinge18 October 202330 July 2024PotatoesYes
Table 2. Mycotoxin concentrations in µg/kg in the calibration curve.
1
[µg/kg]
2
[µg/kg]
3
[µg/kg]
Standard 010.510100
Standard 021.020200
Standard 032.550500
Standard 045.01001000
Standard 057.51501500
Standard 06102002000
Standard 07153003000
1 = ochratoxins (A and B); 2 = AME, AOH, 3Ac-DON, 15Ac-DON, T2, HT2, ZEA, ENN (A, A1, B, B1), FUM B1 and B2, citrinin, moniliformin, STE; 3 = DON.
Table 3. Optimized MS/MS parameters for the multi-mycotoxin detection method in MRM mode.
MycotoxinMolecular MassMODEm/zCone
(V)
Daughter 1Energy1
(eV)
Daughter 2Energy2
(eV)
RT (min)
AME272.3[M+H]+273.020128.060228.04010.9
AOH258.2[M+H]+259.010185.028213.0289.2
DON296.3[M+H]+297.115231.118249.1183.9
3Ac-DON338.4[M+H]+339.125137.015203.1127.0
15Ac-DON338.4[M+NH4]+356.25137.016261.0147.0
ZEA318.4[M+H]+319.220185.125187.11910.6
T2466.5[M+NH4]+484.27215.018305.11210.4
HT2424.5[M+NH4]+442.25215.012263.1109.8
OTA403.8[M+H]+404.125239.125357.91510.5
OTB369.4[M+H]+370.010187.030204.8209.7
Enniatin A681.9[M+H]+682.63099.640209.82511.8
Enniatin A1667.9[M+H]+669.13099.640210.02511.7
Enniatin B639.8[M+H]+640.71585.940196.02011.5
Enniatin B1653.8[M+H]+655.22085.940196.12511.6
Fumonisin B1721.8[M+H]+722.315334.335352.33510.0
Sterigmatocystin324.28[M+H]+325.015253.138281.13510.8
Table 4. Average recovery, limit of quantification (LOQ) and limit of detection (LOD) determined during method validation for the different mycotoxins.
MycotoxinsRecovery [%]LOQ [µg/kg]LOD [µg/kg]
15Ac-DON49103.8
3Ac-DON59103.3
DON8810060
AOH90108
AME90108
T2 + HT284100.3
ZEA96102.4
OTA10410.5
OTB9910.5
ENN A91108
ENN A193105
ENN B93101
ENN B192106
FUM B158103
STE91101.5
Table 5. Mycotoxin contamination of the 2023 wheat samples (n = 45).
MycotoxinND (n)<LOQ (n)>LOQ (n)Mean ± SD (µg/kg)Min–Max of Samples
> LOQ (µg/kg)
Median of Samples > LOQ (µg/kg)
DON391563 ± 104171–567317
ZEA40052.7 ± 4.412–1815
ENN B38524.5 ± 19.728–13179
ENN B144103.0 ± 0.3All < LOQAll < LOQ
n: number of samples (n total = 45); ND: non-detected; for the calculation of the mean, the middle-bound approach was used, meaning that for ND samples, the values were LOD/2 and for samples < LOQ, the values were LOQ/2; the min, max and median included samples above the LOQ only.
Table 6. Mycotoxin contamination of the 2024 wheat samples (n = 88).
MycotoxinND (n)<LOQ (n)>LOQ (n)Mean ± SD (µg/kg)Min–Max of Samples
> LOQ (µg/kg)
Median of Samples > LOQ (µg/kg)
DON112552255 ± 268131–1478370
ZEA5325105.4 ± 9.516–5528
ENN A13536176.5 ± 7.010–4914
ENN B3176889 ± 10912–48866
ENN B121184929 ± 377–18538
n: number of samples (n total = 88); ND: non-detected; for the calculation of the mean, the middle-bound approach was used, meaning that for ND samples, the values were LOD/2 and for samples < LOQ, the values were LOQ/2; the min, max and median included samples above the LOQ only.
Table 7. Significance of the differences of mycotoxin contamination between the varieties in 2024 (Kruskal–Wallis test).
Mean Concentration
± SD (µg/kg)
Kruskal–Wallis Χ2dfp-ValueSignificance
DON255 ± 26842.239106.80 × 10−6***
ZEA5.4 ± 9.523.644100.008604**
ENN A16.5 ± 7.024.693100.005958**
ENN B89 ± 10916.969100.07506n.s.
ENN B129 ± 3719.086100.03918*
df: degree of freedom. The differences between the varieties are considered significant (*) for p-value < 0.05, (**) for p-value < 0.01, (***) for p-value < 0.001, n.s. = non-significant.
Table 8. Significance of the differences of mycotoxin contamination of wheat between the cultivation sites in 2024 (Kruskal–Wallis test).
Mean Concentration ± SD (µg/kg)Kruskal–Wallis Χ2dfp-ValueSignificance
DON255 ± 26815.10870.03464*
ZEA5.4 ± 9.529.38470.0001231***
ENN A16.5 ± 7.025.71570.0005662***
ENN B89 ± 10940.97078.21 × 10−7***
ENN B129 ± 3734.12371.63 × 10−5***
df: degree of freedom. The differences between the varieties are considered significant (*) for p-value < 0.05, (***) for p-value < 0.001.
Disclaimer/Publisher’s Note: The statements, opinions and data contained in all publications are solely those of the individual author(s) and contributor(s) and not of MDPI and/or the editor(s). MDPI and/or the editor(s) disclaim responsibility for any injury to people or property resulting from any ideas, methods, instructions or products referred to in the content.

