
Towards Sustainable Protein Sources: The Thermal and Rheological Properties of Alternative Proteins


Abstract
1. Introduction
2. Materials and Methods
2.1. Materials
2.2. Density
2.3. Particle Size
2.4. Differential Scanning Calorimetry (DSC) Analysis
2.5. Viscosity Measurements
3. Results
3.1. Density
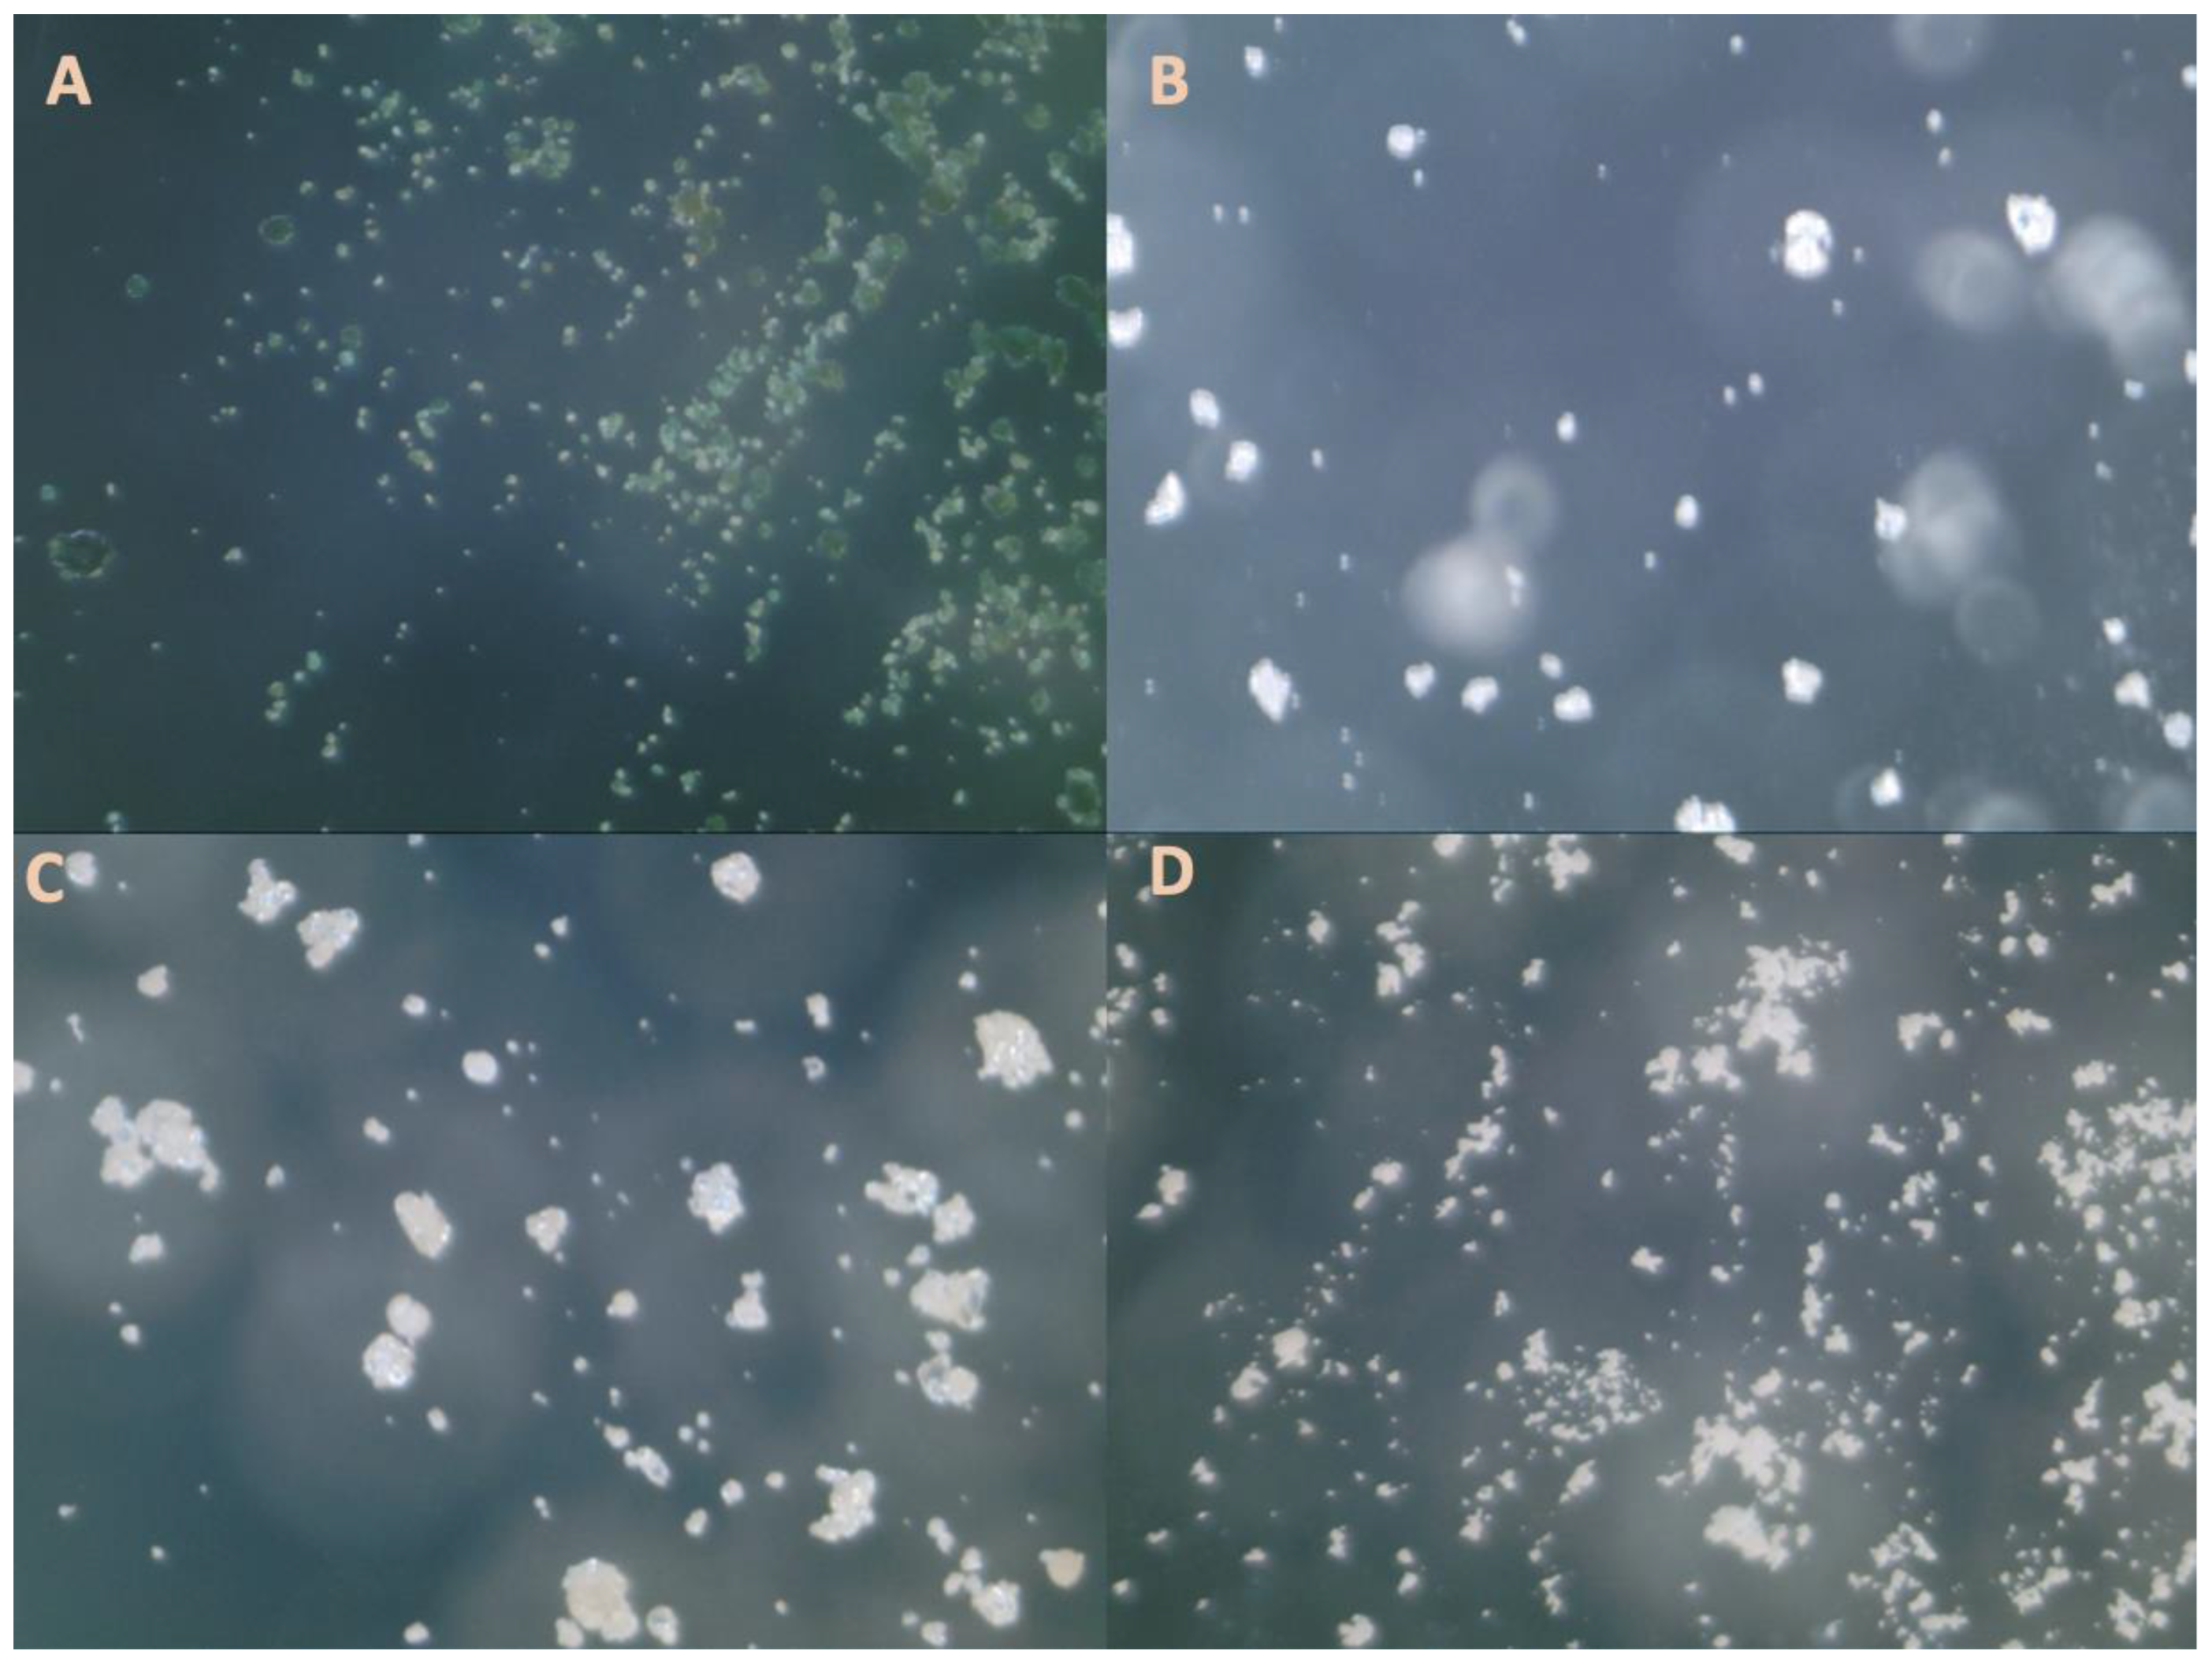
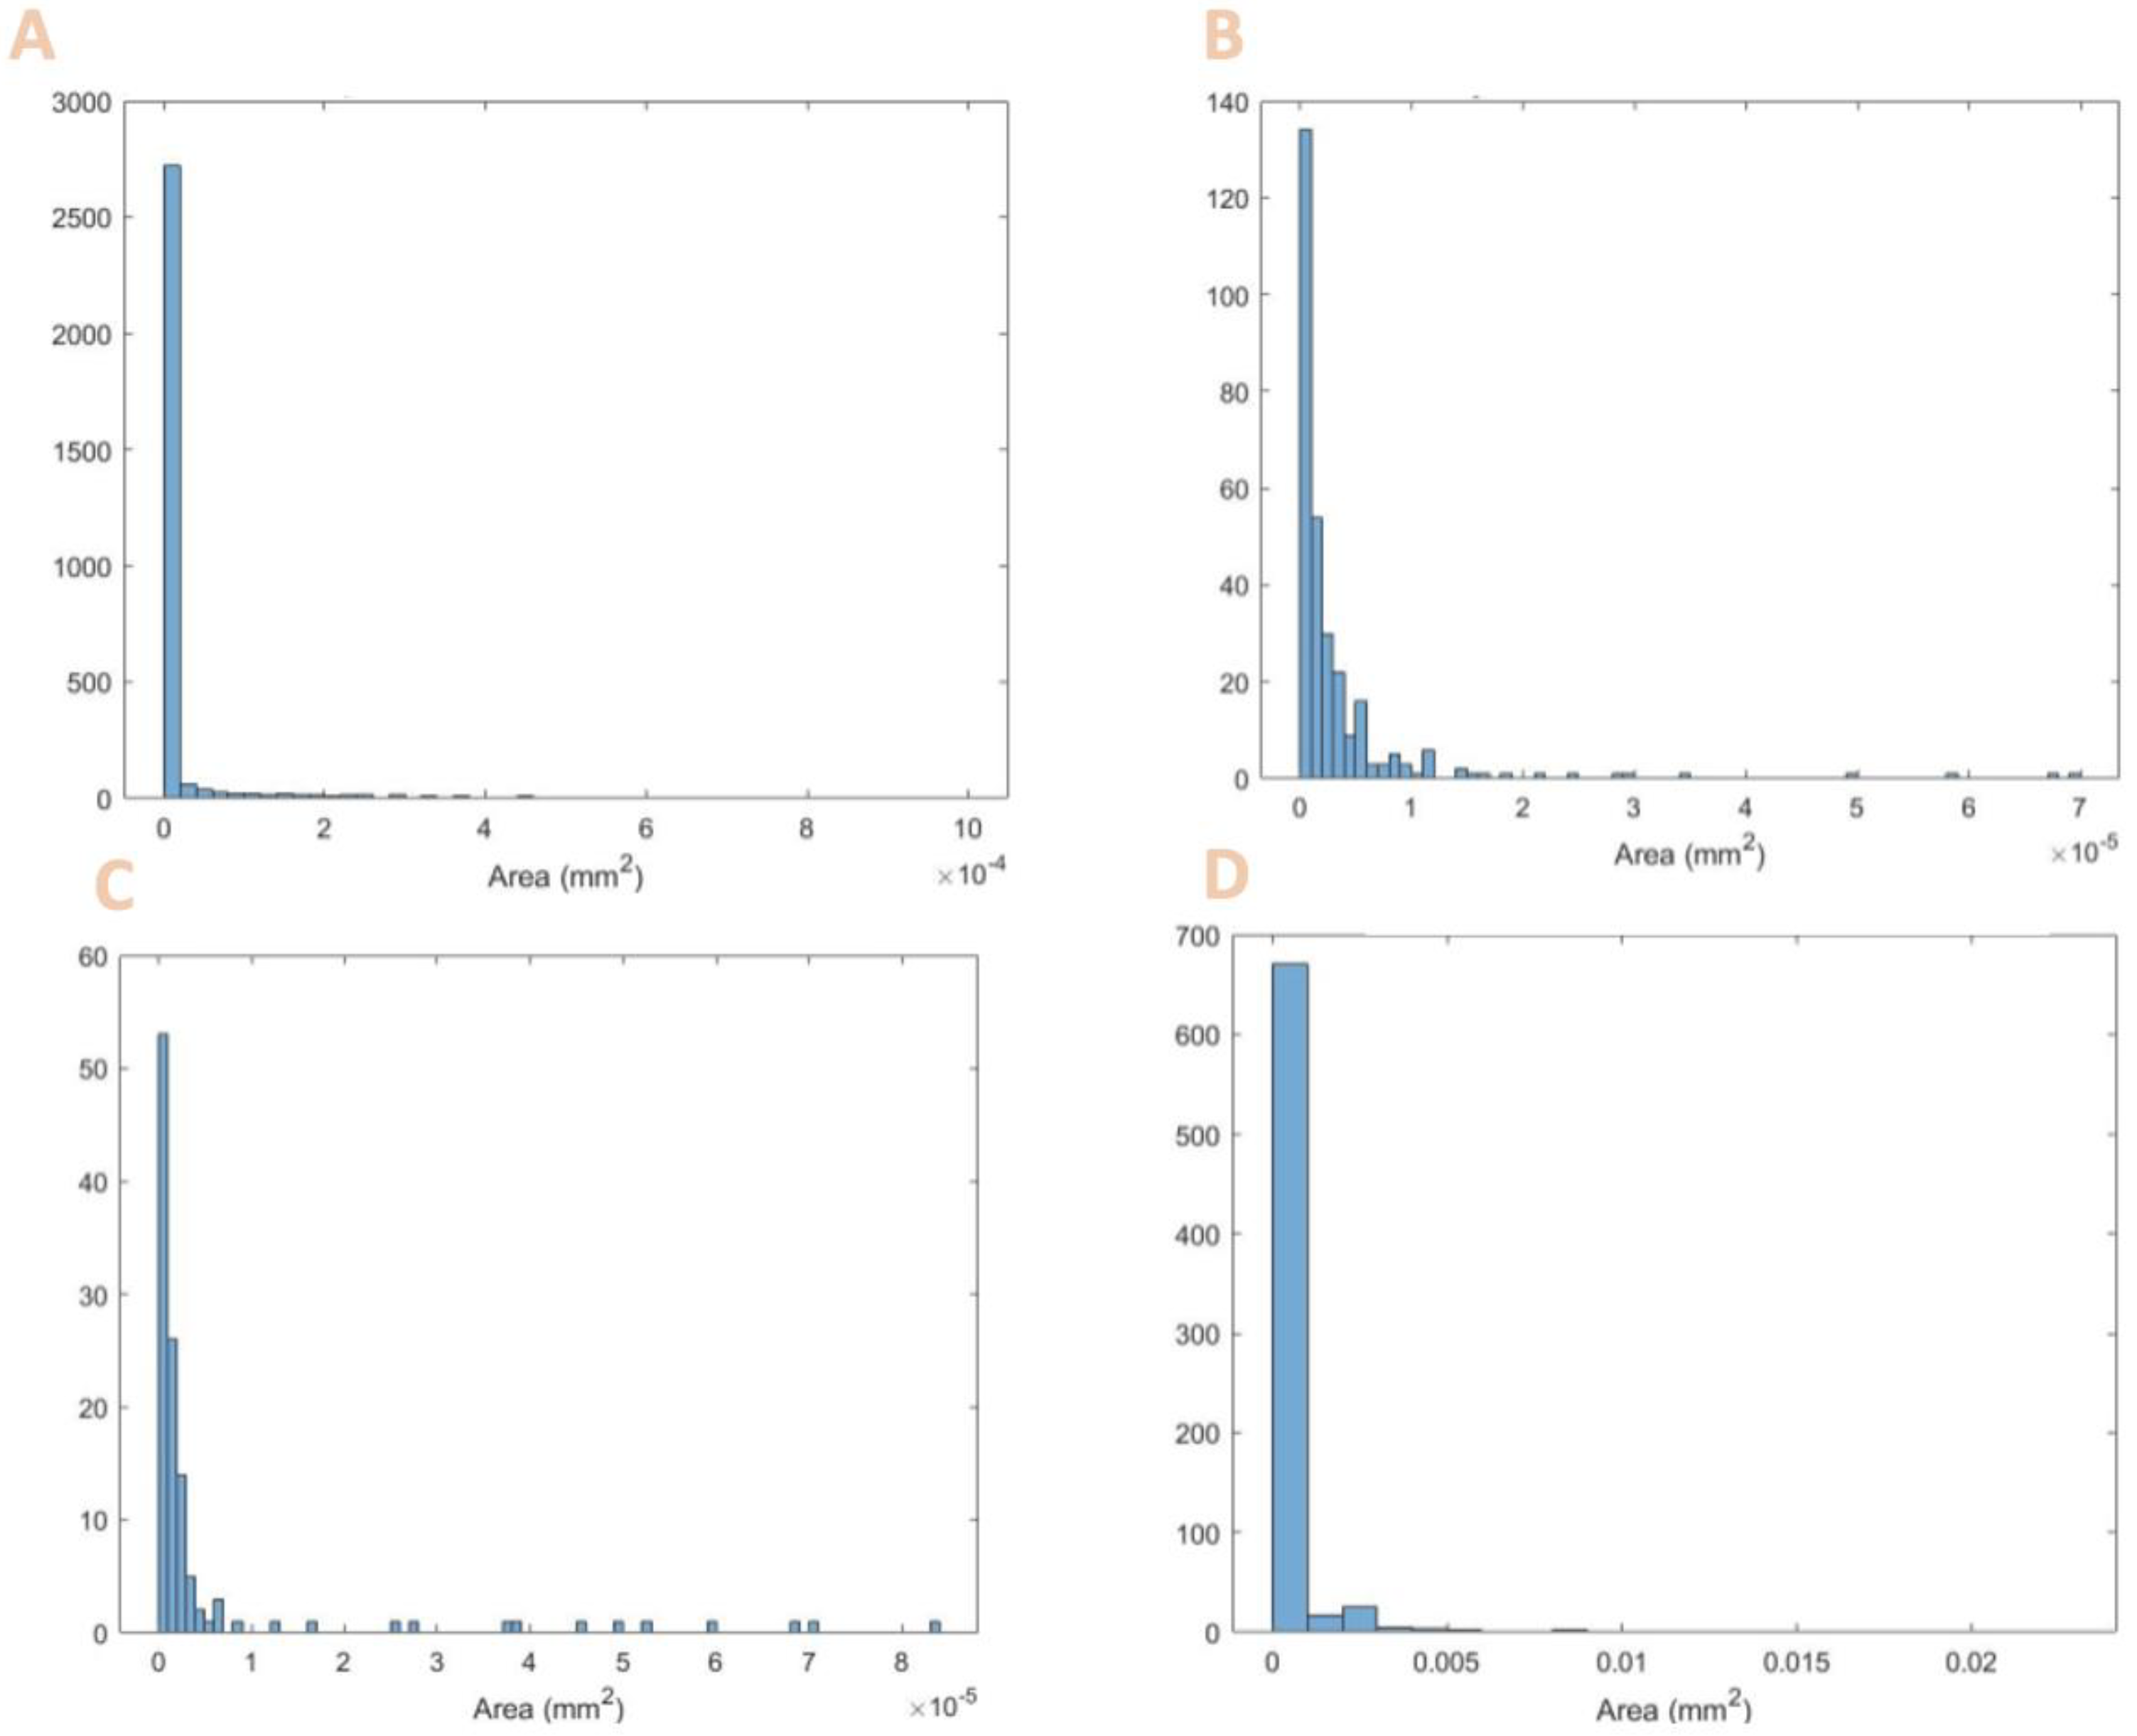
3.2. Particle Size
3.3. DSC
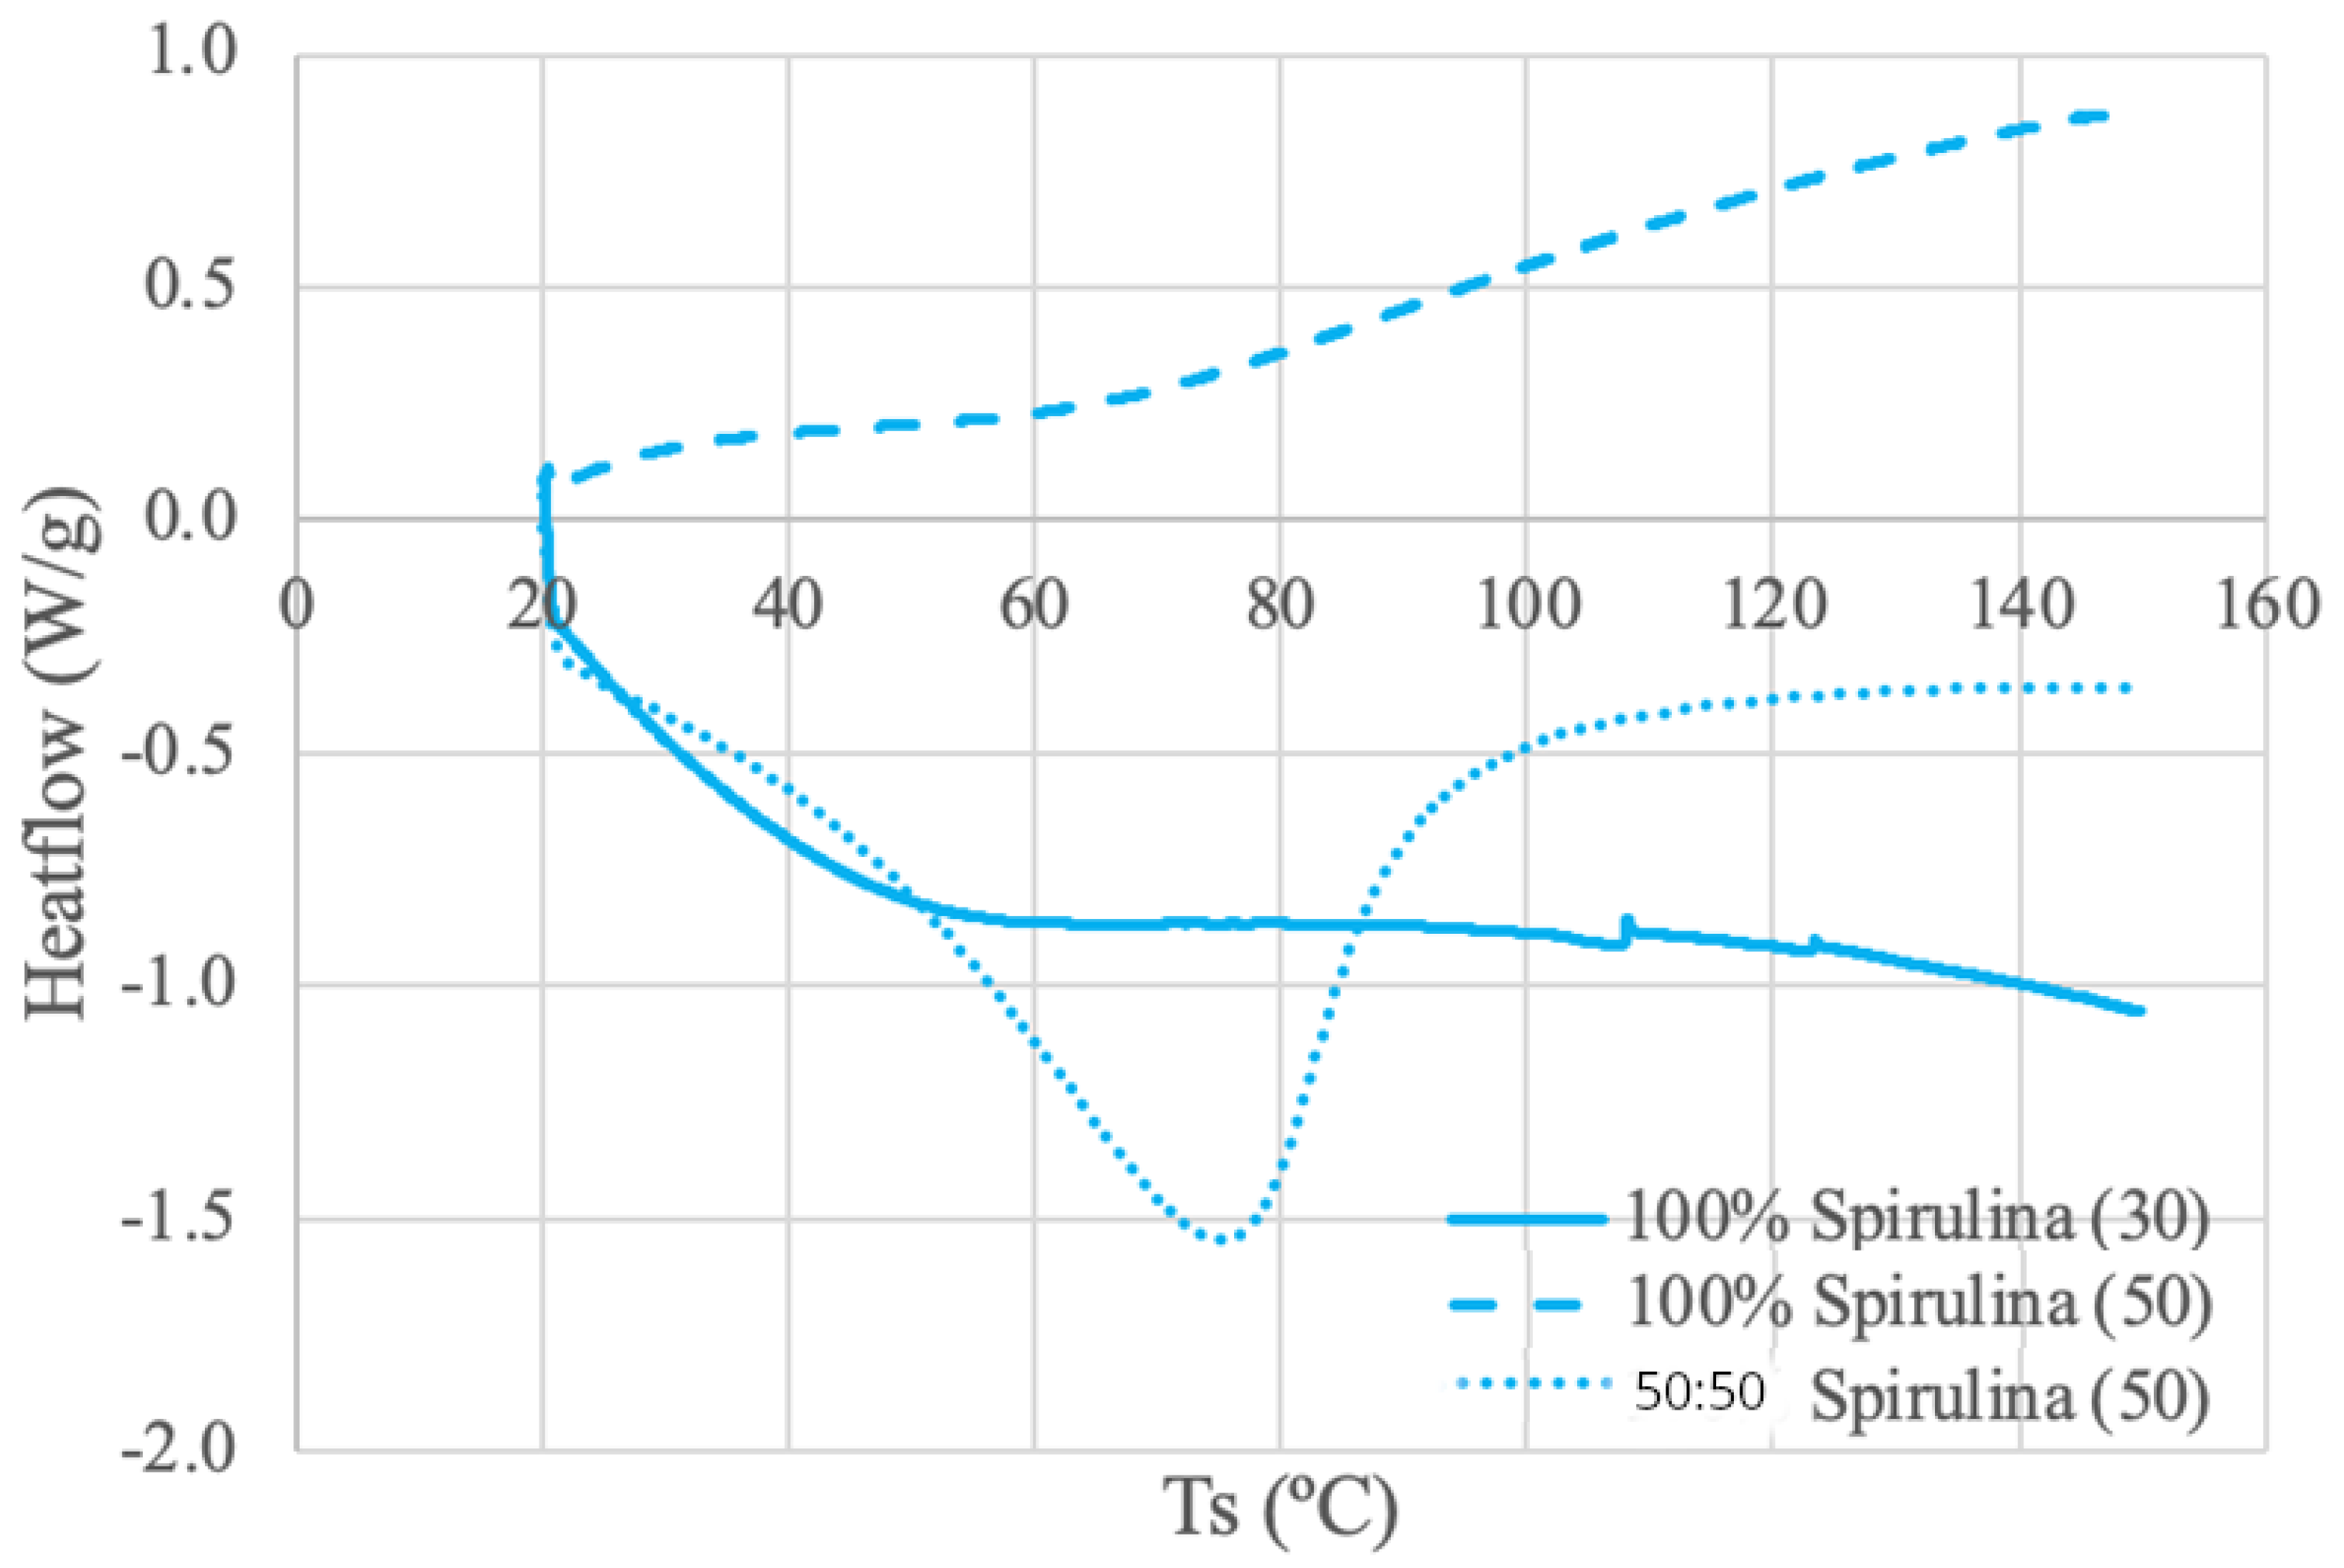
3.3.1. Spirulina DSC Results
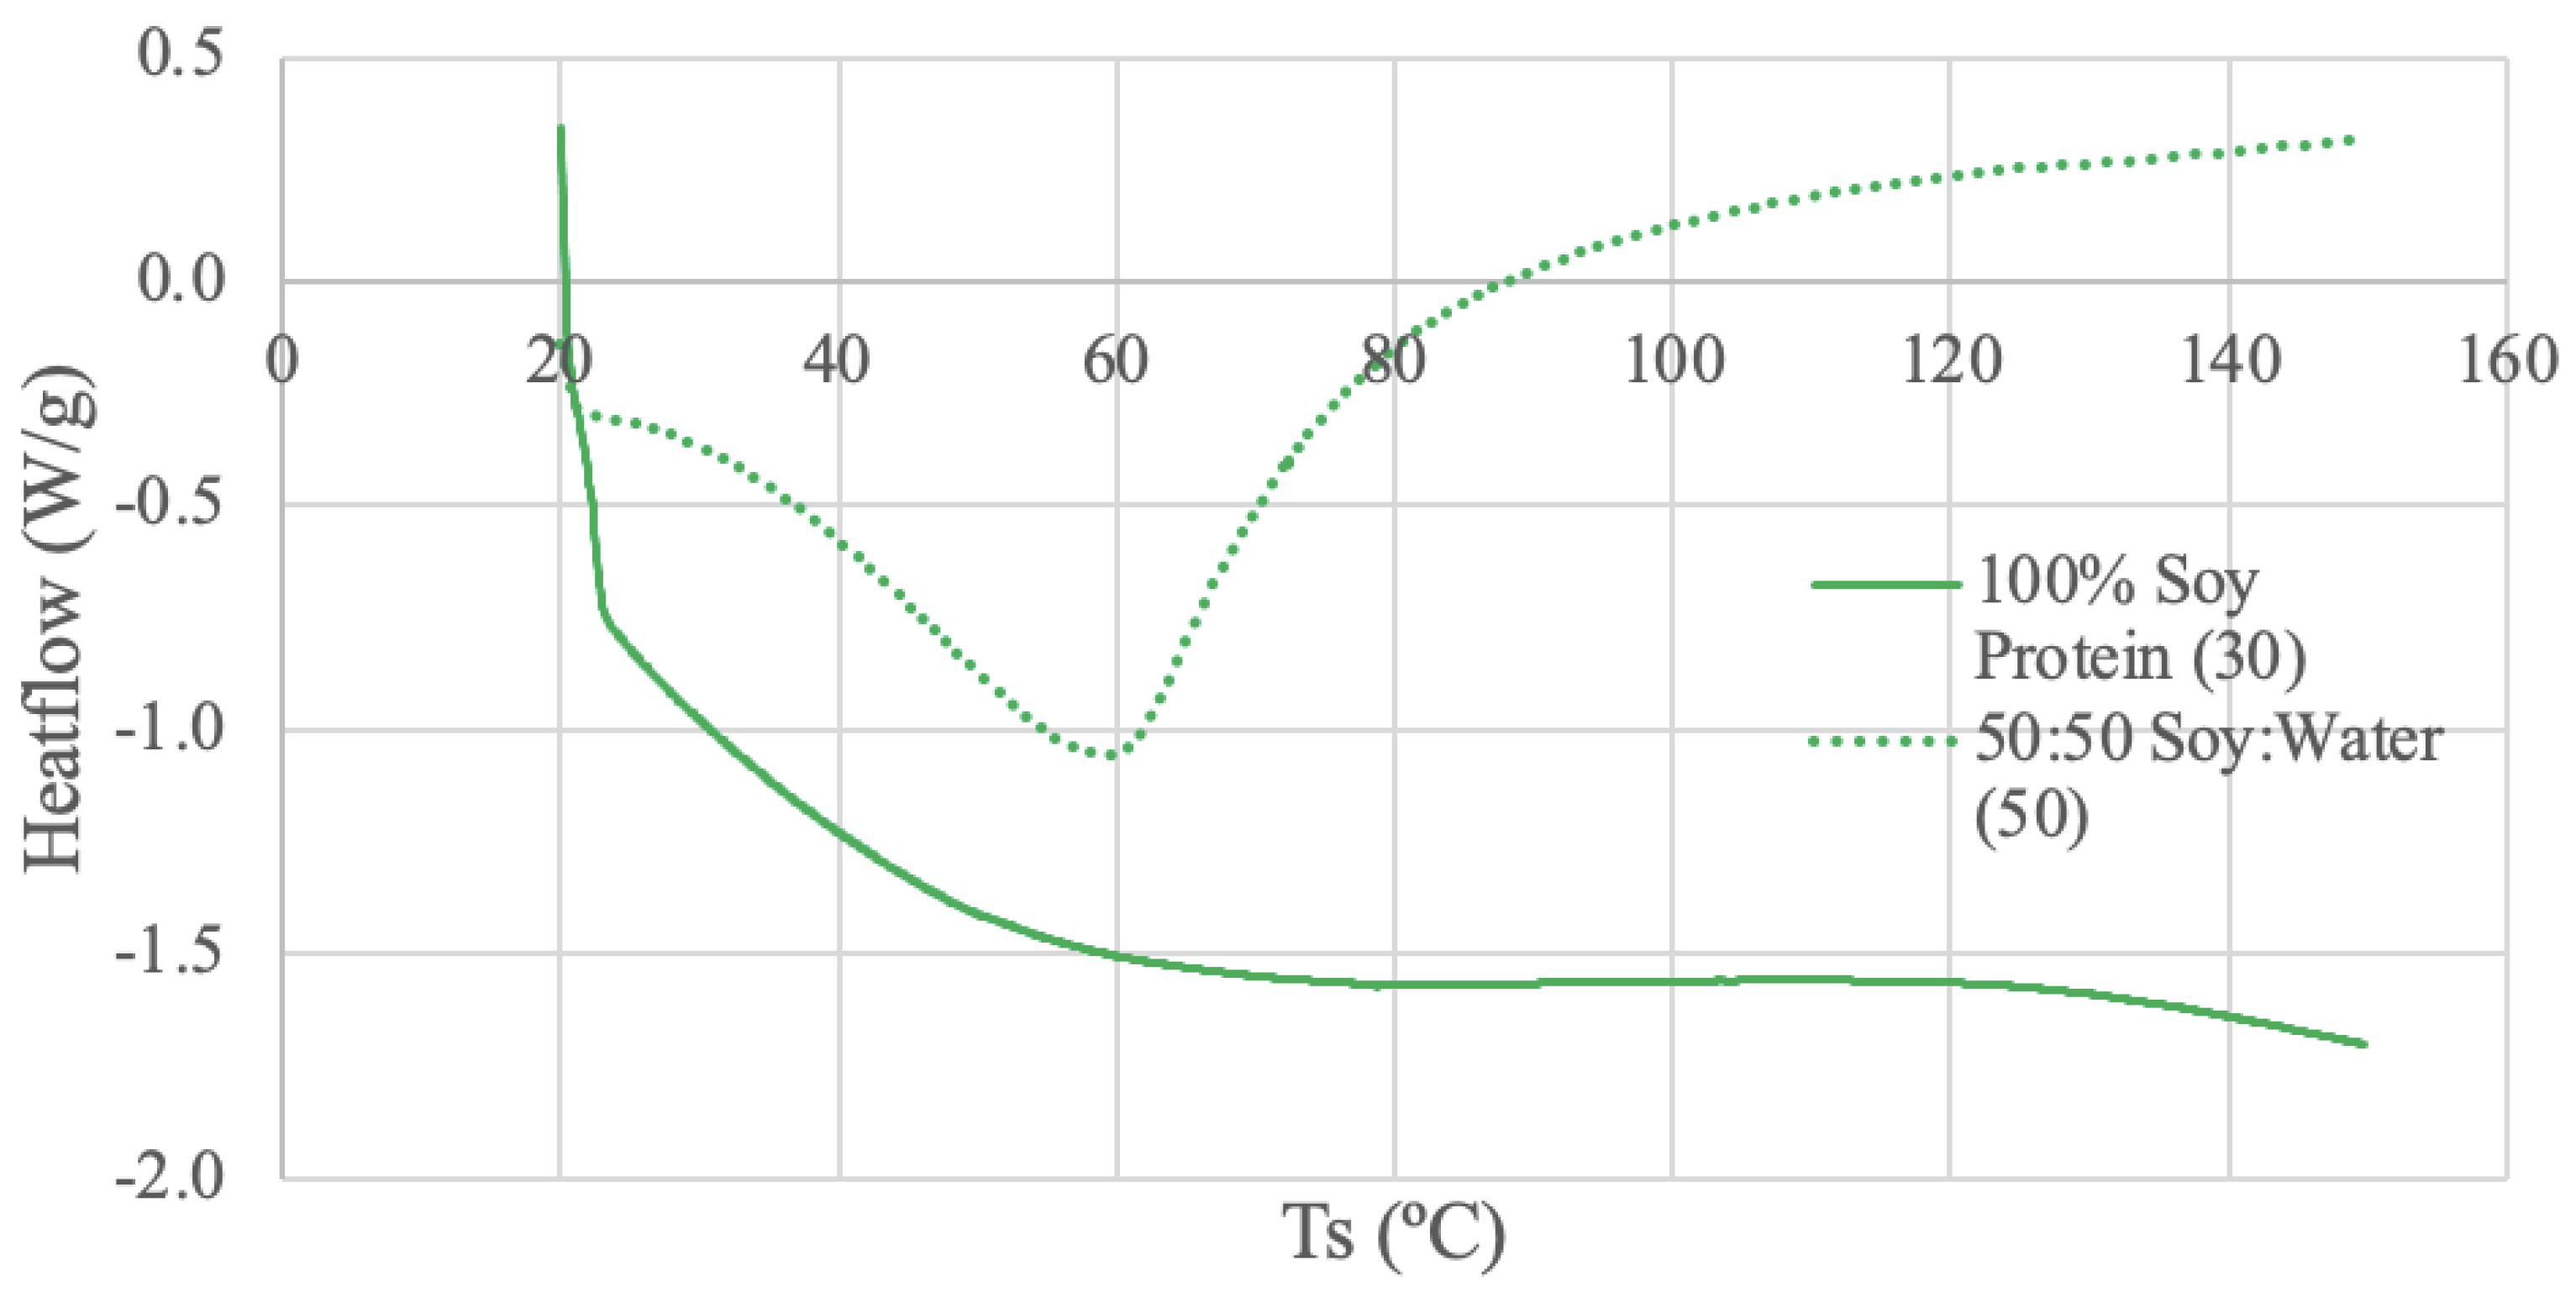
3.3.2. Soy Protein DSC Results
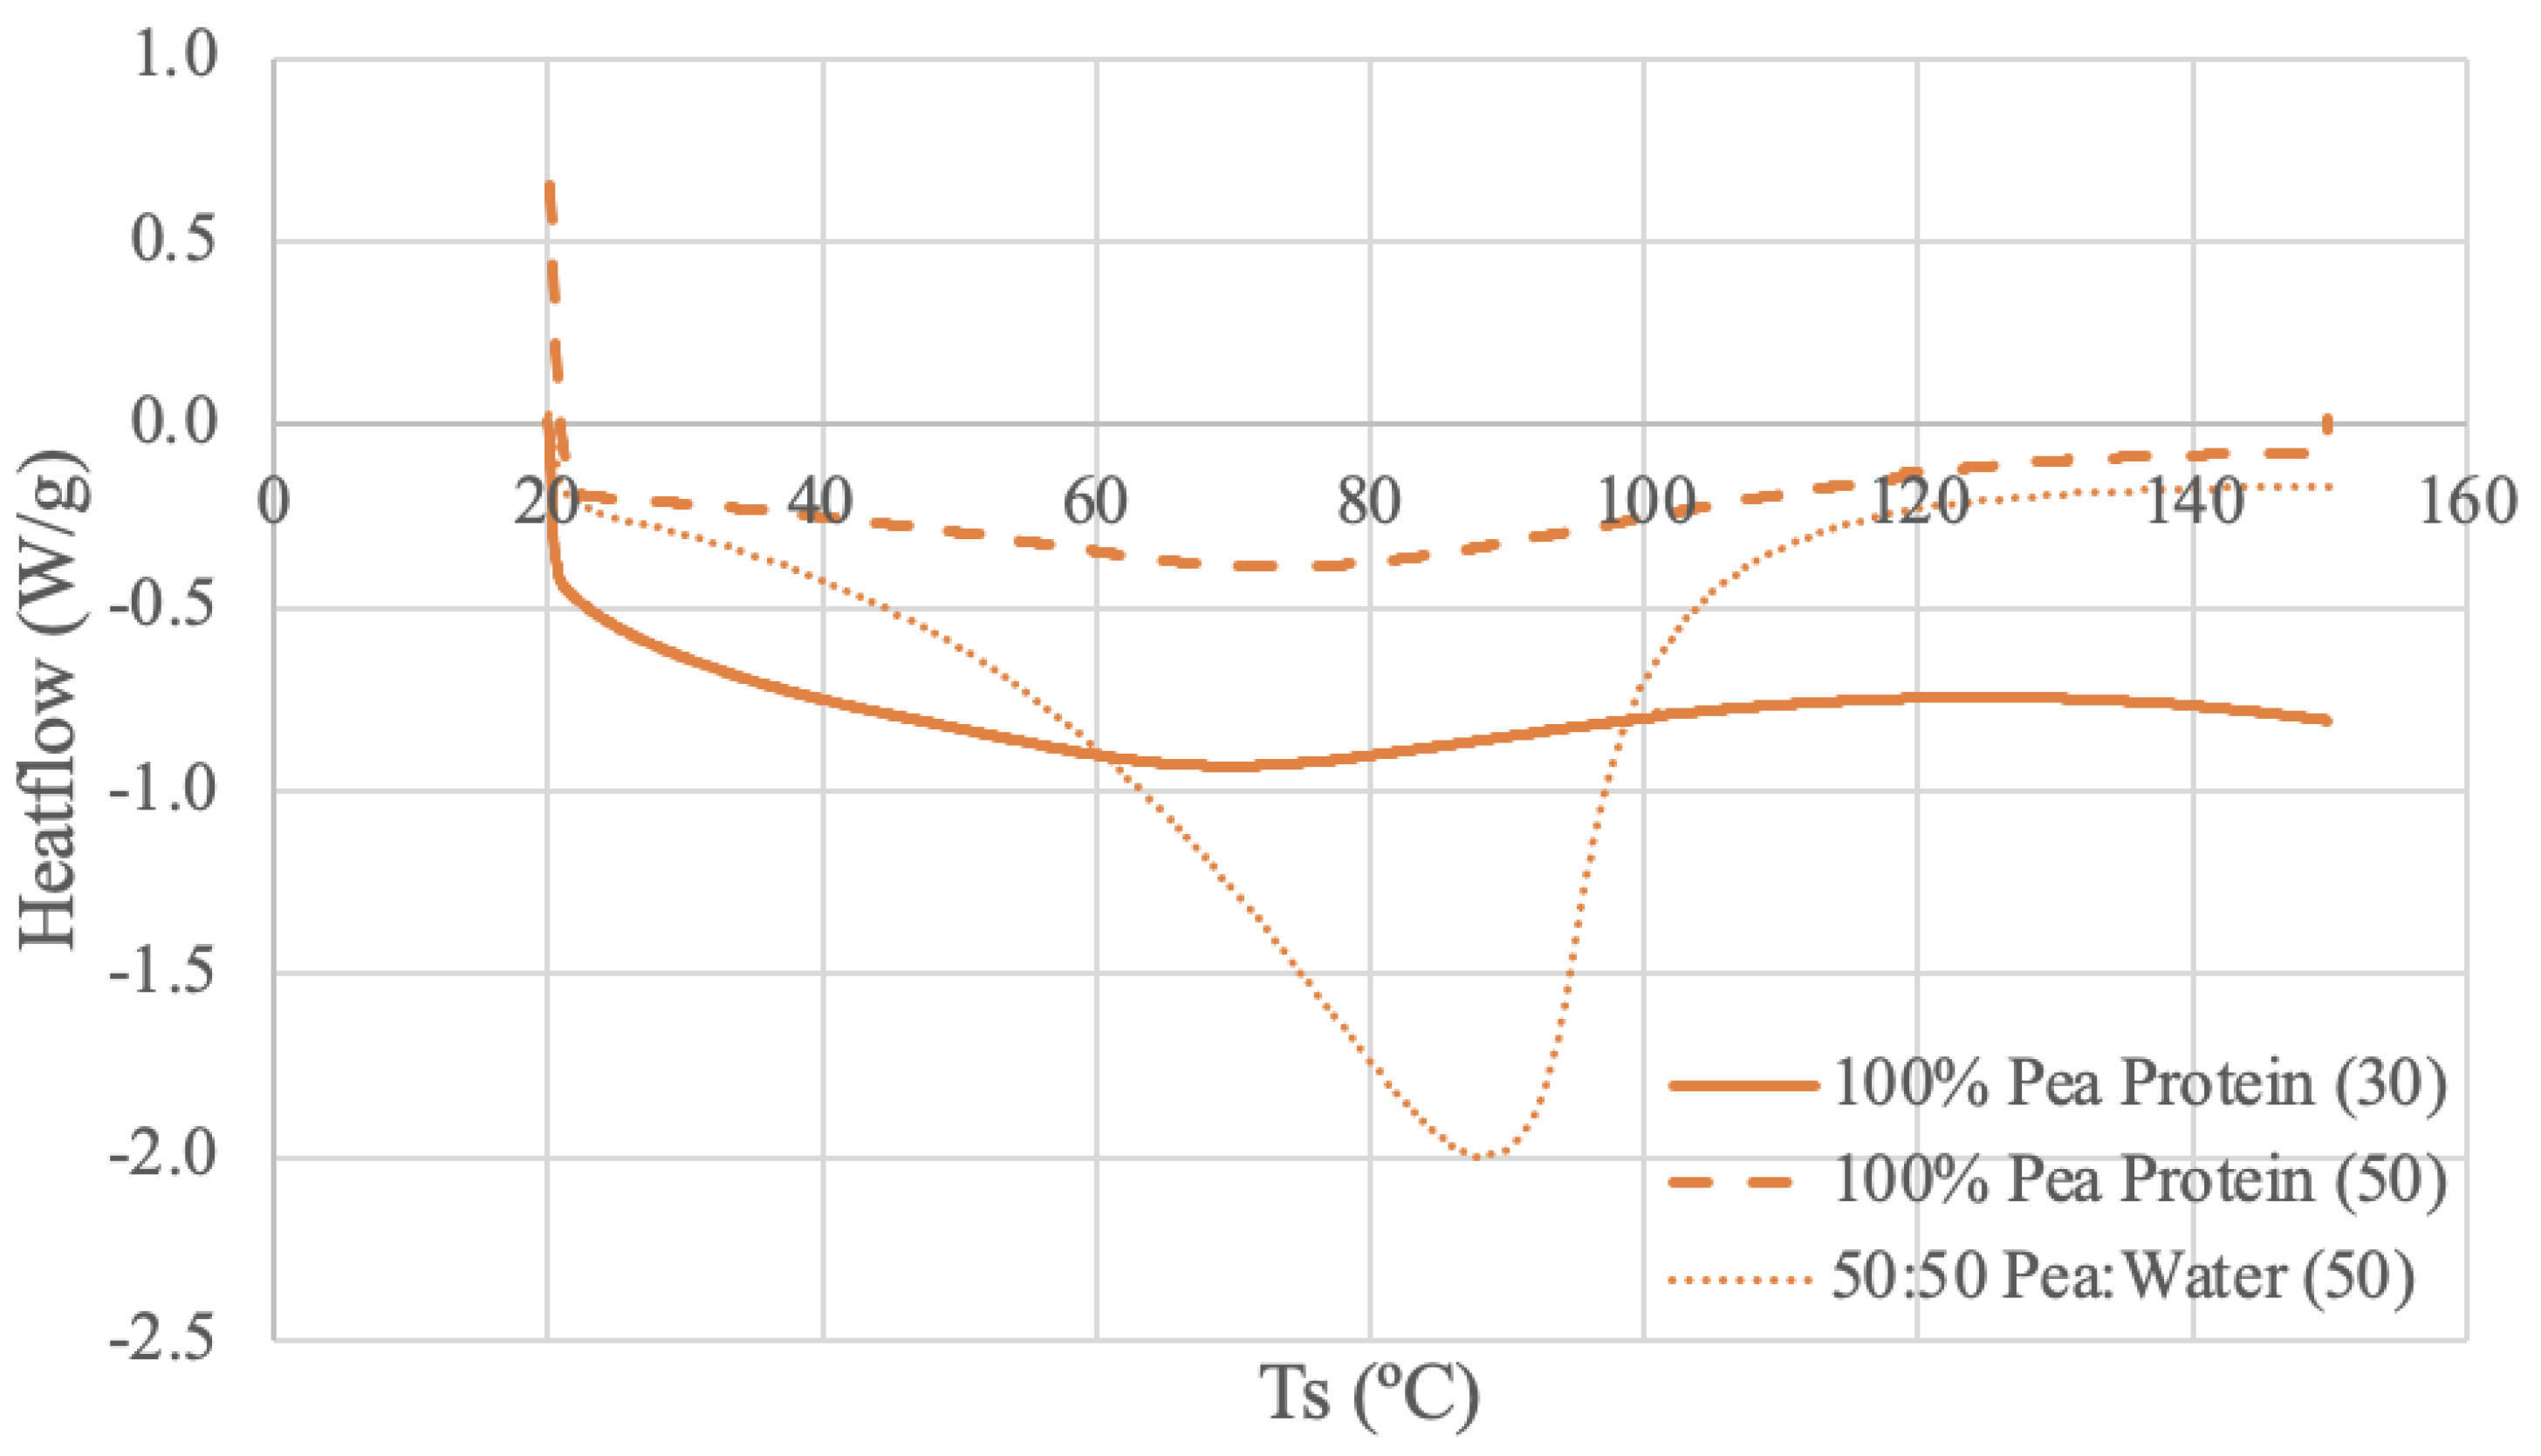
3.3.3. Pea DSC Results
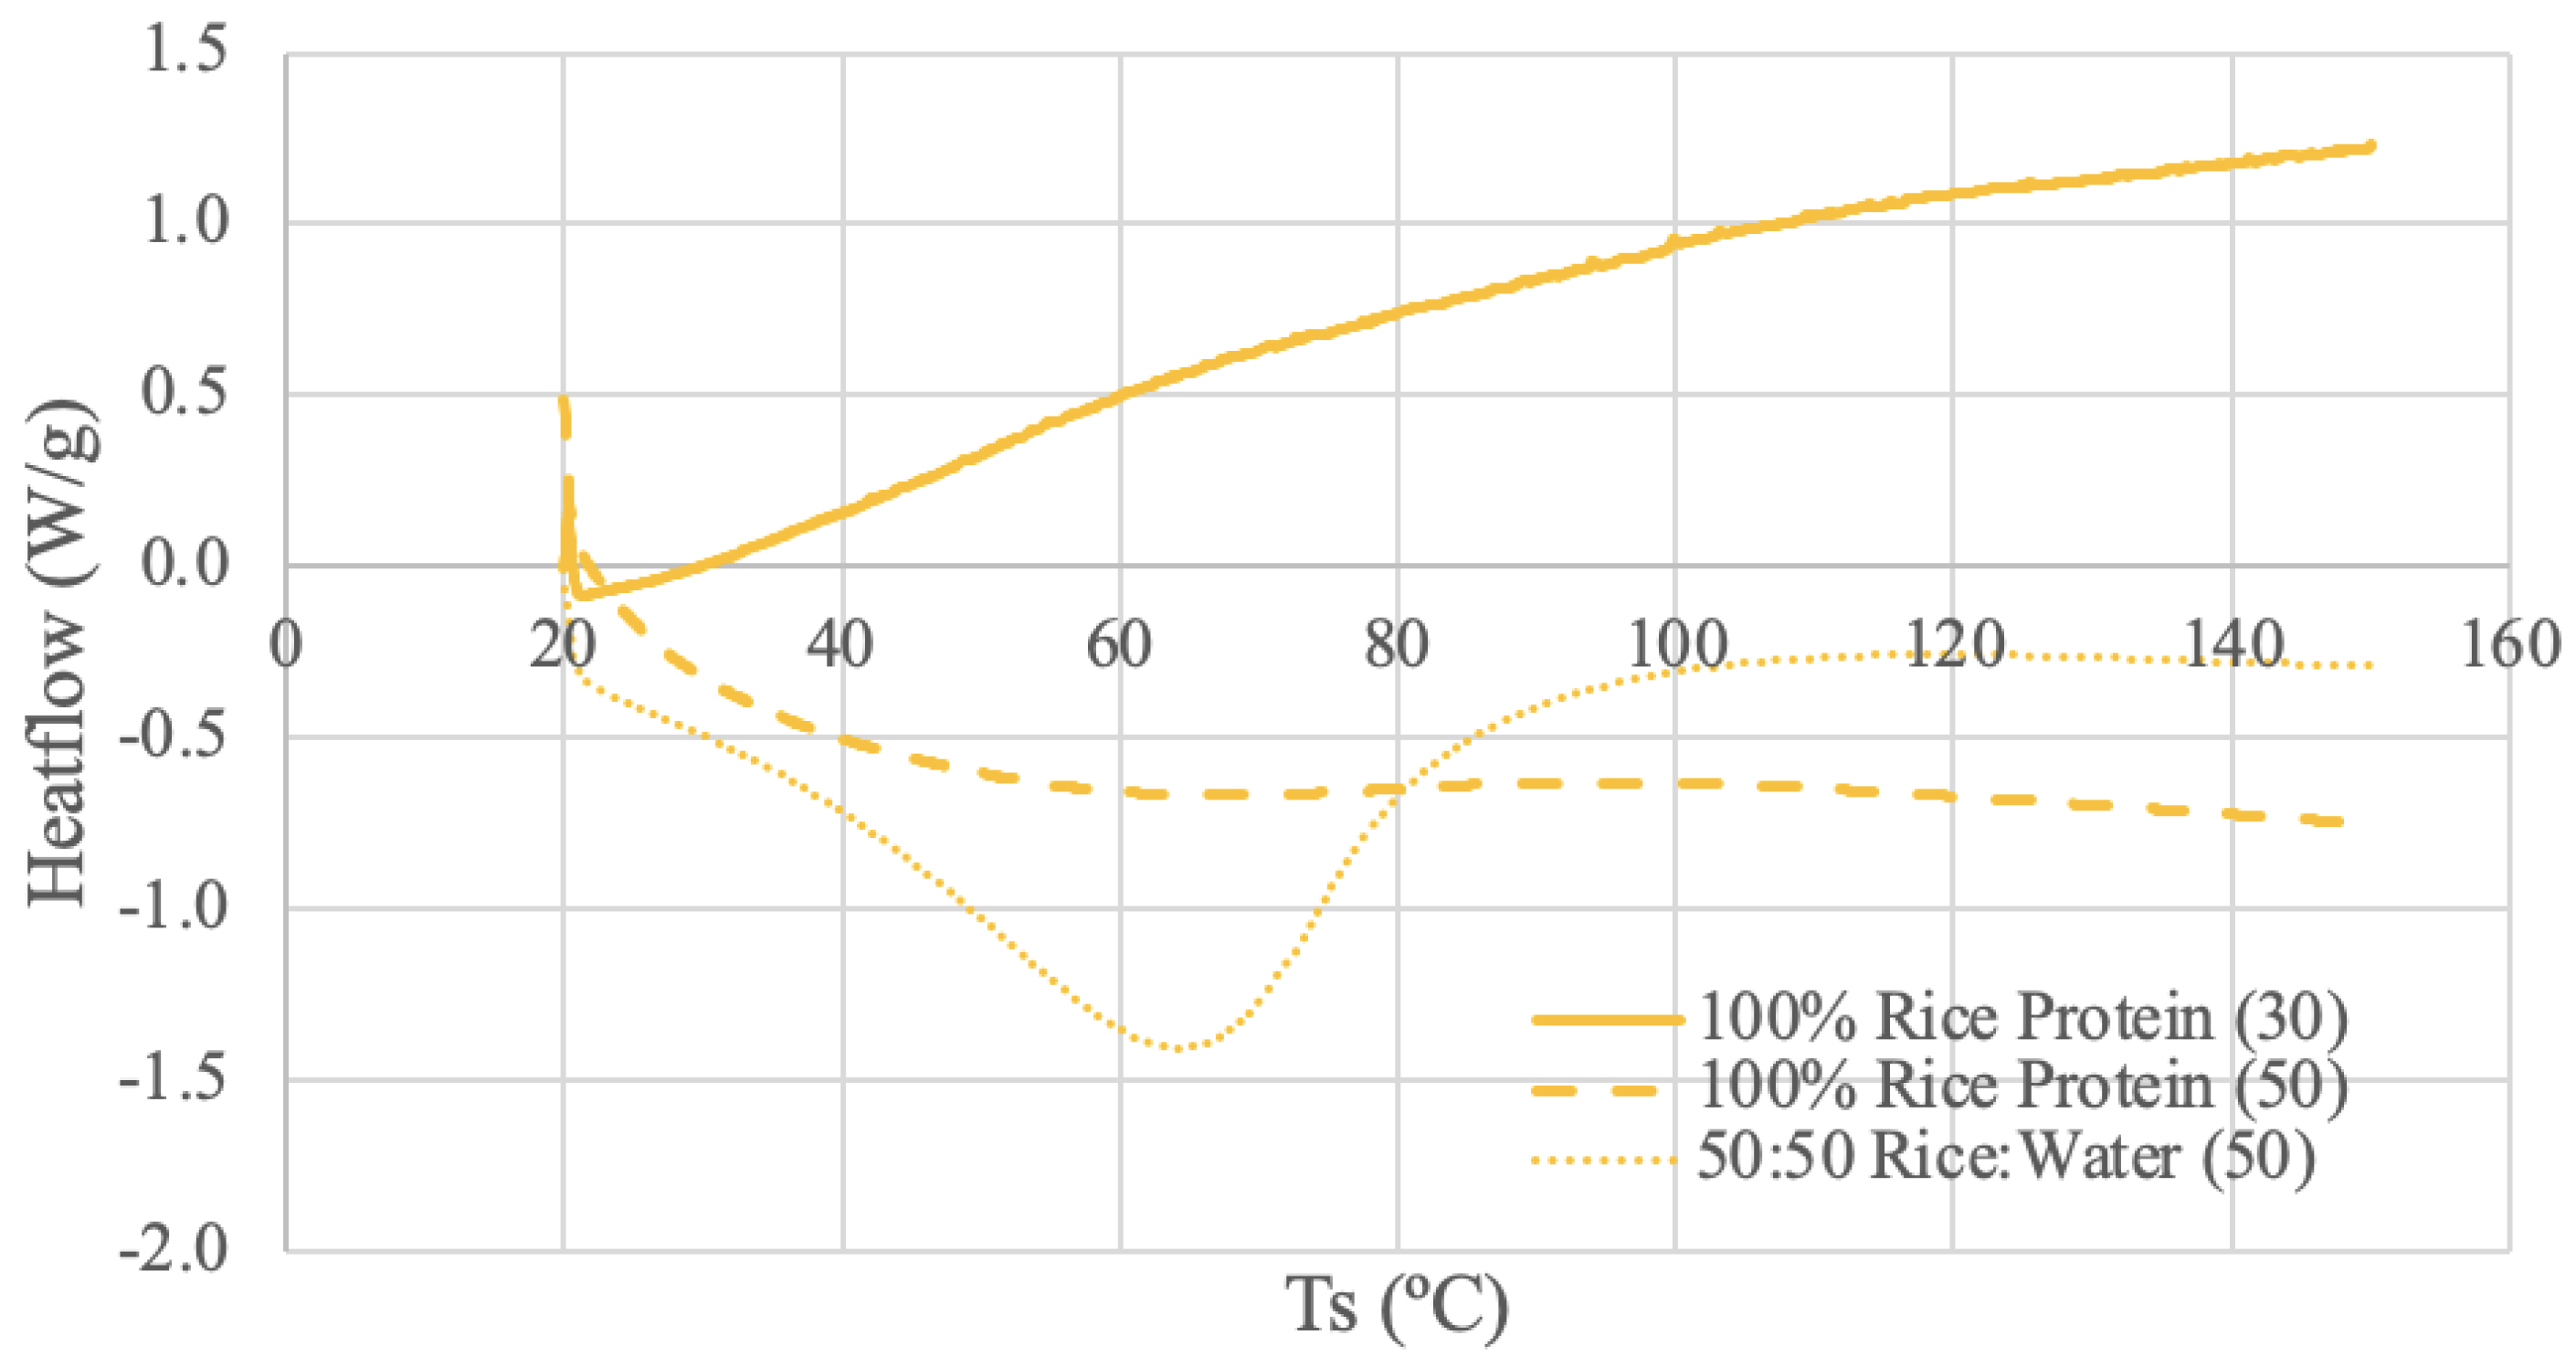
3.3.4. Brown Rice Protein DSC Results
3.4. Viscosity
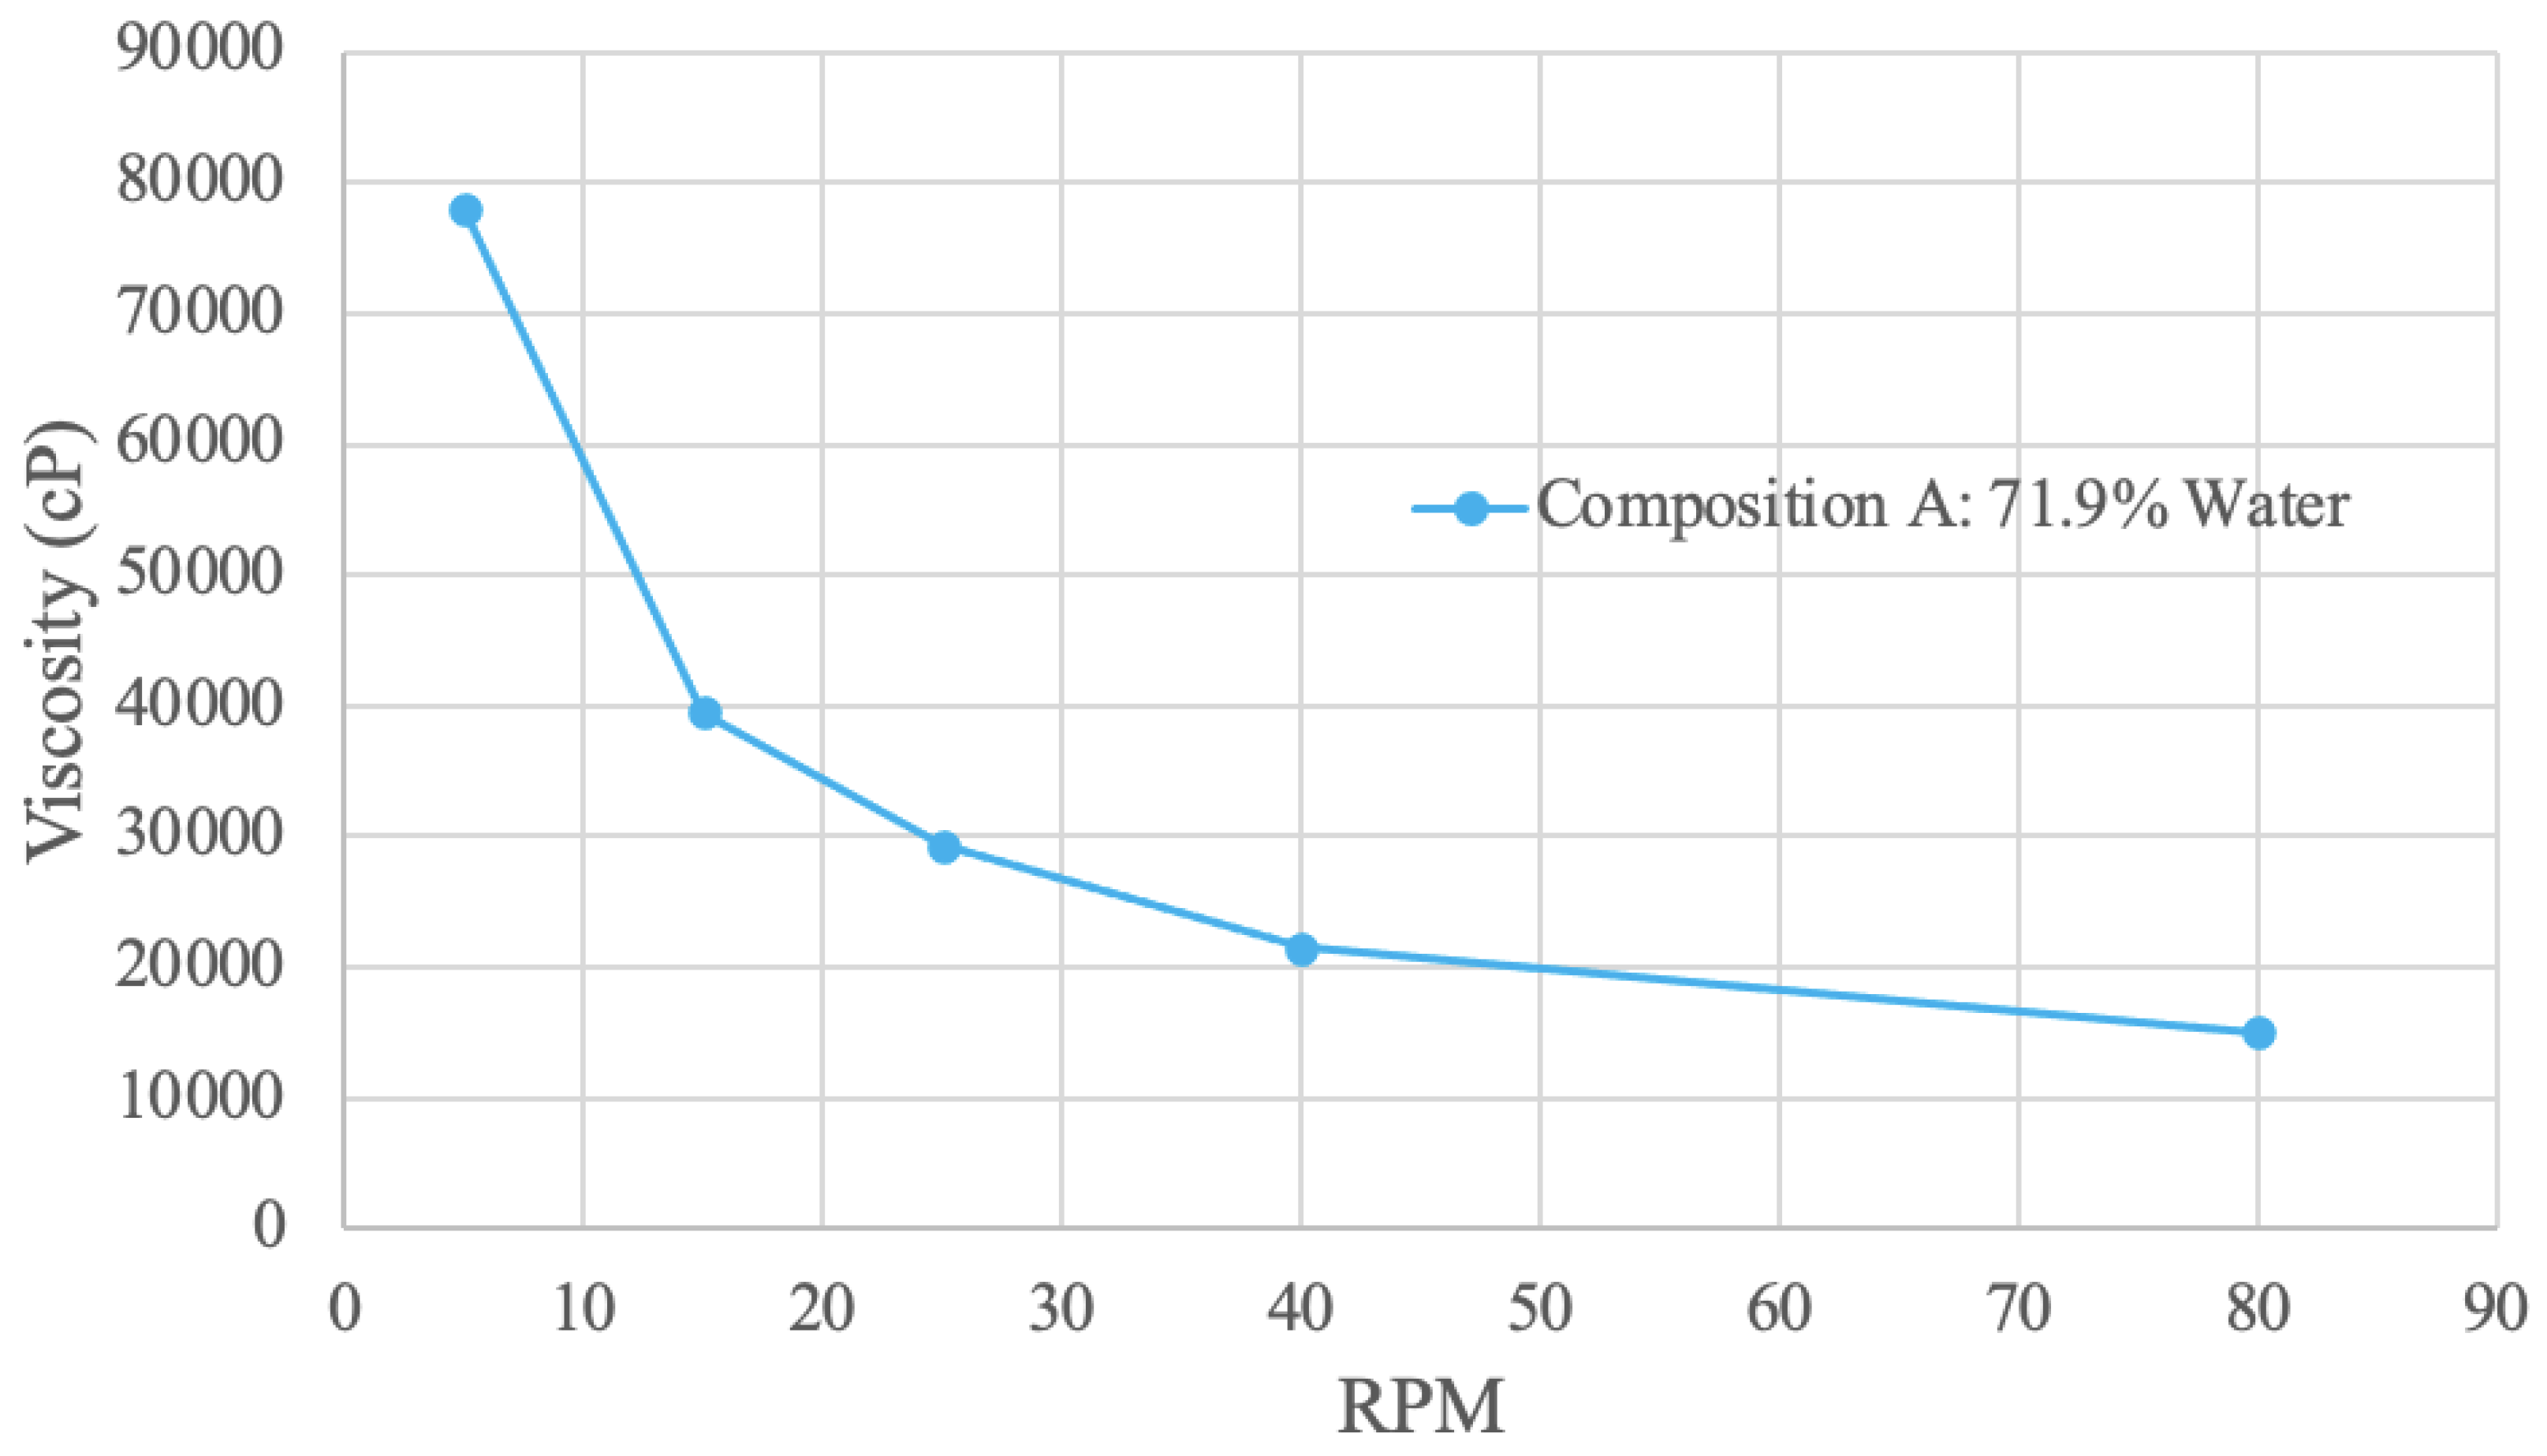
3.4.1. Spirulina Viscosity Results
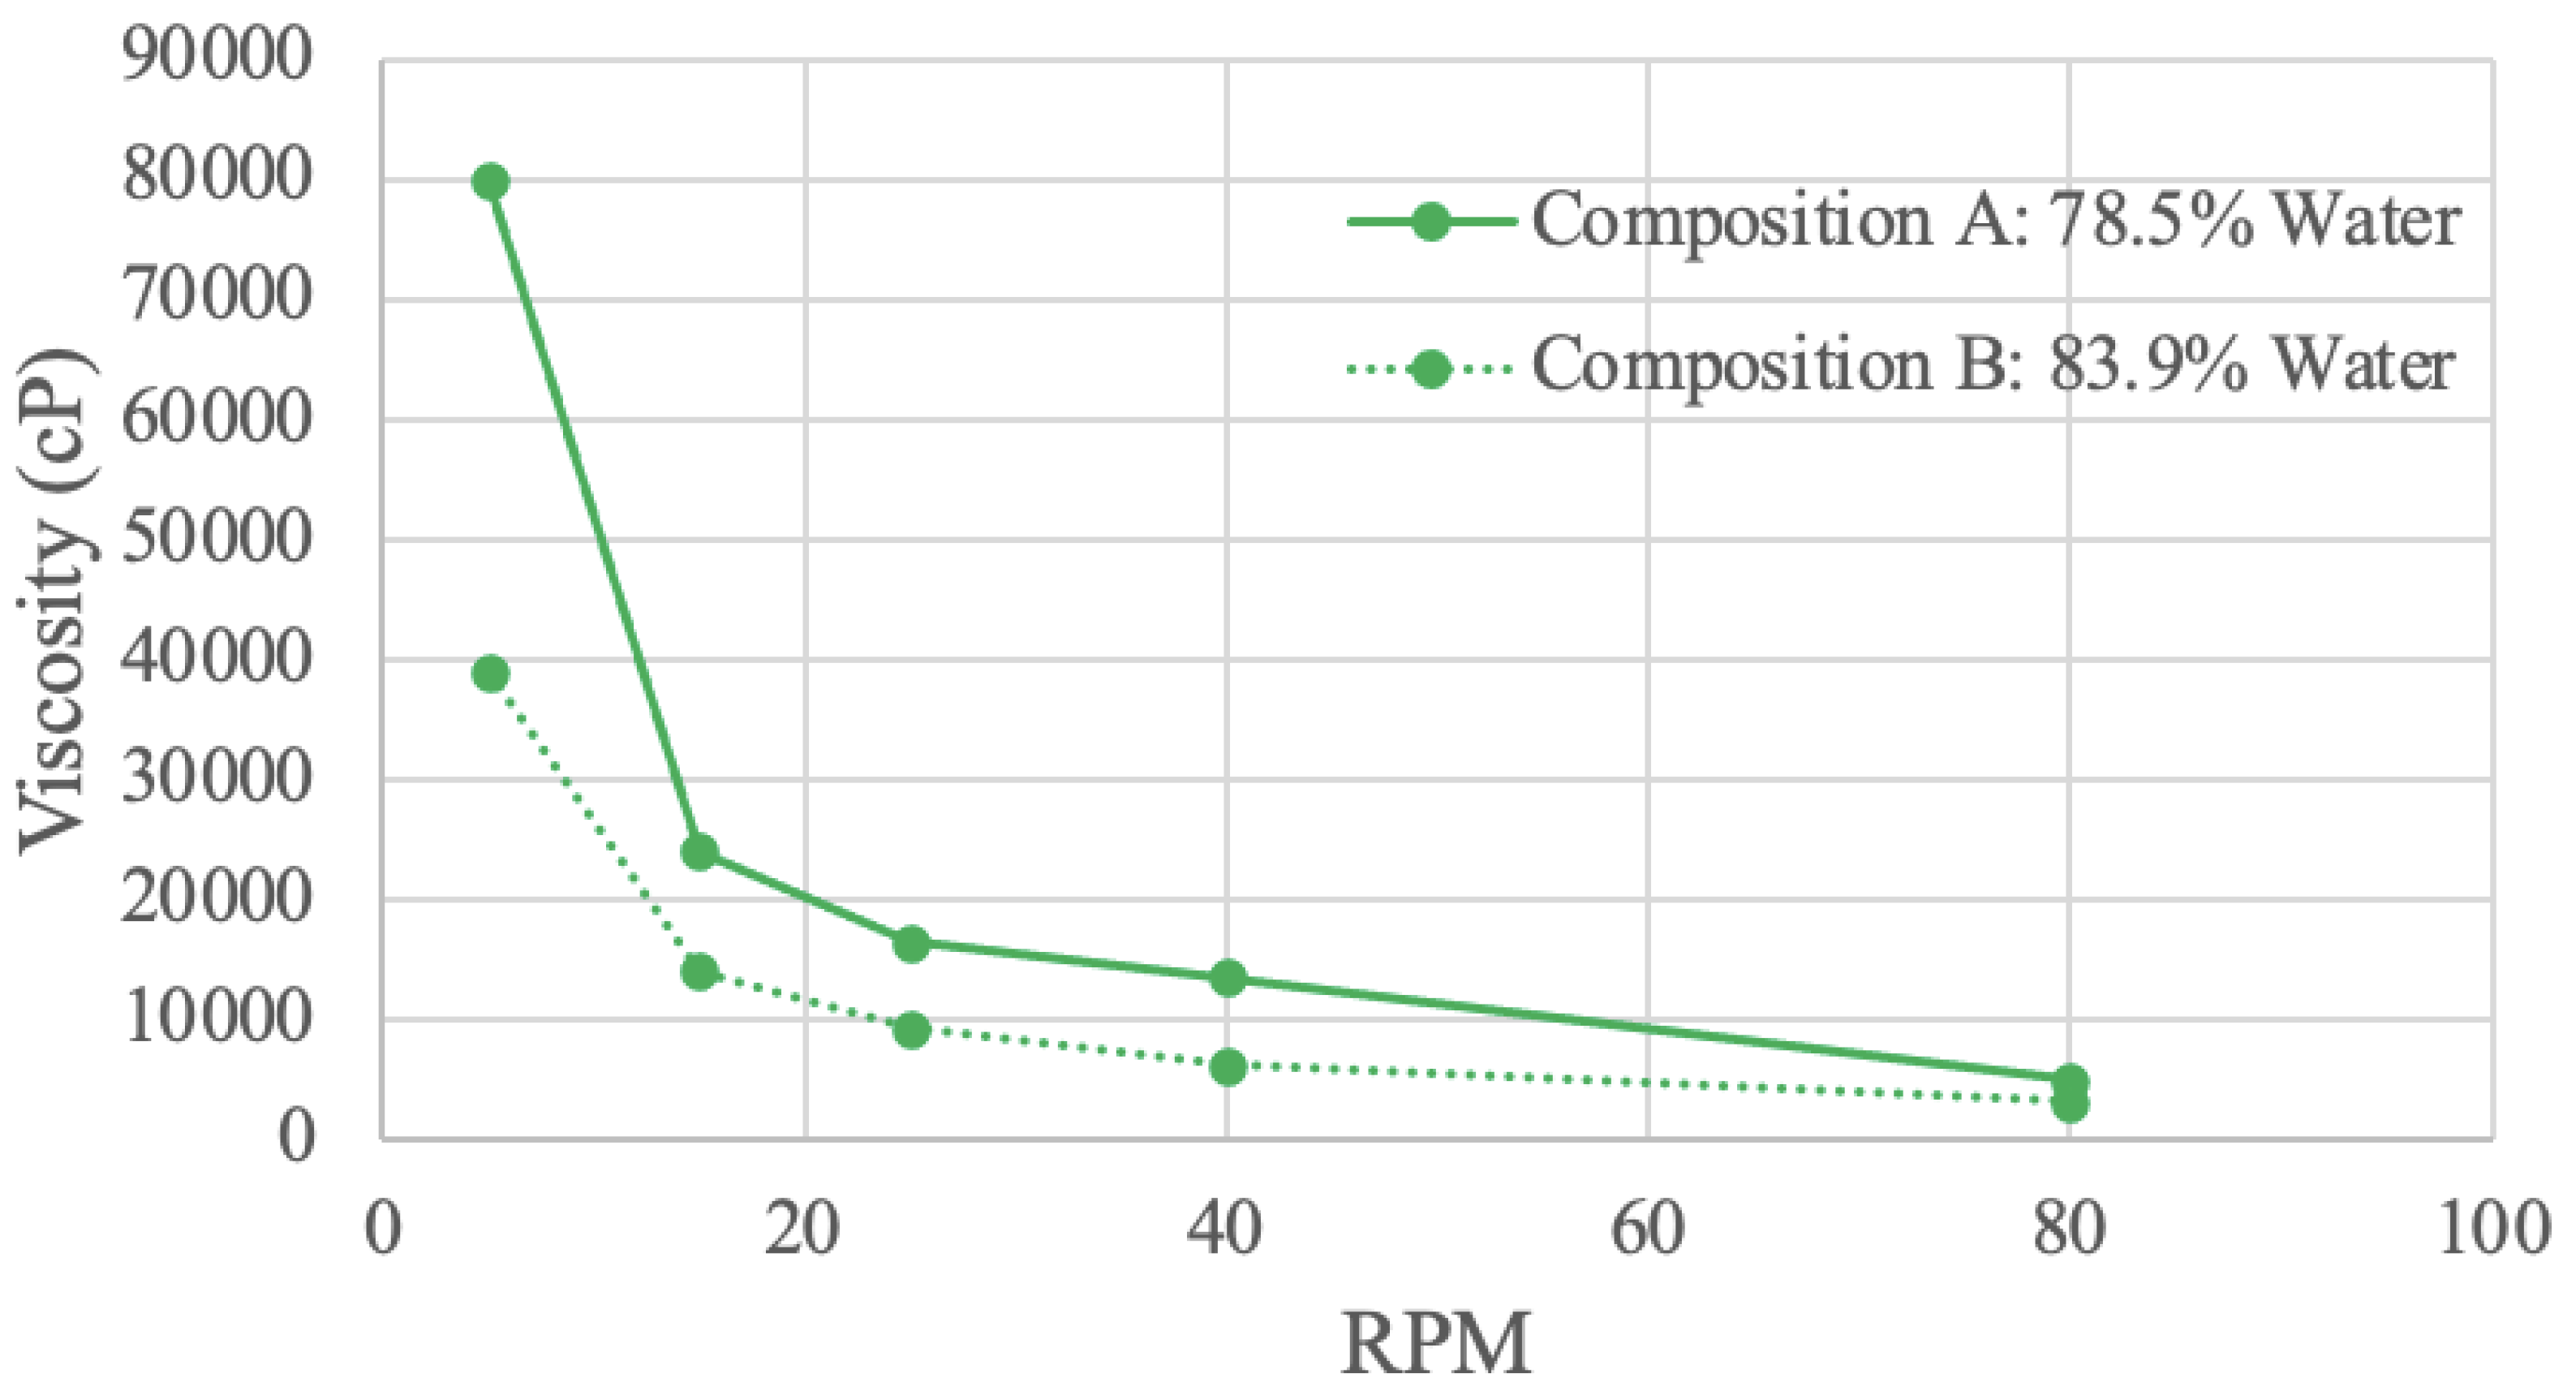
3.4.2. Soy Protein Viscosity Results
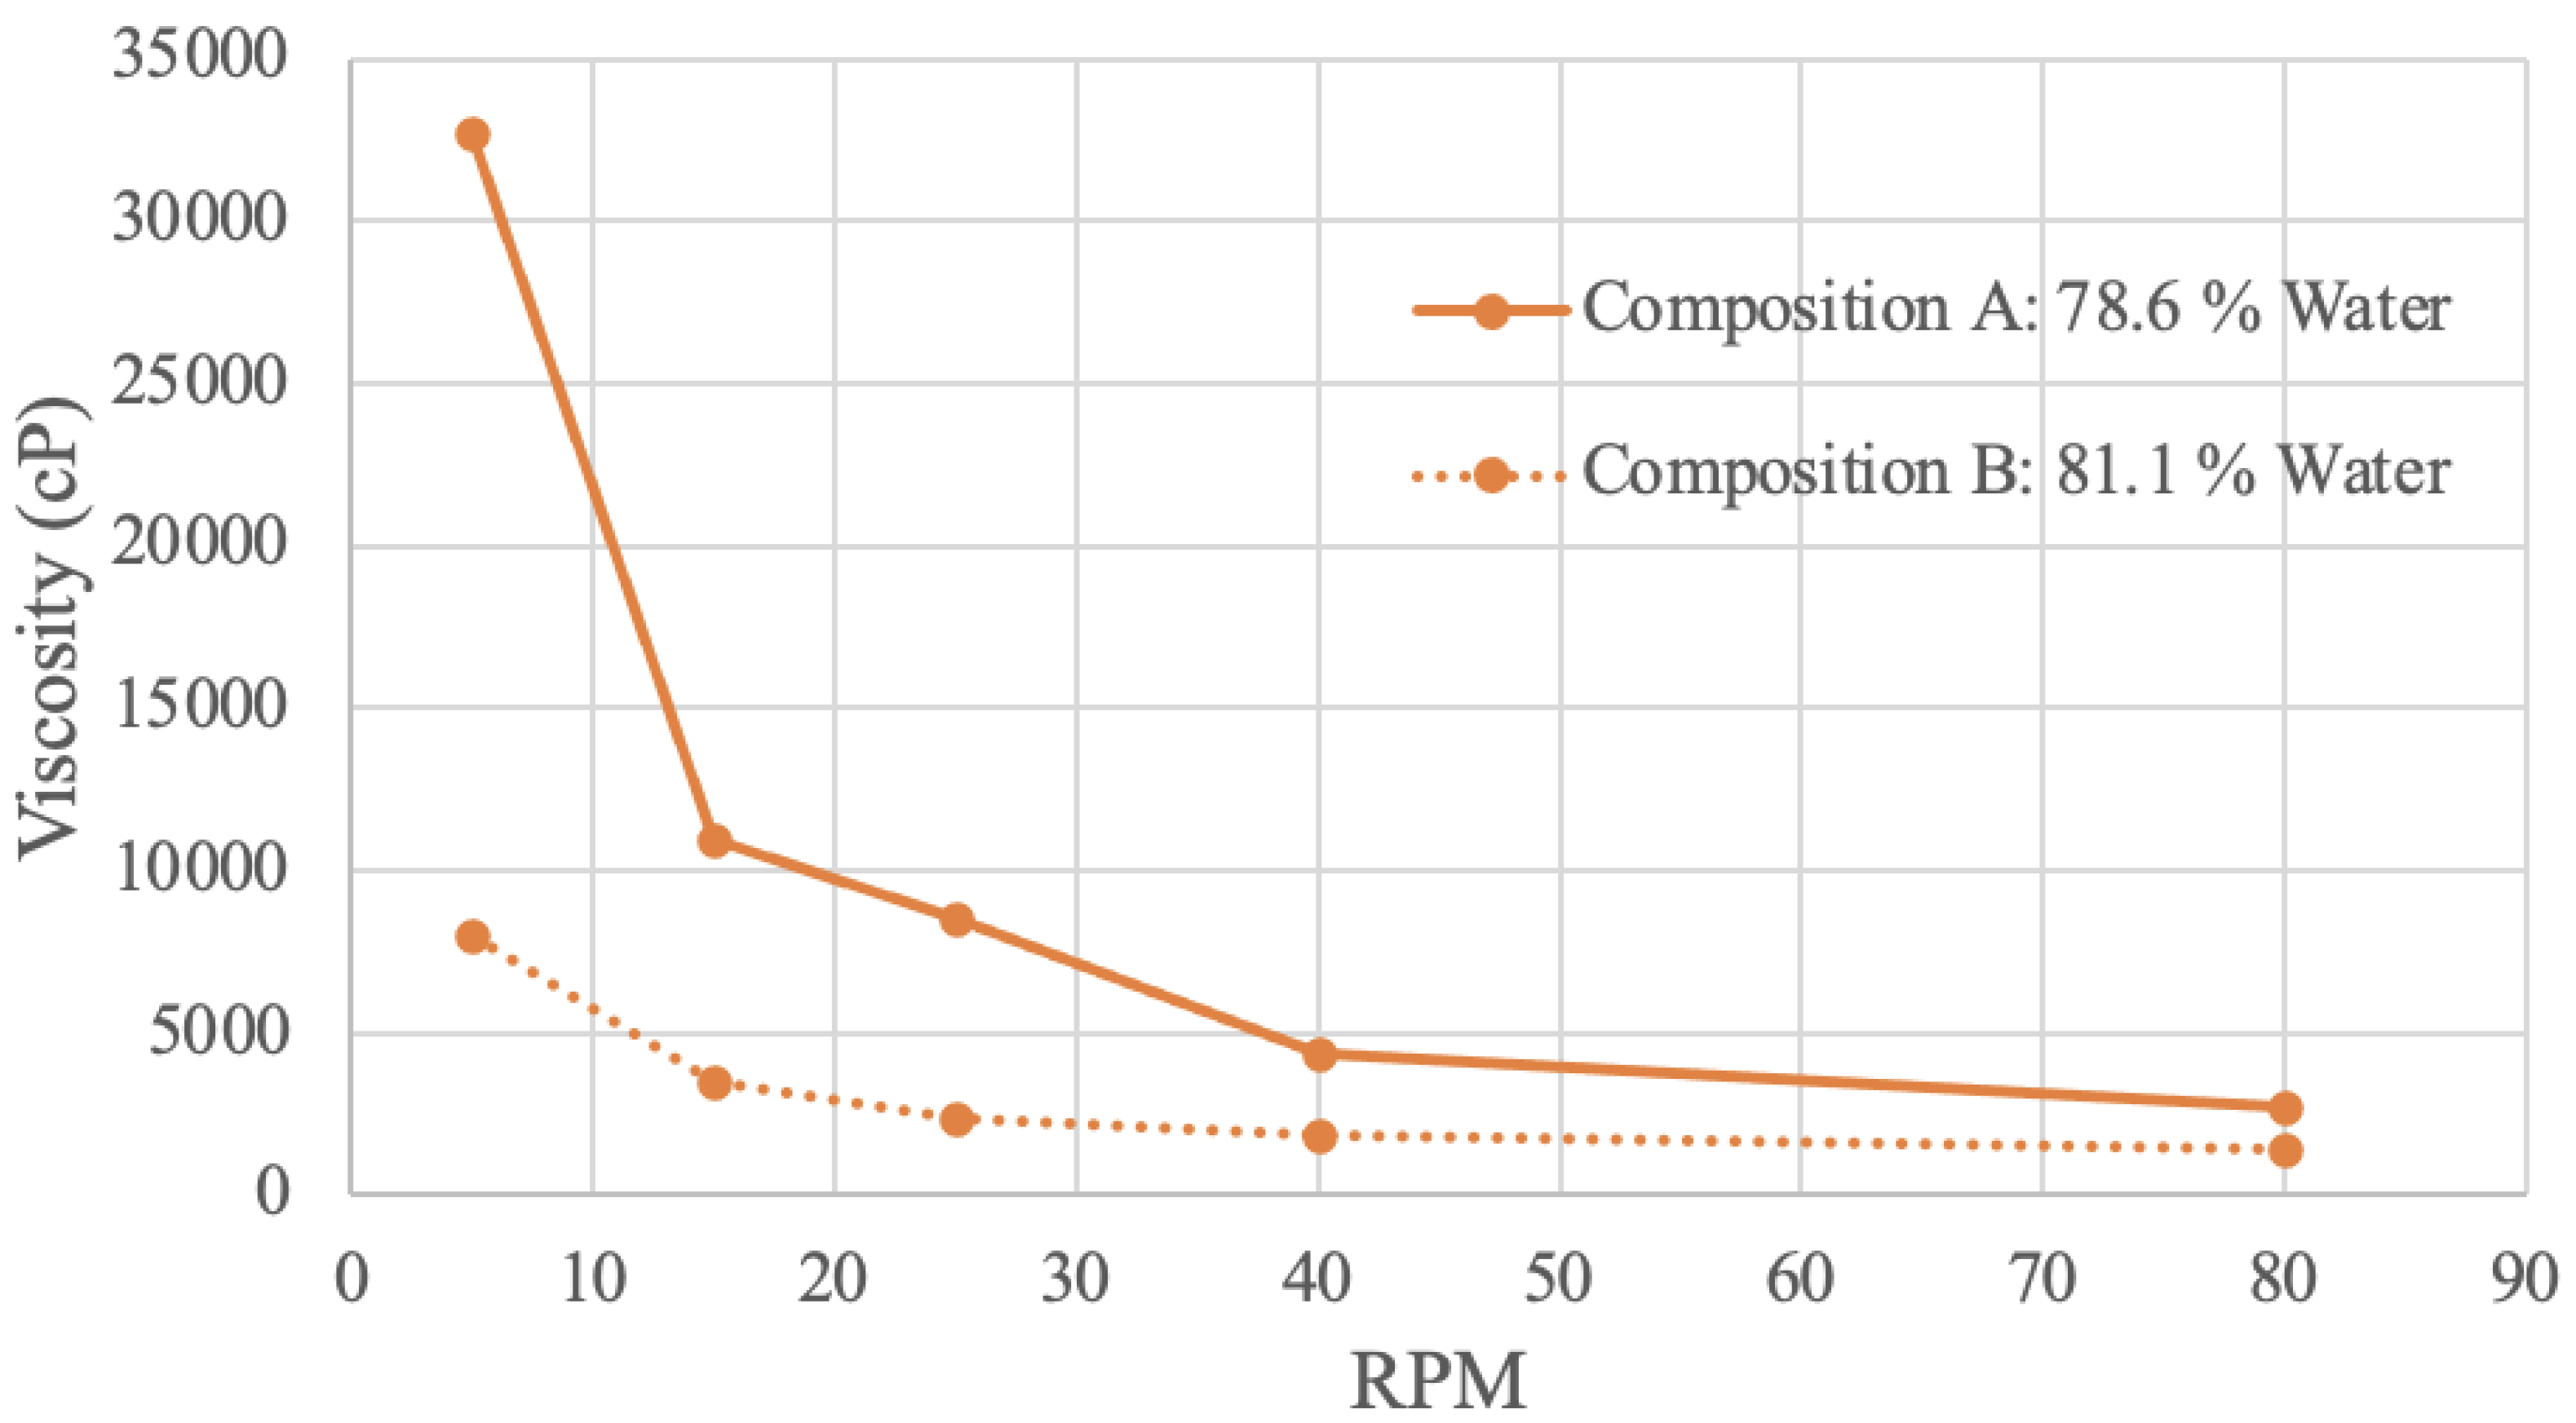
3.4.3. Pea Protein Viscosity Results
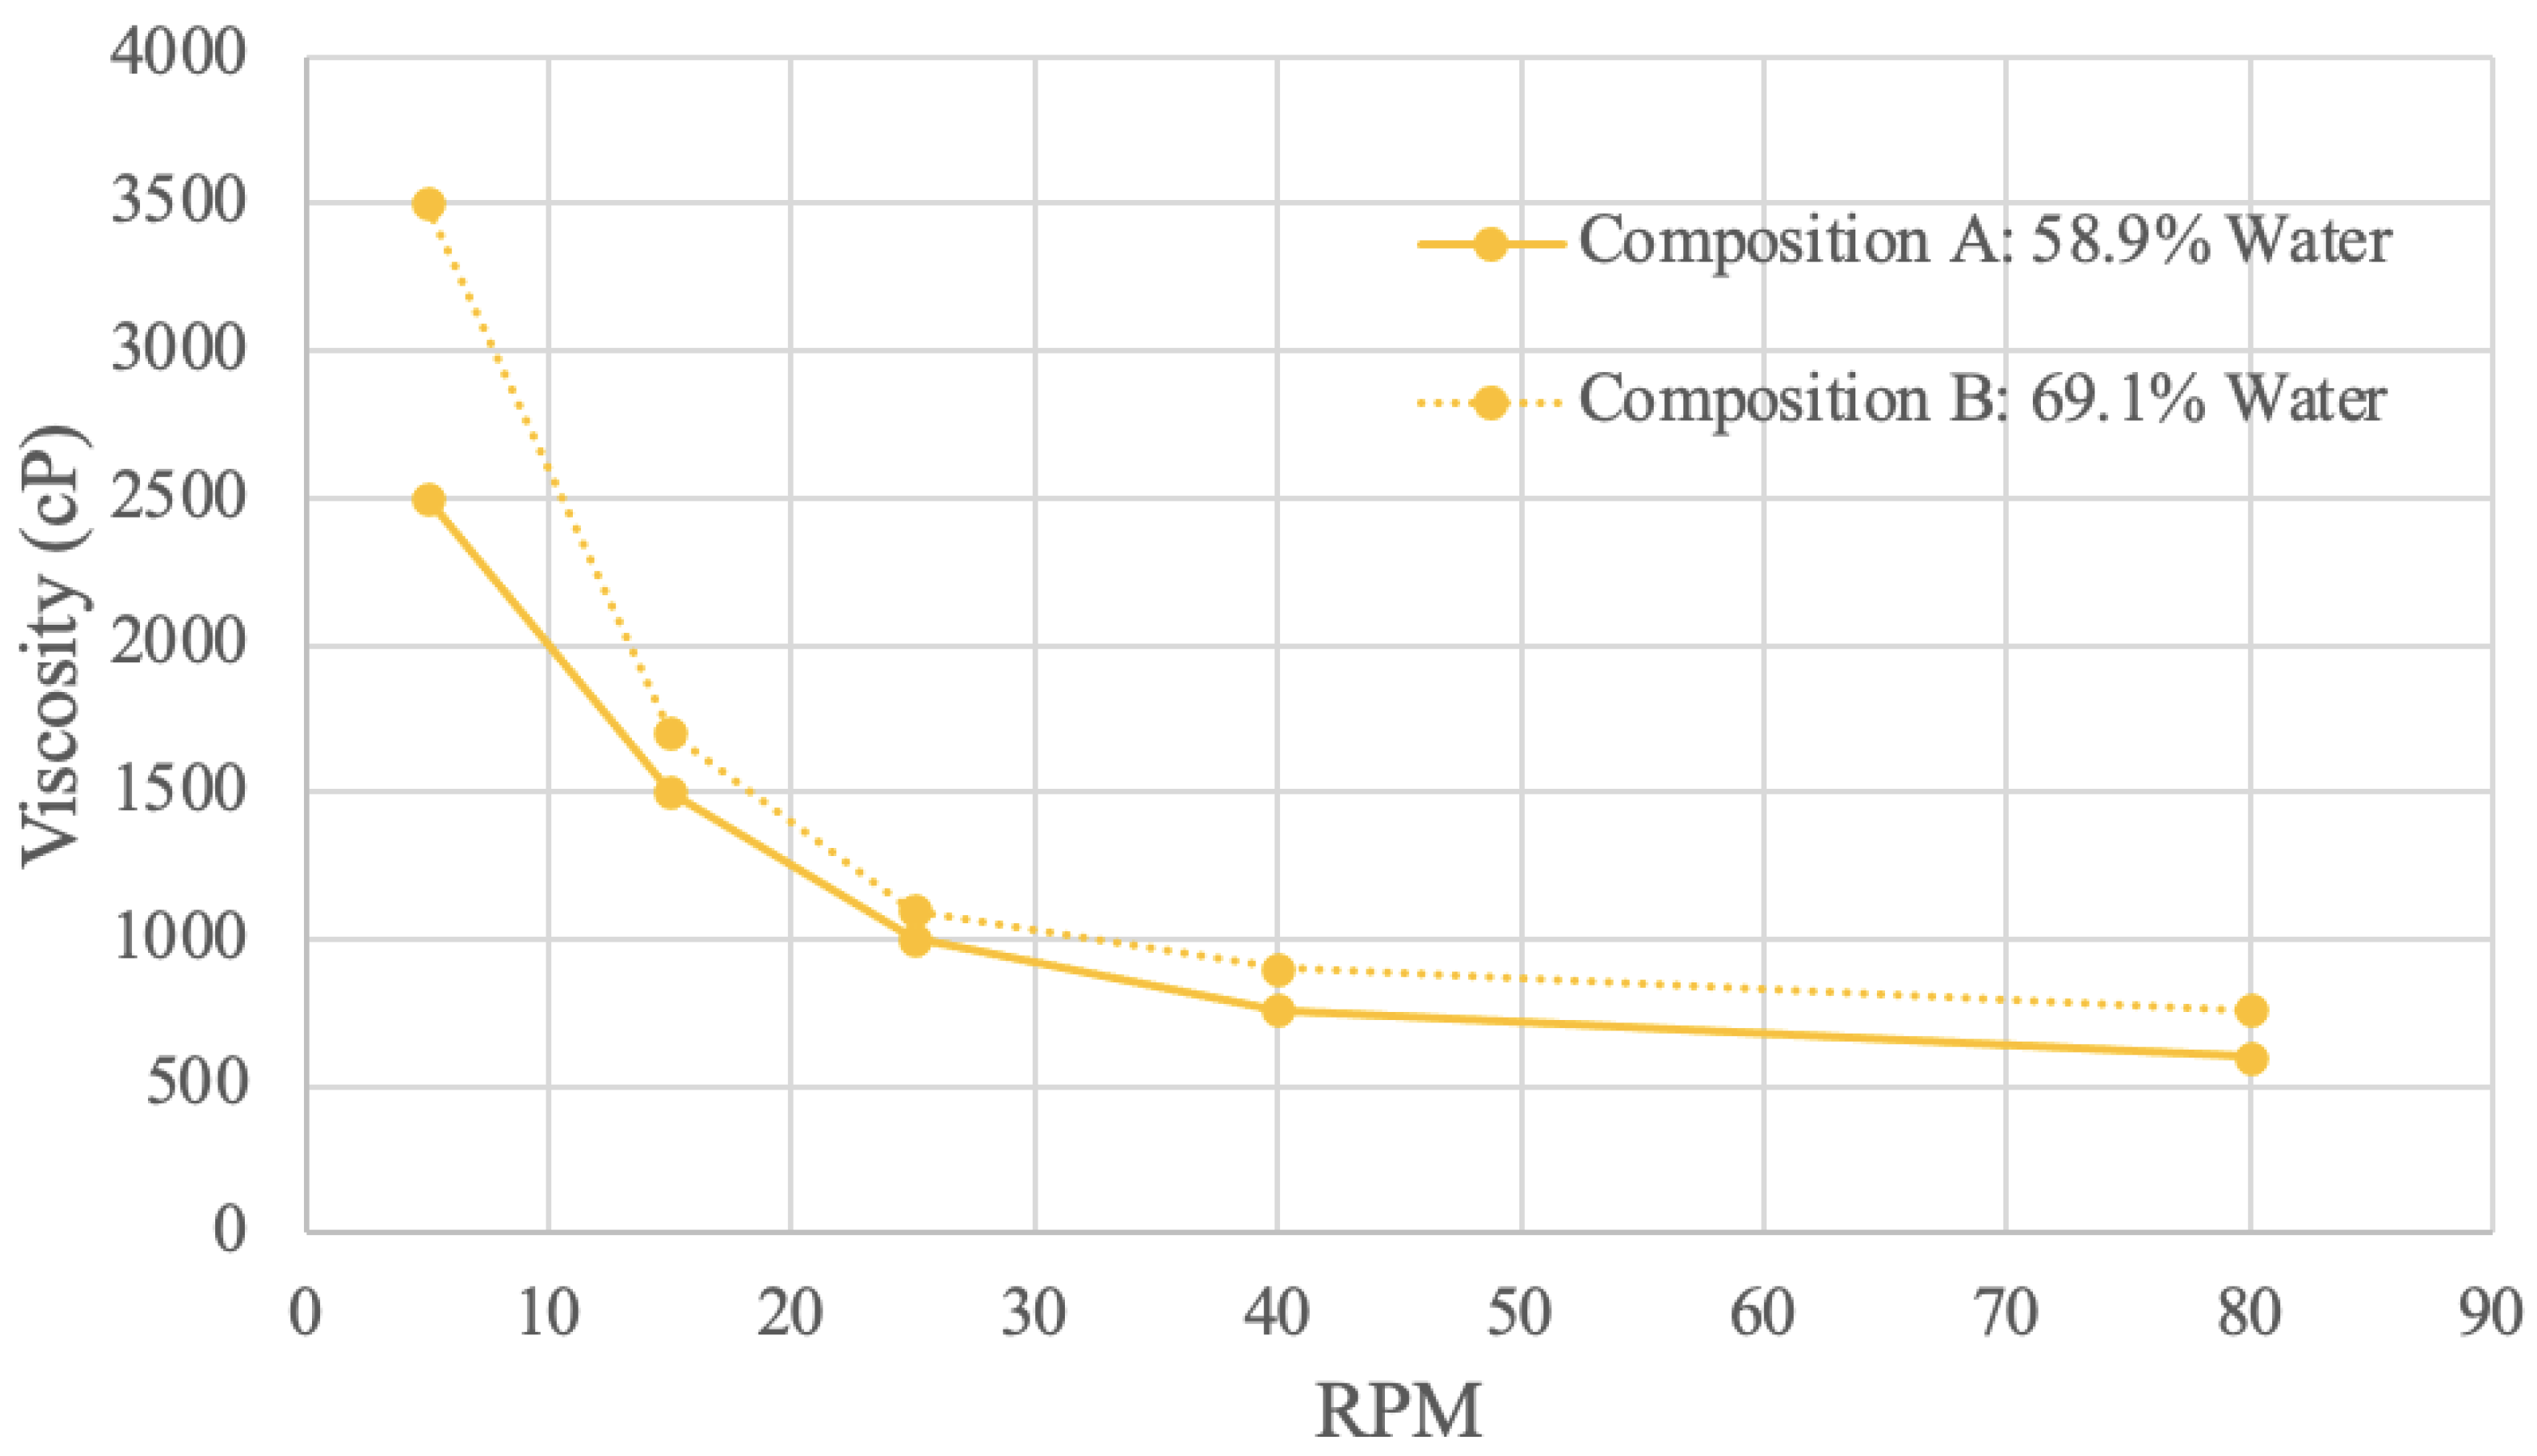
3.4.4. Brown Rice Protein Viscosity Results
3.5. Physical Properties and Nutrition
4. Discussion
4.1. Plant Protein Processing Options
4.2. Viability and Sustainability
4.3. Future Work
5. Conclusions
Author Contributions
Funding
Institutional Review Board Statement
Informed Consent Statement
Data Availability Statement
Acknowledgments
Conflicts of Interest
References
- United Nations: DESA, Population Division World Population Prospects 2022 Growth Rate. Available online: https://population.un.org/wpp/Graphs/Probabilistic/POP/GrowthRate/900 (accessed on 22 November 2022).
- Lindgren, E.; Harris, F.; Dangour, A.; Gasparatos, A.; Hiramatsu, M.; Javadi, F.; Loken, B.; Murakami, T.; Scheelbeek, P.; Haines, A. Sustainable Food Systems—A Health Perspective. Sustain. Sci. 2018, 13, 1505–1517. [Google Scholar] [CrossRef] [PubMed]
- Cole, M.; Augustin, M.; Robertson, M.; Manners, J. The Science of Food Security. NPJ Sci. Food 2018, 2, 14. [Google Scholar] [CrossRef] [PubMed]
- Dagevos, H.; Voordouw, J. Sustainability and Meat Consumption: Is Reduction Realistic? Sustain. Sci. Pract. Policy 2013, 9, 60–69. [Google Scholar] [CrossRef]
- Pimentel, D.; Pimentel, M. Sustainability of Meat-Based and Plant-Based Diets and the Environment. Am. J. Clin. Nutr. 2003, 78, 660S–663S. [Google Scholar] [CrossRef] [PubMed]
- Song, M.; Fung, T.T.; Hu, F.B.; Willett, W.C.; Longo, V.D.; Chan, A.T.; Giovannucci, E.L. Association of Animal and Plant Protein Intake With All-Cause and Cause-Specific Mortality. JAMA Intern. Med. 2016, 176, 1453. [Google Scholar] [CrossRef] [PubMed]
- Abete, I.; Romaguera, D.; Vieira, A.R.; Lopez De Munain, A.; Norat, T. Association between Total, Processed, Red and White Meat Consumption and All-Cause, CVD and IHD Mortality: A Meta-Analysis of Cohort Studies. Br. J. Nutr. 2014, 112, 762–775. [Google Scholar] [CrossRef] [PubMed]
- Mayo Clinic. It’s Time to Try Meatless Meals. Available online: https://www.mayoclinic.org/healthy-lifestyle/nutrition-and-healthy-eating/in-depth/meatless-meals/art-20048193 (accessed on 6 December 2023).
- Kim, H.; Caulfield, L.E.; Garcia-Larsen, V.; Steffen, L.M.; Coresh, J.; Rebholz, C.M. Plant-Based Diets Are Associated With a Lower Risk of Incident Cardiovascular Disease, Cardiovascular Disease Mortality, and All-Cause Mortality in a General Population of Middle-Aged Adults. JAHA 2019, 8, e012865. [Google Scholar] [CrossRef]
- Alonso, M.; González-Montaña, J.; Lomillos, J. Consumers’ Concerns and Perceptions of Farm Animal Welfare. Animals 2020, 10, 385. [Google Scholar] [CrossRef]
- Beausoleil, N.; Mellor, D.; Baker, L.; Baker, S.; Bellio, M.; Clarke, A.; Dale, A.; Garlick, S.; Jones, B.; Harvey, A.; et al. “Feelings and Fitness” Not “Feelings or Fitness”–The Raison d’être of Conservation Welfare, Which Aligns Conservation and Animal Welfare Objectives. Front. Vet. Sci. 2018, 5, 296. [Google Scholar] [CrossRef]
- Manyi-Loh, C.; Mamphweli, S.; Meyer, E.; Okoh, A. Antibiotic Use in Agriculture and Its Consequential Resistance in Environmental Sources: Potential Public Health Implications. Molecules 2018, 23, 795. [Google Scholar] [CrossRef]
- Serwecińska, L. Antimicrobials and Antibiotic-Resistant Bacteria: A Risk to the Environment and to Public Health. Water 2020, 12, 3313. [Google Scholar] [CrossRef]
- Crippa, M.; Solazzo, E.; Guizzardi, D.; Monforti-Ferrario, F.; Tubiello, F.N.; Leip, A. Food Systems Are Responsible for a Third of Global Anthropogenic GHG Emissions. Nat. Food 2021, 2, 198–209. [Google Scholar] [CrossRef]
- Reisinger, A.; Clark, H. How Much Do Direct Livestock Emissions Actually Contribute to Global Warming? Glob. Change Biol. 2018, 24, 1749–1761. [Google Scholar] [CrossRef]
- Chai, B.; van der Voort, J.; Grofelnik, K.; Eliasdottir, H.; Klöss, I.; Perez-Cueto, F. Which Diet Has the Least Environmental Impact on Our Planet? A Systematic Review of Vegan, Vegetarian and Omnivorous Diets. Sustainability 2019, 11, 4110. [Google Scholar] [CrossRef]
- Detzel, A.; Krüger, M.; Busch, M.; Blanco-Gutiérrez, I.; Varela, C.; Manners, R.; Bez, J.; Zannini, E. Life Cycle Assessment of Animal-based Foods and Plant-based Protein-rich Alternatives: An Environmental Perspective. J. Sci. Food Agric. 2022, 102, 5111–5120. [Google Scholar] [CrossRef]
- Rabès, A.; Seconda, L.; Langevin, B.; Allès, B.; Touvier, M.; Hercberg, S.; Lairon, D.; Baudry, J.; Pointereau, P.; Kesse-Guyot, E. Greenhouse Gas Emissions, Energy Demand and Land Use Associated with Omnivorous, Pesco-Vegetarian, Vegetarian, and Vegan Diets Accounting for Farming Practices. Sustain. Prod. Consum. 2020, 22, 138–146. [Google Scholar] [CrossRef]
- Aschemann-Witzel, J.; Gantriis, R.; Fraga, P.; Perez-Cueto, F. Plant-Based Food and Protein Trend from a Business Perspective: Markets, Consumers, and the Challenges and Opportunities in the Future. Crit. Rev. Food Sci. Nutr. 2021, 61, 3119–3128. [Google Scholar] [CrossRef] [PubMed]
- Plant Based Foods Association 2021 US Retail Sales Data for the Plant-Based Food Industry. Available online: https://www.plantbasedfoods.org/2021-u-s-retail-sales-data-for-the-plant-based-foods-industry/ (accessed on 7 November 2022).
- Remde, A.; DeTurk, S.; Almardini, A.; Steiner, L.; Wojda, T. Plant-Predominant Eating Patterns–How Effective Are They for Treating Obesity and Related Cardiometabolic Health Outcomes?—A Systematic Review. Nutr. Rev. 2022, 80, 1094–1104. [Google Scholar] [CrossRef]
- Fresán, U.; Sabaté, J. Vegetarian Diets: Planetary Health and Its Alignment with Human Health. Adv. Nutr. 2019, 10, S380–S388. [Google Scholar] [CrossRef]
- Fehér, A.; Gazdecki, M.; Véha, M.; Szakály, M.; Szakály, Z. A Comprehensive Review of the Benefits of and the Barriers to the Switch to a Plant-Based Diet. Sustainability 2020, 12, 4136. [Google Scholar] [CrossRef]
- Von Essen, E. Young Adults’ Transition to a Plant-Based Diet as a Psychosomatic Process: A Psychoanalytically Informed Perspective. Appetite 2021, 157, 105003. [Google Scholar] [CrossRef] [PubMed]
- Tziva, M.; Negro, S.; Kalfagianni, A.; Hekkert, M. Understanding the Protein Transition: The Rise of Plant-Based Meat Substitutes. Environ. Innov. Soc. Transit. 2021, 35, 217–231. [Google Scholar] [CrossRef]
- Santo, R.E.; Kim, B.F.; Goldman, S.E.; Dutkiewicz, J.; Biehl, E.M.B.; Bloem, M.W.; Neff, R.A.; Nachman, K.E. Considering Plant-Based Meat Substitutes and Cell-Based Meats: A Public Health and Food Systems Perspective. Front. Sustain. Food Syst. 2020, 4, 134. [Google Scholar] [CrossRef]
- Bakhsh, A.; Lee, S.; Lee, E.; Hwang, Y.; Jo, S. Traditional Plant-Based Meat Alternatives, Current and a Future Perspective: A Review. J. Agric. Life Sci 2021, 28, 1–11. [Google Scholar] [CrossRef]
- Curtain, F.; Grafenauer, S. Plant-Based Meat Substitutes in the Flexitarian Age: An Audit of Products on Supermarket Shelves. Nutrients 2019, 11, 2603. [Google Scholar] [CrossRef]
- Walmart Canada Beyond Meat Plant Based Ground, 340 g. Available online: https://www.walmart.ca/en/ip/beyond-meat-plant-based-ground-340g/6000200853971 (accessed on 26 November 2022).
- Walmart Canada Search: Ground Beef. Available online: https://www.walmart.ca/search?q=ground%20beef&c=10019 (accessed on 26 November 2022).
- U.S. Department of Agriculture. Chicken, Broilers or Fryers, Breast, Meat Only, Cooked, Roasted; U.S. Department of Agriculture: Washington, DC, USA, 2019.
- USDA. Livestock, Poultry, & Grain Market News Broiler/Fryer: USDA Weekly Retail Chicken Feature Activity Report (Fri); U.S. Department of Agriculture: Washington, DC, USA, 2022.
- U.S. Department of Agriculture. Central Beef, Ground, Patties, Frozen, Cooked, Broiled; U.S. Department of Agriculture: Washington, DC, USA, 2019.
- USDA. Agricultural Marketing Service, Livestock, Poultry, & Grain Market News USDA Weekly Retail Beef Feature Activity; U.S. Department of Agriculture: Washington, DC, USA, 2022.
- U.S. Department of Agriculture. Central Pork, Fresh, Shoulder, Blade, Boston (Roasts), Separable Lean and Fat, Cooked, Roasted; U.S. Department of Agriculture: Washington, DC, USA, 2019.
- USDA. Livestock, Poultry, & Grain Market News National Monthly Pasture Raised Pork Report; U.S. Department of Agriculture: Washington, DC, USA, 2022.
- U.S. Department of Agriculture. Lamb, Ground, Raw; U.S. Department of Agriculture: Washington, DC, USA, 2019.
- USDA. Livestock, Poultry, & Grain Market News National Estimated Lamb Carcass Cutout (PDF) (LM_XL502); U.S. Department of Agriculture: Washington, DC, USA, 2022.
- Alibaba.com. Factory Spirulina Suppliers Organic Green Colors Spirulina Powder Bulk Super Spirulina Powder Tablets. Available online: https://www.alibaba.com/product-detail/Factory-Spirulina-Suppliers-Organic-Green-Colors_1600345281535.html (accessed on 7 November 2022).
- U.S. Department of Agriculture. Spirulina Powder; U.S. Department of Agriculture: Washington, DC, USA, 2021.
- MRM Nutrition Superfoods—Spirulina Powder. Available online: https://mrmnutrition.com/products/superfoods-raw-spirulina-powder (accessed on 7 November 2022).
- Healthy Planet Canada Organika Organic Spirulina 500 g. Available online: https://www.healthyplanetcanada.com/organika-organic-spirulina-500g.html (accessed on 7 November 2022).
- U.S. Department of Agriculture. Soybeans, Mature Seeds, Dry Roasted; U.S. Department of Agriculture: Washington, DC, USA, 2019.
- U.S. Department of Agriculture. Feed Grains Custom Query Soybean Meal, High Protein; U.S. Department of Agriculture: Washington, DC, USA, 2022.
- Alibaba.com. Soy Protein Isolate/ISP Isolated Soy Protein for Beverage Use/Bulk Price Soy Protein Isolates. Available online: https://www.alibaba.com/product-detail/Soy-Protein-Isolate-ISP-Isolated-Soy_1600627163803.html (accessed on 7 November 2022).
- BulkFoods.com. Soy Isolate Protein 90%. Available online: https://bulkfoods.com/pure-protein-powders/soy-isolate-protein-90.html (accessed on 7 November 2022).
- Healthy Planet Canada NOW Soy Protein Isolate Unflavoured 544 g. Available online: https://www.healthyplanetcanada.com/now-soy-protein-isolate-unflavoured-544g.html (accessed on 7 November 2022).
- U.S. Department of Agriculture. Peas, Green, Raw; U.S. Department of Agriculture: Washington, DC, USA, 2019.
- Gittlein, J. USDA Weekly Bean, Pea, and Lentil Market Review; U.S. Department of Agriculture: Washington, DC, USA, 2022.
- Alibaba.com. Hot Sell Non-GMO Organic Pea Protein Powder 85% For Food Supplement. Available online: https://www.alibaba.com/product-detail/Pea-Protein-Hot-Sell-Non-GMO_1600565503077.html (accessed on 7 November 2022).
- BulkFoods.com. Pea Protein Powder. Available online: https://bulkfoods.com/pure-protein-powders/pea-protein-powder.html (accessed on 7 November 2022).
- Healthy Planet Canada NOW Pea Protein Unflavoured 907 g. Available online: https://www.healthyplanetcanada.com/now-pea-protein-907g.html (accessed on 7 November 2022).
- U.S. Department of Agriculture. Rice Bran, Crude; U.S. Department of Agriculture: Washington, DC, USA, 2019.
- U.S. Department of Agriculture. Feed Grains Custom Query Rice Bran, f. o. b. Mills; U.S. Department of Agriculture: Washington, DC, USA, 2022.
- Alibaba.com. Pincredit Supply Plant Protein Supplement Wholesale Brown Rice Protein Powder. Available online: https://www.alibaba.com/product-detail/Protein-Brown-Rice-Pincredit-Supply-Plant_1600558111076.html?spm=a2700.7735675.topad_classic.d_title.2d213cadln1a31 (accessed on 7 November 2022).
- BulkFoods.com. Brown Rice Protein Powder. Available online: https://bulkfoods.com/pure-protein-powders/brown-rice-protein-powder.html (accessed on 7 November 2022).
- Healthy Planet Canada North Coast Naturals Brown Rice Protein 340 g. Available online: https://www.healthyplanetcanada.com/north-coast-naturals-brown-rice-protein-340g.html (accessed on 7 November 2022).
- Zhang, J.; Chen, Q.; Kaplan, D.L.; Wang, Q. High-Moisture Extruded Protein Fiber Formation toward Plant-Based Meat Substitutes Applications: Science, Technology, and Prospect. Trends Food Sci. Technol. 2022, 128, 202–216. [Google Scholar] [CrossRef]
- Rasband, W. ImageJ 2022. Available online: https://imagej.net/ij/ (accessed on 7 November 2022).
- Shanbhag, A.G. Utilization of Information Measure as a Means of Image Thresholding. CVGIP: Graph. Models Image Process. 1994, 56, 414–419. [Google Scholar] [CrossRef]
- Prewitt, J.M.S.; Mendelsohn, M.L. THE ANALYSIS OF CELL IMAGES*. Ann. N. Y. Acad. Sci. 2006, 128, 1035–1053. [Google Scholar] [CrossRef]
- Cyanotech Corporation. 100% Pure All Natural Hawaiian Spirulina (Fine Powder) Specifications and General Composition. Available online: https://www.cyanotech.com/pdfs/spirulina/specifications.html#:~:text=It%20has%20a%20mild%20seaweed,0.48%20(g%2Fml).&text=Store%20at%20room%20temperature (accessed on 7 November 2022).
- John, H.; Mansuri, S.; Giri, S.; Sinha, L. Rheological Properties and Particle Size Distribution of Soy Protein Isolate as Affected by Drying Methods. NFSIJ 2018, 7, 555721. [Google Scholar]
- Overduin, J.; Guérin-Deremaux, L.; Wils, D.; Lambers, T.T. NUTRALYS® Pea Protein: Characterization of in Vitro Gastric Digestion and in Vivo Gastrointestinal Peptide Responses Relevant to Satiety. Food Nutr. Res. 2015, 59, 25622. [Google Scholar] [CrossRef] [PubMed]
- Amagliani, L.; O’Regan, J.; Kelly, A.L.; O’Mahony, J.A. Physical and Flow Properties of Rice Protein Powders. J. Food Eng. 2016, 190, 1–9. [Google Scholar] [CrossRef]
- Schawe, J.; Riesen, R.; Widmann, J.; Schubnell, M.; Jörimann, U. UserCom, Information for Users of Mettler Toledo Thermal Analysis Systems 2000. Available online: https://www.mt.com/dam/mt_ext_files/Editorial/Generic/0/TA_UserCom24_Editorial-Generic_1201690913917_files/usercom24_ta_e_web.pdf (accessed on 7 November 2022).
- Chronakis, I. Gelation of Edible Blue-Green Algae Protein Isolate (Spirulina Platensis Strain Pacifica): Thermal Transitions, Rheological Properties, and Molecular Forces Involved. J. Agric. Food Chem. 2001, 49, 888–898. [Google Scholar] [CrossRef]
- Poel, G.V.; Istrate, D.; Magon, A.; Mathot, V. Performance and Calibration of the Flash DSC 1, a New, MEMS-Based Fast Scanning Calorimeter. J. Therm. Anal. Calorim. 2012, 110, 1533–1546. [Google Scholar] [CrossRef]
- Sun, X.; Lee, K.O.; Medina, M.A.; Chu, Y.; Li, C. Melting Temperature and Enthalpy Variations of Phase Change Materials (PCMs): A Differential Scanning Calorimetry (DSC) Analysis. Phase Transit. 2018, 91, 667–680. [Google Scholar] [CrossRef]
- Zhong, Z.K.; Sun, X.S. Thermal Behavior and Nonfreezing Water of Soybean Protein Components. Cereal. Chem. 2000, 77, 495–500. [Google Scholar] [CrossRef]
- TA Instruments. Interpreting Unexpected Events and Transitions in DSC Results; TA Instruments: New Castle, DE, USA, 2017. [Google Scholar]
- Kitabatake, N.; Tahara, M.; Doi, E. Thermal Denaturation of Soybean Protein at Low Water Contents. Agric. Biol. Chem. 1990, 54, 2205–2212. [Google Scholar] [CrossRef]
- Li, S.; Wei, Y.; Fang, Y.; Zhang, W.; Zhang, B. DSC Study on the Thermal Properties of Soybean Protein Isolates/Corn Starch Mixture. J. Therm. Anal. Calorim. 2014, 115, 1633–1638. [Google Scholar] [CrossRef]
- Li, J.-Y.; Yeh, A.-I.; Fan, K.-L. Gelation Characteristics and Morphology of Corn Starch/Soy Protein Concentrate Composites during Heating. J. Food Eng. 2007, 78, 1240–1247. [Google Scholar] [CrossRef]
- Mession, J.-L.; Sok, N.; Assifaoui, A.; Saurel, R. Thermal Denaturation of Pea Globulins (Pisum Sativum L.)—Molecular Interactions Leading to Heat-Induced Protein Aggregation. J. Agric. Food Chem. 2013, 61, 1196–1204. [Google Scholar] [CrossRef] [PubMed]
- Shen, S.; Hou, H.; Ding, C.; Bing, D.-J.; Lu, Z.-X. Protein Content Correlates with Starch Morphology, Composition and Physicochemical Properties in Field Peas. Can. J. Plant Sci. 2016, 96, 404–412. [Google Scholar] [CrossRef]
- Oyinloye, T.M.; Yoon, W.B. Stability of 3D Printing Using a Mixture of Pea Protein and Alginate: Precision and Application of Additive Layer Manufacturing Simulation Approach for Stress Distribution. J. Food Eng. 2021, 288, 110127. [Google Scholar] [CrossRef]
- Wang, T.; Xu, P.; Chen, Z.; Zhou, X.; Wang, R. Alteration of the Structure of Rice Proteins by Their Interaction with Soy Protein Isolates to Design Novel Protein Composites. Food Funct. 2018, 9, 4282–4291. [Google Scholar] [CrossRef]
- Bridges, S.; Robinson, L. Chapter 1—Rheology. In A Practical Handbook for Drilling Fluids Processing; Gulf Professional Publishing: Oxford, UK, 2022; pp. 3–26. [Google Scholar]
- Kar, F.; Arslan, N. Effect of Temperature and Concentration on Viscosity of Orange Peel Pectin Solutions and Intrinsic Viscosity–Molecular Weight Relationship. Carbohydr. Polym. 1999, 40, 277–284. [Google Scholar] [CrossRef]
- Hassanzadeh, H.; Ghanbarzadeh, B.; Galali, Y.; Bagheri, H. The Physicochemical Properties of the Spirulina-wheat Germ-enriched High-protein Functional Beverage Based on Pear-cantaloupe Juice. Food Sci. Nutr. 2022, 10, 3651–3661. [Google Scholar] [CrossRef]
- Liu, P.; Xu, H.; Zhao, Y.; Yang, Y. Rheological Properties of Soy Protein Isolate Solution for Fibers and Films. Food Hydrocoll. 2017, 64, 149–156. [Google Scholar] [CrossRef]
- Zhang, Z.; Liu, Y. Recent Progresses of Understanding the Viscosity of Concentrated Protein Solutions. Curr. Opin. Chem. Eng. 2017, 16, 48–55. [Google Scholar] [CrossRef]
- Qi, G.; Li, N.; Wang, D.; Sun, X.S. Adhesion and Physicochemical Properties of Soy Protein Modified by Sodium Bisulfite. J. Americ. Oil Chem. Soc. 2013, 90, 1917–1926. [Google Scholar] [CrossRef]
- Osen, R.; Toelstede, S.; Wild, F.; Eisner, P.; Schweiggert-Weisz, U. High Moisture Extrusion Cooking of Pea Protein Isolates: Raw Material Characteristics, Extruder Responses, and Texture Properties. J. Food Eng. 2014, 127, 67–74. [Google Scholar] [CrossRef]
- Lee, K.; Lee, J. Chapter 6—Hybrid Thermal Recovery Using Low-Salinity and Smart Waterflood. In Hybrid Enhanced Oil Recovery Using Smart Waterflooding; Gulf Professional Publishing: Oxford, UK, 2019; pp. 129–135. [Google Scholar]
- Beck, S.M.; Knoerzer, K.; Sellahewa, J.; Emin, M.A.; Arcot, J. Effect of Different Heat-Treatment Times and Applied Shear on Secondary Structure, Molecular Weight Distribution, Solubility and Rheological Properties of Pea Protein Isolate as Investigated by Capillary Rheometry. J. Food Eng. 2017, 208, 66–76. [Google Scholar] [CrossRef]
- Wu, J.; Xu, S.; Yan, X.; Zhang, X.; Xu, X.; Li, Q.; Ye, J.; Liu, C. Effect of Homogenization Modified Rice Protein on the Pasting Properties of Rice Starch. Foods 2022, 11, 1601. [Google Scholar] [CrossRef] [PubMed]
- Li, X.; Liu, Y.; Yi, C.; Cheng, Y.; Zhou, S.; Hua, Y. Microstructure and Rheological Properties of Mixtures of Acid-Deamidated Rice Protein and Dextran. J. Cereal Sci. 2010, 51, 7–12. [Google Scholar] [CrossRef]
- Chhabra, R.; Richardson, J. Chapter 3—Flow in Pipes and in Conduits of Non-Circular Cross-Sections. In Non-Newtonian Flow and Applied Rheology (Second Edition); Butterworth-Heinemann: Oxford, UK, 2008; pp. 110–205. [Google Scholar]
- Liestianty, D.; Rodianawati, I.; Arfah, R.A.; Assa, A.; Patimah; Sundari; Muliadi. Nutritional Analysis of Spirulina Sp to Promote as Superfood Candidate. IOP Conf. Ser. Mater. Sci. Eng. 2019, 509, 012031. [Google Scholar] [CrossRef]
- Gorissen, S.H.M.; Crombag, J.J.R.; Senden, J.M.G.; Waterval, W.A.H.; Bierau, J.; Verdijk, L.B.; Van Loon, L.J.C. Protein Content and Amino Acid Composition of Commercially Available Plant-Based Protein Isolates. Amino Acids 2018, 50, 1685–1695. [Google Scholar] [CrossRef] [PubMed]
- Sá, A.G.A.; Moreno, Y.M.F.; Carciofi, B.A.M. Plant Proteins as High-Quality Nutritional Source for Human Diet. Trends Food Sci. Technol. 2020, 97, 170–184. [Google Scholar] [CrossRef]
- Vasconcelos, I.M.; Campello, C.C.; Oliveira, J.T.A.; Carvalho, A.F.U.; Souza, D.O.B.D.; Maia, F.M.M. Brazilian Soybean Glycine max (L.) Merr. Cultivars Adapted to Low Latitude Regions: Seed Composition and Content of Bioactive Proteins. Rev. Bras. Bot. 2006, 29, 617–625. [Google Scholar] [CrossRef]
- Montoya, C.A.; Gomez, A.S.; Lallès, J.-P.; Souffrant, W.B.; Beebe, S.; Leterme, P. In Vitro and in Vivo Protein Hydrolysis of Beans (Phaseolus vulgaris) Genetically Modified to Express Different Phaseolin Types. Food Chem. 2008, 106, 1225–1233. [Google Scholar] [CrossRef]
- Amagliani, L.; O’Regan, J.; Kelly, A.L.; O’Mahony, J.A. The Composition, Extraction, Functionality and Applications of Rice Proteins: A Review. Trends Food Sci. Technol. 2017, 64, 1–12. [Google Scholar] [CrossRef]
- Liu, K.; Zheng, J.; Chen, F. Relationships between Degree of Milling and Loss of Vitamin B, Minerals, and Change in Amino Acid Composition of Brown Rice. LWT-Food Sci. Technol. 2017, 82, 429–436. [Google Scholar] [CrossRef]
- Vendemiatti, A.; Rodrigues Ferreira, R.; Humberto Gomes, L.; Oliveira Medici, L.; Antunes Azevedo, R. Nutritional Quality of Sorghum Seeds: Storage Proteins and Amino Acids. Food Biotechnol. 2008, 22, 377–397. [Google Scholar] [CrossRef]
- Boye, J.; Wijesinha-Bettoni, R.; Burlingame, B. Protein Quality Evaluation Twenty Years after the Introduction of the Protein Digestibility Corrected Amino Acid Score Method. Br. J. Nutr. 2012, 108, S183–S211. [Google Scholar] [CrossRef] [PubMed]
- Sarwar Gilani, G.; Wu Xiao, C.; Cockell, K.A. Impact of Antinutritional Factors in Food Proteins on the Digestibility of Protein and the Bioavailability of Amino Acids and on Protein Quality. Br. J. Nutr. 2012, 108, S315–S332. [Google Scholar] [CrossRef] [PubMed]
- Park, S.J.; Kim, T.W.; Baik, B.-K. Relationship between Proportion and Composition of Albumins, and in Vitro Protein Digestibility of Raw and Cooked Pea Seeds (Pisum Sativum L.): Composition and in Vitro Digestibility of Pea Protein. J. Sci. Food Agric. 2010, 90, 1719–1725. [Google Scholar] [CrossRef] [PubMed]
- Abdul-Fattah, A.M.; Kalonia, D.S.; Pikal, M.J. The Challenge of Drying Method Selection for Protein Pharmaceuticals: Product Quality Implications. J. Pharm. Sci. 2007, 96, 1886–1916. [Google Scholar] [CrossRef]
- Zhao, Q.; Xiong, H.; Selomulya, C.; Chen, X.D.; Huang, S.; Ruan, X.; Zhou, Q.; Sun, W. Effects of Spray Drying and Freeze Drying on the Properties of Protein Isolate from Rice Dreg Protein. Food Bioprocess Technol. 2013, 6, 1759–1769. [Google Scholar] [CrossRef]
- Burger, T.G.; Singh, I.; Mayfield, C.; Baumert, J.L.; Zhang, Y. The Impact of Spray Drying Conditions on the Physicochemical and Emulsification Properties of Pea Protein Isolate. LWT 2022, 153, 112495. [Google Scholar] [CrossRef]
- Hubbard, B.R.; Putman, L.I.; Techtmann, S.; Pearce, J.M. Open Source Vacuum Oven Design for Low-Temperature Drying: Performance Evaluation for Recycled PET and Biomass. JMMP 2021, 5, 52. [Google Scholar] [CrossRef]
- Nikbakht Nasrabadi, M.; Sedaghat Doost, A.; Mezzenga, R. Modification Approaches of Plant-Based Proteins to Improve Their Techno-Functionality and Use in Food Products. Food Hydrocoll. 2021, 118, 106789. [Google Scholar] [CrossRef]
- Ma, W.; Qi, B.; Sami, R.; Jiang, L.; Li, Y.; Wang, H. Conformational and Functional Properties of Soybean Proteins Produced by Extrusion-Hydrolysis Approach. Int. J. Anal. Chem. 2018, 2018, 9182508. [Google Scholar] [CrossRef]
- Zahari, I.; Ferawati, F.; Helstad, A.; Ahlström, C.; Östbring, K.; Rayner, M.; Purhagen, J.K. Development of High-Moisture Meat Analogues with Hemp and Soy Protein Using Extrusion Cooking. Foods 2020, 9, 772. [Google Scholar] [CrossRef]
- Carvalho, C.W.P.; Takeiti, C.Y.; Onwulata, C.I.; Pordesimo, L.O. Relative Effect of Particle Size on the Physical Properties of Corn Meal Extrudates: Effect of Particle Size on the Extrusion of Corn Meal. J. Food Eng. 2010, 98, 103–109. [Google Scholar] [CrossRef]
- Chen, Z.C.; Ikeda, K.; Murakami, T.; Takeda, T. Effect of Particle Packing on Extrusion Behavior of Pastes. J. Mater. Sci. 2000, 35, 5301–5307. [Google Scholar] [CrossRef]
- Tilman, D.; Clark, M. Global Diets Link Environmental Sustainability and Human Health. Nature 2014, 515, 518–522. [Google Scholar] [CrossRef] [PubMed]
- Kumar, P.; Chatli, M.K.; Mehta, N.; Singh, P.; Malav, O.P.; Verma, A.K. Meat Analogues: Health Promising Sustainable Meat Substitutes. Crit. Rev. Food Sci. Nutr. 2017, 57, 923–932. [Google Scholar] [CrossRef] [PubMed]
- Alexander, P.; Brown, C.; Arneth, A.; Finnigan, J.; Rounsevell, M.D.A. Human Appropriation of Land for Food: The Role of Diet. Glob. Environ. Chang. 2016, 41, 88–98. [Google Scholar] [CrossRef]
- Saranraj, P.; Sivasakthi, S. Spirulina Platensis—Food for Future: A Review. Asian J. Pharm. Sci. Technol. 2014, 4, 26–33. [Google Scholar]
- Food and Agriculture Organization of the United Nations FAOSTAT Crops and Livestock Products from Year 1994 to 2021. 2022. Available online: https://www.fao.org/ (accessed on 7 November 2022).
- Denkenberger, D.; Pearce, J. Feeding Everyone No Matter What: Managing Food Security after Global Catastrophe; Academic Press: Cambridge, MA, USA, 2014. [Google Scholar]
- Denkenberger, D.; Pearce, J. Feeding Everyone: Solving the Food Crisis in Event of Global Catastrophes That Kill Crops or Obscure the Sun. Futures 2015, 72, 57–68. [Google Scholar] [CrossRef]
- Baum, S.D.; Denkenberger, D.C.; Pearce, J.M.; Robock, A.; Winkler, R. Resilience to Global Food Supply Catastrophes. Env. Syst. Decis. 2015, 35, 301–313. [Google Scholar] [CrossRef]
- Franc-Dąbrowska, J.; Drejerska, N. Resilience in the Food Sector—Environmental, Social and Economic Perspectives in Crisis Situations. IFAM 2022, 25, 757–770. [Google Scholar] [CrossRef]
- Pham, A.; García Martínez, J.B.; Brynych, V.; Stormbjorne, R.; Pearce, J.M.; Denkenberger, D.C. Nutrition in Abrupt Sunlight Reduction Scenarios: Envisioning Feasible Balanced Diets on Resilient Foods. Nutrients 2022, 14, 492. [Google Scholar] [CrossRef]
- Munialo, C.; Vriesekoop, F. Plant-Based Foods as Meat and Fat Substitutes. Food Sci. Nutr. 2023, 11, 4898–4911. [Google Scholar] [CrossRef]
- Wang, Y.; Lyu, B.; Fu, H.; Li, J.; Ji, L.; Gong, H.; Zhang, R.; Liu, J.; Yu, H. The Development Process of Plant-Based Meat Alternatives: Raw Material Formulations and Processing Strategies. Food Res. Int. 2023, 13, 112689. [Google Scholar] [CrossRef] [PubMed]
- Global Meat Consumption by Type. Available online: https://www.statista.com/statistics/274522/global-per-capita-consumption-of-meat/ (accessed on 23 January 2024).
- Singh, R.K.; Deshpande, D. Thermally Induced Changes in Quality of Chicken Breast Meat Protein Fractions. J. Nutr. Food Sci. 2018, 8, 4. [Google Scholar] [CrossRef]
- Jiang, J.; Zhang, M.; Bhandari, B.; Cao, P. Development of Chinese Yam/Chicken Semi-Liquid Paste for Space Foods. LWT 2020, 125, 109251. [Google Scholar] [CrossRef]
- Dick, A.; Dong, X.; Bhandari, B.; Prakash, S. The Role of Hydrocolloids on the 3D Printability of Meat Products. Food Hydrocoll. 2021, 119, 106879. [Google Scholar] [CrossRef]
- Cho, H.-R.; Chang, D.-S.; Lee, W.-D.; Jeong, E.-T.; Lee, E.-W. Utilization of Chitosan Hydrolysate as a Natural Food Preservative for Fish Meat Paste Products. Korean J. Food Sci. Technol. 1998, 30, 817–822. [Google Scholar]
- Mantihal, S.; Kobun, R.; Lee, B.-B. 3D Food Printing of as the New Way of Preparing Food: A Review. Int. J. Gastron. Food Sci. 2020, 22, 100260. [Google Scholar] [CrossRef]
- Baiano, A. 3D Printed Foods: A Comprehensive Review on Technologies, Nutritional Value, Safety, Consumer Attitude, Regulatory Framework, and Economic and Sustainability Issues. Food Rev. Int. 2022, 38, 986–1016. [Google Scholar] [CrossRef]
- Wang, T.; Kaur, L.; Furuhata, Y.; Aoyama, H.; Singh, J. 3D Printing of Textured Soft Hybrid Meat Analogues. Foods 2022, 11, 478. [Google Scholar] [CrossRef]
- Grossmann, L.; McClements, D.J. Current Insights into Protein Solubility: A Review of Its Importance for Alternative Proteins. Food Hydrocoll. 2023, 137, 108416. [Google Scholar] [CrossRef]

| Protein | Protein/Mass g/kg | Purchase Cost USD/kg | Protein Cost USD/kg | Sources |
|---|---|---|---|---|
| Boneless/Skinless Chicken Breast | 310 | 6.28 | 0.0203 | [31,32] |
| Beef Patties | 230 | 13.69 | 0.0595 | [33,34] |
| Pasture Raised Pork Shoulder | 231 | 19.93 | 0.0863 | [35,36] |
| Ground Lamb | 166 | 15.71 | 0.0946 | [37,38] |
| Alibaba Wholesale Spirulina Isolate Powder | 600 | 8.50 | 0.0142 | [39] |
| Spirulina Powder | 667 | 95.29 | 0.143 | [40,41] |
| Retail Spirulina Powder | 667 1 | 99.98 | 0.150 | [40,42] |
| Soybeans | 433 | 0.52 | 0.00120 | [43,44] |
| Alibaba Wholesale Soy Protein Isolate Powder | 900 | 3.25 | 0.00361 | [45] |
| Bulk Food Store Wholesale Soy Protein Isolate Powder | 900 | 20.68 | 0.0230 | [46] |
| Retail Soy Protein Isolate Powder | 833 | 25.66 | 0.0308 | [47] |
| Green Pea | 54.2 | 0.31 | 0.00572 | [48,49] |
| Alibaba Wholesale Pea Protein Isolate Powder | 800 | 3.00 | 0.00375 | [50] |
| Bulk Food Store Wholesale Pea Protein Isolate Powder | 800 | 20.68 | 0.0259 | [51] |
| Retail Pea Protein Isolate Powder | 727 | 45.19 | 0.0622 | [52] |
| Crude Rice Bran | 134 | 0.18 | 0.00134 | [53,54] |
| Alibaba Wholesale Brown Rice Protein Isolate Powder | 850 | 2.50 | 0.00294 | [55] |
| Bulk Food Store Wholesale Brown Rice Protein Isolate Powder | 785 | 17.34 | 0.0221 | [56] |
| Retail Brown Rice Protein Isolate Powder | 809 | 43.21 | 0.0534 | [57] |
| Protein | Composition A (% Water) | Composition B (% Water) |
|---|---|---|
| Spirulina | 65.5 | 71.9 |
| Soy | 78.5 | 83.9 |
| Pea | 78.6 | 81.1 |
| Brown Rice | 69.1 | 58.9 |
| Protein | Density (g/cm3) |
|---|---|
| Spirulina | 0.49 |
| Soy | 0.68 |
| Pea | 0.76 |
| Brown Rice | 0.54 |
| Protein | Mean Area (µm2) | Mean Diameter (µm) | Literature Diameter Values (µm) |
|---|---|---|---|
| Spirulina | 28 | 6.0 | <125 [62] |
| Soy | 3.8 | 2.2 | 0.1–100 [63] |
| Pea | 6.6 | 2.9 | 1.7–270 [64] |
| Brown Rice | 340 | 21 | 23–150 [65] |
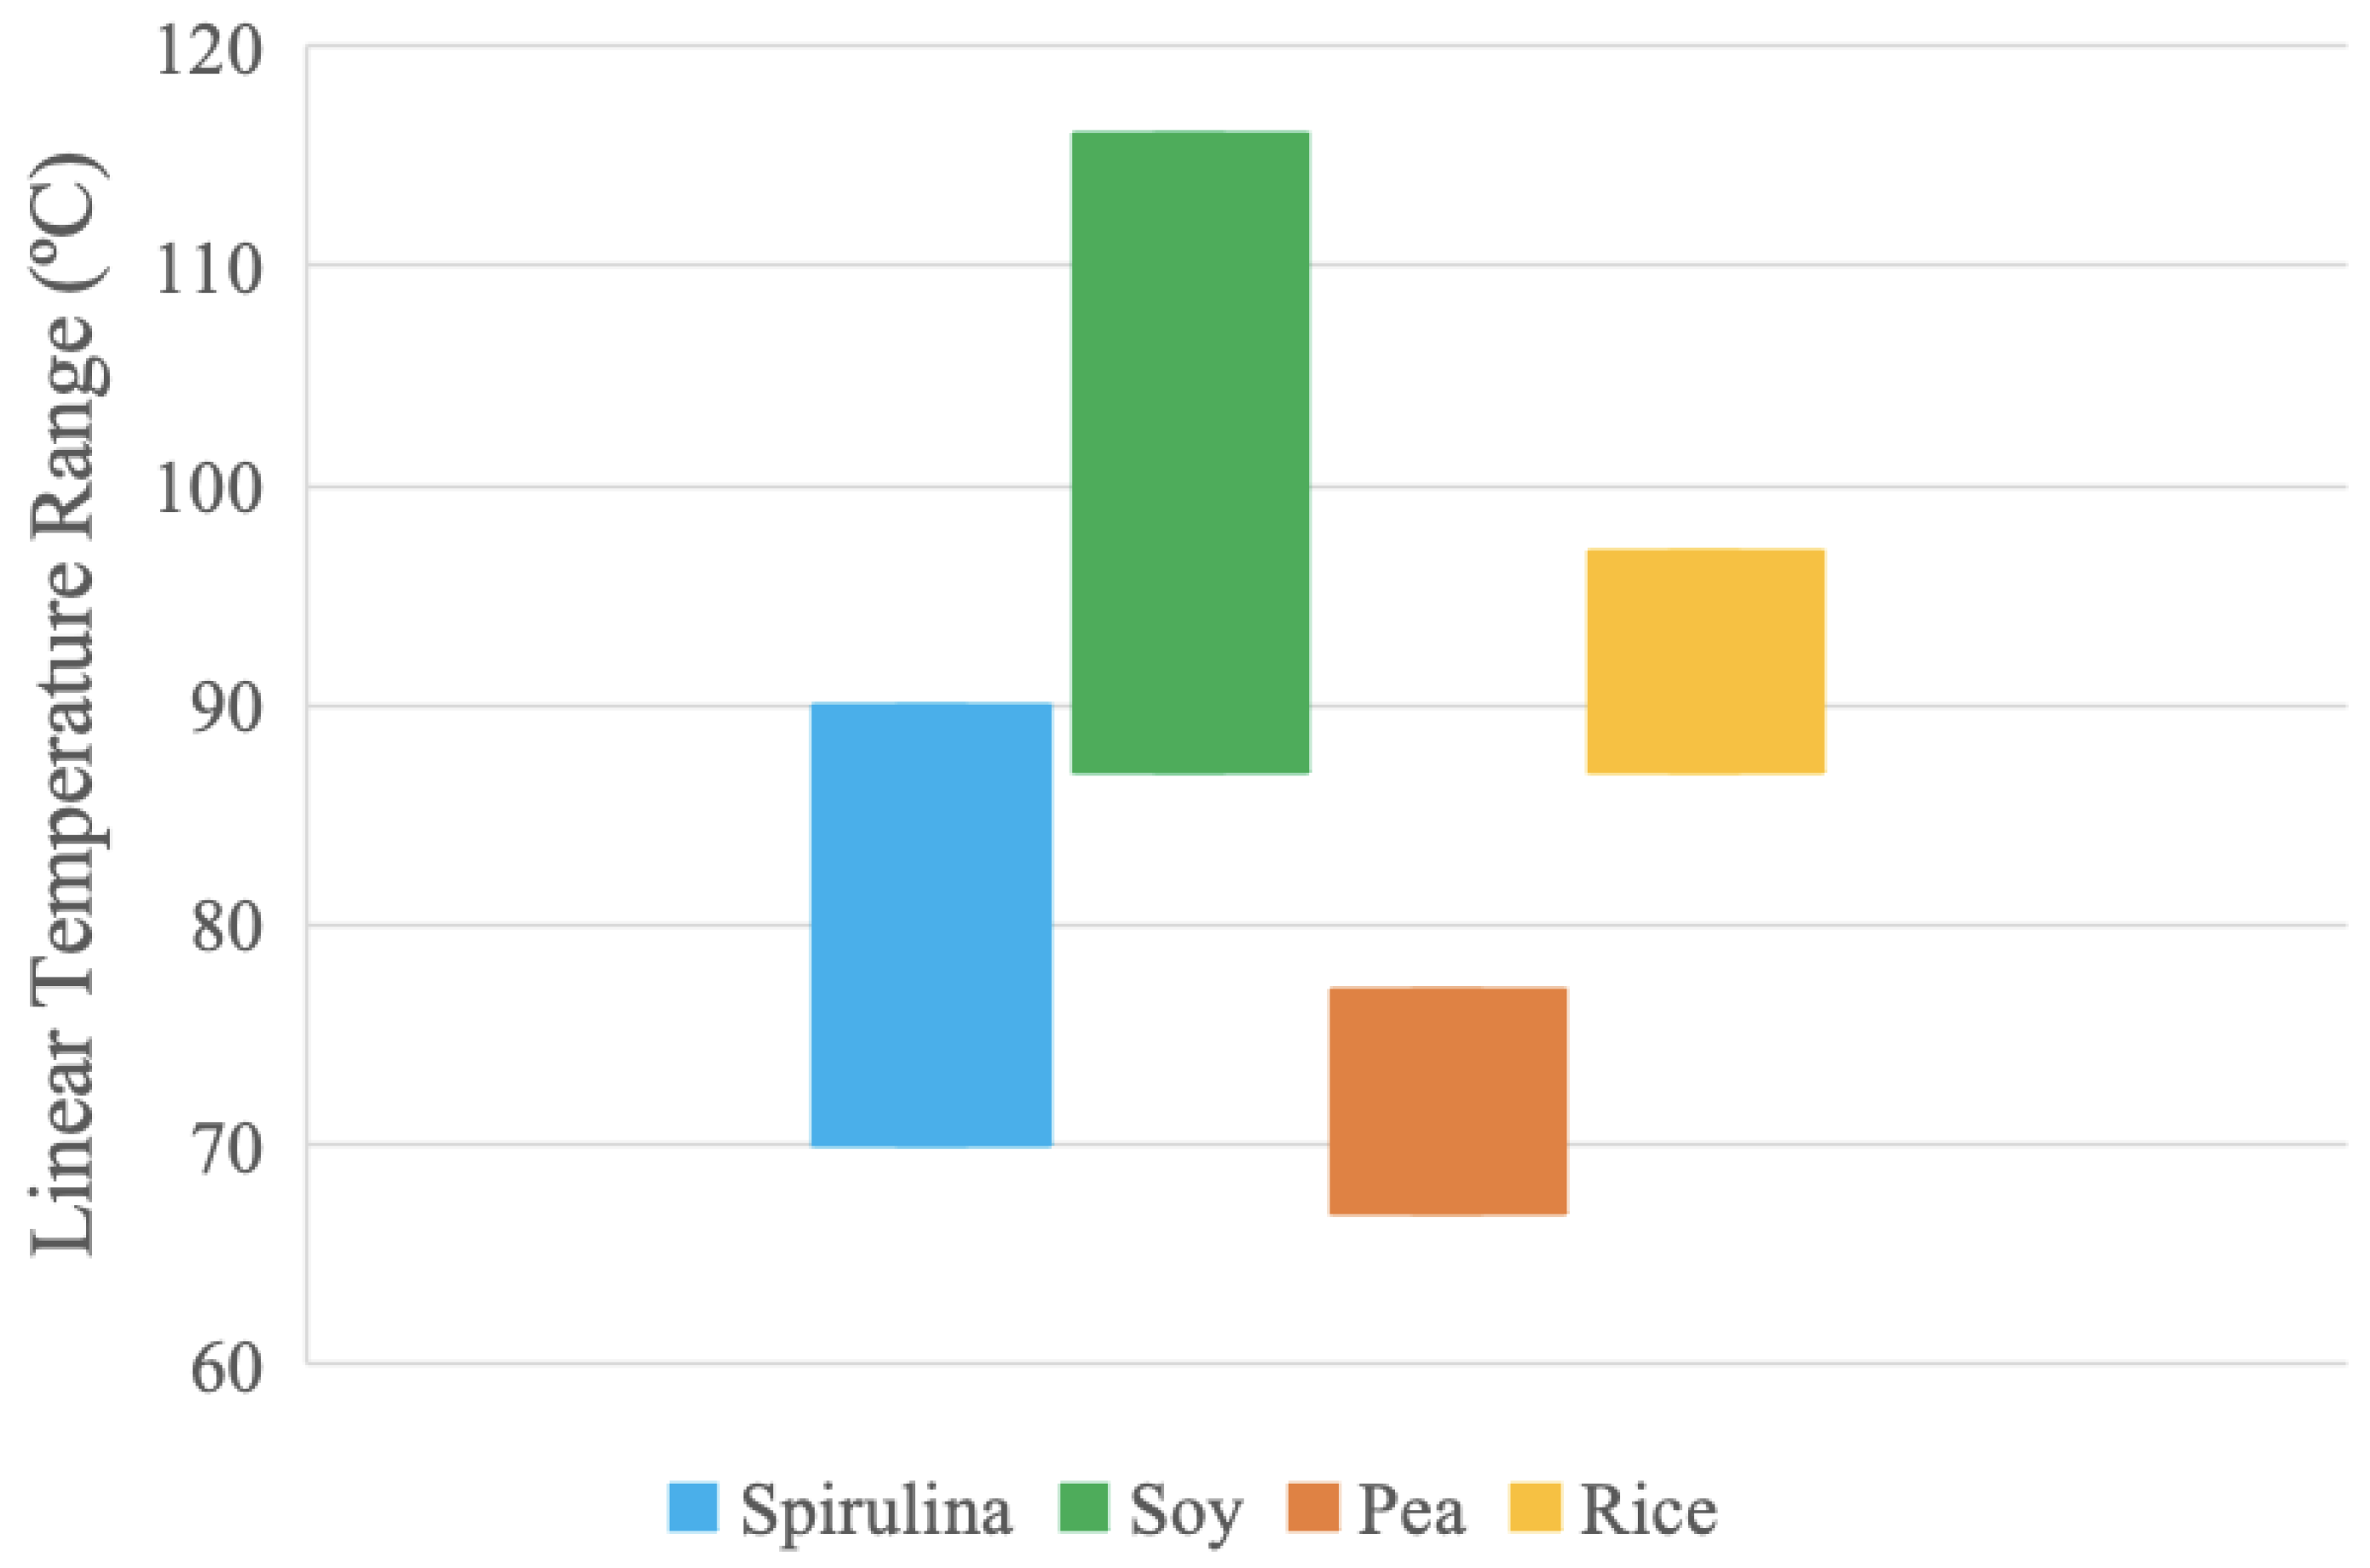
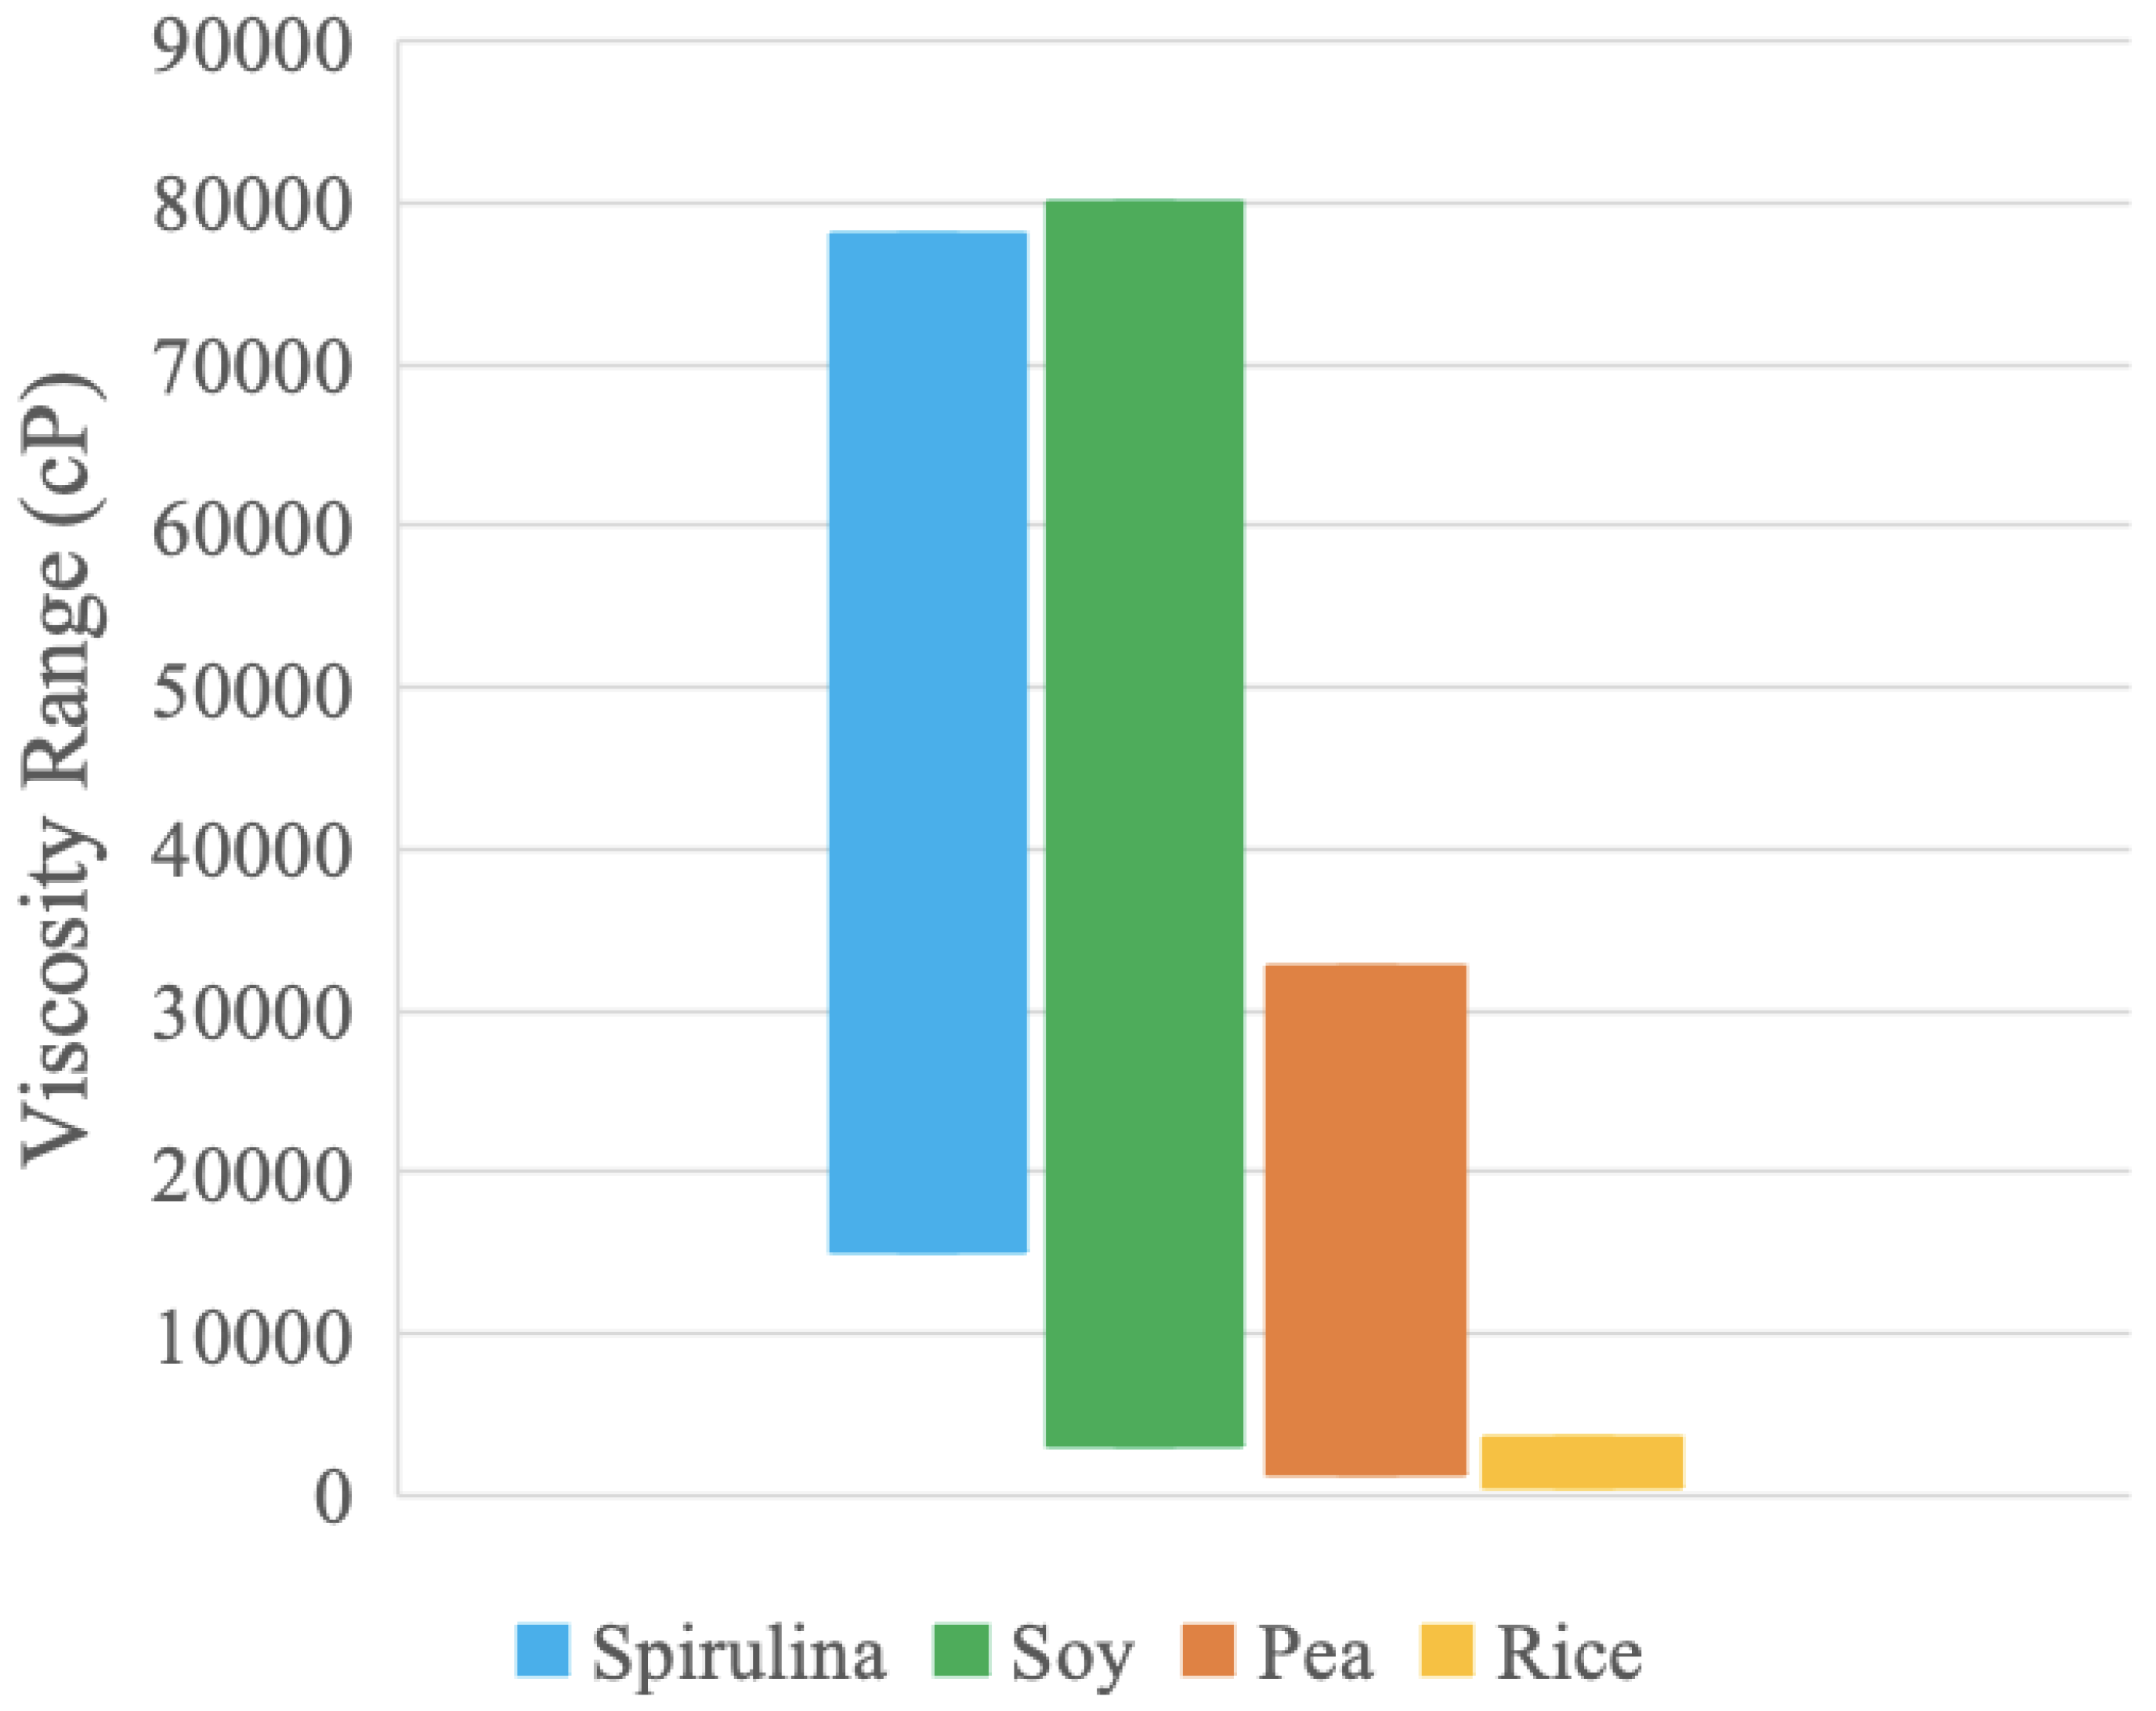
| Protein | 100% Powder Sample Linear Temperature Range (°C) | Viscosity Range (cP) | Wholesale Retail Purchase Cost (USD/g protein) (Table 1) |
|---|---|---|---|
| Spirulina | 70–90 | 15,100–78,000 | 0.0142 |
| Soy | 87–116 | 3200–80,000 | 0.00361 |
| Pea | 67–77 | 1400–32,700 | 0.00375 |
| Brown Rice | 87–97 | 600–3500 | 0.00294 |
Disclaimer/Publisher’s Note: The statements, opinions and data contained in all publications are solely those of the individual author(s) and contributor(s) and not of MDPI and/or the editor(s). MDPI and/or the editor(s) disclaim responsibility for any injury to people or property resulting from any ideas, methods, instructions or products referred to in the content. |
© 2024 by the authors. Licensee MDPI, Basel, Switzerland. This article is an open access article distributed under the terms and conditions of the Creative Commons Attribution (CC BY) license (https://creativecommons.org/licenses/by/4.0/).
Share and Cite
Burghardt, K.; Craven, T.; Sardar, N.A.; Pearce, J.M. Towards Sustainable Protein Sources: The Thermal and Rheological Properties of Alternative Proteins. Foods 2024, 13, 448. https://doi.org/10.3390/foods13030448
Burghardt K, Craven T, Sardar NA, Pearce JM. Towards Sustainable Protein Sources: The Thermal and Rheological Properties of Alternative Proteins. Foods. 2024; 13(3):448. https://doi.org/10.3390/foods13030448
Chicago/Turabian StyleBurghardt, Kaitlyn, Tierney Craven, Nabil A. Sardar, and Joshua M. Pearce. 2024. "Towards Sustainable Protein Sources: The Thermal and Rheological Properties of Alternative Proteins" Foods 13, no. 3: 448. https://doi.org/10.3390/foods13030448
APA StyleBurghardt, K., Craven, T., Sardar, N. A., & Pearce, J. M. (2024). Towards Sustainable Protein Sources: The Thermal and Rheological Properties of Alternative Proteins. Foods, 13(3), 448. https://doi.org/10.3390/foods13030448