Article

Magnetic Resonance Imaging (MRI) of Spanish Sheep Cheese: A Study on the Relationships between Ripening Times, Geographical Origins, Textural Parameters, and MRI Parameters

by
José Segura
1,*,
María Encarnación Fernández-Valle
2,
Karen Paola Cruz-Díaz
1,
María Dolores Romero-de-Ávila
1,
David Castejón
2,
Víctor Remiro
1 and
María Isabel Cambero
1
1
Food Technology Department, Faculty of Veterinary Medicine, Complutense University of Madrid, 28040 Madrid, Spain
2
ICTS Complutense Bioimaging (BioImac), Research Assistance Centre, Complutense University of Madrid, 28040 Madrid, Spain
*
Author to whom correspondence should be addressed.
Foods 2024, 13(20), 3225; https://doi.org/10.3390/foods13203225
Submission received: 11 July 2024 / Revised: 29 September 2024 / Accepted: 8 October 2024 / Published: 10 October 2024
(This article belongs to the Special Issue Recent Advances in Cheese and Fermented Milk Production)

Abstract

The evolution of structural changes and the textural features during the ripening process of four varieties of Spanish sheep cheese were studied using Magnetic Resonance Imaging (MRI). Specifically, longitudinal (T1) and transverse (T2) relaxation times and apparent diffusion coefficient maps were analyzed. Also, proton density was used to improve the description of the structure of the cheeses. The MRI results displayed important information about cheese matrix structure, associated with different manufacturing processes (industrial vs. traditional), ripening times (RTs, from 2 to 180 days), and geographical origins. A significant interaction between RT and cheese variety related to the variations in physicochemical and textural parameters was found. Linear regression models were developed per the abundant literature. Logarithmic regression models showed the highest R2 when monitoring the dependency on T1 and T2 parameters of water content, water activity, RT, and some texture parameters. Therefore, these results support that MRI is a useful technology to monitor the ripening process, predict textural behavior and physicochemical variables, and characterize the structure of different varieties of sheep cheese.

Graphical Abstract

1. Introduction

A variety of ewe milk cheeses are produced in the Mediterranean area of Europe, including hard and semi-hard cheeses using animal rennet as a coagulant, and they are widely accepted because of their highly desirable sensory qualities. These characteristics include aromas and flavors developed during the ripening process from milk fat, proteins, and carbohydrates [1]. For instance, several cheese varieties are manufactured in Spain.
More specifically, in the north-western (Castilla y León, CL) and central (Castilla-La Mancha, CLM) regions of Spain, several types of semi-hard sheep cheese are made with similar external appearance and close manufacturing technology. Typically, the manufacturing of such varieties uses enzymatic coagulation and, in most cases, the addition of mesophilic starter cultures (generally, strains of Lactococcus lactis ssp. Lactis and Lactococcus lactis ssp. Cremoris). Following this, the curd undergoes a compression process and, eventually, an aging period [2].
In both the CL and CLM regions, the cheese is either traditionally (artisanal) or industrially produced. Traditional (T) cheese is manufactured from raw milk in local cheeseries. In contrast, industrial (I) cheese is made either with raw or pasteurized milk at a factory level, thus implying strictly controlled manufacturing conditions. In general, bovine rennet is used for ewe’s milk cheese (EMC) in the CLM region, whereas ovine rennet is used in the CL one (Table S1).
Manchego, with Protected Designation of Origin (PDO) [3], one of the most popular and exported types of Spanish cheese, is manufactured in the CLM region exclusively from Manchega breed ewe milk. On the contrary, the most known EMC from the CL region is Castellano cheese, which is made from ewe milk of Churra and Castellana breeds [4,5,6].
Desirable textural properties are crucial for consumer acceptance and contribute to the characterization and identification of the type of cheese. Traditionally, cheese texture has been evaluated by sensory and destructive instrumental methods [7].
Magnetic Resonance Imaging (MRI) is a non-invasive and non-destructive technique that provides structural information on biological matrices [8]. The use of MRI generates images of the macroscopic structure. It also allows the quantification of magnetic resonance parameters, such as spin–lattice (T1) and spin–spin (T2) relaxation times, and the apparent diffusion coefficient (ADC) [9]. These parameters are potentially sensitive to local variations in water proton mobility resulting mainly from modification of water–macromolecule interactions and changes in the matrix structure [10]. The study of T1 and/or T2 can be used to assess food microstructure [11,12]. T1 and T2 calculations must be carried out by fitting the signal curves derived from the nuclear magnetic resonance (NMR) experiment to appropriate exponential equations. In the simplest case, these equations might depend on a single relaxation time, thus the fitting results in one T1 or T2 for the whole sample or Region of Interest (ROI) [9]. However, many food matrices are complex systems, thus implying a dependence of the observed NMR and MRI signal(s) on a mixture of relaxation time values, coming from different structures and chemical compounds. Therefore, it is possible to fit the curves to equations that depend on two or more exponential factors; furthermore, it is possible to obtain a continuous distribution of relaxation times utilizing Inverse Laplace Transformation [13]. Remarkably, these valuable data could be collected in real time, as current portable and cost-effective instruments on the market already exist to improve in-line product monitoring [10,11]. In addition, the monoexponential approach would give mean values that can be easily related to physicochemical and textural properties associated with food microstructure.
In the present study, cheese varieties from two geographical locations (CLM and CL) manufactured with two different procedures (T and I) were considered. This study aimed to monitor the structural changes in four cheese varieties during ripening time (RT) by MRI and to evaluate the potential of this technique as a tool to estimate physicochemical and textural properties.
Considering the stated purpose and simple approach, the monoexponential values of T1, T2, and ADC were obtained to relate the microstructure with the rheological behavior and to obtain an MRI map to monitor the macrostructure changes with RT. Proton density was used to analyze the hole index of the cheese matrixes.
Although advances are needed in the development of low-field equipment more suitable for the industry, the present work is a first attempt to increase the applicability of NMR to the quality control of cheese at the industrial level.

2. Materials and Methods

2.1. Experimental Design and Sample Collection

The following Spanish sheep cheese samples were categorized in this study: EMC produced industrially originating from CLM (I-CLM) or CL (I-CL), and EMC produced traditionally originating from CLM (T-CLM) or CL (T-CL). The I-CLM samples were produced in an industrial facility according to the procedure described for PDO Manchego cheese [3,14] and using pasteurized milk and recombinant Chymosin for coagulation, whereas T-CLM ones were manufactured from raw milk by a small cheesery according to an artisanal/traditional procedure using calf commercial dried rennet for enzymatic coagulation. Similarly, I-CL was produced in a large industrial facility, according to the “Castellano cheese” quality mark [4], and T-CL followed a traditional manufacturer procedure. I-CL and T-CL were made from raw milk. Recombinant Chymosin was used for the I-CL elaboration, whereas T-CL was manufactured using lamb commercial natural rennet. Homo-fermentative mesophilic LABS, as a starter culture, was added to the production of the four varieties. The processing conditions are shown in Table S1.
Molds with a 19–20.5 cm diameter and a 14–15.5 cm height were used. Weights varied from 3.7 to 4.3 kg in fresh cheese and 3.0 to 3.5 kg at the end of ripening. Once the pieces were removed from the molds, they were salted and, finally, subjected to a period of maturation (up to 180 d). Twenty-five cheese samples from each EMC variety were analyzed throughout the ripening process at 2, 9, 30, 90, and 180 d after production (five different samples from each variety were analyzed at each sampling time). A separation distance of 2 cm from both the outer perimeter and the center was maintained for sampling (Figure S1).

2.2. Physicochemical Analysis

aw was measured using a Decagon CX1 hygrometer (Decagon Devices Inc., Pullman, WA, USA) at 25 °C. The pH was determined in a homogenate of the sample with distilled water (1:10 w/v), using a Digit-501 pH meter (Crison Instruments LTD, Barcelona, Spain). The protein and dry matter (DM) contents were determined using the methods of AOAC (2005) [15]. The fat content was determined using the method described by Hanson and Olley [16]. Water content (WC) was established as 100 DM.

2.3. Textural Analysis

Texture profile analysis (TPA) was performed at 25 °C using a TAXT2i SMS Stable Micro Systems Texture Analyzer (Stable Microsystems Ltd., Godalming, UK) with the Texture Expert program. A double compression cycle test was performed of up to 50% compression of the original portion height in cylinders (1 cm high × 1.5 cm wide) sampled with an aluminum cylinder probe P/25. A time of 5 s was allowed to elapse between the two compression cycles. Force–time deformation curves were obtained with a 30 kg load cell applied at a crosshead speed of 2 mm/s. TPA parameters were calculated according to Romero de Ávila et al. [17].

2.4. Magnetic Resonance Imaging Analyses

The MRI experiments were performed in a Bruker BIOSPEC 47/40 spectrometer (Bruker GmBH, Ettlingen, Germany) operating at 4.7 T equipped with a 6 cm inner-diameter gradient system at 18 °C. Two portions of each cheese (50 ± 2 g) were sampled (Figure S1) at each RT. Each sample was cut 4 cm long, 3 cm wide, and 0–1.5 cm thick. Then, the samples were placed in a 3.5 cm inner-diameter volume radiofrequency coil.
For measurements of T2 values, a multi-echo Carr–Purcell–Meiboom–Gill (CPMG) spin-echo sequence was used (60 echo series generated). In every phase step, each echo was used to obtain an image with a different echo time (TE). The TE varied from 5 ms to 300 ms. This TE interval was used to cover a wide range of T2 and to ensure the complete fall of the echo train signal. Other imaging parameters were repetition time (TR) = 5300 ms; number of averaged experiments (NAs) = 2; field of view (FOV) = 7 × 3.5 cm2; slice thickness = 1 mm; number of slices = 1; and matrix size = 256 × 128.
For T1 calculation, a spin-echo sequence with variable TR was considered. A series of twelve spin-echo images were acquired with logarithmically spaced TR (52.5–6002.5 ms) and constant TE (5 ms). The geometrical imaging parameters used were the same as those used for the T2 calculation.
To measure ADC, a series of spin-echo images was acquired at six diffusion weightings. The diffusion gradient duration (δ) was 10 ms and the time between gradients (Δ) was 40 ms. The gradient strengths varied from 5 to 450 mT/m for the first RT (2, 9, and 30 d), so the b-factor varied from 6.56 to 53,139.33 s/mm2. The maximum gradient strength was increased to 750 mT/m to measure the low ADC of the last RT (90 and 180 d), with the b-factor used being 147,609.25 s/mm2. The geometrical imaging parameters used were the same as those used for the T2 calculation.
For the calculation of the parametric maps and their analysis, the ImageJ 1.52a (Wayne Rasband, NIH, Bethesda, MD, USA) software was used. The MRI Analysis Calculator plugin by Karl Schmidt was used to calculate T2, T1, and ADC quantitative maps. The signals were fitted according to the equations described by Herrero et al. [9] but, previously, the pixels of the spin-echo images where the signal was under a certain threshold (similar signal to the background one) were considered as holes filled with air. The image signal of these areas was set to 0, so the T2, T1, and ADC calculation algorithms resulted in NaN (not a number) and, therefore, were excluded from the mean value calculations. After that, five ROIs were defined for each sample and the mean and the standard deviation (SD) of each parameter were calculated for each ROI. These ROIs were carefully chosen to avoid the sample edges or areas with artifacts.
For the hole index calculation, proton density (PD) images (TR/TE = 5300/5 ms, spin-echo sequence) were used, i.e., the first echo of the multi-echo series used for the T2 calculation. In these images, pixels with a signal under a certain threshold (similar signal to the background signal) were considered holes filled with air and set to 0. The number of pixels with a signal value set to 0 was compared to the total number of sample pixels.

2.5. Statistical Analysis

Statistical analyses were conducted using SAS 9.4 [18]. The effects of the cheese varieties (four levels: I-CL, T-CL, I-CLM, and T-CLM; two geographical origins: CLM and CL; and two manufacturing procedures: I and T) and the RT (five levels: 2, 9, 30, 90, and 180 d) on the physicochemical, MRI, and textural parameters were analyzed as a factorial experimental design (2 × 2 × 5). The physicochemical determinations were carried out in triplicate. The Shapiro–Wilk test was applied to check data normal distribution fitting. Two-way ANOVA analysis was used to determine the simultaneous effects produced by variables and Duncan’s test was performed for multiple mean comparisons. Data were reported as the mean and the SD of each EMC and the root mean square error (RMSE) and p-value defined the statistical analysis.
Linear and non-linear regression models were performed to determine the relationships between MRI parameters and RT, WC, aw, and TPA parameters, including the natural logarithm of the physicochemical and textural parameters and the MRI values as shown in the following expression: ln Y = β 0 + β 1 ln X 1 + β 2 ln X 2 + β 12 ln X 1 ln X 2 , where In Y is the predicted response (natural logarithm of the estimated variable), and β1, β2, and β12 are the coefficients estimated from regression and represent the linear and cross-product effects of ln X1 and ln X2 (MRI parameters: T1 and T2) on the response.
Variables were selected in the multivariate model using the backward (stepwise) elimination procedure [19]. A significance level of p < 0.05 was applied for variable retention. The accuracy of prediction was evaluated in terms of the coefficient of determination (R2) and RMSE.
Because EMCs are heterogeneous products at a macroscopic scale, three samples of each cheese were taken from various locations for physicochemical analysis. In the case of the TPA parameter determination, six samples were taken from each half of the cheese. However, two samples from a different part of each cheese were considered for MRI studies (Figure S1).

3. Results and Discussion

3.1. Physicochemical Parameters

The statistical analyses of the effect of the EMC variety and RT on the physicochemical characteristics (Table S2) are shown in Table 1. EMC (p < 0.0001) and RT (p < 0.0001) affected the pH. On average, CLM and I-EMC varieties had a higher pH of 0.21 units compared to CL and T-EMC, respectively (Table S2). A statistically significant triple interaction (p < 0.0001) between RT and EMC varieties was found (Table 1). Similar values were observed after 30 d of ripening for T-CLM and T-CL, whereas 7.0% and 2.3% decreases in pH values during the first week were detected for T-CLM and T-CL, respectively. I-CLM and I-CL did not show clear differences (Table 1 and Table S2). These pH values agreed with those of prior studies for Manchego cheese [20,21]. Accordingly, Ferrazza Fresno et al. [22] reported similar pH values for EMC from the same geographical origin. Medina and Núñez [1] reported that, in EMC, pH decreased in the artisanal cheeses within 24 h after manufacturing, whereas in pasteurized milk cheeses, a decrease in pH occurred during the first week. In CL cheeses, made from raw milk, the drop in pH values would have occurred before the first sampling (2 d). Medina and Núñez [1] also stated that, since lactic acid production and pH values are directly related, a high dependence could be expected on both the present bacterial microbiota and the temperature control during manufacturing and ripening, both influencing the lactose hydrolysis rate. Regarding aw, values decreased along with ripening (p < 0.0001). A significant interaction was found between EMC varieties and RT (p < 0.0001, Table 1). The EMC from CL showed a higher decrease in aw than those from CLM (6.9% vs. 4.0%, respectively) (Table S2). Again, the obtained results agreed with previous data for a similar type of EMC [22,23]. Values of WC decreased as the RT progressed (p < 0.0001), although the decrease rate was higher in the I-EMC (31.8%) compared to T-EMC (21.8%) (p < 0.0001; Table 1 and Table S2). A progressive water loss during the RT is a well-known process and is directly dependent on the proteolysis rate and, indirectly, on the pH changes and/or the bacterial microbiota [24]. In this case, the use of recombinant Chymosin rennet might imply both quicker milk coagulation and higher proteolysis, thus explaining I-EMC behavior. Lower fat content was detected in I-CLM compared to the others (51.4% vs. 54.2%, respectively; p < 0.0001 for EMC effect) but no statistically significant changes were detected with RT. Protein content was characterized by a statistically significant interaction between RT and type of manufacture (I or T). T-EMC showed an increase of 9.7% while I-EMC showed an increase of 3.7% (Table 1 and Table S2). These findings agreed with the data reported by Revilla et al. [25].

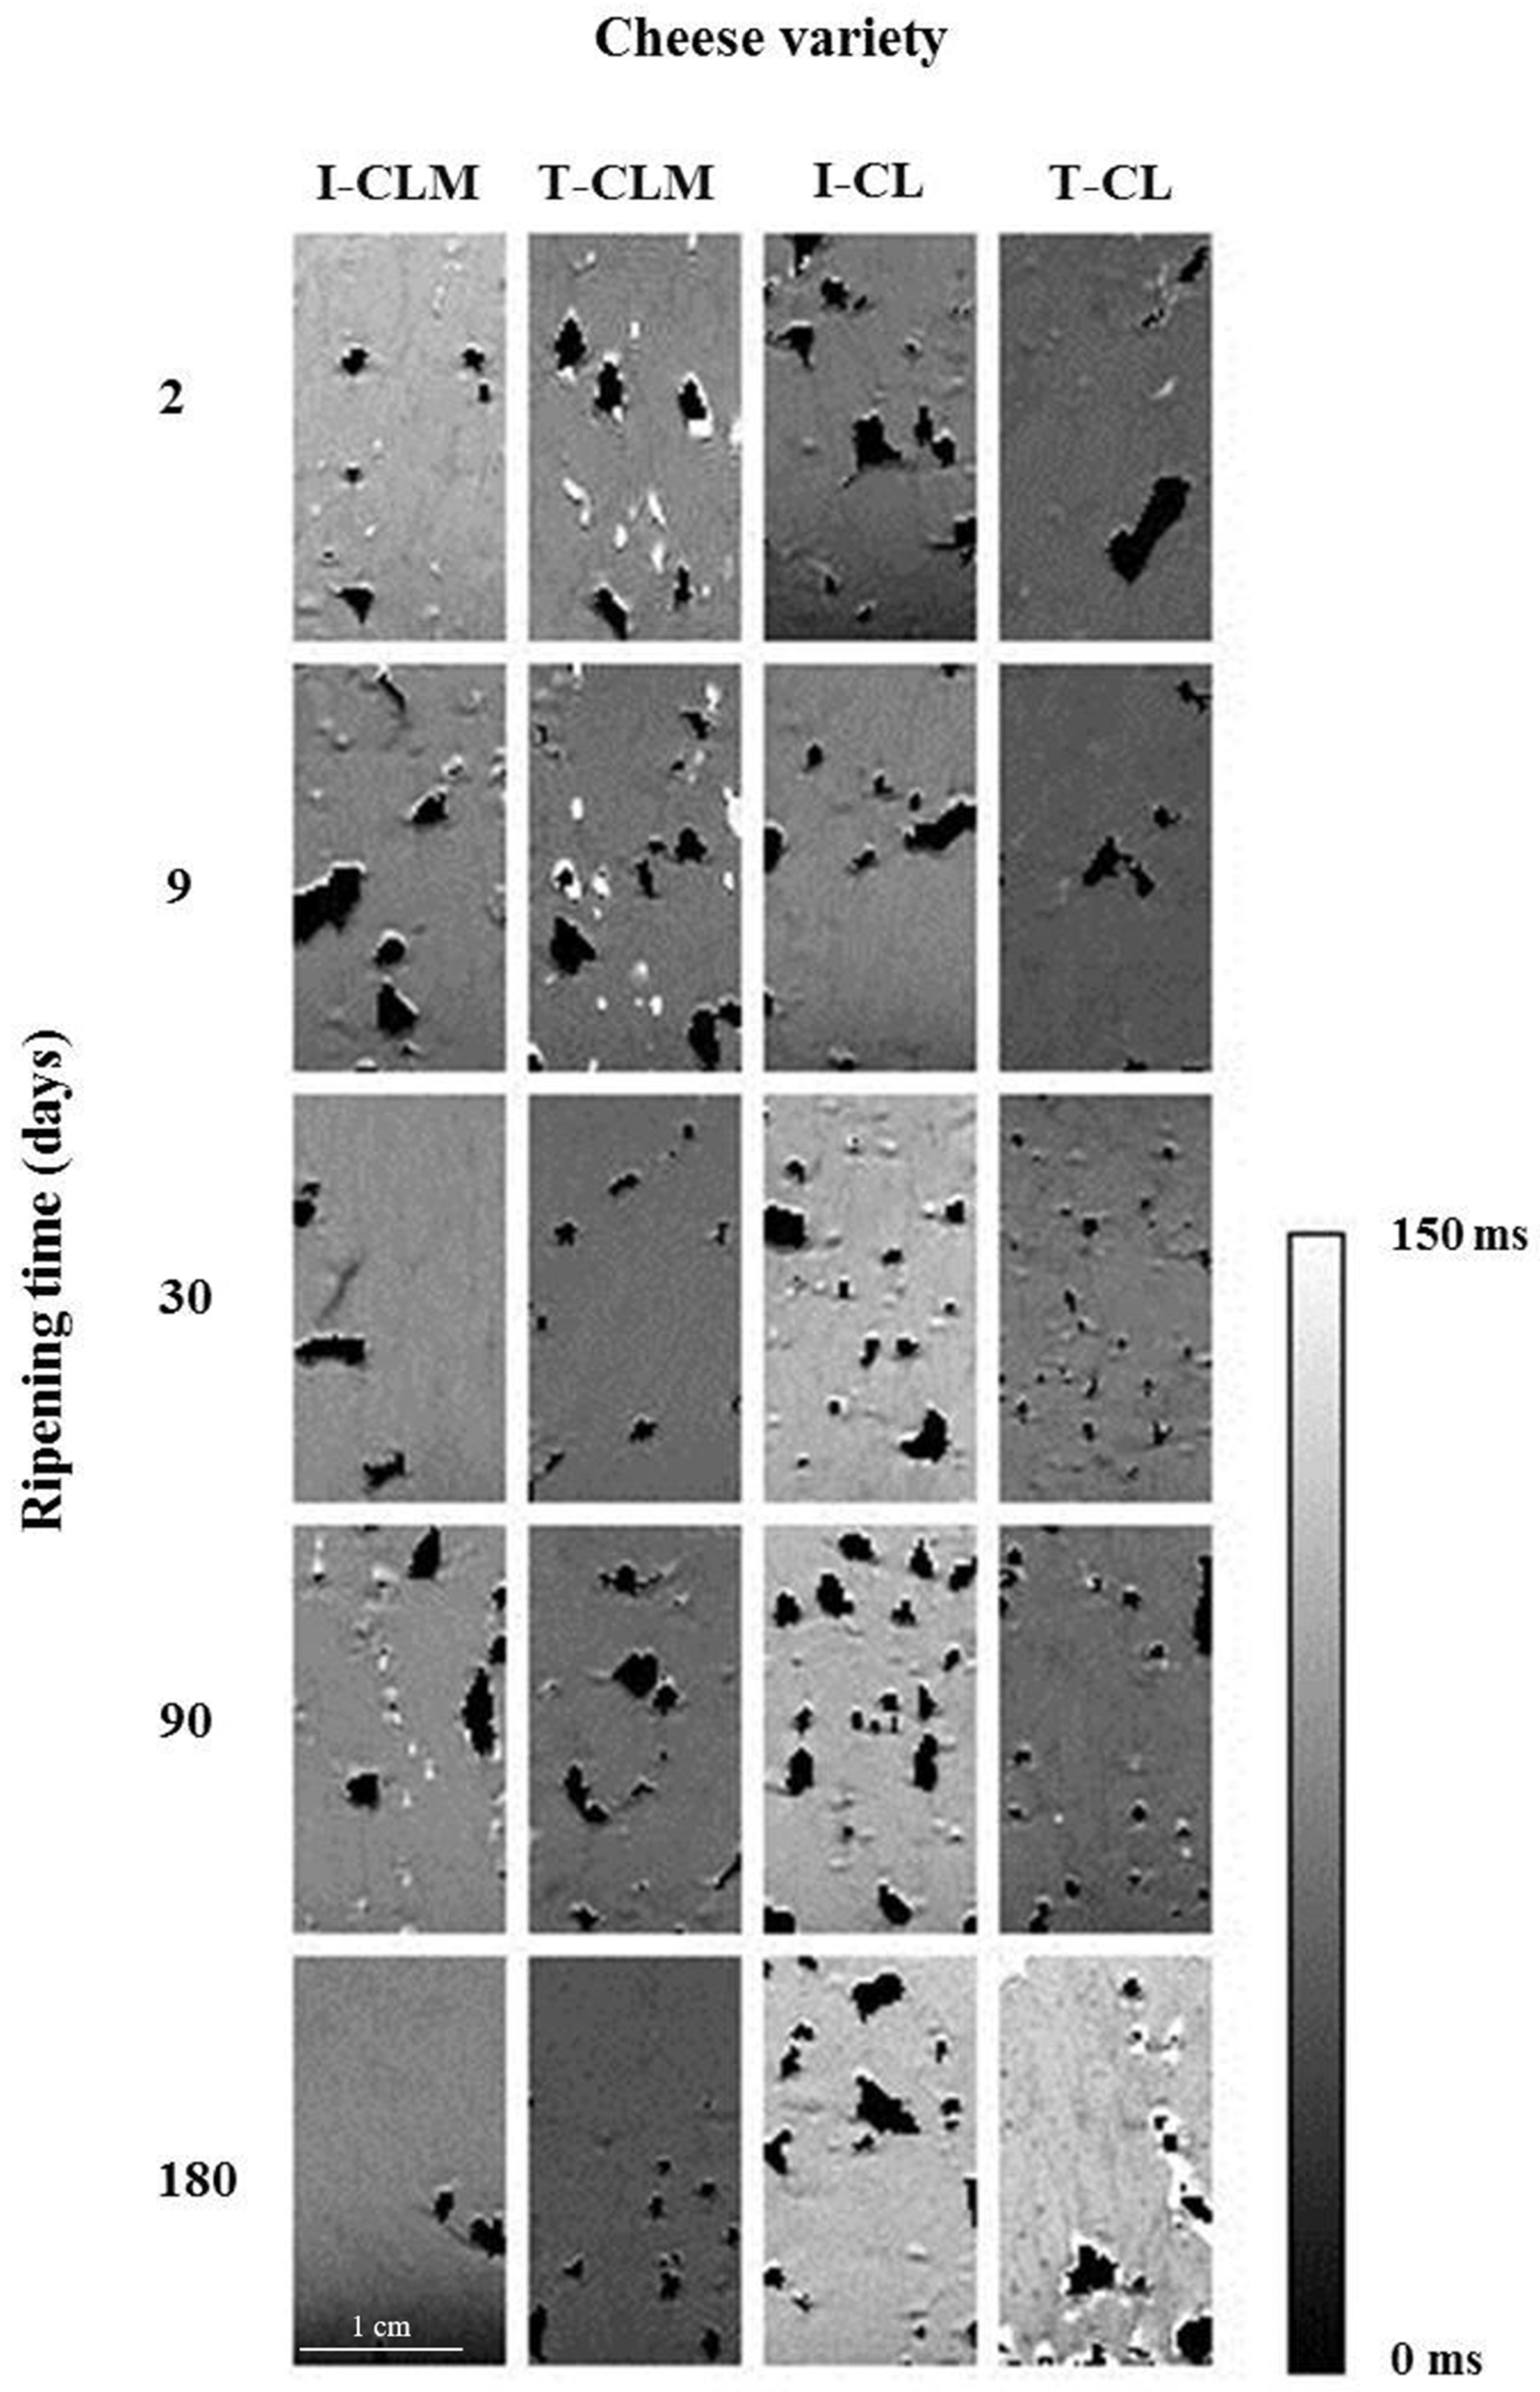
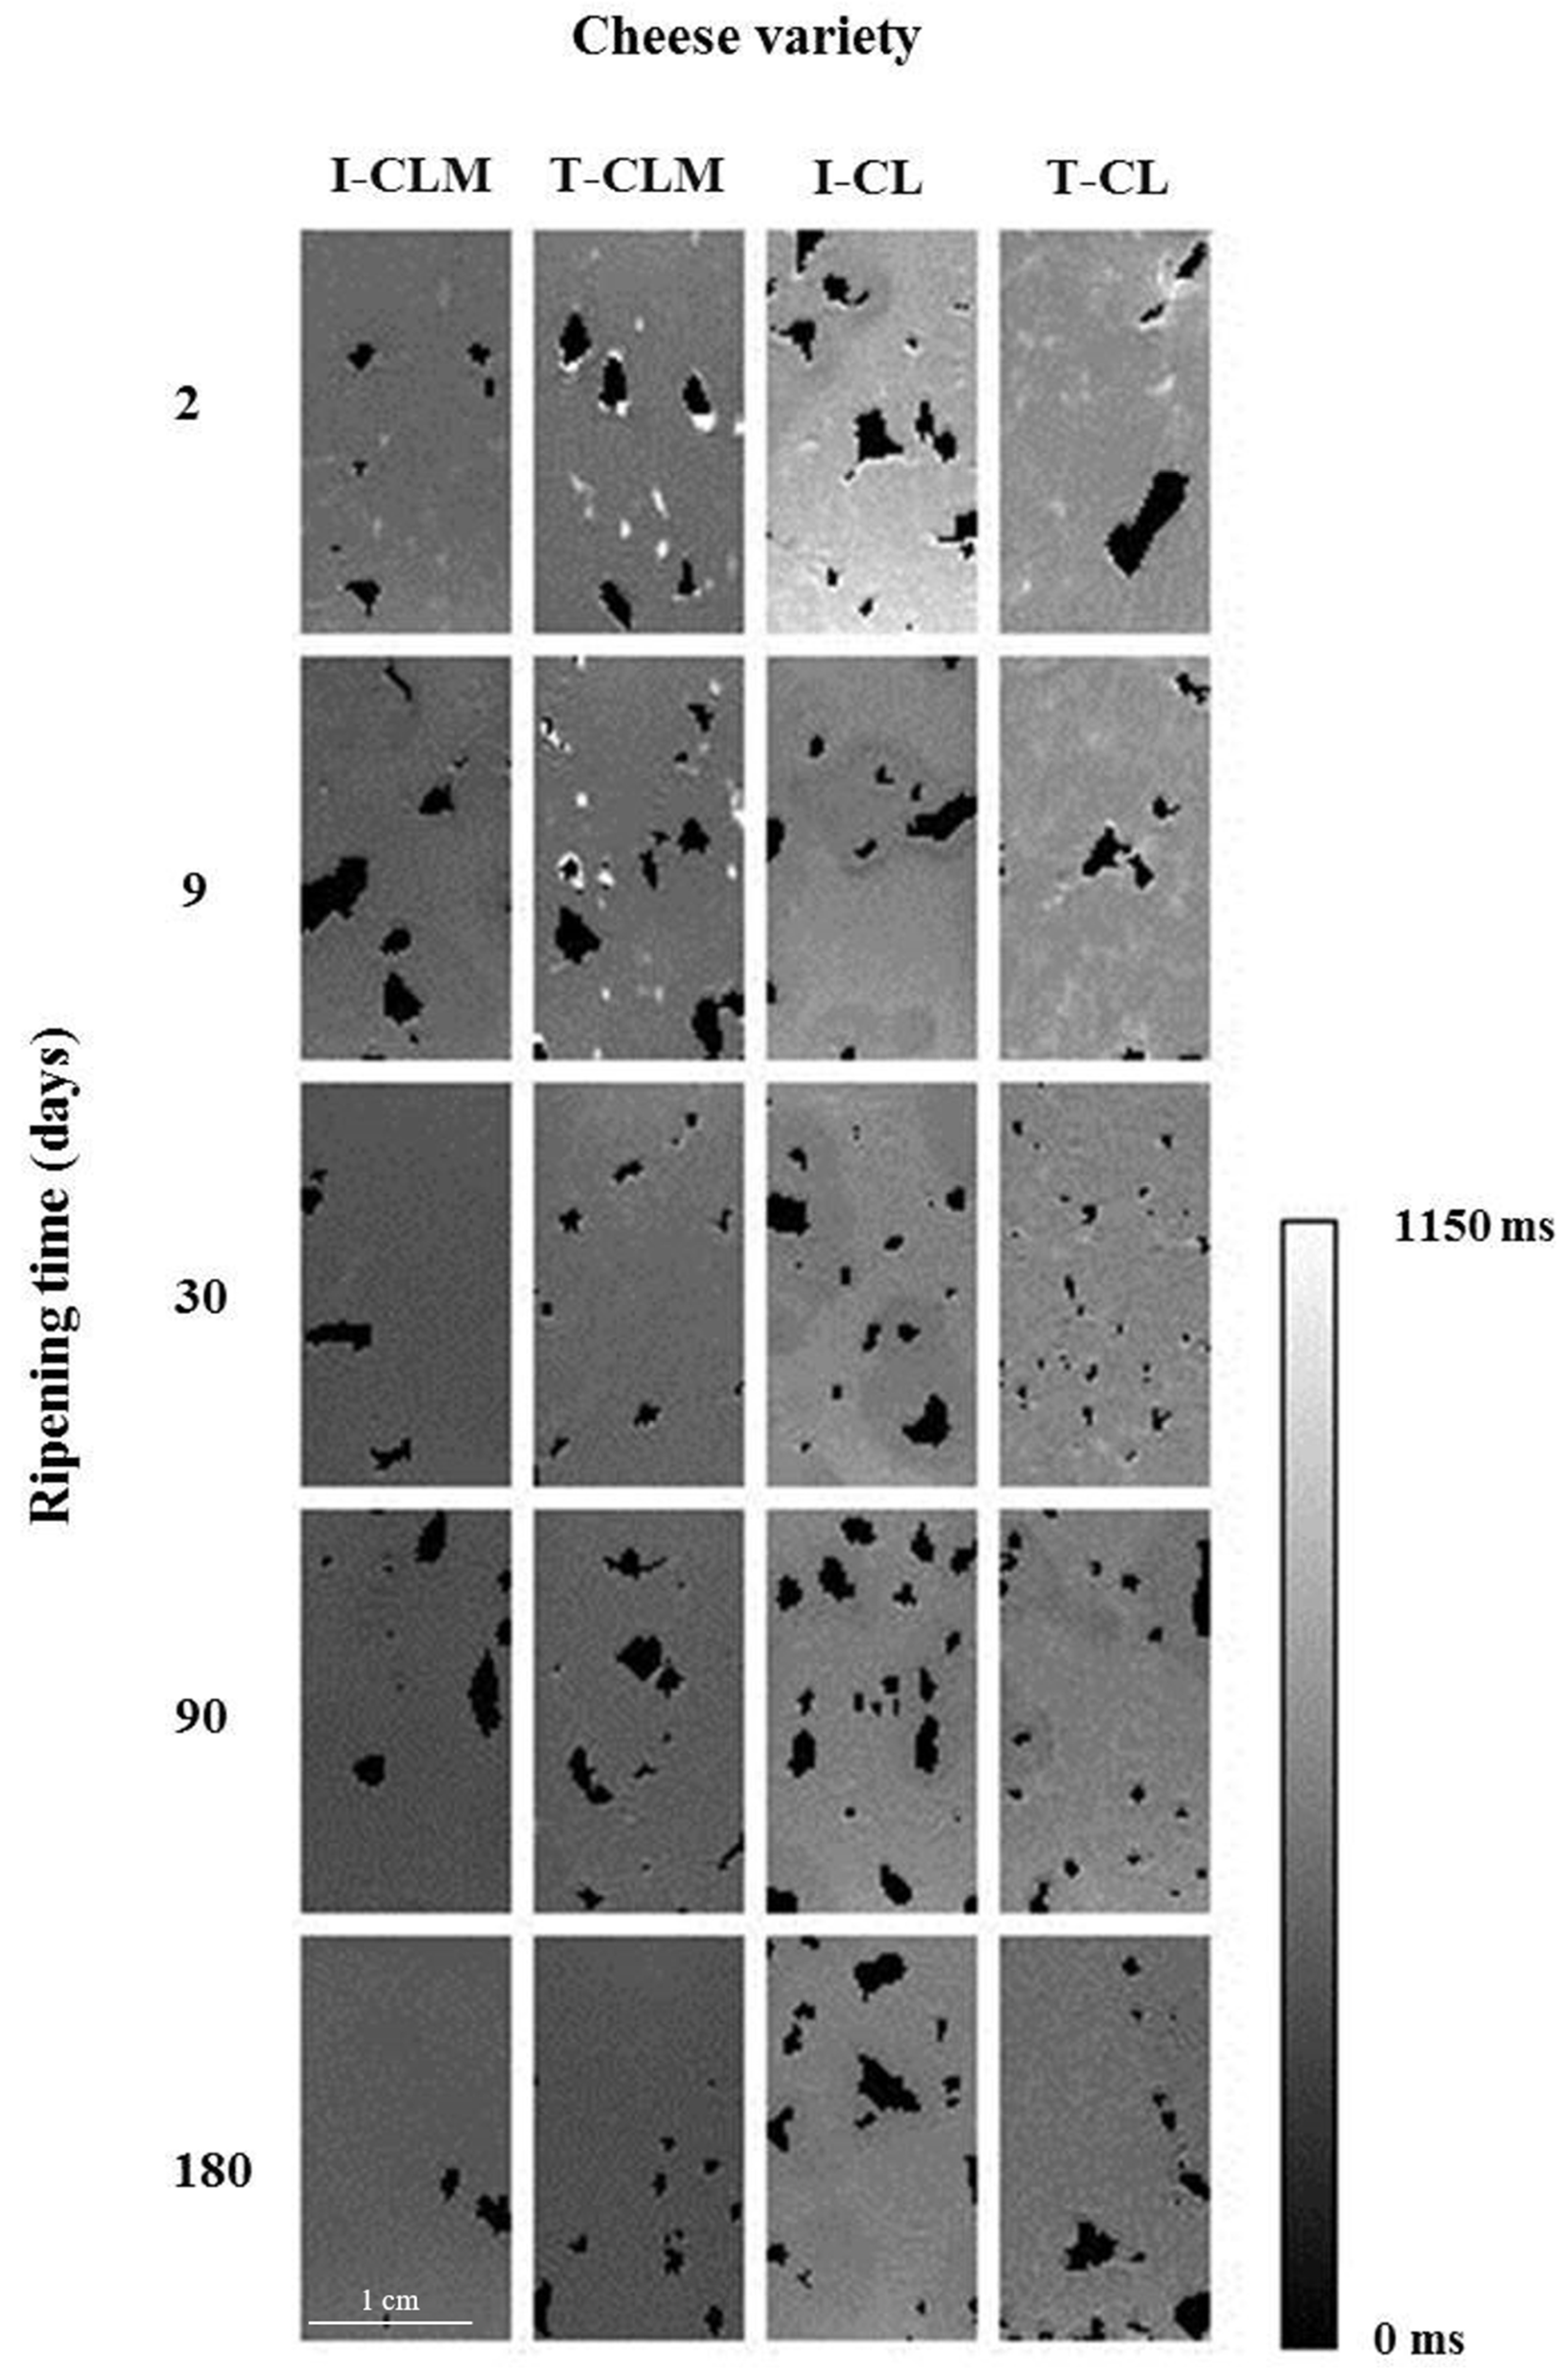
3.2. Study of the Structural Characteristics by Magnetic Resonance Imaging: T1 and T2

Hyperintense areas in T2 maps (Figure 1) corresponded to bulk water (T2 > 80 ms at 4.7 T). The dehydration and free water loss led to a decrease in the transverse relaxation time and, therefore, to hypointense zones in the T2 maps (T2 < 30 ms), whereas areas with intermediate values of T2 (between 30 and 80 ms) were displayed as zones of intermediate intensity corresponded to free fat. The dark areas (set to 0 ms) corresponded to porous structures or cavities containing air.
Keeping in mind that the cheese matrices are very heterogeneous and, therefore, high SD values are shown, the hole index (%) varied (average values) from 1% to 5% for CLM and from 2% to 12% for CL (Table 2 and Figure S2). Such a high SD was shown in both I and T-EMC. No clear relationship associated with RT was found. However, the I-CLM matrix might be more compact than that of the rest of the cheeses. In Figure 1, it can be observed that CL cheese varieties showed a less compact structure than CLM. Moreover, the image of PD (Figure S2) facilitates the visualization of such a structural feature. Consequently, CLM matured for 180 d revealed widely spaced and smaller eyes than CL matrices, which revealed holes that maintained or increased size throughout the RT. In fact, CL PD images (Figure S2) showed large openings and holes (eyes) interspersed throughout the matrix, being more defined in I-CL, showing a cheese matrix/hole ratio between 10 and 18, whilst a ratio between 18 and 47 was observed for T-CL. As mentioned, the SD for the cheese matrix/hole ratio could be related to the heterogeneity of the structure, and the mean values would correspond with the porosity of each cheese variety. Concurrently, I-CLM and T-CLM showed cheese matrix/hole ratios ranging between 21 and 68, thus implying that I-CLM showed the most compact matrix (Table 2).
MRI is a feasible technology to analyze cheese porosity, which is related to the development of eyes. Eye growth in semi-hard cheese varieties requires the presence of nuclei (microscopic bubbles in the curd), adequate development of propionic bacteria for gas production (dependent on rennet composition and bacteria distribution), and an appropriate curd texture [26]. These authors indicated that the eye growth gradient could be related to the presence of micro-eyes and micro-cracks during the initial stages of ripening that function as fragility zones in the cheese matrix, thus allowing further development of bigger holes and matrix restructuration. The gas found in such junctions would be a result of the cheese manufacturing process [26]. In our study, the differences among the studied cheese varieties could be related to the different manufacturing procedures for curd development.
Moreover, differences in bacteria repartition could participate in the opening gradient. In Emmental, a semi-hard variety in which anisotropy has been found in curd grain organization, each step of the production process had an impact on the microstructure: fat globules lost their native globule aspect and organized themselves into clusters before ripening, and the protein network lost its micelle organization, becoming a continuous network after pressing [26,27].
Focusing on the continuous cheese matrix, especially at 180 d RT, a hypointense mesh/grid was observed (Figure 1 and Figure S2). This mesh/grid showed lower T2 values (at 180 d RT, 19 ms for T-CLM, 27 ms for I-CLM and I-CL, and 49 ms for T-CL) surrounding areas with higher T2 values (at 180 d RT, 46–50 ms for CLM and 80 ms for CL) (Figure 1). The areas characterized by lower T2 values could be related to a more compact protein matrix, with higher protein–protein interactions and partially dehydrated, while the areas with higher T2 values could be related to a less compact protein matrix that withholds water and/or fat (Figure 1 and Figure S2). Such microstructure changes could be related to the transformation to a fibrous casein matrix during the RT described by Everett and Auty [11], and the proteolysis and dehydration evolution in Mozzarella cheese [28].
T2 mean values of CLM showed the opposite behavior to CL values throughout the RT (Table 3). T2 CLM values decreased (27.0% for I-CLM and 39.1% for T-CLM), whereas T2 CL values increased (37.9% for I-CL and 67.0% for T-CL) (p < 0.0001 for the interaction; Table 1 and Table 3). CLM showed the highest T2 values from 2 to 9 d of ripening. These findings suggested that the young CLM matrices should present bigger spaces filled with bulk water than the correspondent CL ones (lower T2). At the end of ripening (90 to 180 d), CL showed higher T2 values than CLM. It has been described that higher T2 values would correspond to bulk water or fat that would be filling in the pores or spaces (pools) within the matrix [29]. A reduction in the porosity, the amount of free water, or an increase in the protein–water binding would produce a drop in T2 value [30].
So, for CL, the casein matrix evolved from a uniform structure with abundant water tightly bound to the protein matrix (low T2, 30–45 ms at 4.7 T) to a porous structure with free-flowing fat (45–80 ms) that became partly dehydrated throughout the ripening process. On the contrary, for CLM, the ripening process led to a greater increase in protein–water, protein–protein, and protein–fat interactions, thus closing the cheese matrix structure, and maintaining or reducing the percentage of holes (Table 2, Figure 1 and Figure S2). As a result, the CLM matrix should be characterized by higher water-to-casein interactions and lower free fat formation, thus leading to a lower T2 value.
The differences among ECM varieties may be attributed to the variations in the manufacturing processes, mainly to milk pre-treatment (raw vs. pasteurized), milk microbiota, and type of rennet [24]. Pasteurization influences the biochemistry of cheese ripening by altering the indigenous milk microflora, partially or completely inactivating certain indigenous enzymes, and by slight denaturation of whey proteins [31]. Supportively, Mariette [32] explained that the regular sphere-shaped holes were a consequence of the production of CO2 from the biochemical activity of the bacteria, whereas the irregularly shaped holes were explained by mechanical constraints during curd manipulation.
T1 is a measure of molecule mobility, representing the binding of water protons, mainly to macromolecules [9,33]. As observed in the T1 maps (Figure 2), the higher T1 values (400–800 ms, hyperintense areas) corresponded to higher WC tissues. Thus, as the WC decreased throughout the RT, T1 values also decreased [9]. In addition, as the dehydration progressed, the contribution of fat molecules had more weight in the mean T1 value, which further contributed to the T1 decrease (T1 < 400 ms).
As in the T2 maps, a relaxation time anisotropy was also observed in the T1 maps (Figure 2). The T1 maps suggested a more uniform matrix in the CLM structure than in CL. But, overall, the cheese matrices were characterized by interspersed holes containing air, fat clusters (T1 < 400 ms), and a fine hydrated network (hyperintense mesh with T1 values at 180 d with an upper limit of 400–500 ms) over a hypointense background (the most compact and dehydrated matrix, with T1 values at 180 d between 300 and 350 ms). These areas could be related to matrix compaction as a result of more or stronger protein–protein interactions and/or entrapped fat.
As shown in Table 3, in the four EMC varieties, as the RT increased, the T1 value decreased. As in the case of T2, a significant interaction of the studied factors (EMC variety and RT) was found (p < 0.0001; Table 1). CL showed higher T1 values than CLM. Since T1 is a measure of the effect of the external environment on the spins, these results suggested that a freer distribution of both water and fat molecules would characterize the matrix of CL compared to CLM.

3.3. Texture Profile

Statistically significant differences between EMC variety and RT were found for all the TPA parameters (p < 0.0001; Table 1). The results showed that throughout ripening, the highest values of (p < 0.0001) both hardness (from 22.2 N to 42.1 N) and gumminess (between 13.7 N and 16.1 N) corresponded to I-CLM (Table 4), which could be due to the more compact and uniform structure of this cheese variety as previously discussed. This fact may be related to the use of pasteurized milk and to manufacturing aspects (Table S1), such as curd pressing time, starter culture, and type of rennet [20]. Núñez [24] indicated that Manchego cheeses elaborated with pasteurized milk exhibit a firmer texture than those made from raw milk. Higher proteolysis has been found in raw milk cheese, thus weakening the protein network and reducing firmness [23,34]. Overall, a hardness increase with RT, associated with a parallel WC decrease, was observed (Table 4). Accordingly, Lobato-Calleros et al. [25] and Revilla et al. [35] stated that, with the WC decrease, an increase in protein–protein interactions must be considered, thus allowing higher complexity of the cross-linking of the 3D structure. Gumminess values showed the opposite behavior to hardness, in which gumminess decreased as RT increased. Matrices older than 30 days showed the highest adhesiveness and springiness values (p < 0.05; Table 4). T-CL and T-CLM showed higher adhesiveness than those of industrial manufacturing at the end of RT. In agreement with the results, increasing amounts of free fat might imply a more adhesive cheese surface. In general, the cohesiveness decreased as the RT increased. This phenomenon may be related to the progressive dehydration of the cheese matrix with ripening, becoming brittle, and reducing its resistance to deformation. T-CL showed the lowest cohesiveness values, likely because this cheese variety had a more open structure than the other EMC at longer RT (Table 2). Regarding chewiness, young pieces (RT of 2 to 9 d after manufacturing) showed lower values than the longer ripened ones.
Similar changes in textural features during RT were described for Manchego cheese [31], Terrincho ewe cheese [36], and Cheddar cheese [37]. Núñez [24] reported that higher values of hardness and springiness were found in raw and pasteurized milk cheeses when made with autochthonous strains. Lobato-Calleros et al. [35] described changes in chewiness and adhesiveness associated with milk fat. González-Viñas et al. [31] described more homogeneous textural characteristics for industrial Manchego cheese varieties than for their artisanal counterparts. Therefore, the factors (Table S1) that take part in the manufacturing of the studied cheese varieties, such as starter culture and rennet, would explain the differences among the values of the texture features.

3.4. Study of the Relationship between T1/T2 and Physicochemical and TPA Parameters: Predictive Models (Industry Applicability)

Regression models were used to determine the degree of association of T1 and/or T2 with RT, WC, and aw to provide insight into the relationship between these parameters and their potential use in industry applications (Table 5 and Figure S3). Together, imitating the tendency of a previous study [8], linear regressions were also calculated individually for each MRI parameter and each EMC. Equations with higher R2 values were detected when considering the logarithmic approach compared to the linear individual ones. Higher R2 values were obtained for T-EMC models than for I-EMC with both T1 and T2 parameters (Table 5). Regarding the R2 values, in the case of linear models, the lowest value was observed for I-CL for T1 for the considered parameters (RT, 0.39; aw, 0.39; and WC, 0.56) whereas, for T2, the lowest value was shown in I-CLM (RT, 0.35; aw, 0.49; and WC, 0.53). However, when observing the logarithmic models, values of R2 ≥ 0.70 were observed for both T1 and T2. The T2 linear models showed higher absolute values for slope compared to T1. In the case of T1, all the slope values of the linear models resulted in negative values for RT and positive values for aw and WC. But, in the case of T2, an opposite behavior between CLM and CL was observed (Table S3).
For a better understanding of the matrix microstructure and the textural response, the relationship between textural and MRI parameters was studied (Table 5 and Figure S4). Together with the logarithmic models, the development of linear regressions was also carried out individually for each MRI parameter and each EMC [8]. Again, logarithmic models showed higher R2 values compared to linear ones. Moreover, paying attention to logarithmic models of hardness, adhesiveness, and cohesiveness (Table 5 and Figure S4), T-EMC showed higher R2 values than I-EMC. Consequently, this would imply that the changes in the traditional matrices, being more heterogeneous (greater size and more irregular eye distribution), are well represented by the T1 and T2 parameters.
This study demonstrates that the monitoring of the physicochemical characteristics of cheese can be carried out by measuring T1 and T2 variables, using logarithmic regression models for the considered cheese varieties. Nevertheless, a regression model must be individually obtained for each cheese variety. Together, statistical differences were detected either considering the manufacturing location (CLM vs. CL) or the manufacturing process (I vs. T), thus implying the suitability of MRI as a technique to control Spanish sheep cheese adulterations. Lerma-García et al. [38] reported similar results when using Fourier-transform infrared spectroscopy (FTIR). Nevertheless, further studies would be necessary to fully interpret T1 and T2 behavior.

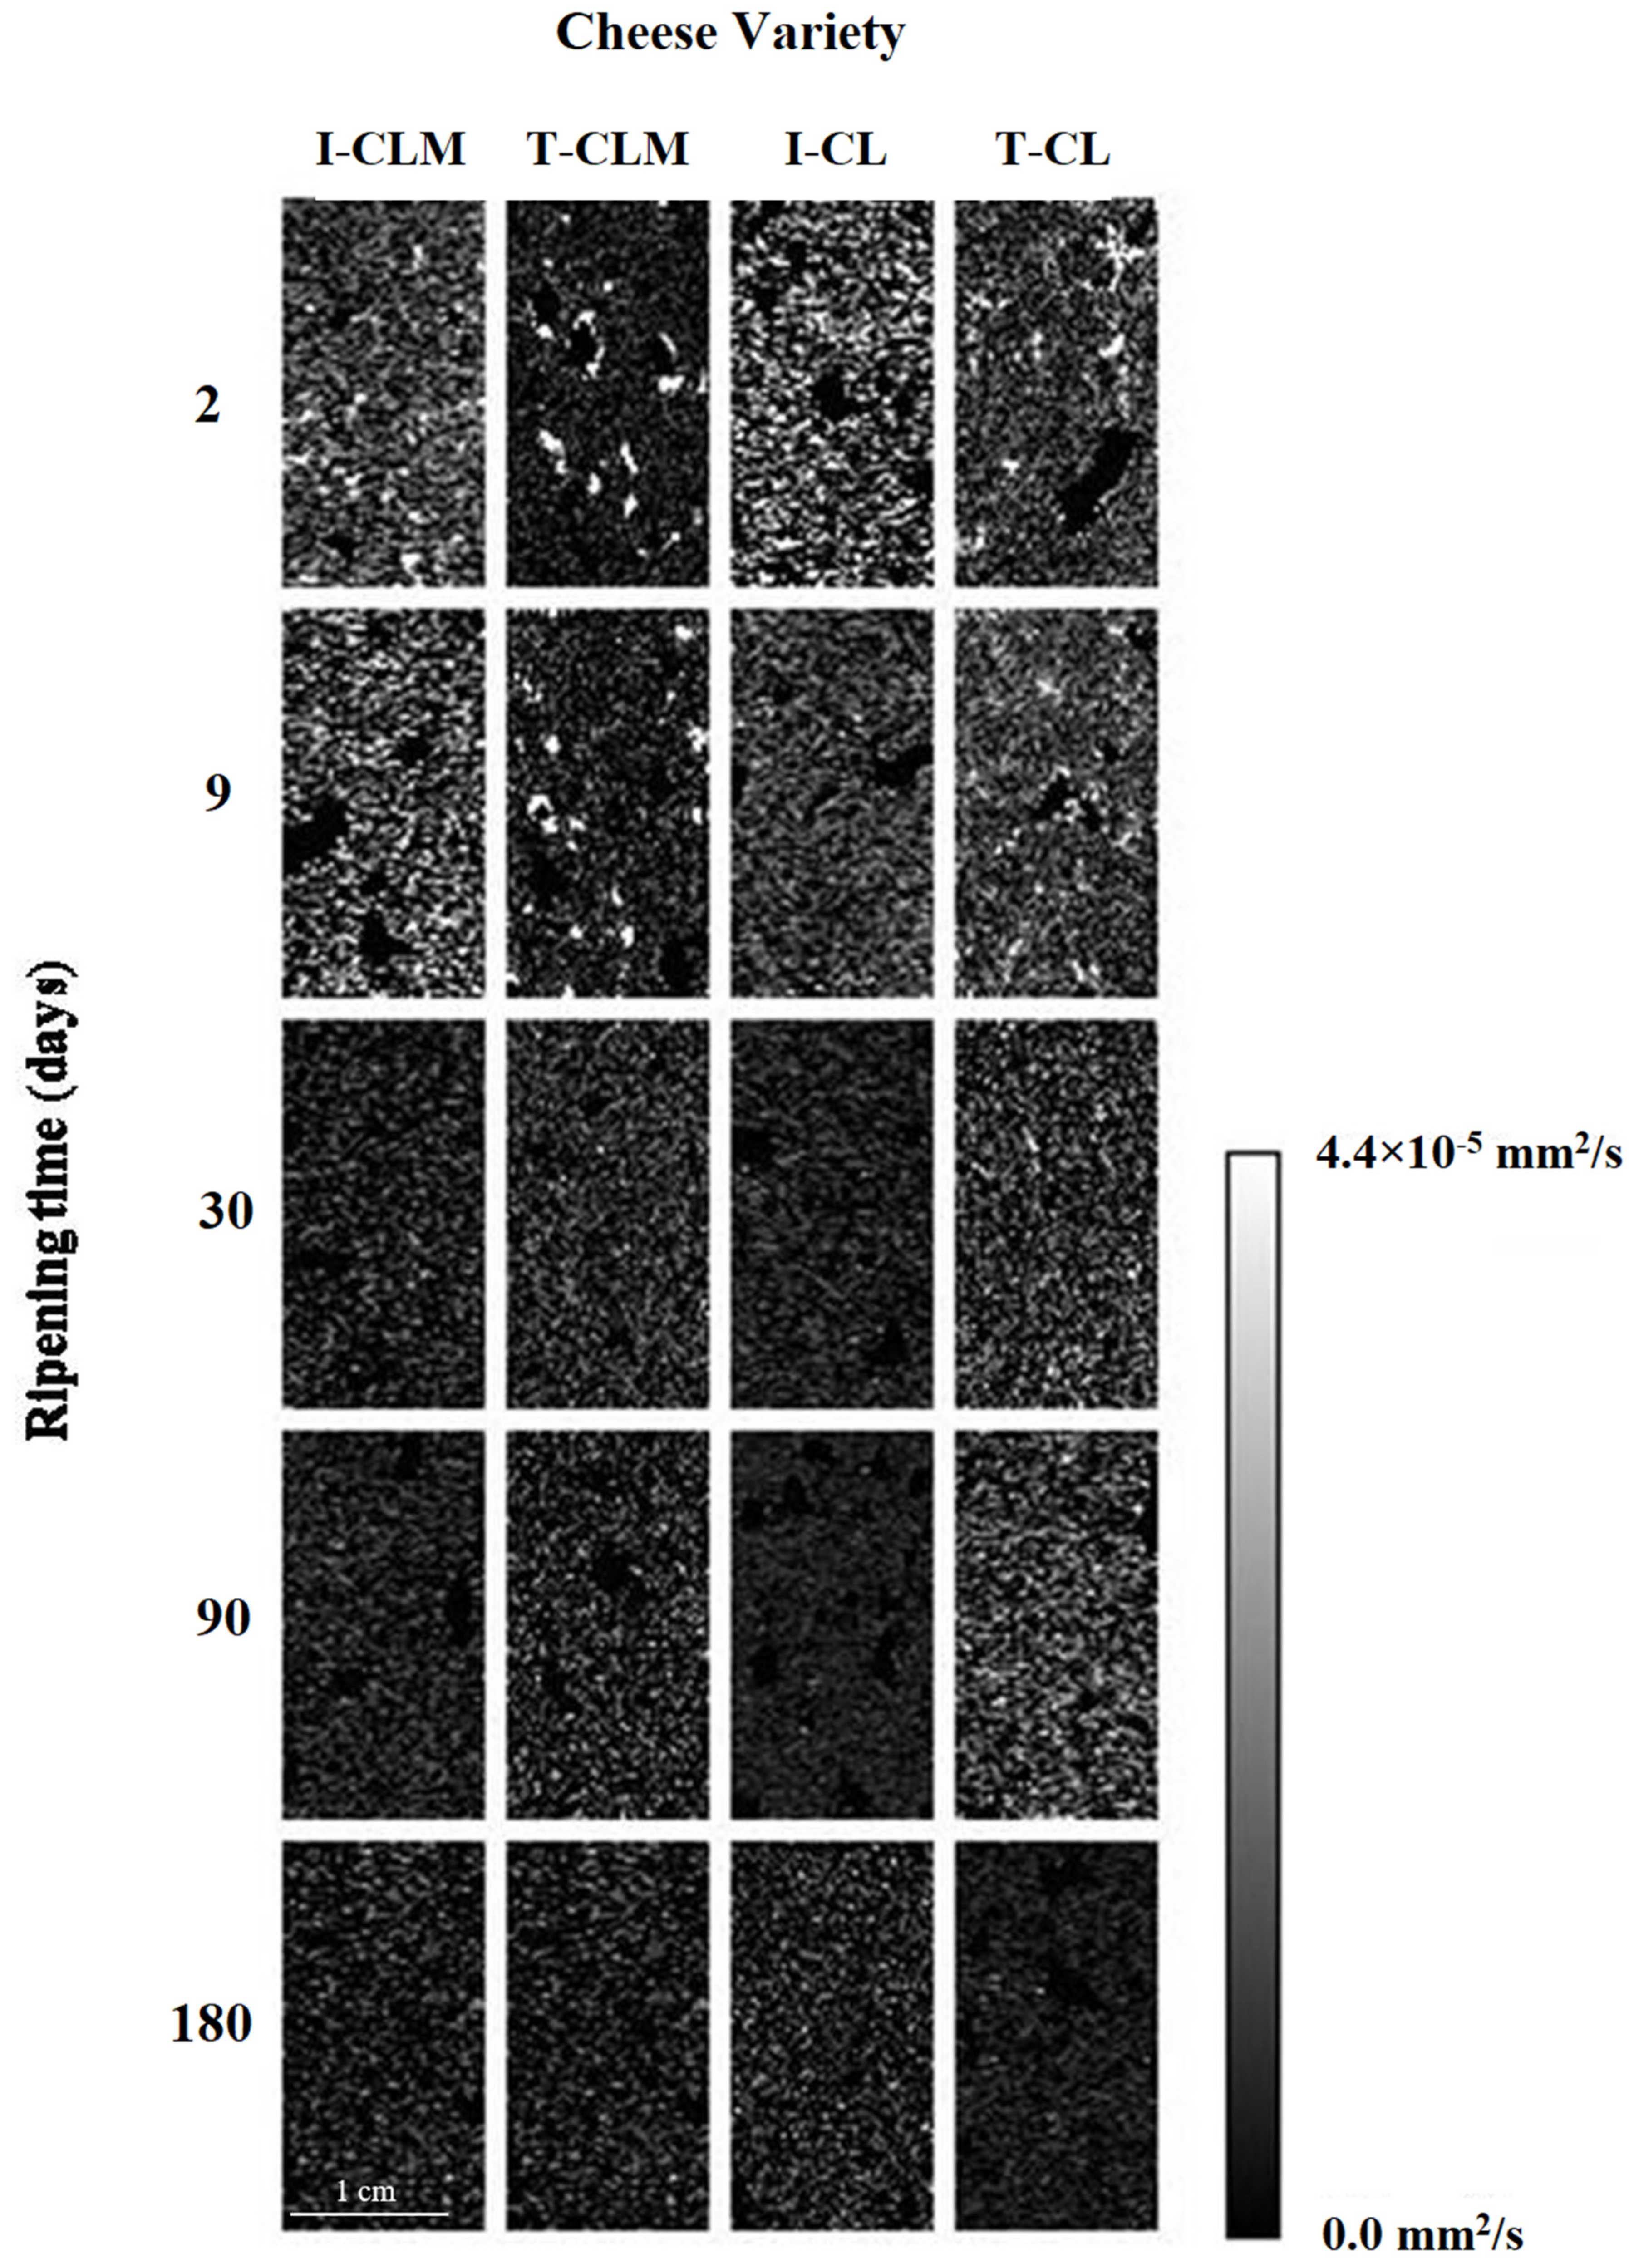
3.5. Apparent Diffusion Coefficient (ADC)

The average translational motion of water protons could be quantified by ADC values, thus indicating the magnitude of the diffusion of water molecules through a biological matrix [39,40]. Some barriers, such as cell walls and large-chain proteins, reduce the ability of water to diffuse [9]. Therefore, ADC maps may enable the assessment of changes in spin diffusion through cheese matrices throughout the RT.
Regarding cheese matrices, in the ADC maps (Figure 3), hyperintense areas corresponded to a higher diffusion of water molecules through the matrix (ADC > 3.5 × 10⁻⁵ mm2/s). In this case, the higher the RT considered, the lower the ADC values, revealing hypointense (ADC < 0.45 × 10⁻⁵ mm2/s) maps at 180 d. The changes observed in Figure 3 reflect both the water loss and the consolidation of the cheese structure, both of which are related to a decrease in the ADC values (Table 3). Prior studies have described that lower ADC values are associated with denser tissues [39].
The decrease in ADC values (Table 1 and Table 3; p < 0.0001) is associated with the decrease in the WC throughout the RT but also with the formation of protein–protein and protein–water interactions as the cheese matrix stabilizes, particularly during the first month of ripening. In this microenvironment, water mobility was more restricted. Moreover, such a decrease in ADC values can be also related to the increase in relative fat content due to the decrease in WC with RT (Table S2), as previously observed in fatty livers [41] and model food products [42]. It has been suggested that the presence of fat may decrease ADC values by restricting the diffusion of water [41]. Although fat diffusion happens, being more feasible in matrices with higher dehydration, fat ADC values are much lower than water values [43], thus justifying higher ADC values of hydrated matrices. Steidle et al. [43] described that fat ADC values were approximately two orders of magnitude smaller than water values due to the higher molecular weight of triglycerides, thus explaining that an ADC value increase was not observed in the CL cheese variety, whose T2 value increase with RT was related to the presence of a higher number of free fat protons.
A lower decrease rate of ADC values was detected for T-EMC than for I-EMC (55.8% vs. 67.2%, respectively; p < 0.01), which could be related to a more open structure with larger eyes. It appears that not only ADC absolute values but also differences in RT should be considered when relating to matrix microstructure. In the protein structure of meat systems containing plasma powder, significant correlations between ADC values and WC have been previously reported [9]. Regarding the regression models between RT, WC, and aw of EMC and ADC, although statistically significant (p < 0.05), R2 values of the linear regression were lower than 0.60 for RT (between 0.42 and 0.54); for WC lower for T-EMC (0.47 and 0.58 for CLM and CL, respectively) than for I-EMC (0.73 for CLM and 0.69 for CL); and for aw between 0.42 and 0.67. Overall, lower R2 values than those obtained for T1 and T2 were obtained, which could be related to the extremely low ADC values at the end of the RT that could be related to fat interference (Table S4).

4. Conclusions

Magnetic Resonance Imaging (MRI) provided valuable information about the matrix structure of sheep cheese, which can be related to differences in the geographical origin, manufacturing process (industrial vs. traditional), milk pre-treatment (raw vs. pasteurized), and ripening time.
T2 values were sensitive to both the porosity of the cheese matrix and the water linked to macromolecules. Therefore, T2, together with proton density images, were suitable for monitoring structural modifications of the cheese matrix during ripening. T1 maps proved to serve as a useful tool to monitor the ripening process of the sheep cheese, depending on the surrounding molecules of fat and water. ADC maps assessed the diffusion changes throughout the ripening time by giving attention to the water losses of the cheese matrix, thus implying a decrease in the ADC values and the consolidation of the structure. High values of regression coefficients were detected for logarithmic estimation models of water content, aw, ripening time, hardness, adhesiveness, springiness, and cohesiveness depending on T2 and T1 values. However, further studies are necessary for individual optimization of the model equations for each product and production procedure. Therefore, these results support the suitability of MRI, an emerging non-destructive technique, in the monitoring of cheese structure changes during ripening, the estimation of the physicochemical and textural-related properties, and the analysis of the basis of the structural characterization of different varieties of sheep cheese. These promising results could become part of the NMR technology transfer to the manufacturing control in industrial processing lines.

Supplementary Materials

The following supporting information can be downloaded at https://www.mdpi.com/article/10.3390/foods13203225/s1, Figure S1: Cheese sampling; Figure S2: Proton density images of the four varieties of Spanish sheep cheese at different ripening times used to calculate the hole index; Figure S3: Response surface plot showing the relationship between T1 and T2 values (MRI parameters) and physicochemical parameters: (a) ripening time, RT (days); (b) water activity, aw; and (c) water content, WC (%) of the four varieties of Spanish sheep cheese; Figure S4: Response surface plot showing the relationship between T1 and T2 values (MRI parameters) and texture parameters: (a) hardness (N), (b) adhesiveness (N × s), (c) springiness (m), and (d) cohesiveness of the four varieties of Spanish sheep cheese; Table S1: Manufacture characteristics of the studied varieties of Spanish sheep cheese; Table S2: Values of the physicochemical features (pH, aw, DM, WC, ash, fat, and protein contents) of the four considered Spanish sheep cheese varieties at different ripening times; Table S3: Regression parameters of the linear models between MRI parameters and physicochemical and texture parameters; Table S4: Simple linear regression analysis of ripening time, water content, and aw with apparent diffusion coefficient (ADC) of the four varieties of Spanish ewe’s milk cheese.

Author Contributions

Conceptualization, M.I.C.; methodology, M.I.C. and M.E.F.-V.; software, M.E.F.-V. and D.C.; validation, M.I.C., M.E.F.-V. and J.S.; formal analysis, V.R., K.P.C.-D. and M.D.R.-d.-Á.; investigation, M.I.C., M.E.F.-V. and J.S.; data curation, D.C., V.R. and J.S.; writing—original draft preparation, M.E.F.-V., J.S. and M.I.C.; writing—review and editing, M.E.F.-V., J.S. and M.I.C.; visualization, M.I.C., D.C., J.S. and M.E.F.-V.; supervision, M.I.C., M.E.F.-V. and M.D.R.-d.-Á.; project administration, M.I.C.; funding acquisition, M.I.C. All authors have read and agreed to the published version of the manuscript.

Funding

This research received financial support from the project PID2019-107542RB-C22 funded by the Spanish Ministry of Science and Innovation.

Institutional Review Board Statement

Not applicable.

Informed Consent Statement

Not applicable.

Data Availability Statement

The original contributions presented in the study are included in the article/supplementary material, further inquiries can be directed to the corresponding author.

Acknowledgments

The authors gratefully acknowledge the support and in-kind contribution of samples, facilities, and assistance received from Fábrica de Quesos Pablo Alonso Martín, Zamora (Spain).

Conflicts of Interest

The authors declare no conflicts of interest.

References

  1. Medina, M.; Nuñez, M. Cheeses from Ewe and Goat Milk. In Cheese: Chemistry, Physics and Microbiology, 4th ed.; McSweeney, P.L.H., Fox, P.F., Cotter, P.D., Everett, D.W., Eds.; Academic Press: San Diego, CA, USA, 2017; pp. 1069–1091. [Google Scholar] [CrossRef]
  2. McSweeney, P.L.H. Biochemistry of cheese ripening: Introduction and overview. In Cheese: Chemistry, Physics and Microbiology, 4th ed.; McSweeney, P.L.H., Fox, P.F., Cotter, P.D., Everett, D.W., Eds.; Academic Press: San Diego, CA, USA, 2017; pp. 379–387. [Google Scholar] [CrossRef]
  3. Official Journal of the European Communities COMMISSION REGULATION (EC) No 1107/96 of 12 June 1996 on the Registration of Geographical Indications and Designations of Origin under the Procedure Laid down in Article 17 of Council Regulation (EEC) No 2081/92. Available online: https://eur-lex.europa.eu/legal-content/EN/ALL/?uri=CELEX:31996R1107 (accessed on 15 August 2024).
  4. Official Journal of the European Union. COMMISSION IMPLEMENTING REGULATION (EU) 2020/247 of 18 February 2020 Entering a Name in the Register of Protected Designations of Origin and Protected Geographical Indications [‘Queso Castellano’ (PGI)]. Available online: https://eur-lex.europa.eu/legal-content/EN/TXT/?uri=CELEX:32020R0247 (accessed on 15 August 2024).
  5. Fernández-García, E.; Gaya, P.; Medina, M.; Núñez, M. Evolution of the volatile components of raw ewes’ milk Castellano cheese: Seasonal variation. Int. Dairy J. 2004, 14, 39–46. [Google Scholar] [CrossRef]
  6. Hui, Y.H.; Evranuz, E.Ö. (Eds.) Handbook of Animal-Based Fermented Food and Beverage Technology, 2nd ed.; CRC Press: Boca Raton, FL, USA, 2012. [Google Scholar] [CrossRef]
  7. Conde, T.; Cárcel, J.A.; García-Pérez, J.V.; Benedito, J. Non-destructive analysis of Manchego cheese texture using impact force–deformation and acoustic impulse–response techniques. J. Food Eng. 2007, 82, 238–245. [Google Scholar] [CrossRef]
  8. Altan, A.; Oztop, M.H.; McCarthy, K.L.; McCarthy, M.J. Monitoring changes in feta cheese during brining by magnetic resonance imaging and NMR relaxometry. J. Food Eng. 2011, 107, 200–207. [Google Scholar] [CrossRef]
  9. Herrero, A.M.; de la Hoz, L.; Ordóñez, J.A.; Castejón, D.; Romero de Ávila, M.D.; Cambero, M.I. Magnetic resonance imaging study of the cold-set gelation of meat systems containing plasma powder. Food Res. Int. 2009, 42, 1362–1372. [Google Scholar] [CrossRef]
  10. Chen, Q.; Zhang, C.; Zhao, J.; Ouyang, Q. Recent advances in emerging imaging techniques for non-destructive detection of food quality and safety. Trends Anal. Chem. 2013, 52, 261–274. [Google Scholar] [CrossRef]
  11. Everett, D.W.; Auty, M.A.E. Cheese Microstructure. In Cheese: Chemistry, Physics and Microbiology, 4th ed.; McSweeney, P.L.H., Fox, P.F., Cotter, P.D., Everett, D.W., Eds.; Academic Press: San Diego, CA, USA, 2017; pp. 547–569. [Google Scholar] [CrossRef]
  12. Melado-Herreros, A.; Fernández-Valle, M.E.; Barreiro, P. Application of NMR to resolve food structure, composition and quality. In Applications of NMR Spectroscopy: Applications in Food Sciences, 1st ed.; Rahman, A., Choudhary, M.I., Eds.; Bentham Science Publishers: Oak Park, IL, USA, 2016; pp. 3–61. [Google Scholar]
  13. Borgia, G.C.; Brown, R.J.S.; Fantazzini, P. Uniform-Penalty Inversion of multiexponential decay data. J. Magn. Reson. 1998, 132, 65–77. [Google Scholar] [CrossRef]
  14. Commission Implementing Regulation (EU) No 129/2012 of 13 February 2012 Approving Minor Amendments to the Specification for a Name Entered in the Register of Protected Designations of Origin and Protected Geographical Indications (Queso Manchego (PDO)). Available online: https://eur-lex.europa.eu/legal-content/EN/AUTO/?uri=uriserv:OJ.L_.2012.043.01.0001.01.ENG&toc=OJ:L:2012:043:FULL (accessed on 10 August 2024).
  15. AOAC. Official Methods of Analysis, 18th ed.; Association of Official Analytical Chemists: Washington, DC, USA, 2006. [Google Scholar]
  16. Hanson, S.W.F.; Olley, J. Application of the Bligh and Dyer method of lipid extraction to tissue homogenates. Biochem. J. 1963, 89, 101–102. Available online: https://europepmc.org/article/CTX/c1253 (accessed on 10 August 2024).
  17. Romero de Ávila, M.D.; Cambero, M.I.; Ordóñez, J.A.; de la Hoz, L.; Herrero, A.M. Rheological behaviour of commercial cooked meat products evaluated by tensile test and texture profile analysis (TPA). Meat Sci. 2014, 98, 310–315. [Google Scholar] [CrossRef]
  18. SAS Institute Inc. SAS 9.4 for Windows; SAS Institute Inc.: Cary, NC, USA, 2014. [Google Scholar]
  19. Chatterjee, S.; Hadi, A.S. Regression Analysis by Example, 5th ed.; Wiley: New York, NY, USA, 2013; Chapter 11. [Google Scholar]
  20. Etayo, I.; Pérez Elortondo, F.J.; Gil, P.F.; Albisu, M.; Virto, M.; Conde, S.; Rodríguez Barron, L.J.; Nájera, A.I.; Gómez-Hidalgo, M.E.; Delgado, C.; et al. Hygienic quality, lipolysis and sensory properties of Spanish Protected Designation of Origin ewe’s milk cheeses manufactured with lamb rennet paste. Lait 2006, 86, 415–434. [Google Scholar] [CrossRef]
  21. Poveda, J.M.; Cabezas, L.; McSweeney, P.L.H. Free amino acid content of Manchego cheese manufactured with different starter cultures and changes throughout ripening. Food Chem. 2004, 84, 213–218. [Google Scholar] [CrossRef]
  22. Ferrazza, R.E.; Fresno, J.M.; Ribeiro, J.I.; Tornadijo, M.E.; Furtado, M.M. Changes in the microbial flora of Zamorano cheese (P.D.O.) by accelerated ripening process. Food Res. Int. 2004, 37, 149–155. [Google Scholar] [CrossRef]
  23. Seseña, S.; Poveda, J.N.; Cabezas, L.; Palop, M.L. Manchego cheese. In Handbook of Cheese in Health: Production, Nutrition and Medical Sciences; Preedy, V.R., Watson, R.R., Patel, V.B., Eds.; Wageningen Academic Publishers: Wageningen, The Netherlands, 2013; pp. 193–210. [Google Scholar]
  24. Núñez, M. Existing technologies in non-cow milk processing and traditional non-cow milk products. In Non-Bovine Milk and Milk Products; Tsakalidou, E., Papadimitriou, K., Eds.; Elsevier Science & Technology: Amsterdam, The Netherlands, 2016; pp. 161–186. [Google Scholar]
  25. Revilla, I.; Rodríguez-Nogales, J.M.; Vivar-Quintana, A.M. Proteolysis and texture of hard ewes’ milk cheese during ripening as affected by somatic cell counts. J. Dairy Res. 2007, 74, 127–136. [Google Scholar] [CrossRef] [PubMed]
  26. Huc, D.; Mariette, F.; Challois, S.; Barreau, J.; Moulin, G.; Michon, C. Multi-scale investigation of eyes in semi-hard cheese. Innov. Food Sci. Emerg. Technol. 2014, 24, 106–112. [Google Scholar] [CrossRef]
  27. Huc, D.; Moulin, G.; Mariette, F.; Michon, C. Investigation of curd grains in Swiss-type cheese using light and confocal laser scanning microscopy. Int. Dairy J. 2013, 33, 10–15. [Google Scholar] [CrossRef]
  28. Smith, J.R.; Vogt, S.J.; Seymour, J.D.; Carr, A.J.; Codd, S.L. Probing water migration in Mozzarella cheese during maturation and heating utilizing magnetic resonance techniques. J. Food Eng. 2017, 198, 1–6. [Google Scholar] [CrossRef]
  29. Simpson, N.E.; Grant, S.C.; Blackband, S.J.; Constantinidis, I. NMR properties of alginate microbeads. Biomaterials 2003, 24, 4941–4948. [Google Scholar] [CrossRef]
  30. Boulby, P.A.; Rugg-Gunn, F. T2: The transverse relaxation time. In Quantitative MRI of the Brain: Measuring Changes Caused by Disease; Tofts, P., Ed.; John Wiley & Sons: New York, NY, USA, 2003; pp. 143–173. [Google Scholar]
  31. Viñas, M.A.G.; Ballesteros, C.; Martín-Álvarez, P.J.; Cabezas, L. Relationship between sensory and instrumental measurements of texture for artisanal and industrial Manchego cheeses. J. Sens. Stud. 2007, 22, 462–476. [Google Scholar] [CrossRef]
  32. Mariette, F. NMR imaging of dairy products. In Modern Magnetic Resonance. Part 3: Applications in Materials Science and Food Science; Webb, G.A., Ed.; Springer: Dordrecht, The Netherlands, 2006; pp. 1801–1806. [Google Scholar]
  33. McRobbie, D.W.; Moore, E.A.; Graves, M.J.; Prince, M.R. MRI from Picture to Proton, 3rd ed.; Cambridge University Press: New York, NY, USA, 2017. [Google Scholar]
  34. Poveda, J.M.; Chicon, R.; Cabezas, L. Biogenic amine content and proteolysis in Manchego cheese manufactured with Lactobacillus paracasei subsp. paracasei as adjunct and other autochthonous strains as starters. Int. Dairy J. 2015, 47, 94–101. [Google Scholar] [CrossRef]
  35. Lobato-Calleros, C.; Reyes-Hernández, J.; Beristain, C.I.; Hornelas-Uribe, Y.; Sánchez-García, J.E.; Vernon-Carter, E.J. Microstructure and texture of white fresh cheese made with canola oil and whey protein concentrate in partial or total replacement of milk fat. Food Res. Int. 2007, 40, 529–537. [Google Scholar] [CrossRef]
  36. Pinho, O.; Mendes, E.; Alves, M.M.; Ferreira, I.M. Chemical, physical, and sensorial characteristics of “Terrincho” ewe cheese: Changes during ripening and intravarietal comparison. J. Dairy Sci. 2004, 87, 249–257. [Google Scholar] [CrossRef]
  37. Iruda y Araj, J.; Chen, M.; McMahon, D.J. Texture development in cheddar cheese during ripening. Can. Agric. Eng. 1999, 41, 253–258. [Google Scholar]
  38. Lerma-García, M.J.; Gori, A.; Cerretani, L.; Simó-Alfonso, E.F.; Caboni, M.F. Classification of Pecorino cheeses produced in Italy according to their ripening time and manufacturing technique using Fourier transform infrared spectroscopy. J. Dairy Sci. 2010, 93, 4490–4496. [Google Scholar] [CrossRef] [PubMed]
  39. Sener, R.N. Diffusion MRI: Apparent diffusion coefficient (ADC) values in the normal brain and a classification of brain disorders based on ADC values. Comput. Med. Imaging Graph. 2001, 25, 299–326. [Google Scholar] [CrossRef] [PubMed]
  40. Mariette, F.; Topgaard, D.; Jonsson, B.; Soderman, O. 1H NMR diffusometry study of water in casein dispersion and gels. J. Agric. Food Chem. 2002, 50, 4295–4302. [Google Scholar] [CrossRef]
  41. Poyraz, A.K.; Onur, M.R.; Kocakoç, E.; Oğur, E. Diffusion-weighted MRI of fatty liver. J. Magn. Reson. Imaging 2012, 35, 1108–1111. [Google Scholar] [CrossRef]
  42. Métais, A.; Mariette, F. Determination of water self-diffusion coefficient in complex food products by low field 1H PFG-NMR: Comparison between the standard spin-echo sequence and the T1-weighted spin-echo sequence. J. Magn. Reson. 2003, 165, 265–275. [Google Scholar] [CrossRef]
  43. Steidle, G.; Eibofner, F.; Schick, F. Quantitative diffusion imaging of adipose tissue in the human lower leg at 1.5 T. Magn. Reson. Med. 2011, 65, 1118–1124. [Google Scholar] [CrossRef]
Figure 1. Representative T2 maps of the four varieties of Spanish sheep cheese at different ripening times. Cheese variety (I-CLM, T-CLM, I-CL, and T-CL) according to Table 1. A scale bar (zoomed in) corresponding to 1 cm is shown.
Foods 13 03225 g001
Figure 2. Representative T1 maps of the four varieties of Spanish sheep cheese at different ripening times. Cheese varieties (I-CLM, T-CLM, I-CL, and T-CL) according to Table 1. A scale bar (zoomed in) corresponding to 1 cm is shown.
Foods 13 03225 g002
Figure 3. Representative ADC maps of the four varieties of Spanish sheep cheese at different ripening times. Cheese varieties (I-CLM, T-CLM, I-CL, and T-CL) according to Table 1. A scale bar (zoomed in) corresponding to 1 cm is shown.
Foods 13 03225 g003
Table 1. Effect of sheep cheese variety geographical origin (A: CLM and CL), manufacturing procedure (B: I and T), and ripening time (C: RT) on physicochemical, magnetic resonance, and texture parameters.
RMSE ap-Value b
(n = 25)ABCA × BA × CB × CA × B × C
Physicochemical
pH0.05270.00010.00010.00010.00010.00010.00010.0377
Protein (% DM c)1.37380.08010.07870.20100.11660.42370.01310.4340
Fat (% DM)1.74070.00010.03810.91460.01470.46800.78400.8564
Ash (% DM)0.34880.00010.01300.00010.00100.11320.10510.0175
WC d (%)1.32940.00010.00010.00010.79490.09080.00010.1221
aw0.00500.00010.19750.00010.84690.00010.00010.0001
Structural
T1 (ms)14.6790.00010.00010.00010.00010.00010.00010.0001
T2 (ms)1.89840.00010.00010.00010.00010.00010.00010.0001
ADC (mm2/s)0.00150.31120.00040.00010.00220.00570.00010.0110
Textural
Hardness (N)3.91150.00010.10280.00010.00010.10990.00010.0021
Adhesiveness (N × s)0.05450.01550.00010.00010.00010.00010.00010.1934
Springiness (m)0.00040.00010.00010.00010.00010.07000.75080.0001
Cohesiveness0.04990.00010.00010.00010.00010.00010.00010.0001
Gumminess (N)1.92570.00010.00010.00010.21610.00010.00010.0001
Chewiness (J)0.00500.00010.00010.00010.55290.00040.03680.0097
a RMSE = root mean square error; n = five different pieces of each variety were analyzed at each sampling time. b A = location (CLM or CL); B = manufacture (I or T); and C = RT (2, 9, 30, 90, and 180 days). I-CLM = pieces produced in an industrial facility in the Castilla-La Mancha region; T-CLM = pieces manufactured according to an artisanal/traditional procedure in Castilla-La Mancha; I-CL = pieces produced in a large industrial facility in the Castilla y León region; and T-CL = manufactured according to an artisanal/traditional procedure in Castilla y León (Table S1). c DM = dry matter. d WC = water content = 100 DM.
Table 2. Hole index (% of total area) and cheese matrix to hole ratio of the four varieties of Spanish sheep cheese 1 at different ripening times (RTs).
RT
(Days)
I-CLM 1T-CLMI-CLT-CL
Hole index (%) 221.94 ± 0.64bc,β3.11 ± 0.50ab,αβ5.53 ± 1.43b,α4.01 ± 2.56b,αβ
94.79 ± 1.27a,β4.92 ± 2.87a,αβ7.52 ± 0.33ab,α2.89 ± 1.10bc,β
303.00 ± 1.15ab,αβ1.95 ± 0.61c,αβ5.38 ± 0.90b,α2.14 ± 0.38c,β
903.72 ± 0.30a,β4.57 ± 1.04a,β8.94 ± 1.51a,α6.25 ± 2.73ab,αβ
1801.28 ± 0.90c,β2.51 ± 0.14bc,β7.93 ± 0.66a,α12.2 ± 6.1a,α
Cheese matrix/hole ratio 3253.7 ± 18.2a,α31.2 ± 8.0b,αβ17.8 ± 4.6a,β46.6 ± 16.4a,α
920.6 ± 5.7c,β33.6 ± 14.3b,αβ12.3 ± 1.6bc,γ37.3 ± 14.9ab,α
3035.0 ± 11.8b,αβ56.2 ± 22.2a,α17.9 ± 3.1a,β46.7 ± 8.6a,α
9026.0 ± 2.1bc,α21.6 ± 5.2c,αβ10.4 ± 2.1bc,β17.8 ± 9.8b,β
18068.1 ± 10.1a,α38.9 ± 2.3a,β11.7 ± 1.0c,γ24.0 ± 17.0b,βγ
a, b, c: Different letters within a column for the same textural characteristic indicate statistically significant differences (p < 0.05) related to ripening time. α, β, γ: Different letters within a row indicate statistically significant differences (p < 0.05) related to cheese variety. 1 Cheese variety (I-CLM, T-CLM, I-CL, and T-CL) according to Table 1. 2 Hole index (%): area percentage corresponding to holes. 3 Cheese matrix to hole ratio (matrix area/hole area).
Table 3. Magnetic Resonance Imaging parameters (mean values) of the four varieties of Spanish sheep cheese at different ripening times (RTs).
RT (Days)Cheese Variety 1
I-CLMT-CLMI-CLT-CL
T2 (ms)259.6 ± 1.5a,α45.3 ± 0.8a,β37.5 ± 3.6d,γ21.0 ± 0.7c,δ
947.0 ± 1.6b,α37.6 ± 1.1b,γ42.6 ± 1.3c,β22.2 ± 0.8c,δ
3045.2 ± 1.1c,β36.1 ± 0.7b,γ58.2 ± 1.4b,α36.4 ± 1.6b,γ
9044.1 ± 0.5cd,β34.6 ± 1.8b,γ57.9 ± 1.2b,α35.2 ± 1.5b,γ
18043.5 ± 1.1d,β27.6 ± 0.7c,γ60.4 ± 1.6a,α63.7 ± 1.8a,α
T1 (ms)2473.3 ± 12.3a,β499.1 ± 15.7a,β666.8 ± 15.6a,α662.0 ± 18.8a,α
9424.3 ± 15.4a,δ486.4 ± 11.4a,γ597.1 ± 16.7b,β659.6 ± 19.0a,α
30381.1 ± 9.6b,δ462.8 ± 9.3b,γ574.4 ± 15.3c,β602.0 ± 18.5b,α
90355.4 ± 9.9c,γ424.7 ± 9.5c,β569.5 ± 11.6cd,α549.4 ± 20.1c,α
180362.4 ± 7.3c,δ404.1 ± 5.4d,γ557.9 ± 5.7d,α485.8 ± 10.2d,β
ADC 2 (mm2/s, ×10−5)21.05 ± 0.14a,α0.92 ± 0.13a,α1.09 ± 0.23a,α0.89 ± 0.13a,α
90.96 ± 0.11a,α0.88 ± 0.11b,α0.75 ± 0.20b,α0.94 ± 0.13a,α
300.40 ± 0.08b,β0.55 ± 0.14c,αβ0.41 ± 0.11c,β0.74 ± 0.21b,α
900.39 ± 0.12b,β0.46 ± 0.12c,αβ0.37 ± 0.07c,β0.74 ± 0.20b,α
1800.38 ± 0.13b,α0.43 ± 0.13c,α0.32 ± 0.11c,α0.37 ± 0.13c,α
a, b, c, d: Different letters within a column for the same textural characteristic indicate statistically significant differences (p < 0.05) related to ripening time. α, β, γ, δ: Different letters within a row indicate statistically significant differences (p < 0.05) related to cheese variety. 1 Cheese variety (I-CLM, T-CLM, I-CL, and T-CL) according to Table 1. 2 ADC = apparent diffusion coefficient.
Table 4. Texture parameters of the four varieties of Spanish sheep cheese 1 at different ripening times (RTs).
RT (Days)I-CLM T-CLM I-CL T-CL
Hardness (N)222.2 ± 1.5c,α13.7 ± 3.3c,γ15.0 ± 0.8c,γ18.9 ± 3.0bc,β
925.8 ± 3.7c,α25.8 ± 3.1b,α17.7 ± 1.7b,β15.4 ± 2.7c,β
3027.5 ± 6.7bc,α26.7 ± 4.3ab,α18.3 ± 1.8b,β21.1 ± 1.5b,β
9034.1 ± 3.2b,α29.8 ± 6.3a,α21.0 ± 1.9b,β31.8 ± 6.6a,α
18042.1 ± 4.3a,α31.0 ± 5.6a,β30.1 ± 2.6a,β31.2 ± 5.3a,β
Adhesiveness (N × s)2−0.104 ± 0.022c,α−0.021 ± 0.006c,γ−0.047 ± 0.010c,βγ−0.065 ± 0.019c,β
9−0.110 ± 0.047b,α−0.056 ± 0.029b,β−0.042 ± 0.004c,γ−0.105 ± 0.023bc,αβ
30−0.129 ± 0.048b,α−0.070 ± 0.022b,β−0.077 ± 0.010b,β−0.142 ± 0.028b,α
90−0.146 ± 0.012b,β−0.269 ± 0.077a,α−0.067 ± 0.008b,γ−0.325 ± 0.113a,α
180−0.251 ± 0.050a,β−0.332 ± 0.107a,α−0.116 ± 0.024a,γ−0.315 ± 0.114a,α
Springiness (cm)20.059 ± 0.014c,γ0.170 ± 0.048c,β0.069 ± 0.006c,γ0.250 ± 0.035c,α
90.109 ± 0.022b,γ0.175 ± 0.010c,β0.096 ± 0.025b,γ0.309 ± 0.024b,α
300.116 ± 0.021b,γ0.193 ± 0.038bc,β0.107 ± 0.020b,γ0.328 ± 0.021ab,α
900.168 ± 0.053a,γ0.225 ± 0.016b,β0.114 ± 0.027b,γ0.340 ± 0.043a,α
1800.160 ± 0.024a,β0.330 ± 0.035a,α0.193 ± 0.038a,β0.398 ± 0.044a,α
Cohesiveness20.670 ± 0.030a,β0.743 ± 0.037a,α0.661 ± 0.021a,β0.292 ± 0.034a,γ
90.615 ± 0.056ab,α0.609 ± 0.030b,α0.578 ± 0.066b,α0.248 ± 0.011b,β
300.598 ± 0.042b,α0.442 ± 0.034c,β0.466 ± 0.031c,β0.243 ± 0.024b,γ
900.407 ± 0.061c,α0.412 ± 0.038c,α0.343 ± 0.011d,β0.156 ± 0.013c,γ
1800.339 ± 0.039c,α0.276 ± 0.033d,β0.273 ± 0.023e,β0.154 ± 0.020c,γ
Gumminess (N)214.9 ± 1.8a,α10.2 ± 1.9b,β9.90 ± 1.17a,β5.53 ± 1.21a,γ
915.9 ± 2.3a,α15.7 ± 1.8a,α10.2 ± 1.6a,β3.82 ± 0.80b,γ
3016.5 ± 2.8a,α11.8 ± 2.3b,β8.53 ± 1.06ab,β5.14 ± 0.35a,γ
9013.9 ± 3.3b,α12.3 ± 3.0ab,α7.20 ± 1.26b,β4.97 ± 1.18a,γ
18014.3 ± 1.7ab,α8.56 ± 2.35b,β8.20 ± 1.27b,β4.80 ± 1.27a,γ
Chewiness (J)20.009 ± 0.003b,β0.017 ± 0.005b,α0.007 ± 0.001b,β0.014 ± 0.006a,α
90.017 ± 0.004ab,β0.028 ± 0.003a,α0.010 ± 0.003b,γ0.012 ± 0.003a,βγ
300.019 ± 0.008a,α0.023 ± 0.007a,α0.009 ± 0.002b,β0.017 ± 0.002a,α
900.023 ± 0.006a,α0.028 ± 0.006a,α0.008 ± 0.002b,γ0.017 ± 0.009a,β
1800.023 ± 0.005a,α0.028 ± 0.006a,α0.016 ± 0.003a,β0.019 ± 0.005a,αβ
a, b, c: Different letters within a column for the same textural characteristic texture parameter indicate statistically significant differences (p < 0.05) related to ripening time. α, β, γ: Different letters within a row indicate statistically significant differences (p < 0.05) related to cheese variety. 1 Cheese variety (I-CLM, T-CLM, I-CL, and T-CL) according to Table 1.
Table 5. Statistical parameters of the regression models a considering the MRI parameters (T1 and T2), the physicochemical and texture parameters, and the ripening time (RT).
I-CLM bT-CLMI-CLT-CL
R2 cR2*RMSEp-ValueR2R2*RMSEp-ValueR2R2*RMSEp-ValueR2R2*RMSEp-Value
RT (days) dLinearT10.510.5047.560.00010.740.7327.360.00010.390.3853.110.00010.790.7822.630.0001
T20.350.3354.890.00010.760.7533.60.00010.530.5246.440.00010.780.7721.750.0001
Ln 0.930.920.4520.00010.950.940.360.00010.900.890.5380.00010.910.900.5180.0001
awLinearT10.700.690.0050.00010.740.730.010.00010.390.370.020.00010.710.700.0110.0001
T20.490.480.0060.00010.720.710.0090.00010.570.560.0620.00010.710.710.0080.0001
Ln 0.800.780.0040.00010.940.940.0060.00010.750.720.0180.00010.930.920.0080.0001
WC (%) dLinearT10.700.692.880.00010.680.672.200.00010.560.544.430.00010.790.781.3420.0001
T20.530.524.410.00010.620.612.890.00010.770.762.40.00010.750.742.010.0001
Ln 0.860.850.0630.00010.770.750.0550.00010.930.920.0520.00010.940.940.0250.0001
Hardness (N)LinearT10.510.505.810.00010.410.405.9650.00010.500.493.9720.00010.750.753.9330.0001
T20.440.436.1990.00010.640.634.6540.00010.440.434.1840.00010.410.406.0590.0001
Ln 0.780.770.1270.00010.870.860.1330.00010.720.700.1370.00010.870.860.1220.0001
Adhesiveness (N × s)LinearT10.320.300.0550.00010.690.690.0640.00010.360.350.0240.00010.690.680.0740.0001
T20.250.240.0580.00020.580.570.0920.00010.520.510.0210.00010.400.390.1020.0001
Ln 0.540.510.3570.00010.860.860.4290.00010.710.690.2230.00010.800.790.330.0001
Springiness (m)LinearT10.640.640.00020.00010.570.560.00040.00010.380.370.00040.00010.510.500.00040.0001
T20.550.540.00030.00010.510.500.00040.00010.420.410.00040.00010.540.540.00040.0001
Ln 0.830.820.1840.00010.710.700.1690.00010.670.640.2610.00010.700.680.1130.0001
CohesivenessLinearT10.520.510.0860.00010.720.710.0620.00010.600.590.0950.00010.720.720.0250.0001
T20.420.400.1060.00010.730.730.0580.00010.670.660.0720.00010.510.500.0420.0001
Ln 0.710.690.160.00010.950.950.0780.00010.750.730.1750.00010.890.890.0940.0001
a Ln = logarithmic regression model according to Section 2. b Cheese variety (I-CLM, T-CLM, I-CL, and T-CL) according to Table 1. c R2 = coefficient of determination, R2* = adjusted coefficient of determination, and RMSE = root mean square error. d RT = ripening time (days); WC = water content (%).
Disclaimer/Publisher’s Note: The statements, opinions and data contained in all publications are solely those of the individual author(s) and contributor(s) and not of MDPI and/or the editor(s). MDPI and/or the editor(s) disclaim responsibility for any injury to people or property resulting from any ideas, methods, instructions or products referred to in the content.

