
Chemical Characterization, Stability and Sensory Evaluation of Sicilian Extra Virgin Olive Oils: Healthiness Evidence at Nose Reach

 ,
,  , , ,
, , ,
Abstract
1. Introduction
2. Materials and Methods
2.1. Chemicals
2.2. Extra Virgin Olive Oil Samples Collection
2.3. Extraction of Free Fatty Acids
2.4. Spectrophotometric Determination with UV
2.5. Determination of Total Polyphenols by Near Infrared Spectroscopy
2.6. Extraction and Determination of Phenolic Compounds
2.7. Standard Solution of Phenolic Compounds
2.8. Determination of Phenolic Compounds by UPLC-HESI-HRMS
2.9. Determination of Fatty Acids Profile by GC/MS
2.10. Sensory Evaluation and Panel Test
2.11. Stability Evaluation of EVOOs
3. Results
4. Discussion
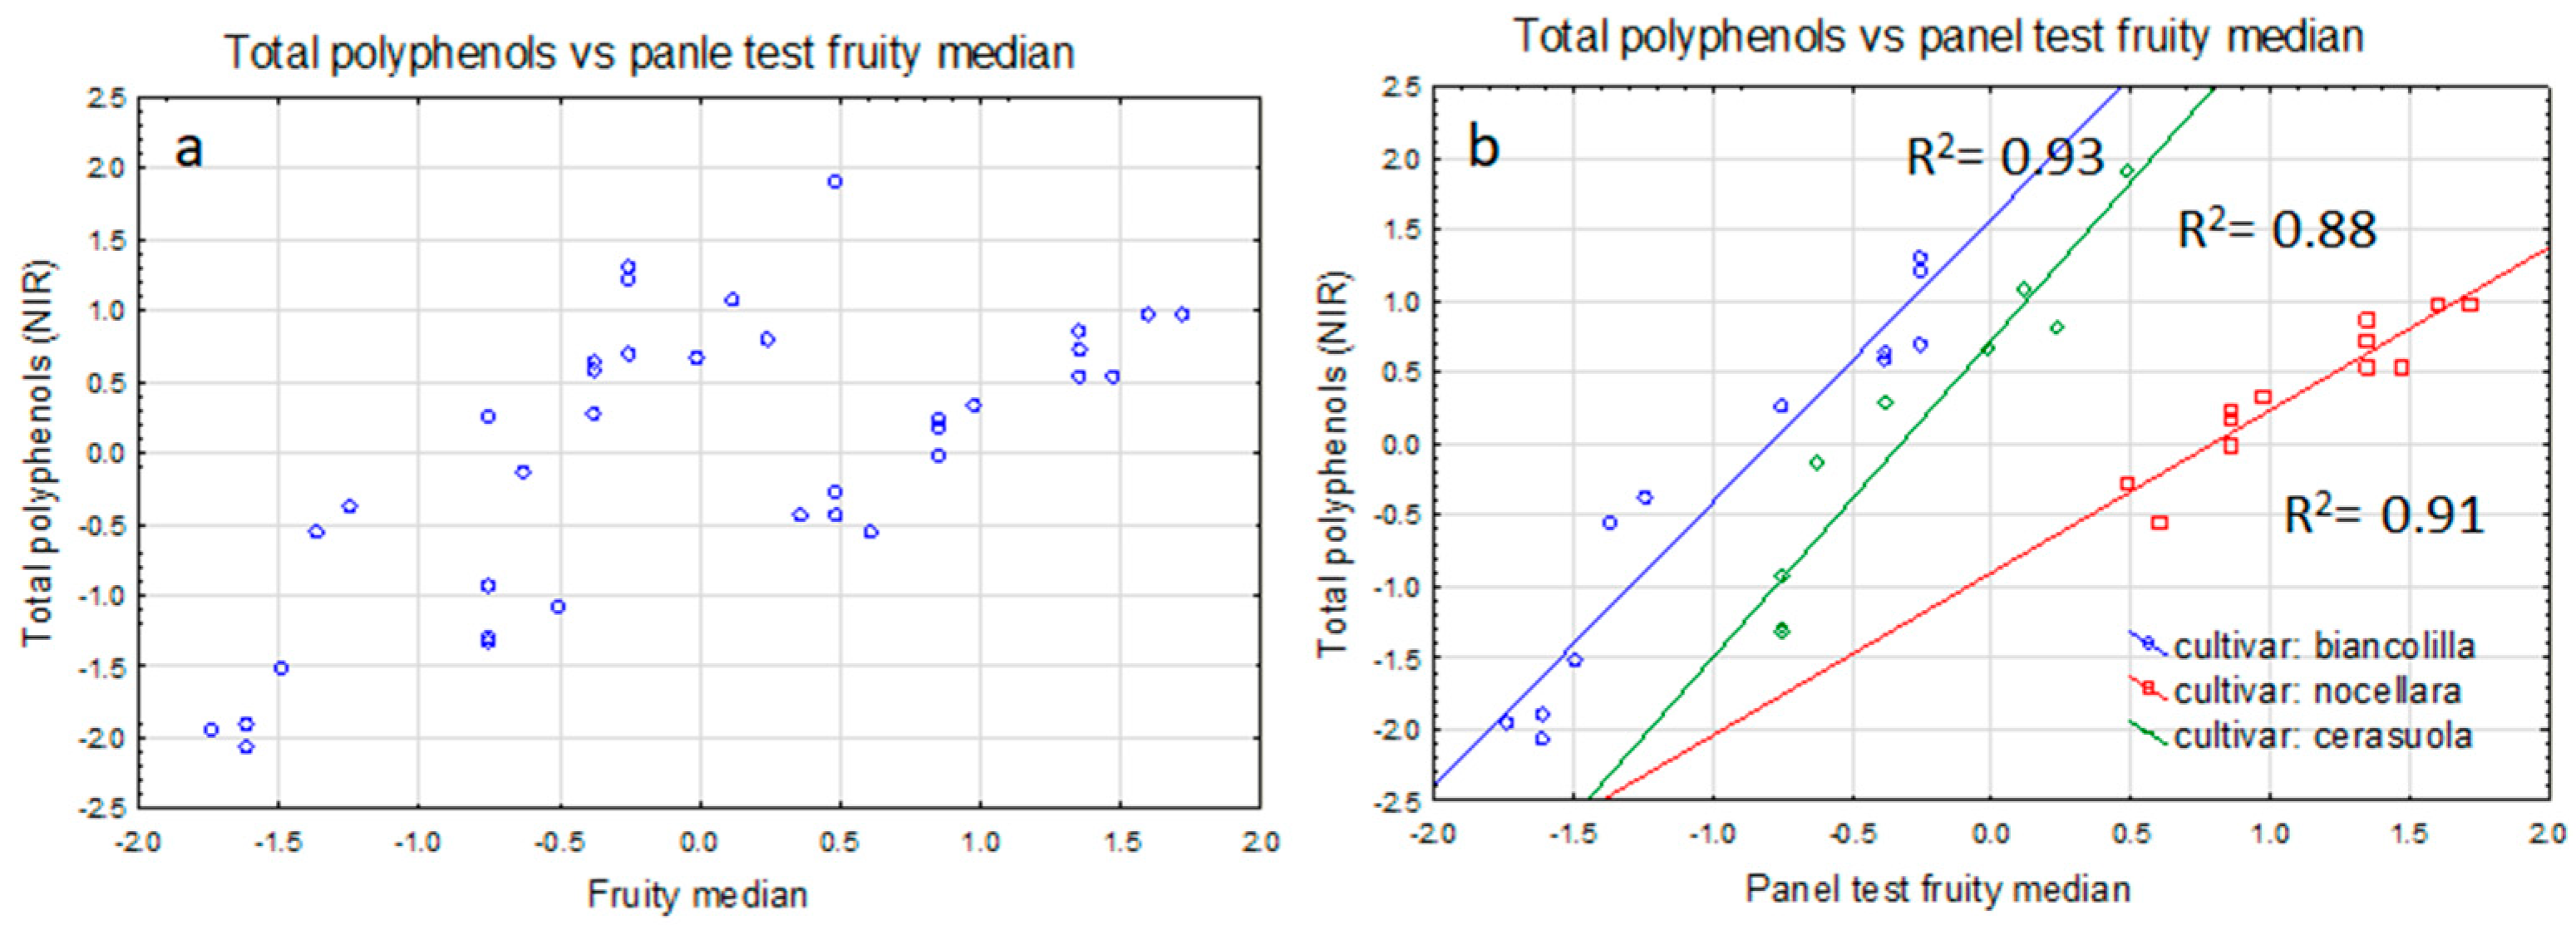
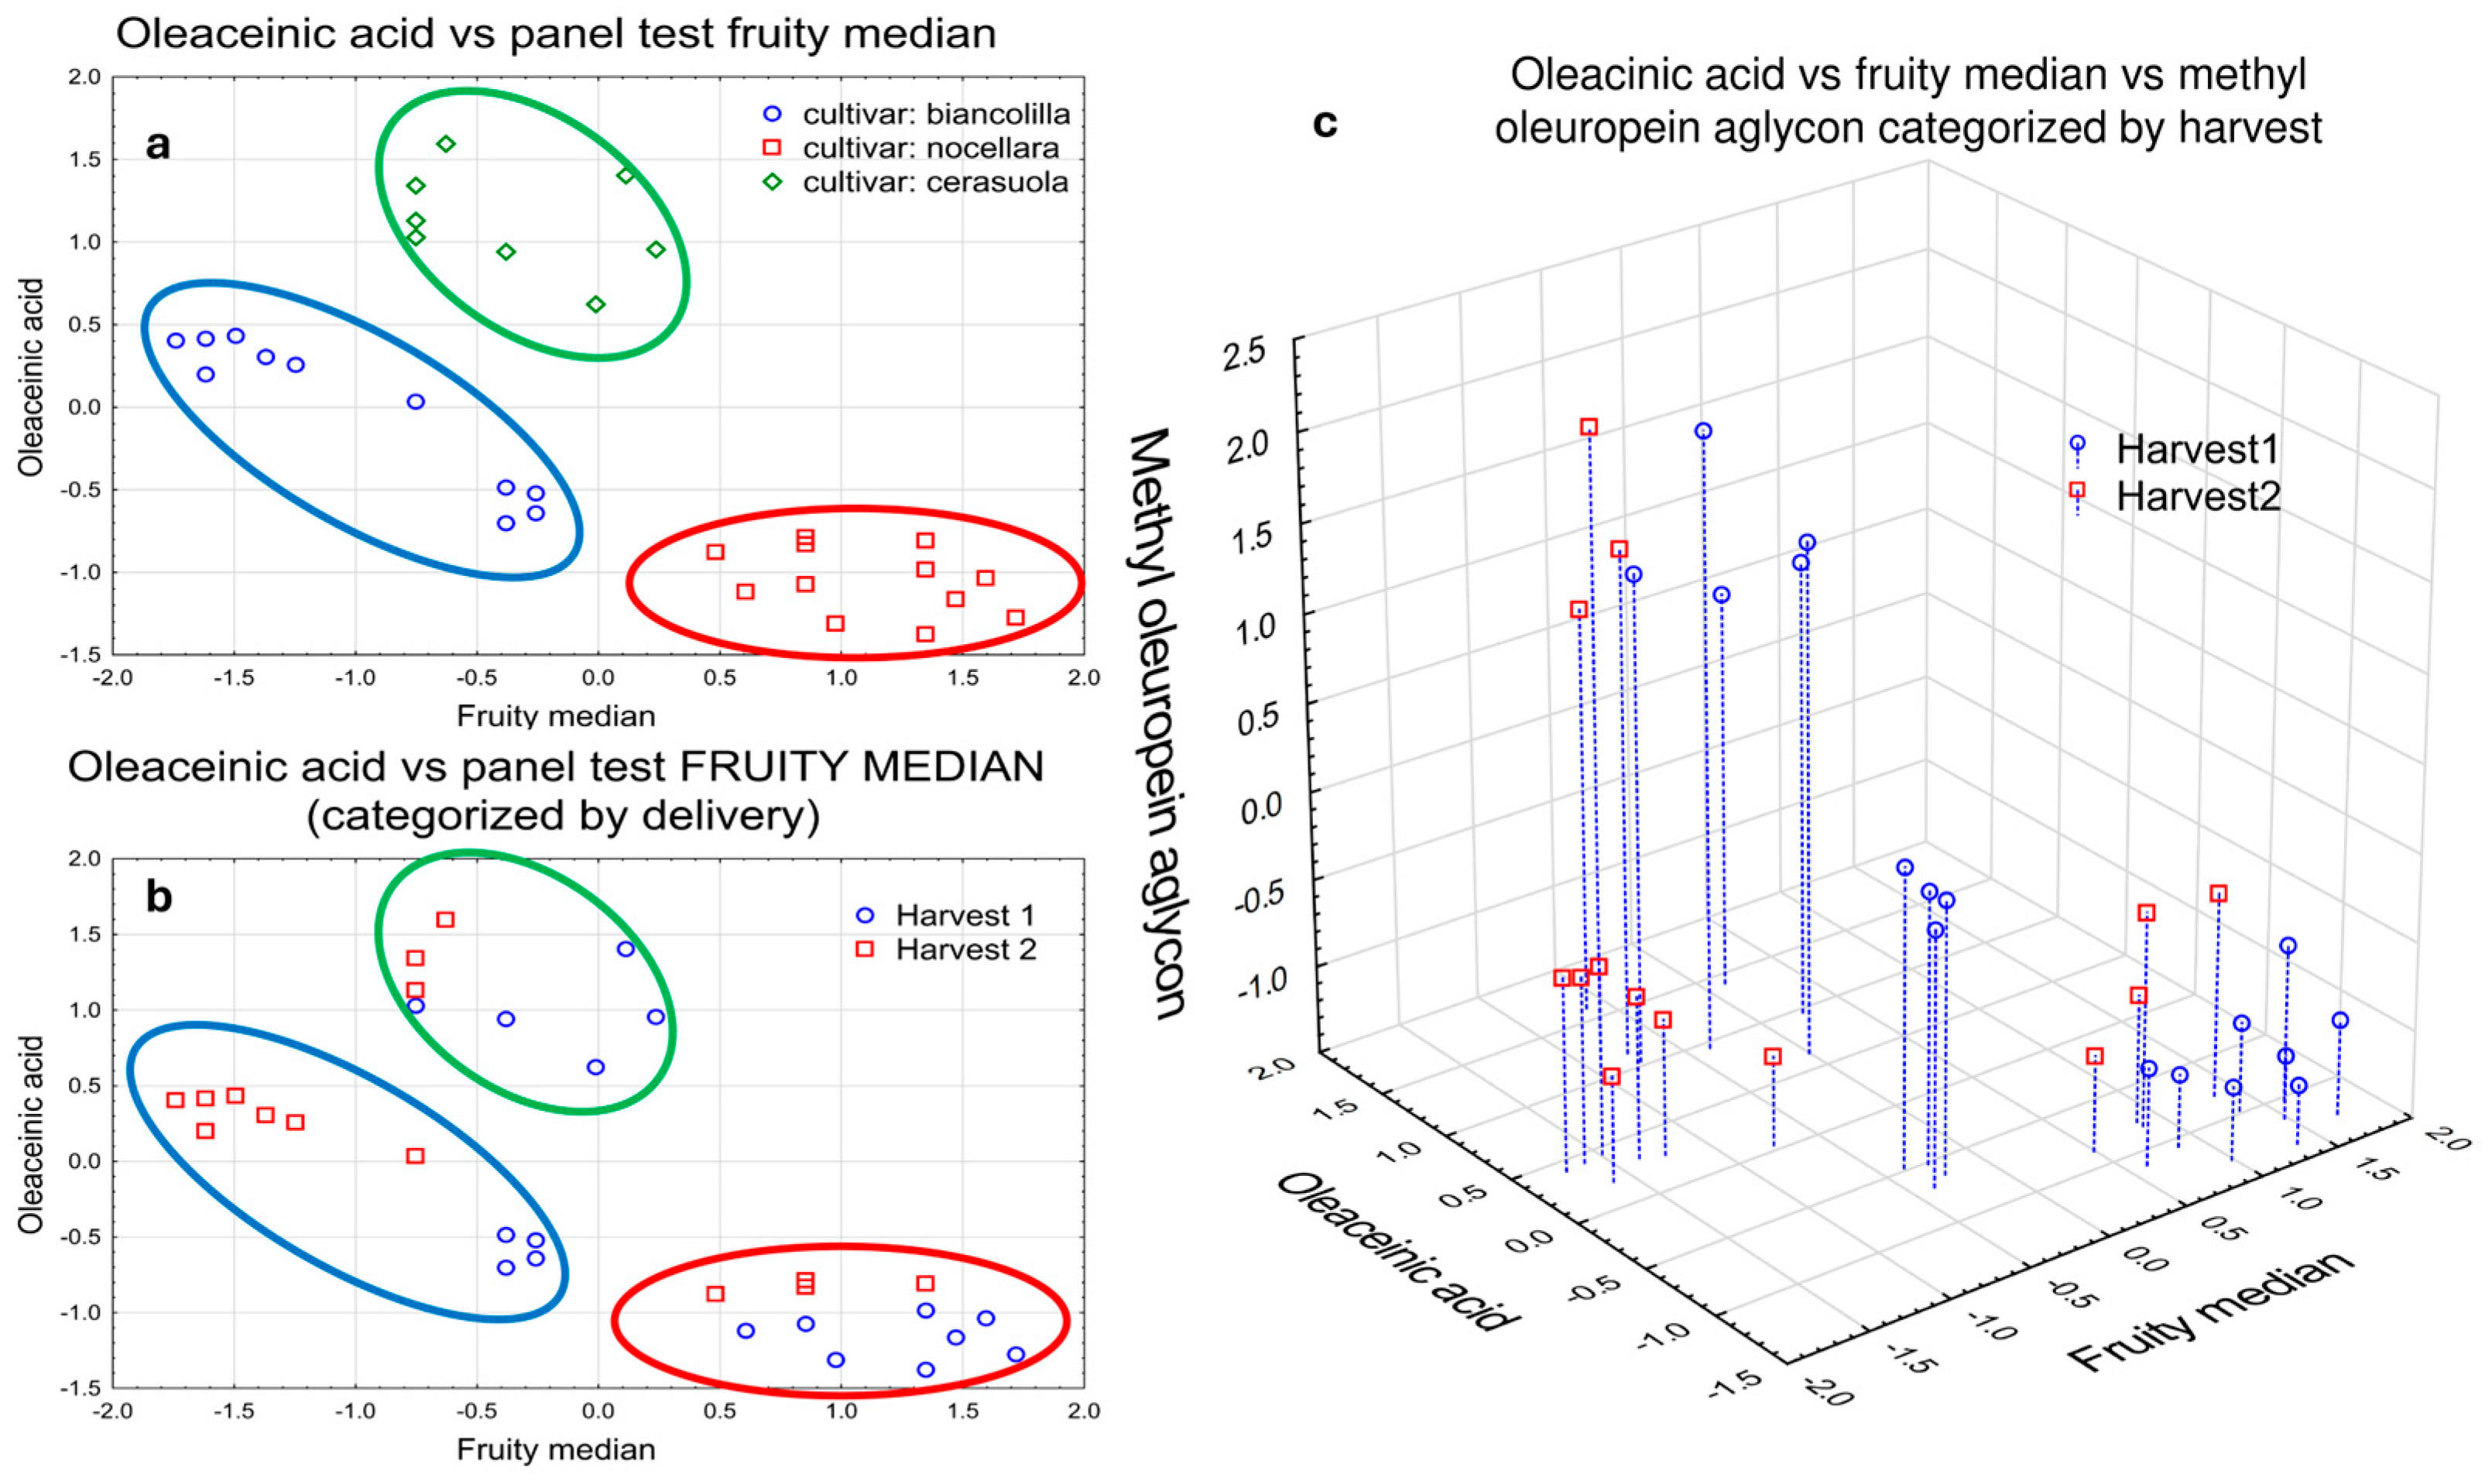
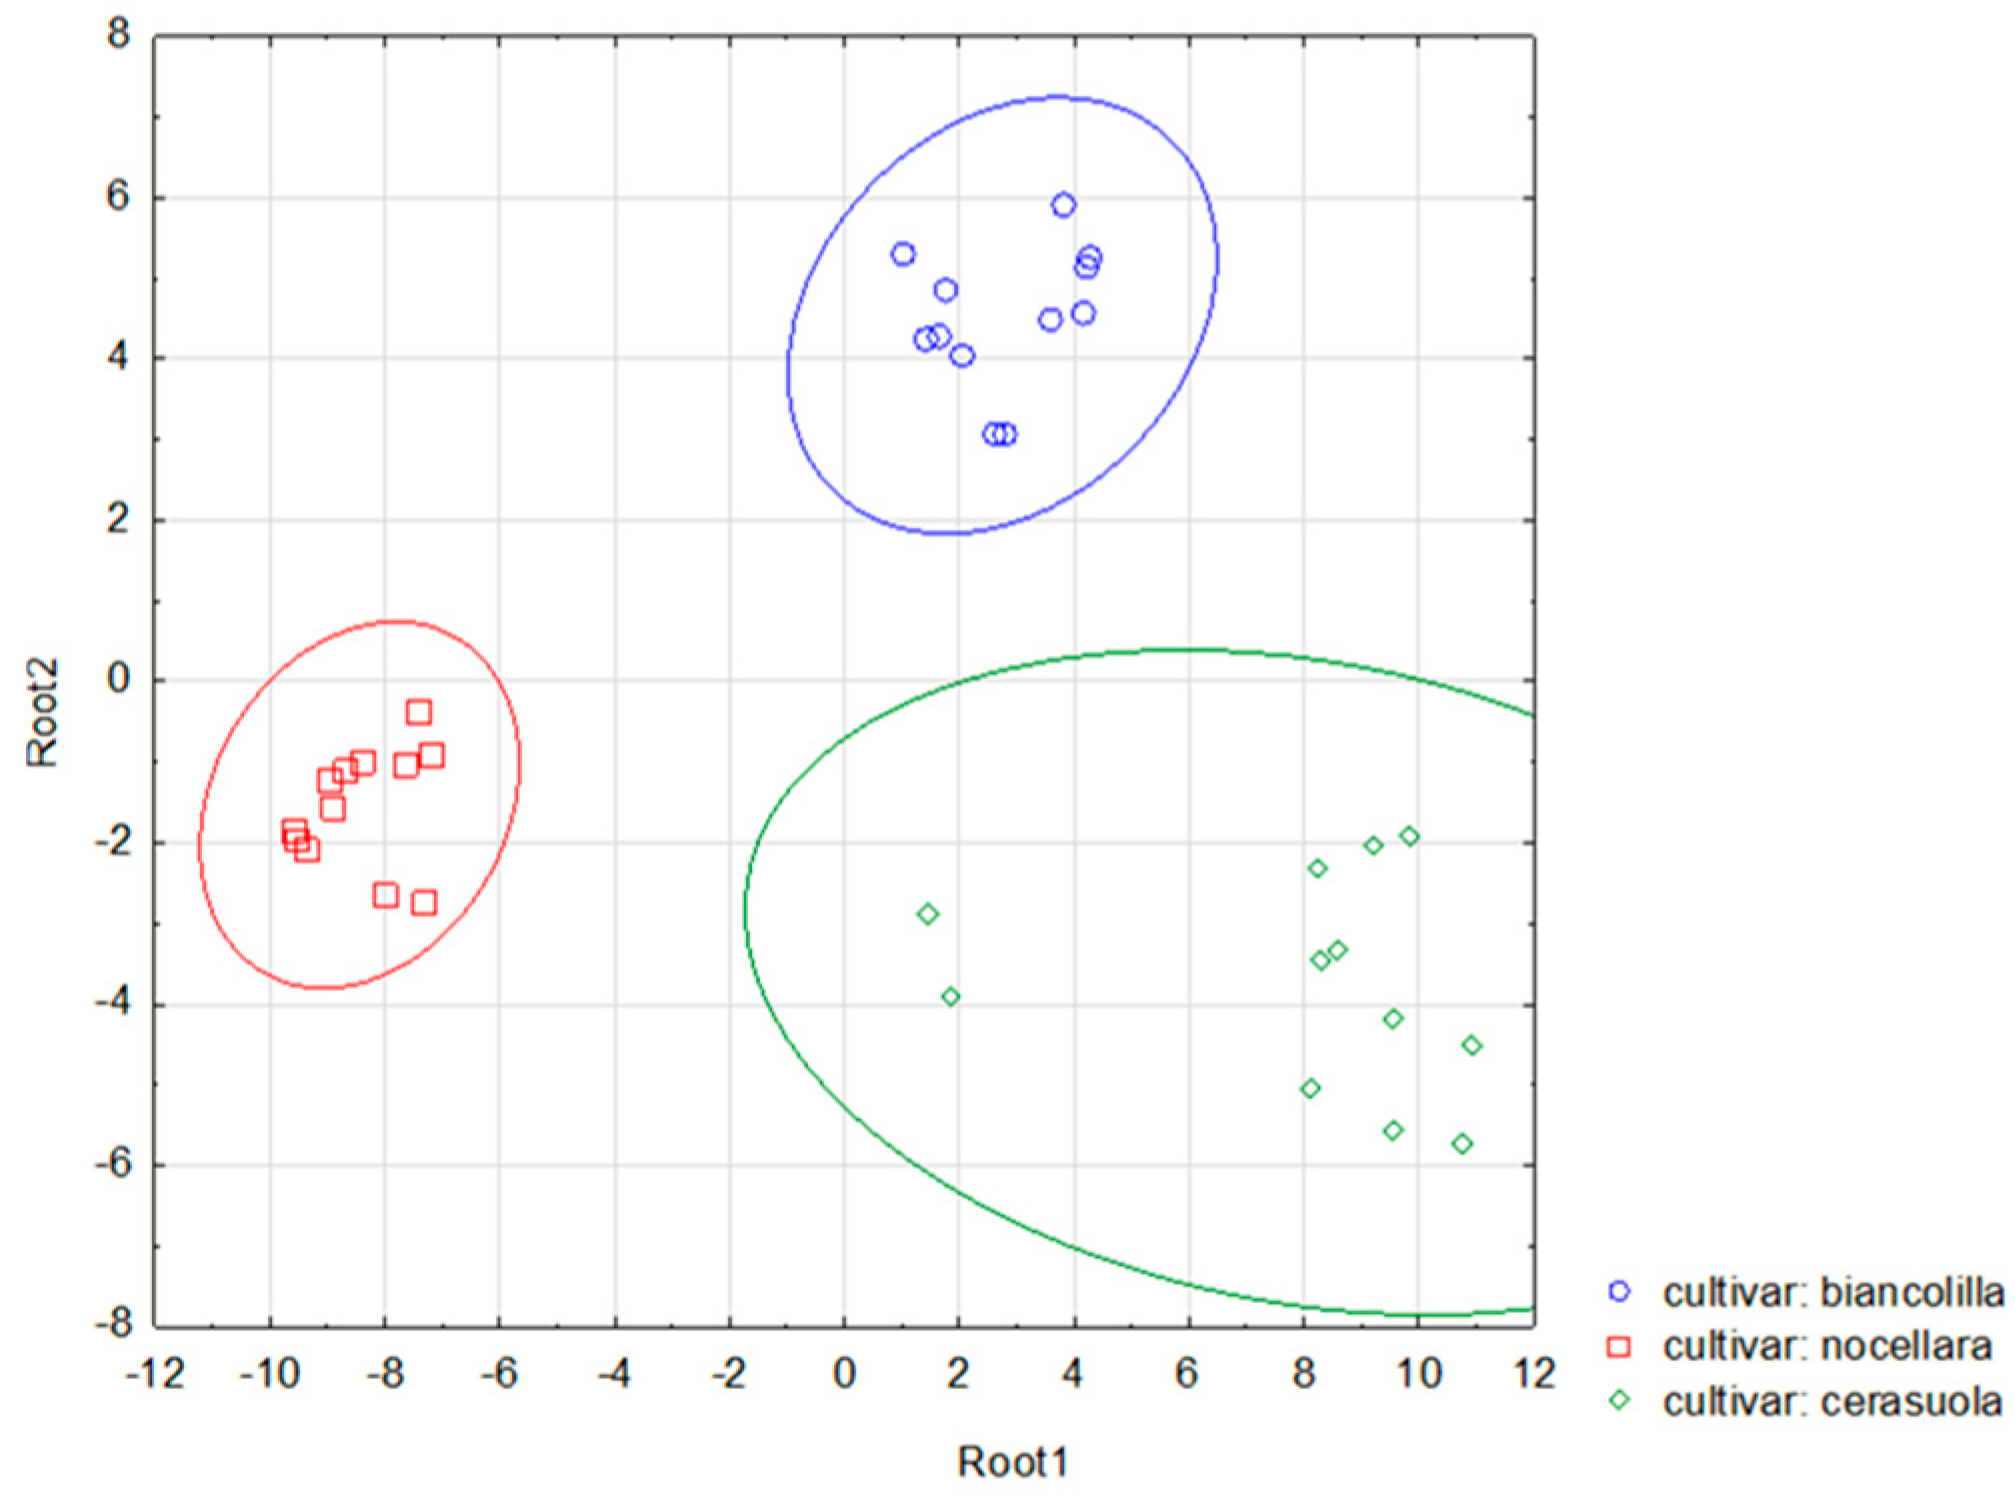
4.1. Statistical Analysis
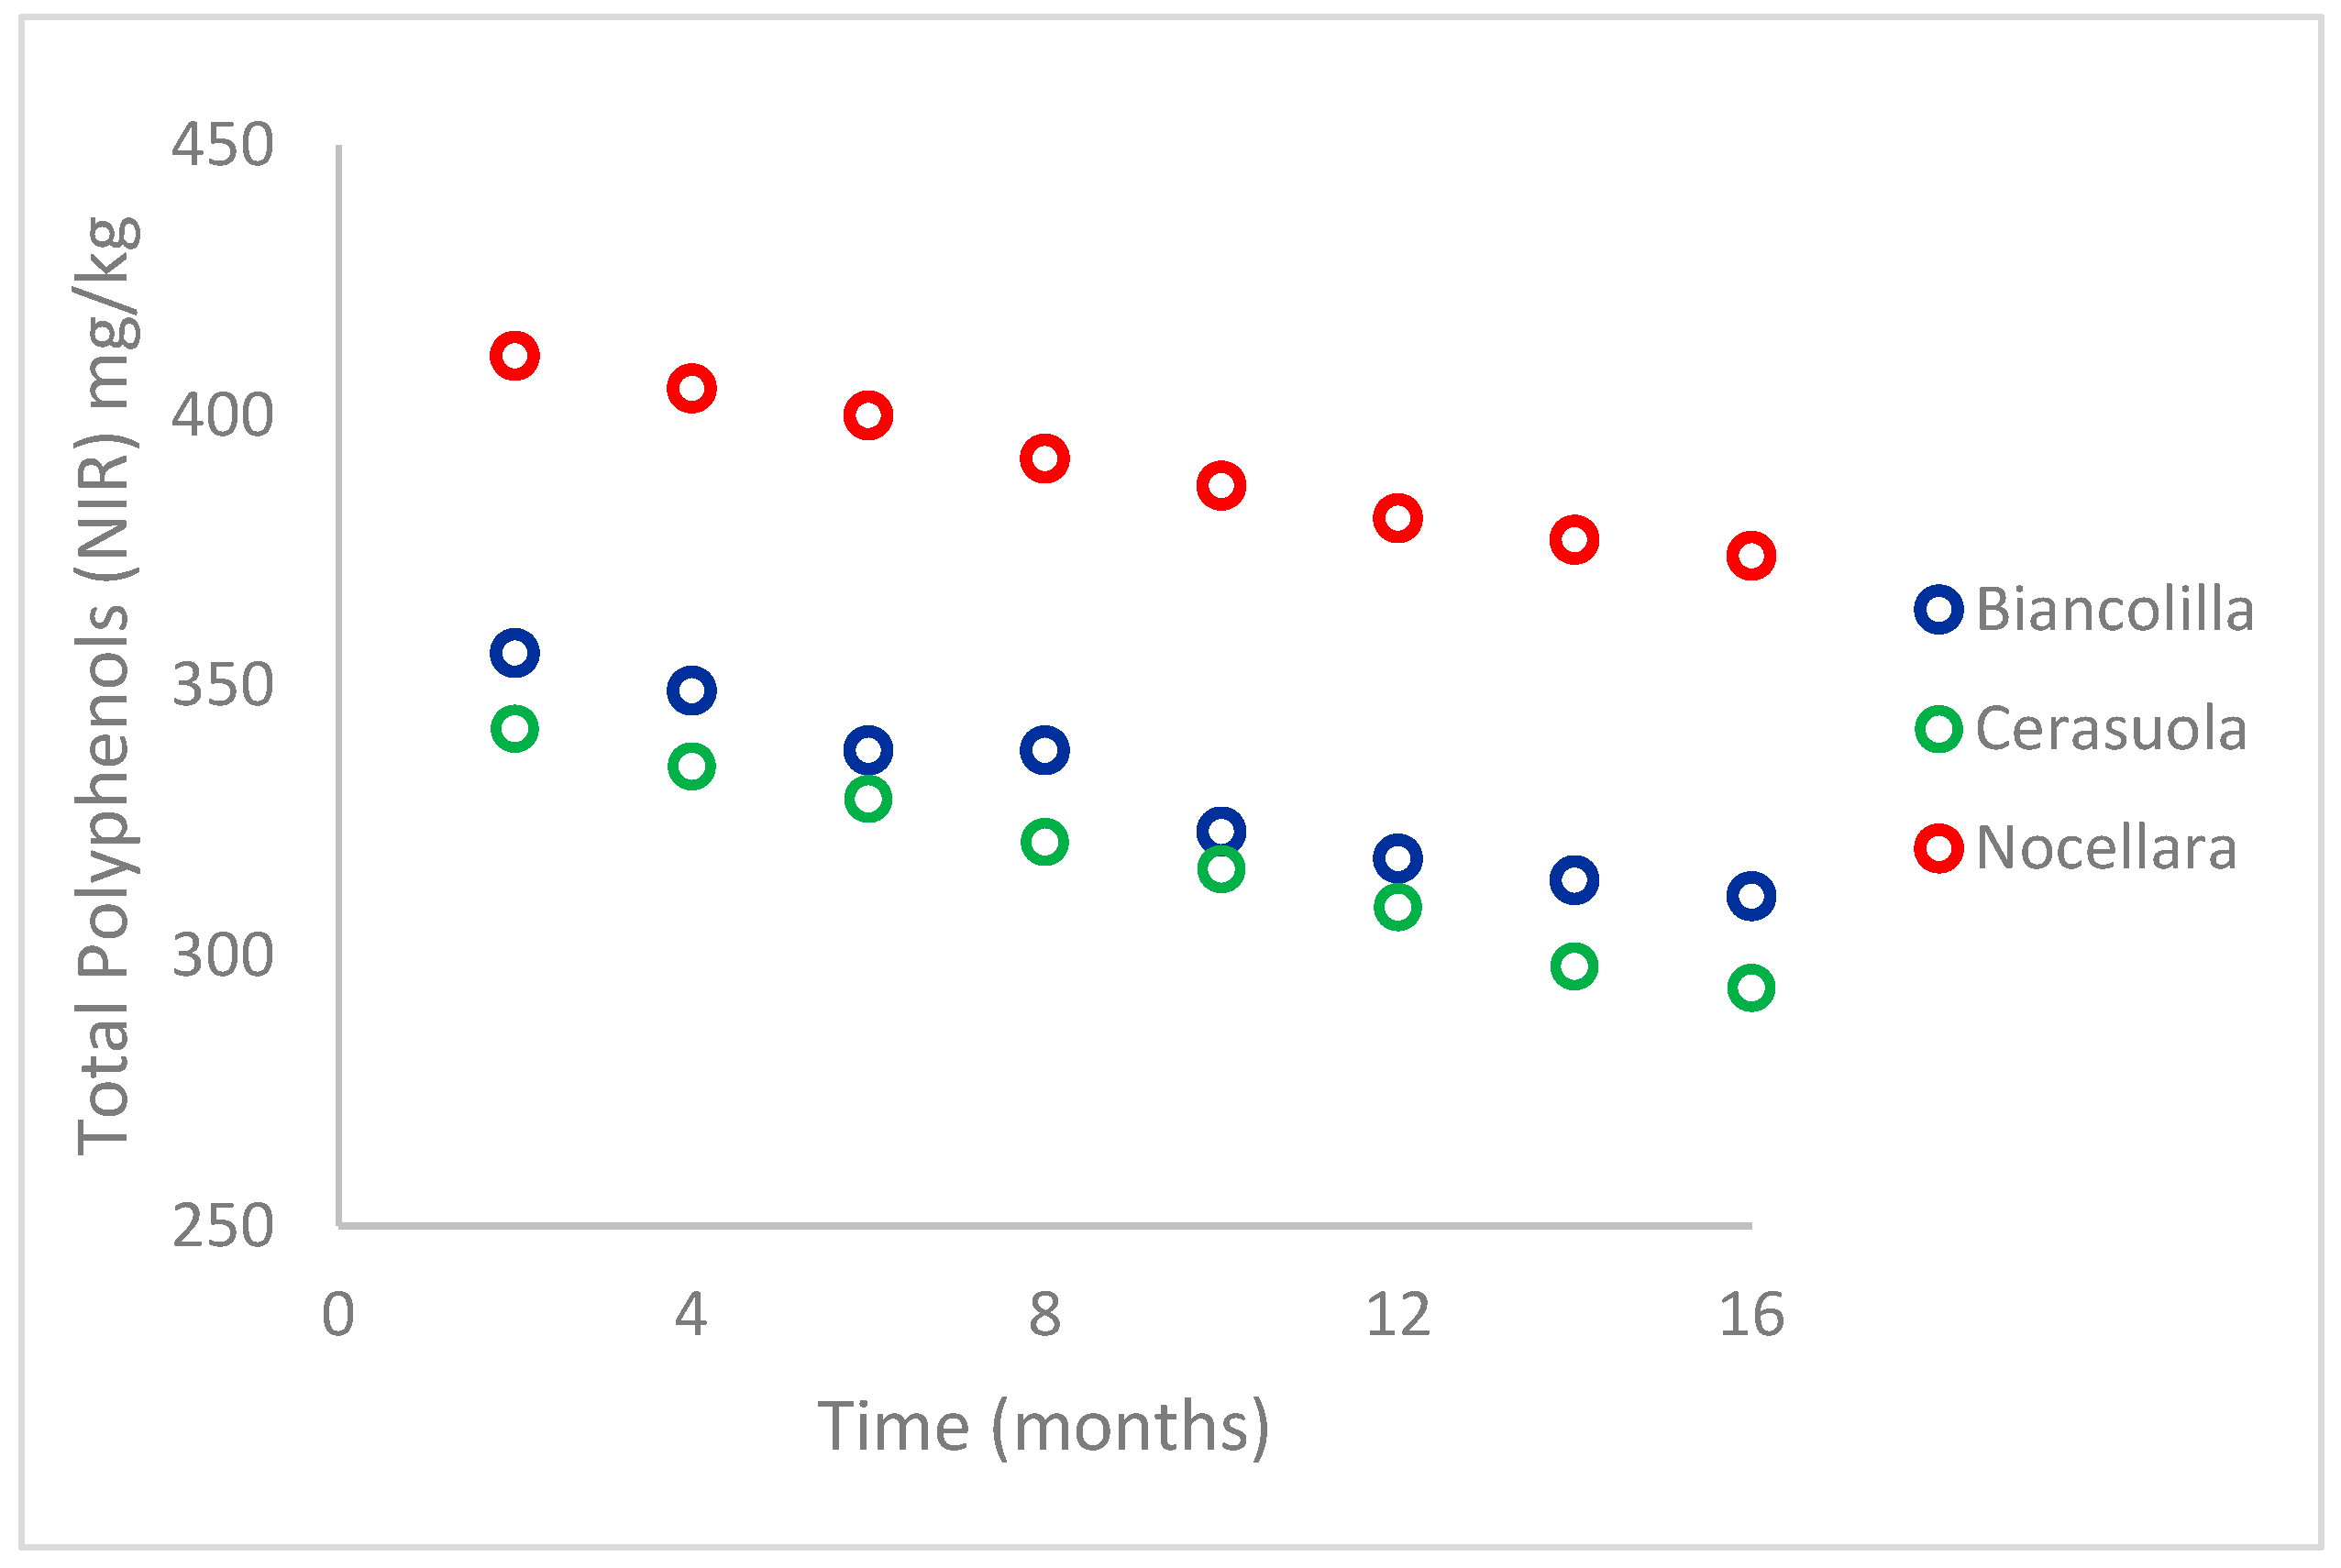
4.2. EVOOs Stability Evaluation
5. Conclusions
Author Contributions
Funding
Institutional Review Board Statement
Informed Consent Statement
Data Availability Statement
Conflicts of Interest
Abbreviations
References
- Bongiorno, D.; Di Stefano, V.; Indelicato, S.; Avellone, G.; Ceraulo, L. Bio-phenols determination in olive oils: Recent mass spectrometry approaches. Mass Spectrom. Rev. 2023, 42, 1462–1502. [Google Scholar] [CrossRef] [PubMed]
- DeFelice, S.L. The nutraceutical revolution: Its impact on food industry R&D. Trends Food Sci. Technol. 1995, 6, 59–61. [Google Scholar]
- Martın-Pelaez, S.; Covas, M.I.; Fitó, M.; Kusar, A.; Pravst, I. Health effects of olive oil polyphenols: Recent advances and possibilities for the use of health claims. Mol. Nutr. Food Res. 2013, 57, 760–771. [Google Scholar] [CrossRef]
- Servili, M.; Sordini, B.; Esposto, S.; Urbani, S.; Veneziani, G.; Di Maio, I.; Selvaggini, R.; Taticchi, A. Biological Activities of Phenolic Compounds of Extra Virgin Olive Oil. Antioxidants 2014, 3, 1–23. [Google Scholar] [CrossRef] [PubMed]
- Ghanbari, R.; Anwar, F.; Alkharfy, K.M.; Gilani, A.-M.; Saari, N. Valuable Nutrients and Functional Bioactives in Different Parts of Olive (Olea europaea L.): A Review. Int. J. Mol. Sci. 2012, 13, 3291–3340. [Google Scholar] [CrossRef]
- Genovese, A.; Yang, N.; Linforth, R.; Sacchi, R.; Fisk, I. The role of phenolic compounds on olive oil aroma release. Food Res. Int. 2018, 112, 319–327. [Google Scholar] [CrossRef] [PubMed]
- Visioli, F.; Davalos, A.; López de Las Hazas, M.C.; Crespo, M.C.; Tomé-Carneiro, J. An overview of the pharmacology of olive oil and its active ingredients. Br. J. Pharmacol. 2020, 177, 1316–1330. [Google Scholar] [CrossRef]
- Piccolella, S.; Pacifico, S. Plant-derived polyphenols: A chemopreventive and chemoprotectant worth-exploring resource in toxicology. In Advances in Molecular Toxicology; Fishbein, J.C., Heilman, J.M., Eds.; Elsevier: Amsterdam, The Netherlands, 2015; Volume 9, pp. 161–214. [Google Scholar]
- Obied, H.K.; Prenzler, P.D.; Omar, S.H.; Ismael, R.; Servili, M.; Esposto, S.; Taticchi, A.; Selvaggini, R.; Urbani, S. Pharmacology of Olive Biophenols. Adv. Mol. Toxicol. 2012, 6, 195–242. [Google Scholar]
- Benito, M.; Lasa, J.M.; Gracia, P.; Oria, R.; Abenoza, M.; Varona, L.; Sánchez-Gimeno, A.C. Olive oil quality and ripening in super-high-density Arbequina orchard. J. Sci. Food Agric. 2013, 93, 2207–2220. [Google Scholar] [CrossRef]
- European Commission. Commission Regulation (EU) 432/2012. Off. J. Eur. Union 2012, 136, 1–40. [Google Scholar]
- Servili, M. The phenolic compounds: A commercial argument in the economic war to come on the quality of olive oil? OCL 2014, 21, D509. [Google Scholar] [CrossRef]
- Celano, R.; Piccinelli, A.L.; Pugliese, A.; Carabetta, S.; Di Sanzo, R.; Rastrelli, L.; Russo, M. Insights into the analysis of phenolic secoiridoids in extra virgin olive oil. J. Agric. Food Chem. 2018, 66, 6053–6063. [Google Scholar] [CrossRef] [PubMed]
- Servili, M.; Esposto, S.; Fabiani, R.; Urbani, S.; Taticchi, A.; Mariucci, F.; Selvaggini, R.; Montedori, G.F. Phenolic compounds in olive oil: Antioxidant, health and organoleptic activities according to their chemical structure. Inflammopharmacology 2009, 17, 76–84. [Google Scholar] [CrossRef]
- Lucci, P.; Saurina, J.; Núñez, O. Trends in LC-MS and LC-HRMS analysis and characterization of polyphenols in food. TrAC Trends Anal. Chem. 2017, 88, 1–24. [Google Scholar] [CrossRef]
- López-Fernández, O.; Domínguez, R.; Pateiro, M.; Munekata, P.E.; Rocchetti, G.; Lorenzo, J.M. Determination of polyphenols using liquid chromatography–tandem mass spectrometry technique (LC–MS/MS): A review. Antioxidants 2020, 9, 479. [Google Scholar] [CrossRef]
- Farré, M.; Picó, Y.; Barceló, D. Direct analysis in real-time high-resolution mass spectrometry as a valuable tool for polyphenols profiling in olive oil. Anal. Methods 2019, 11, 472–482. [Google Scholar] [CrossRef]
- Junsai, T.; Poapolathep, S.; Sutjarit, S.; Giorgi, M.; Zhang, Z.; Logrieco, A.F.; Li, P.; Poapolathep, A. Determination of multiple mycotoxins and their natural occurrence in edible vegetable oils using liquid chromatography–tandem mass spectrometry. Foods 2021, 10, 2795. [Google Scholar] [CrossRef]
- Indelicato, S.; Bongiorno, D.; Ceraulo, L.; Emmanuello, C.; Mazzotti, F.; Siciliano, C.; Piazzese, D. One-pot analysis: A new integrated methodology for determination of TAG and FA determination through LC/MS and in-silico saponification. Food Anal. Methods 2018, 11, 873–882. [Google Scholar] [CrossRef]
- Aiello, D.; Siciliano, C.; Mazzotti, F.; Di Donna, L.; Risoluti, R.; Napoli, A. Protein Extraction, Enrichment and MALDI MS and MS/MS analysis from bitter orange leaves (Citrus aurantium). Molecules 2020, 25, 1485. [Google Scholar] [CrossRef]
- Chiang, C.K.; Chen, W.T.; Chang, H.T. Nanoparticle-based mass spectrometry for the analysis of biomolecules. Chem. Soc. Rev. 2011, 40, 1269–1281. [Google Scholar] [CrossRef]
- Indelicato, S.; Bongiorno, D.; Ceraulo, L.; Calabrese, V.; Piazzese, D.; Napoli, A.; Mazzotti, F.; Avellone, G.; Di Stefano, V.; Turco Liveri, V. Electrospray ion mobility mass spectrometry of positively and negatively charged (1R,2S)-dodecyl(2-hydroxy-1-methyl-2-phenylethyl)dimethylammonium bromide aggregates. Rapid Commun. Mass Spectrom. 2016, 30, 230–238. [Google Scholar] [CrossRef] [PubMed]
- International Olive Council Method. Determination of Free Fatty Acids, Cold Method COI 2017 T.20, Doc. No 34, Rev. 1. Available online: https://www.internationaloliveoil.org/wp-content/uploads/2019/11/COI-T.20-Doc.-No-34-Rev.-1-2017.pdf (accessed on 1 July 2024).
- International Olive Council Method. Spectrophotometric Investigation in the Ultraviolet. COI 2015 T.20, Doc. No 19, Rev. 3. Available online: https://www.internationaloliveoil.org/wp-content/uploads/2022/10/COI-T20-Doc-19-REV-3-2015-Eng.pdf (accessed on 1 July 2024).
- Grilo, F.; Novara, M.E.; D’Oca, M.C.; Rubino, S.; Lo Bianco, R.; Di Stefano, V. Quality evaluation of extra-virgin olive oils from Sicilian genotypes grown in a high-density system. Int. J. Food Sci. Nutr. 2020, 71, 397–409. [Google Scholar] [CrossRef]
- Dugo, L.; Russo, M.; Cacciola, F.; Mandolfino, F.; Salafia, F.; Vilmercati, A.; Fanali, C.; Casale, M.; De Gara, L.; Dugo, P.; et al. Determination of the Phenol and Tocopherol Content in Italian High-Quality Extra-Virgin Olive Oils by Using LC-MS and Multivariate Data Analysis. Food Anal. Methods 2020, 13, 1027–1041. [Google Scholar] [CrossRef]
- Rózanska, A.; Russo, M.; Cacciola, F.; Salafia, F.; Polkowska, Z.; Dugo, P.; Mondello, L. Concentration of Potentially Bioactive Compounds in Italian Extra Virgin Olive Oils from Various Sources by Using LC-MS and Multivariate Data Analysis. Foods 2020, 9, 1120. [Google Scholar] [CrossRef]
- Ricciutelli, M.; Marconi, S.; Borelli, M.C.; Caprioli, G.; Sagratini, G.; Ballini, R.; Fiorini, D. Olive oil polyphenols: A quantitative method by high-performance liquid chromatography-diode-array detection for their determination and the assessment of the related health claim. J. Chromatogr. A 2017, 1481, 53–63. [Google Scholar] [CrossRef] [PubMed]
- Dini, I.; Graziani, G.; Gaspari, A.; Fedele, F.L.; Sicari, A.; Vinale, F.; Cavallo, P.; Lorito, M.; Ritieni, A. New Strategies in the Cultivation of Olive Trees and Repercussions on the Nutritional Value of the Extra Virgin Olive Oil. Molecules 2020, 25, 2345. [Google Scholar] [CrossRef] [PubMed]
- Kanakis, P.; Termentzi, A.; Michel, T.; Gikas, E.; Halabalaki, M.; Skaltsounis, A.L. From Olive Drupes to Olive Oil. An HPLC-Orbitrap-based Qualitative and Quantitative Exploration of Olive Key Metabolites. Planta Med. 2013, 79, 1576–1587. [Google Scholar] [CrossRef] [PubMed]
- International Olive Council Method. Sensory Analysis of Olive Oil Method for the Organoleptic Assessment of Virgin Olive Oil. COI 2018, T.20, Doc. No 15, Rev. 10. Available online: https://www.internationaloliveoil.org/wp-content/uploads/2019/11/COI-T20-Doc.-15-REV-10-2018-Eng.pdf (accessed on 1 July 2024).
- International Olive Council Method. Sensory Analysis of Olive Oil Standard Guide for the Selection, Training and Quality Control of Virgin Olive Oil Tasters-Qualifications of Tasters, Panel Leaders and Trainers. COI 2018, T.20, Doc. No 14, Rev. 5. Available online: https://www.internationaloliveoil.org/wp-content/uploads/2019/11/COI-T20-Doc.-14-REV-5-2018-Eng.pdf (accessed on 1 July 2024).
- Tsimidou, M.Z.; Nenadis, N.; Servili, M.; García-González, D.L.; Toschi, T.G. Why Tyrosol Derivatives Have to Be Quantified in the Calculation of “Olive Oil Polyphenols” Content to Support the Health Claim Provisioned in the EC Reg. 432/2012. Eur. J. Lipid Sci. Technol. 2018, 120, 1800098. [Google Scholar] [CrossRef]
- Mastralexi, A.; Nenadis, N.; Tsimidou, M.Z. Addressing analytical requirements to support health claims on “olive oil polyphenols” (EC Regulation 432/2012). J. Agric. Food Chem. 2014, 62, 2459–2461. [Google Scholar] [CrossRef]
- Covas, M.I.; Fito, M.; De la Torre, R. Olive and Olive Oil Bioactive Ingredients; AOCS Press: Urbana, IL, USA, 2015. [Google Scholar]
- Covas, M.I.; Nyyssönen, K.; Poulsen, H.E.; Kaikkonen, J.; Zunft, H.J.F.; Kiesewetter, H.; Gaddi, A.; De La Torre, R.; Mursu, J.; Bäumler, H.; et al. The effect of polyphenols in olive oil on heart disease risk factors: A randomized trial. Ann. Intern. Med. 2006, 145, 333–341. [Google Scholar] [CrossRef]
- Bellumori, M.; Cecchi, L.; Innocenti, M.; Clodoveo, M.L.; Corbo, F.; Mulinacci, N. The EFSA health claim on olive oil polyphenols: Acid hydrolysis validation and total hydroxytyrosol and tyrosol determination in Italian virgin olive oils. Molecules 2019, 24, 2179. [Google Scholar] [CrossRef]
- Agozzino, P.; Avellone, G.; Bongiorno, D.; Ceraulo, L.; Indelicato, S.; Indelicato, S.; Vèkey, K. Determination of the cultivar and aging of Sicilian olive oils using HPLC-MS and linear discriminant analysis. J. Mass Spectrom. 2010, 45, 989–995. [Google Scholar] [CrossRef]
- Flamminii, F.; Marone, E.; Neri, L.; Pollastri, L.; Cichelli, A.; Di Mattia, C.D. The effect of harvesting time on olive fruits and oils quality parameters of Tortiglione and Dritta olive cultivars. Eur. J. Lipid Sci. Technol. 2021, 123, 2000382. [Google Scholar] [CrossRef]
- Orlandi, F.; Bonofiglio, T.; Romano, B.; Fornaciari, M. Qualitative and quantitative aspects of olive production in relation to climate in southern Italy. Sci. Hortic. 2012, 138, 151–158. [Google Scholar] [CrossRef]
- Salvador, M.D.; Aranda, F.; Gómez-Alonso, S.; Fregapane, G. Influence of extraction system, production year and area on Cornicabra virgin olive oil: A study of five crop seasons. Food Chem. 2003, 80, 359–366. [Google Scholar] [CrossRef]


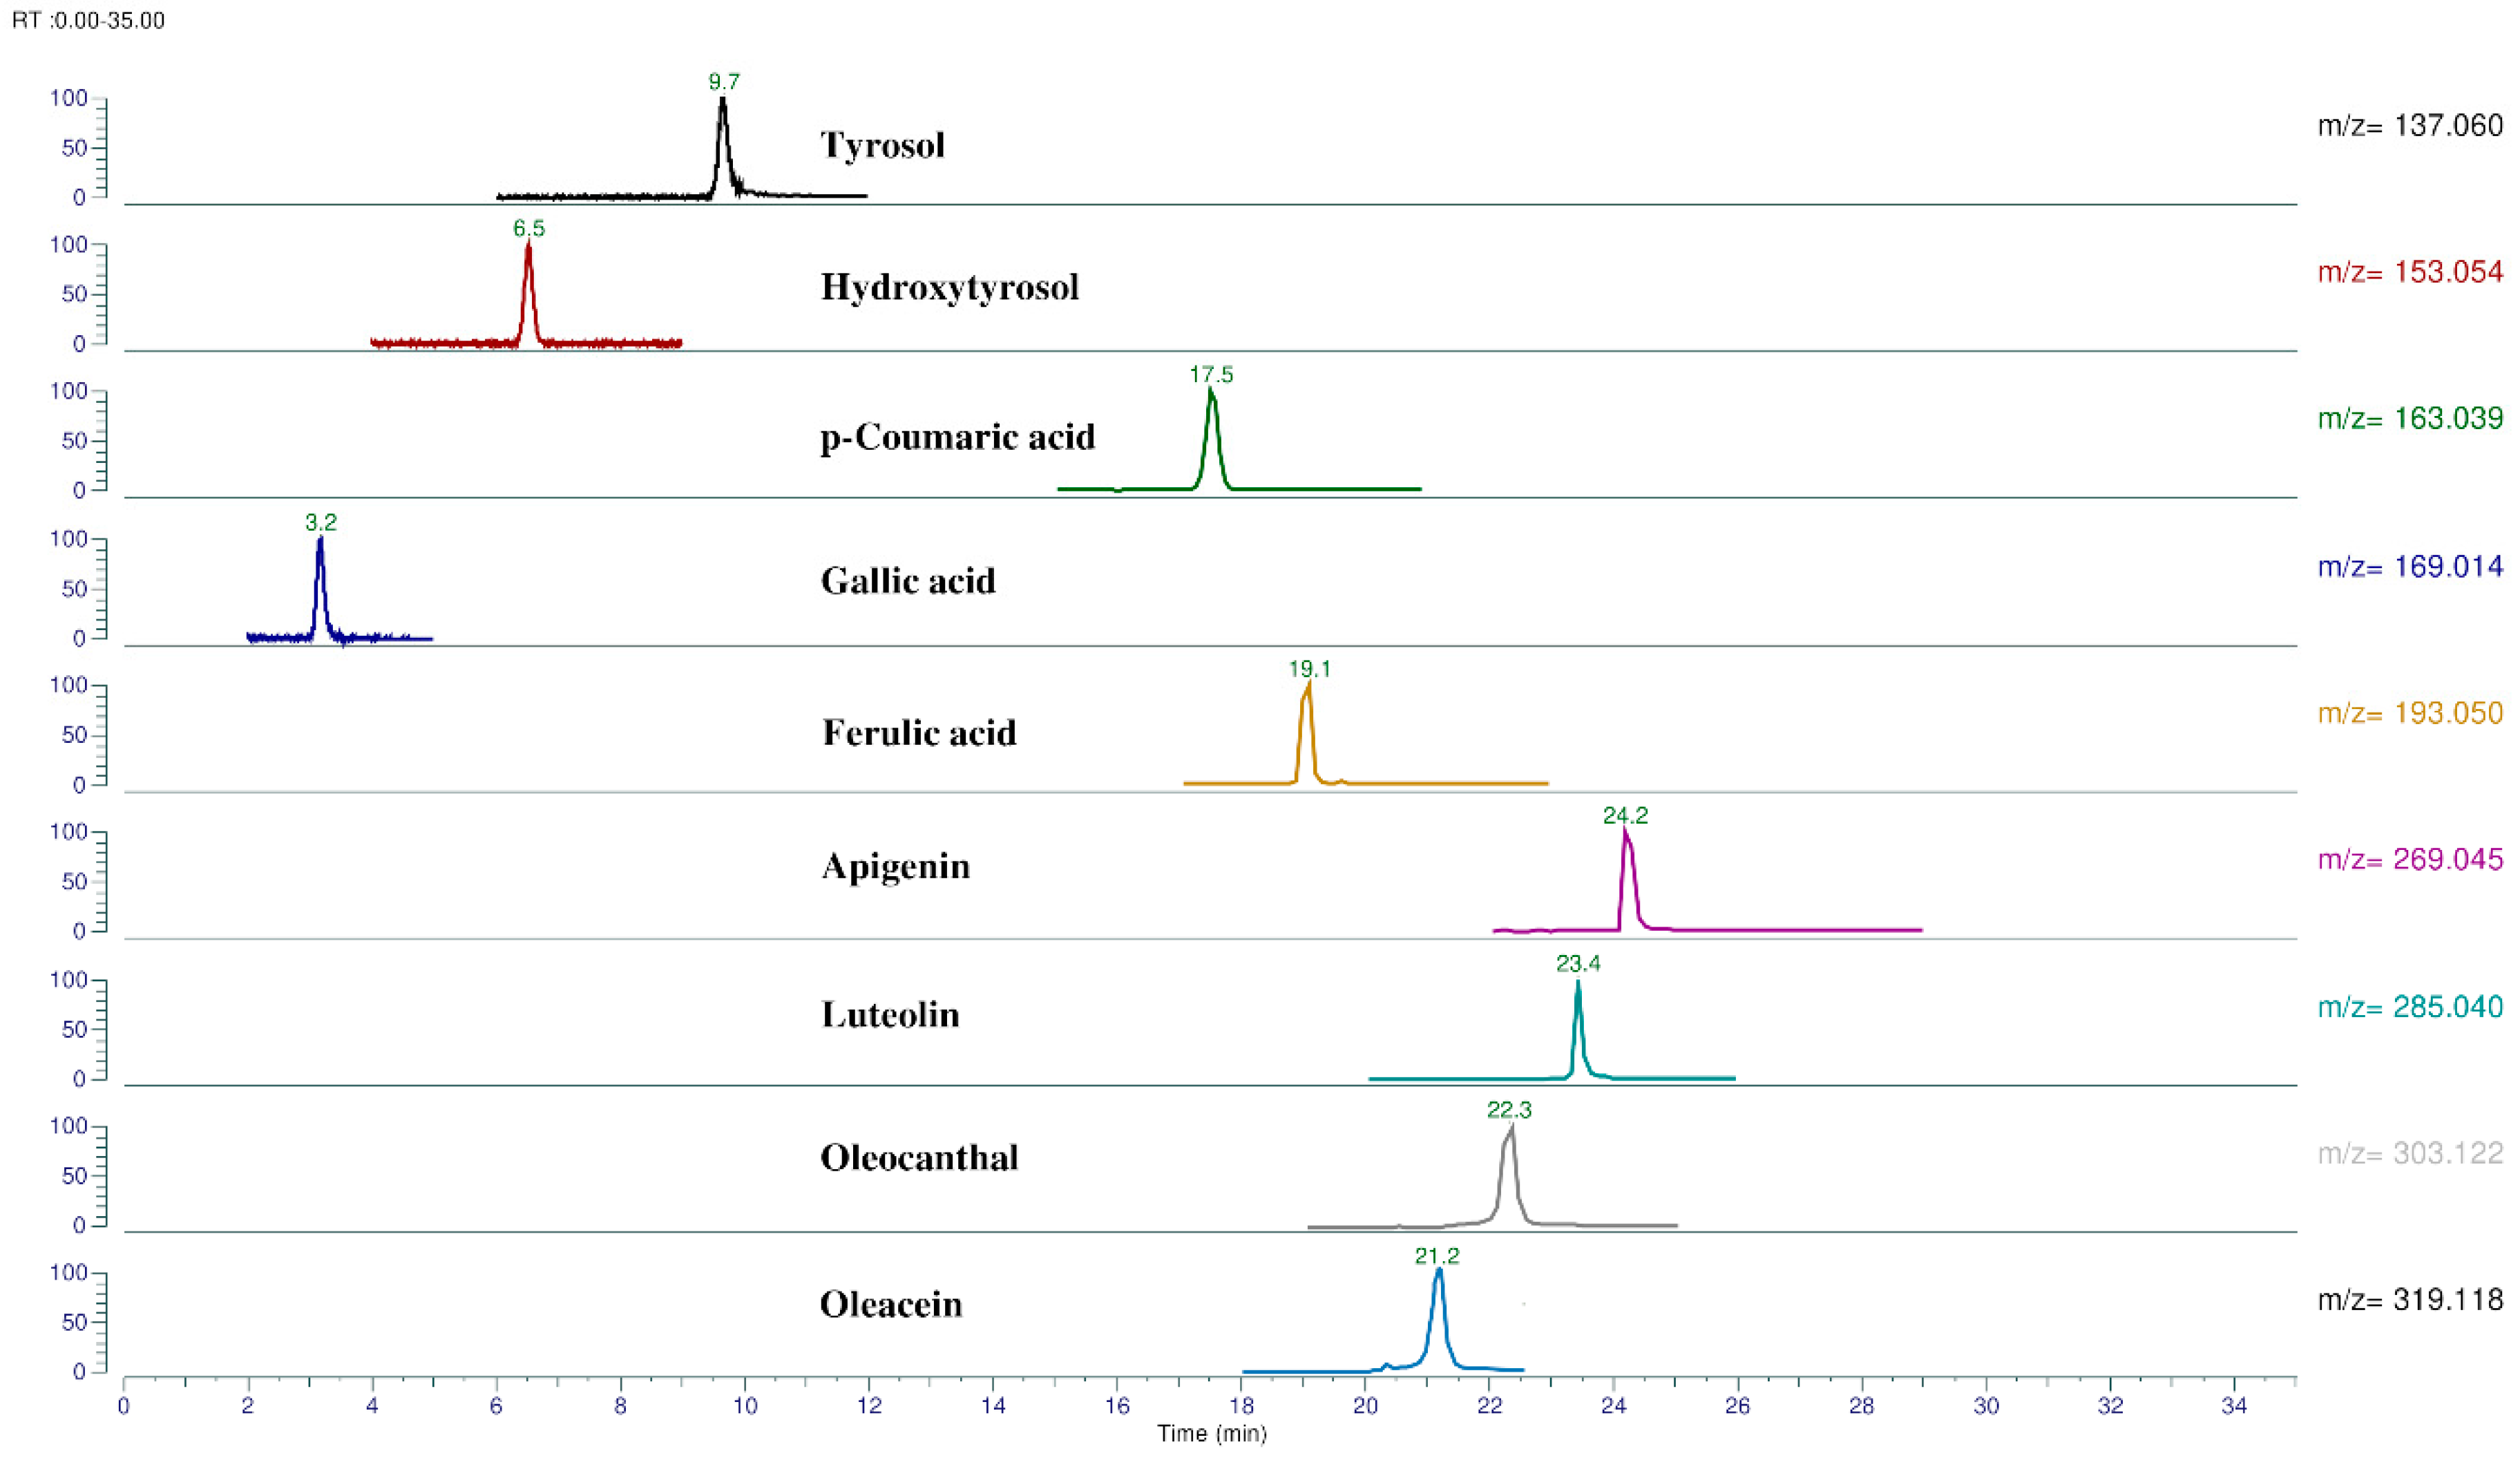
| Phenolic Compounds | RT (min) | Molecular Formula | Theoretical m/z [M − H]− | Experimental m/z [M − H]− | Calculated Errors (Δppm) |
|---|---|---|---|---|---|
| Phenolic Alcohols | |||||
| p-HPEA | 9.7 | C8H10O2 | 137.06080 | 137.05954 | 1.26 |
| 3,4-DHPEA | 6.5 | C8H10O3 | 153.05572 | 153.0591 | 1.81 |
| Phenolic Acids | |||||
| p-Coumaric acid | 17.6 | C9H8O3 | 163.04007 | 163.03848 | 1.58 |
| Gallic acid | 3.2 | C7H6O5 | 169.01425 | 169.01311 | 1.14 |
| Ferulic acid | 19.1 | C10H10O4 | 193.05063 | 193.04970 | 0.93 |
| Flavonoids | |||||
| Apigenin | 24.3 | C15H10O5 | 269.04555 | 269.04523 | 0.32 |
| Luteolin | 23.4 | C15H10O6 | 285.04046 | 285.04004 | 0.42 |
| Secoiridoids | |||||
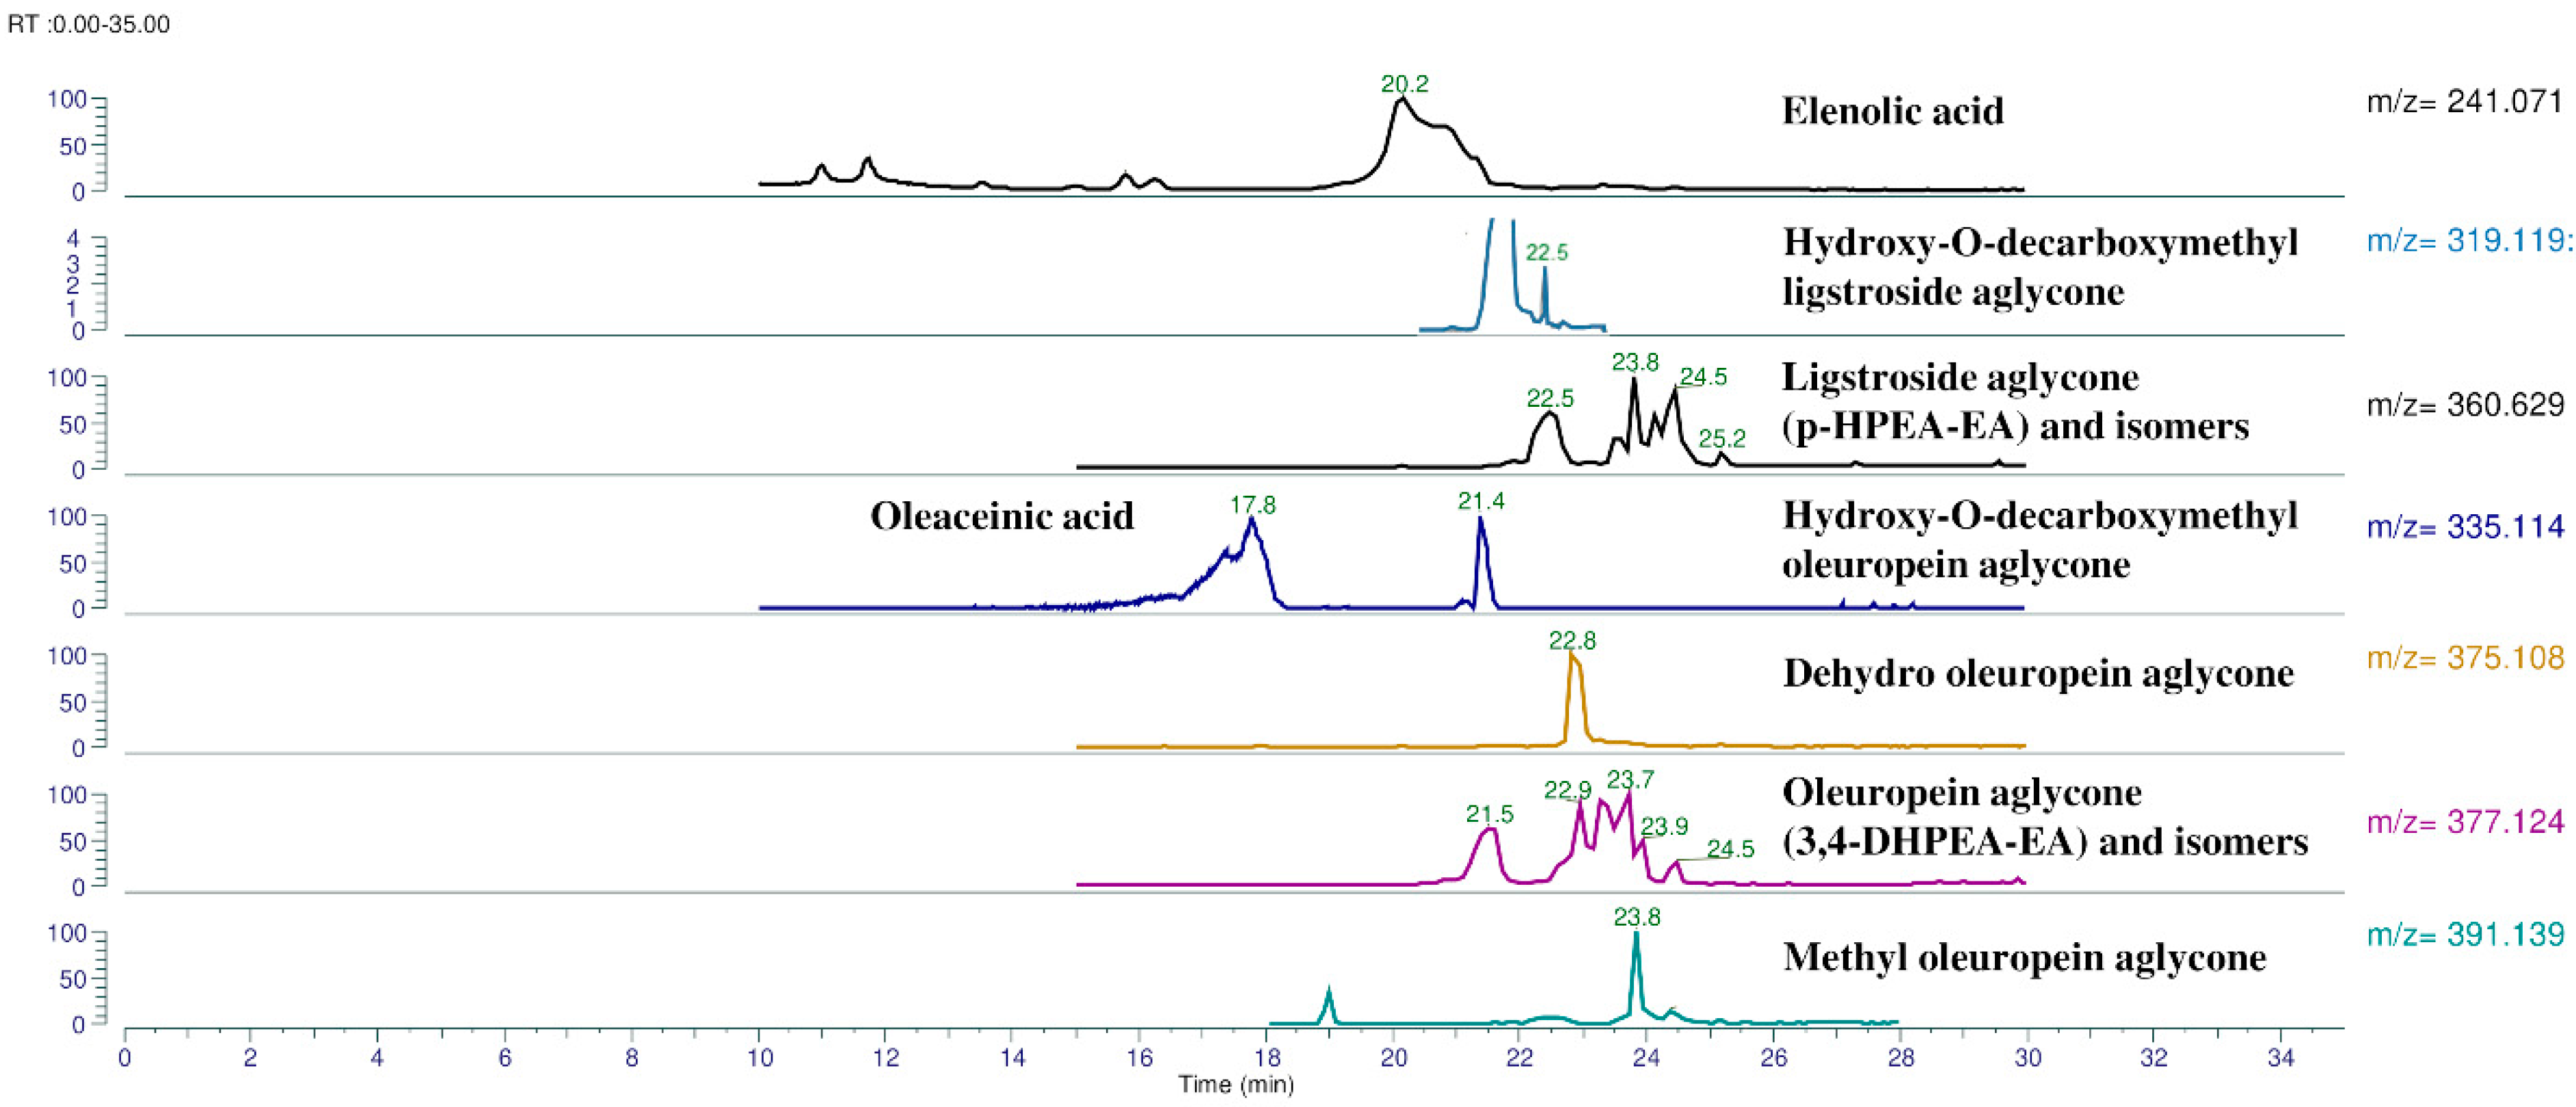
| Elenolic acid | 20.1 | C11H14O6 | 241.07176 | 241.0761 | 0.63 |
| p-HPEA-EDA | 22.3 | C17H20O5 | 303.12380 | 303.12344 | 0.35 |
| 3,4-DHPEA-EDA | 21.1 | C17H20O6 | 319.11871 | 319.11823 | 0.49 |
| HDLA | 22.4 | C17H20O6 | 319.11871 | 319.11887 | 0.48 |
| HDCOA | 21.4 | C17H20O7 | 335.11363 | 335.11392 | 0.88 |
| Oleaceinic acid | 17.8 | C17H20O7 | 335.11363 | 335.11392 | 0.88 |
| p-HPEA-EA with its monoaldehydic isomeric forms | 22–26 | C19H22O7 | 361.12928 | 361.12967 | 1.09 |
| DHOA | 22.9 | C19H20O8 | 375.10854 | 375.10873 | 0.52 |
| 3,4-DHPEA-EA with its monoaldehydic isomeric forms | 20–25 | C19H22O8 | 377.12419 | 377.12442 | 0.61 |
| MOA | 23.9 | C20H24O8 | 391.13984 | 391.14032 | 1.22 |
| N. | Phenolic Compounds | 12 Nocellara Samples (mg/kg) | 12 Biancolilla Samples (mg/kg) | 12 Cerasuola Samples (mg/kg) | ||||||
|---|---|---|---|---|---|---|---|---|---|---|
| Range | Mean | Sd | Range | Mean | Sd | Range | Mean | Sd | ||
| 1 | p-HPEA | 0.68–1.61 | 1.15 | 0.34 | 0.64–0.90 | 0.74 | 0.10 | 0.68–1.54 | 0.82 | 0.24 |
| 2 | 3,4-DHPEA | 0.25–4.47 | 2.02 | 1.73 | 0.37–2.07 | 1.01 | 0.63 | 0.58–4.14 | 1.50 | 1.03 |
| 3 | p-Coumaric acid | 0.034–0.56 | 0.33 | 0.13 | 0.10–0.20 | 0.14 | 0.04 | 0.05–0.26 | 0.09 | 0.06 |
| 4 | Gallic acid | 0.010–0.03 | 0.02 | 0.006 | 0.003–0.025 | 0.01 | 0.0006 | 0.001–0.02 | 0.01 | 0.01 |
| 5 | Ferulic acid | 0. 14–0.24 | 0.20 | 0.03 | 0.045–0.079 | 0.06 | 0.01 | 0. 02–0.12 | 0.06 | 0.02 |
| 6 | Apigenin | 0.08–0.65 | 0.24 | 0.14 | 0.31–0.55 | 0.45 | 0.08 | 0. 12–0.45 | 0.31 | 0.08 |
| 7 | Luteolin | 0.14–1.39 | 0.87 | 0.27 | 0.93–1.38 | 1.14 | 0.14 | 0.50–1.05 | 0.76 | 0.17 |
| 8 | Elenolic acid | 74.44–279.87 | 204.45 | 55.50 | 130.89–162.74 | 149.09 | 8.07 | 116.16–195.66 | 156.51 | 27.28 |
| 9 | p-HPEA-EDA | 74.69–115.59 | 90.11 | 13.66 | 80.73–140.38 | 110.78 | 22.56 | 94.48–155.25 | 128.25 | 21.65 |
| 10 | 3,4-DHPEA-EDA | 48.76–87.81 | 65.18 | 11.74 | 61.95–99.88 | 76.49 | 12.70 | 63.84–113.64 | 87.91 | 16.61 |
| 11 | HDLA | 1.17–2.74 | 1.96 | 0.60 | 1.95–8.82 | 4.67 | 2.68 | 0.89–6.92 | 2.66 | 1. 57 |
| 12 | HDCOA | 0.41–0.83 | 0.54 | 0.13 | 0.63–1.52 | 1.06 | 0.34 | 0.21–2.87 | 0.79 | 0.72 |
| 13 | Oleaceinic acid | 0.05–0.97 | 0.55 | 0.32 | 1.10–2.97 | 2.22 | 0.73 | 3.17–9.91 | 5.03 | 2.14 |
| 14 | 3,4-DHPEA-EA and monoaldehydic isomeric forms | 60.37–181.20 | 128.19 | 44.71 | 111.22–136.56 | 119.89 | 9.04 | 144.07–223.11 | 195.79 | 22.95 |
| 15 | DHOA | 1.61–4.53 | 2.75 | 0.77 | 3.25–4.27 | 3.89 | 0.32 | 3.89–7.36 | 5.16 | 1.18 |
| 16 | p-HPEA-EA and monoaldehydic isomeric forms | 53.08–228.41 | 116.84 | 49.71 | 52.38–174.80 | 109.17 | 47.75 | 153.87–250.69 | 206.11 | 23.45 |
| 17 | MOA | 1.36–1.83 | 1.52 | 0.16 | 1.45–2.10 | 1.78 | 0.21 | 1.95–3.07 | 2.65 | 0.32 |
| Biancolilla | Cerasuola | Nocellara | ||||||||||
|---|---|---|---|---|---|---|---|---|---|---|---|---|
| Min | Max | Mean | Sd | Min | Max | Mean | Sd | Min | Max | Mean | Sd | |
| Palmitate | 9.56 | 14.77 | 13.05 | 2.16 | 10.74 | 15.00 | 11.93 | 1.34 | 11.38 | 15.04 | 13.60 | 1.04 |
| Palmitoleate | 0.25 | 1.33 | 0.97 | 0.44 | 0.53 | 1.19 | 0.75 | 0.22 | 0.66 | 1.39 | 1.01 | 0.21 |
| Eptadecanoate | 0.06 | 0.19 | 0.13 | 0.05 | 0.08 | 0.20 | 0.12 | 0.04 | 0.11 | 0.19 | 0.15 | 0.03 |
| Eptadecenoate | 0.07 | 0.30 | 0.22 | 0.09 | 0.09 | 0.36 | 0.18 | 0.08 | 0.15 | 0.36 | 0.26 | 0.06 |
| Stearate | 2.53 | 2.96 | 2.67 | 0.12 | 2.69 | 3.23 | 2.86 | 0.14 | 2.74 | 3.09 | 2.88 | 0.11 |
| Oleate | 68.10 | 76.01 | 70.99 | 2.89 | 68.45 | 74.69 | 72.86 | 1.78 | 67.86 | 73.89 | 70.40 | 1.62 |
| Linoleate | 9.05 | 10.65 | 9.87 | 0.57 | 8.06 | 9.74 | 9.13 | 0.55 | 8.89 | 10.70 | 9.45 | 0.54 |
| Arachidate | 0.47 | 0.49 | 0.48 | 0.01 | 0.47 | 0.50 | 0.47 | 0.01 | 0.47 | 0.49 | 0.47 | 0.01 |
| Linolenate | 0.59 | 0.70 | 0.67 | 0.03 | 0.61 | 0.75 | 0.66 | 0.04 | 0.62 | 0.74 | 0.69 | 0.04 |
| Eicosenoate | 0.27 | 0.46 | 0.33 | 0.07 | 0.27 | 0.40 | 0.36 | 0.04 | 0.25 | 0.38 | 0.32 | 0.04 |
| Lignocerate | 0.06 | 0.07 | 0.06 | 0.00 | 0.06 | 0.06 | 0.06 | 0.00 | 0.06 | 0.07 | 0.06 | 0.00 |
| Acidity (%) | K232 | K266 | ΔK | |
|---|---|---|---|---|
| Biancolilla | 0.195 | 1.586 | 0.111 | 0.098 |
| std. deviation | 0.04 | 0.07 | 0.01 | 0.001 |
| %rsd | 19.50 | 4.52 | 4.65 | 17.96 |
| Cerasuola | 0.192 | 1.519 | 0.108 | −0.005 |
| std. deviation | 0.02 | 0.03 | 0.00 | 0.001 |
| %rsd | 10.89 | 1.65 | 3.59 | 11.95 |
| Nocellara | 0.209 | 1.536 | 0.111 | 0.003 |
| std. deviation | 0.05 | 0.05 | 0.01 | 0.001 |
| %rsd | 22.32 | 3.30 | 11.19 | 21.68 |
| Classifications: Rows (Observed) Columns (Predicted) (Analysis and Validation Samples) | ||||
|---|---|---|---|---|
| Class | Percent Correct | Biancolilla | Nocellara | Cerasuola |
| Biancolilla | 100.00 | 12 | 0 | 0 |
| Nocellara | 100.00 | 0 | 12 | 0 |
| Cerasuola | 91.67 | 1 | 0 | 11 |
| Total | 97.22 | 13 | 12 | 11 |
| F Tests with 5 and 24. Degrees of Freedom; Sigma-Restricted Parameterization | ||||||
|---|---|---|---|---|---|---|
| Class | Biancolilla (f) | Biancolilla (p) | Nocellara (f) | Nocellara (p) | Cerasuola (f) | Cerasuola (p) |
| Biancolilla | 156.527 | 0.000 | 89.789 | 0.000 | ||
| Nocellara | 156.527 | 0.000 | 256.103 | 0.000 | ||
| Cerasuola | 89.789 | 0.000 | 256.103 | 0.000 | ||
| (a) Classification Matrix Based on Polyphenols-Related Variables | ||||
| Class | Percent correct | harvest 1 | harvest 2 | |
| harvest 1 | 100 | 17 | 0 | |
| harvest 2t | 100 | 0 | 19 | |
| Total | 100 | 17 | 19 | |
| Tests of Significance of Squared Mahalanobis Distances | ||||
| Class | harvest 1 F | harvest 1 p | harvest 2 F | harvest 2 p |
| harvest 1 | 58.612 | 0.000 | ||
| harvest 2 | 58.612 | 0.000 | ||
| (b) Classification Matrix Based on All Continuous Variables | ||||
| Class | Percent correct | harvest 1 | harvest 2 | |
| harvest 1 | 100 | 17 | 0 | |
| harvest 2 | 100 | 0 | 19 | |
| Total | 100 | 17 | 19 | |
| Tests of Significance of Squared Mahalanobis Distances | ||||
| Class | harvest 1 F | harvest 1 p | harvest 2 F | harvest 2 p |
| harvest 1 | 58.612 | 0.000 | ||
| harvest 2 | 58.612 | 0.000 | ||
Disclaimer/Publisher’s Note: The statements, opinions and data contained in all publications are solely those of the individual author(s) and contributor(s) and not of MDPI and/or the editor(s). MDPI and/or the editor(s) disclaim responsibility for any injury to people or property resulting from any ideas, methods, instructions or products referred to in the content. |
© 2024 by the authors. Licensee MDPI, Basel, Switzerland. This article is an open access article distributed under the terms and conditions of the Creative Commons Attribution (CC BY) license (https://creativecommons.org/licenses/by/4.0/).
Share and Cite
Lino, C.; Bongiorno, D.; Pitonzo, R.; Indelicato, S.; Barbera, M.; Di Gregorio, G.; Pane, D.; Avellone, G. Chemical Characterization, Stability and Sensory Evaluation of Sicilian Extra Virgin Olive Oils: Healthiness Evidence at Nose Reach. Foods 2024, 13, 2149. https://doi.org/10.3390/foods13132149
Lino C, Bongiorno D, Pitonzo R, Indelicato S, Barbera M, Di Gregorio G, Pane D, Avellone G. Chemical Characterization, Stability and Sensory Evaluation of Sicilian Extra Virgin Olive Oils: Healthiness Evidence at Nose Reach. Foods. 2024; 13(13):2149. https://doi.org/10.3390/foods13132149
Chicago/Turabian StyleLino, Claudia, David Bongiorno, Rosa Pitonzo, Serena Indelicato, Manfredi Barbera, Gabriella Di Gregorio, Domenico Pane, and Giuseppe Avellone. 2024. "Chemical Characterization, Stability and Sensory Evaluation of Sicilian Extra Virgin Olive Oils: Healthiness Evidence at Nose Reach" Foods 13, no. 13: 2149. https://doi.org/10.3390/foods13132149
APA StyleLino, C., Bongiorno, D., Pitonzo, R., Indelicato, S., Barbera, M., Di Gregorio, G., Pane, D., & Avellone, G. (2024). Chemical Characterization, Stability and Sensory Evaluation of Sicilian Extra Virgin Olive Oils: Healthiness Evidence at Nose Reach. Foods, 13(13), 2149. https://doi.org/10.3390/foods13132149