Article

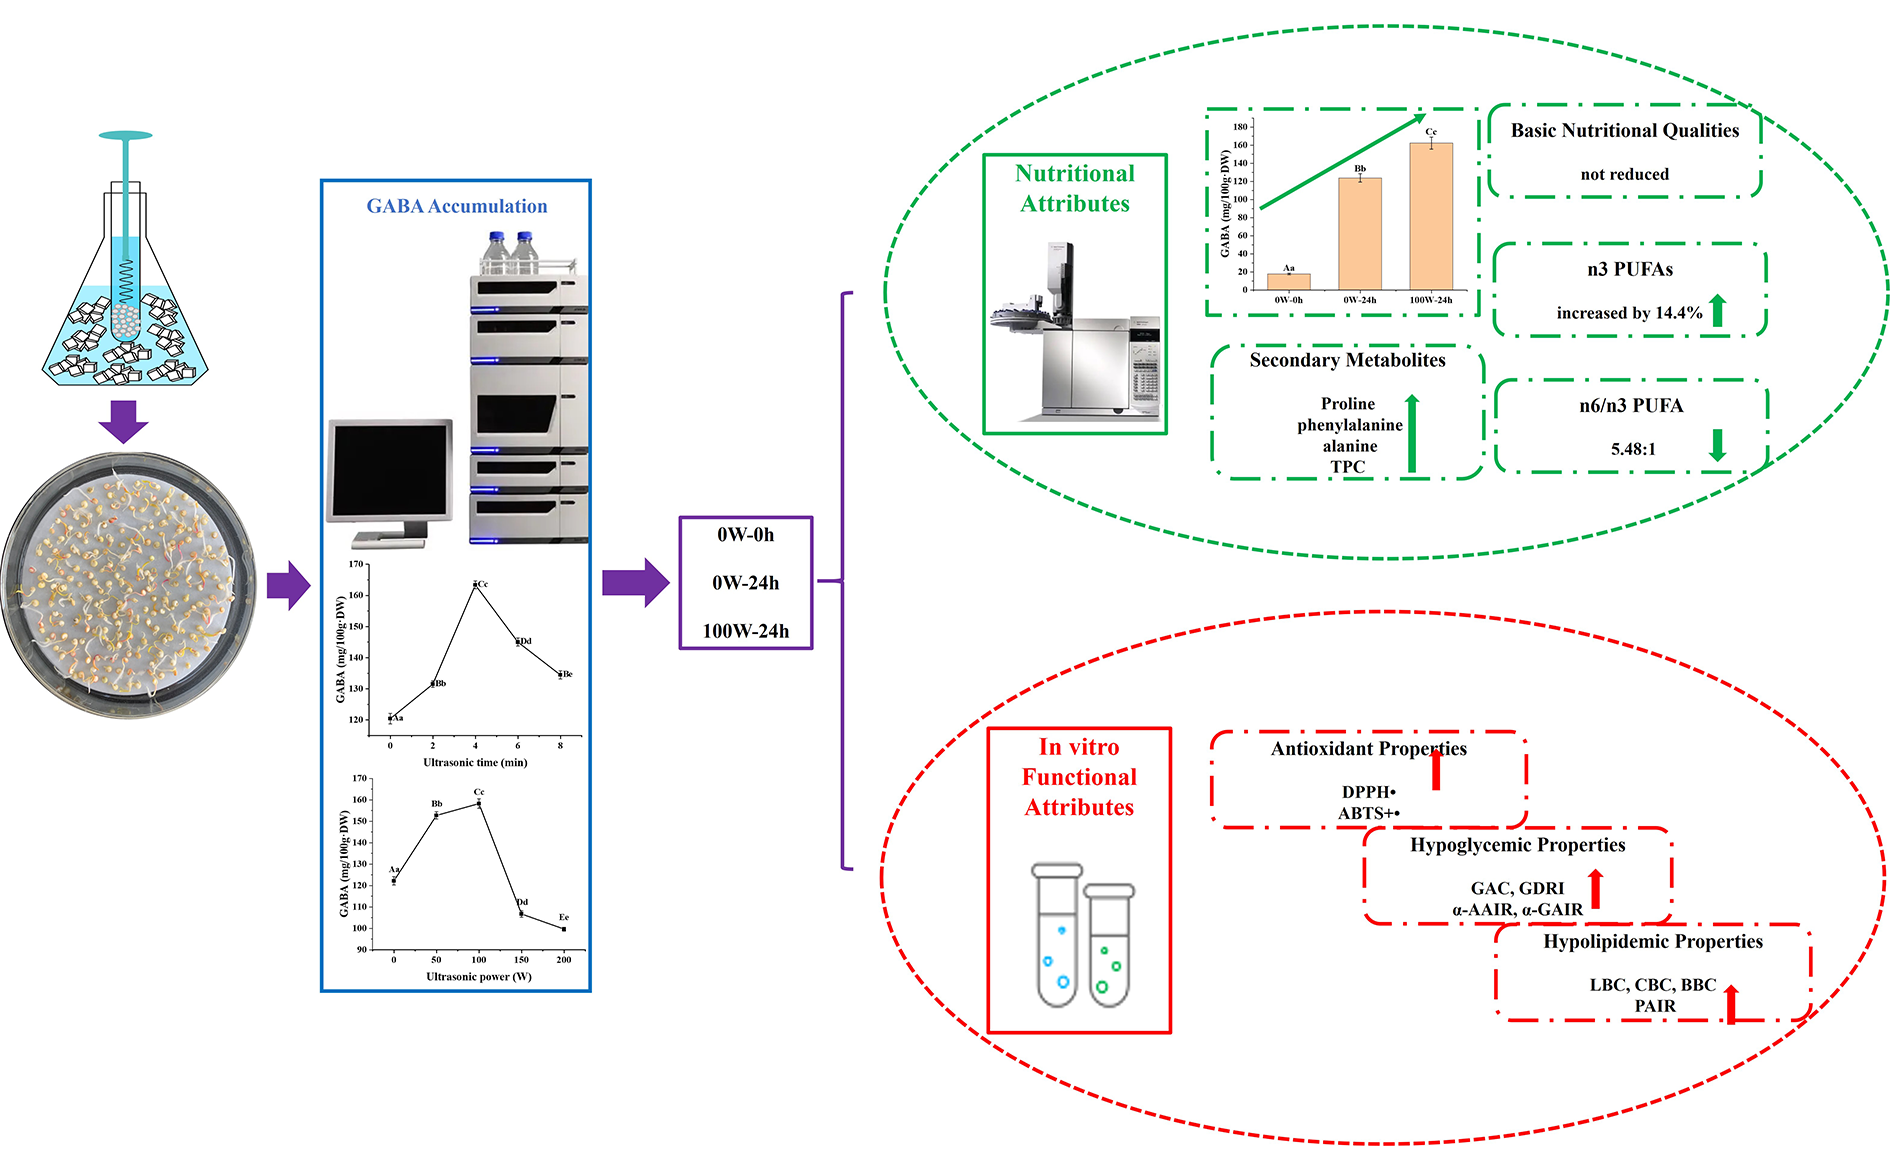
Enhancement of γ-Aminobutyric Acid and the Characteristics of Nutrition and Function in White Quinoa through Ultrasound Stress at the Pre-Germination Stage

1
College of Food Science and Technology, Agricultural University of Hebei, Baoding 071001, China
2
National Engineering Research Center for Semi-Arid Agriculture, Shijiazhuang 050000, China
*
Author to whom correspondence should be addressed.
Foods 2024, 13(1), 57; https://doi.org/10.3390/foods13010057
Submission received: 7 November 2023 / Revised: 8 December 2023 / Accepted: 20 December 2023 / Published: 22 December 2023
(This article belongs to the Section Food Engineering and Technology)

Abstract

:
The global production of quinoa has been increasing in recent years. In plant-based foods, ultrasound stress has received increasing attention, owing to its ability to enhance the production of primary and secondary metabolites. We studied the effects of ultrasonic stress at the pre-germination stage on the γ-aminobutyric acid (GABA) accumulation and characteristics of nutrition and function in quinoa. The results showed that ultrasonic conditions of 100 W for 4 min promoted an increase in GABA content by 9.15-fold, to 162.47 ± 6.69 mg/100 g·DW, compared to that of untreated quinoa, through promoting a 10.2% and 71.9% increase in the water absorption and glutamate decarboxylase activity of quinoa, respectively. Meanwhile, compared to untreated quinoa, ultrasonic stress at the pre-germination stage enhanced the total phenolic, total flavonoid, and total saponin contents of quinoa by 10.2%, 33.6%, and 90.7%, to 3.29 mg GA/g·DW, 104.0 mg RE/100 g·DW, and 7.13 mg/g, respectively, without decreasing its basic nutritional quality. Ultrasonic stress caused fissures on the surface of quinoa starch particles. Additionally, germination under ultrasonic stress increased the n3 polyunsaturated fatty acids by 14.4%. Furthermore, ultrasonic stress at the pre-germination stage promoted the scavenging of 2,2-diphenyl1-picrylhydrazyl radicals and inhibitions of α-amylase, α-glucosidase, and pancreatic lipase by 14.4%, 14.9%, 24.6%, and 20.0% in vitro, compared to untreated quinoa. The results indicated that the quinoa sprouted via ultrasonic stress could represent a promising method through which to develop nutritionally balanced whole grains rich in GABA, with hypoglycemic and hypolipidemic activities, which could provide theoretical support for the development of functional whole-grain foods based on quinoa.

Graphical Abstract

1. Introduction

Quinoa (Chenopodium quinoa Willd.) is an annual herbaceous plant. This food benefits gluten-sensitive individuals, owing to its gluten-free nature [1]. The quinoa plant is native to the Andes of South America and dates from 5000 BC to 3000 BC; it was introduced to China in the 1980s and cultivated on a large scale after 2012. Quinoa is mainly cultivated in Shanxi, Gansu, Inner Mongolia, Qinghai, Tibet, Hebei, and other regions in China. The FAO declared 2013 as the International Year of Quinoa. In 2022, the global quinoa market amounted to approximately USD 91.73 billion, and it is estimated to exceed USD 152.44 billion by 2027. Moreover, global quinoa production has increased, from 80,000 metric tons in 2010, to 147,000 metric tons in 2021, as per an FAO statement [2]. Quinoa is a pseudo-cereal that is abundant in carbohydrates (67–74%), proteins (10–18%), lipids (4.4–8.8%), and phytochemicals such as polyphenols. Some studies have shown that the presence of amylose in quinoa ranged from 7% to 27%, and that the sizes of its starch granules were lower than those of corn (1–2 μm) or wheat (2–40 μm) [3]. Quinoa proteins constitute all essential amino acids, with lysine and leucine contents equivalent to 96% and 91% of the FAO standards, respectively [3]. The quinoa seed is a major source of essential fatty acids, with the main fatty acid fractions being linoleic acid (18:2n-6), linolenic acid (20:3n-6) (55–60%), and oleic acid (18:1 cis-9) (30%) [3]. Additionally, the polyphenols in quinoa grains are dominated by free phenols (ranging from 167.2 to 308.3 mg gallic acid equivalents per 100 g dry weight), which play important roles in the prevention of both diabetes and obesity [4,5]. Meanwhile, studies have shown that quinoa reduces serum triglyceride levels and metabolic syndrome [6,7].
Germination, as a biochemical process, can enhance the nutrients in whole grains. Germination of different grains is triggered by specific conditions, including optimal temperature, light, and moisture to support plant growth. Suitable germination conditions activate the relevant enzymes and hormones, transforming the grain from dormancy to active metabolism and facilitating the release of nutrients [8]. Products based on germinated grains represent new components in the food industry that have enhanced nutritional value, mineral absorption, flavor, and taste [9]. Sprouted grain products, such as sprouted mung beans and sprouted brown rice, have become very common in the market [10]. Germination has a positive effect on the bioavailability of severely limited phenolic acids in grains [11]. Previous results have shown that the γ-aminobutyric acid (GABA) levels (22.41 mg/100 g·DW), TPC (270.99 mg GAE/100 g·DW), and oxygen radical absorbance capacity (1085.75 mg TE/100 g·DW) of ungerminated quinoa could be increased to 122.32 mg/100 g·DW, 499.24 mg GAE/100 g·DW, and 1437.19 mg TE/100 g·DW, respectively, through germination [12]. Interestingly, the opposite results were observed for saponins. One study indicated that the most abundant saponins showed decreases in their contents during normal germination and increased markedly during germination under selenium stress [13]. Another study demonstrated that sprouted quinoa showed a higher total saponin content (TSC) [14].
GABA is an essential non-protein amino acid. The various health benefits of GABA-enriched foods mainly include neuroprotection, anti-depression, anti-insomnia, anti-diabetes, anti-hypertension, and anti-inflammation properties [15]. Many studies have shown that GABA accumulates in large quantities when plants are subjected to abiotic stresses, and acts as a signaling molecule to regulate tolerance to various abiotic stresses [16]. Common pre-germination abiotic stress techniques include low-temperature, salt, hypoxic, and ultrasound stress [15]. In plant-based foods, ultrasound stress has received increasing attention as a burgeoning non-thermal technology, owing to its ability to enhance the production of primary and secondary metabolites [17]. For germinated wheat and red rice, samples treated with ultrasound (25 kHz for 5 min) accumulated various metabolites, including beneficial (such as riboflavin and GABA) and flavorful (such as glucose and free sugar) plant metabolites [18]. Meanwhile, germinated oats stimulated with ultrasound for 5 min after soaking showed high levels of GABA, succinic acid, alanine, total avenanthramides, and TPC at different germination times [19]. A study on whole-grain brown rice indicated that ultrasound treatment has stimulatory effects on starch decomposition; increases the reducing sugar, GABA, proline, and antioxidant contents; and simultaneously improves the nutritional index of free amino acids and the bioaccessibility of iron and calcium in vitro [20]. The influence of ultrasound-assisted sprouting on bioactive phytochemicals was considered to be related to stress effects [18], ultimately affecting plant phenotypes. In the early germination stage of the common bean, increased auxin levels in the radicle tip in response to ultrasonic stimulation may positively affect root growth with increasing treatment intensity [21]. However, the average root length was reduced by 20.41% at 300 W, relative to that of the matched control group [22]. Common pre-germination abiotic stresses, such as low temperatures, salt, and hypoxia, may cause harmful effects on plant growth [15], which can be avoided or even promoted under appropriate sonication conditions.
Although GABA is widely found in vertebrates, plants, and microorganisms, it is present in extremely low levels and is unlikely to fulfill human needs. Quinoa seeds are most commonly used for direct cooking, and more highly processed quinoa products are in urgent demand. However, few studies have investigated the effects of germination and ultrasonic stress on the nutritional composition and functional properties of quinoa as a whole-grain dietary supplement. Therefore, we tried to develop a functional whole-grain food with hypolipidemic and hypoglycemic potential, based on quinoa enriched with GABA through ultrasound stress at the pre-germination stage. At the same time, we considered it necessary to determine the effects of ultrasonic stress and germination on the nutritional quality of quinoa. The aim of this study was to investigate the effects of ultrasonic stress at the pre-germination stage on the GABA accumulation, starch, protein, amino acid, and fat properties, as well as on the phytochemicals in quinoa. More importantly, we investigated the effects of ultrasonic stress at the pre-germination stage on the antioxidant, in vitro hypoglycemic, and in vitro hypolipidemic efficacies of quinoa flour. The technical data could provide theoretical support for the intensive processing and development of functional food, based on quinoa, that conforms to the healthy market tendencies and consumer demands for healthy gluten-free and nutritionally balanced whole grains.

2. Materials and Methods

2.1. Samples and Chemicals

Dehulled quinoa cultivar ‘Jili 3’ was grown and harvested at Zhangjiakou Yuerwan Quinoa Planting Cooperative, which is located in Zhangjiakou City (115°36′ E, 415°27′ N), Hebei Province, China. The seeds were preserved in the dark at −20 °C under vacuum until germination. GABA, with a purity ≥ 99%, and 2,2-diphenyl1-picrylhydrazyl (DPPH) were purchased from Sigma-Aldrich (Shanghai, China). Threonine (99%), valine (99%), methionine (98%), isoleucine (98%), leucine (98%), phenylalanine (98%), lysine (98%), histidine (98%), arginine (98%), aspartate (98%), serine (98%), glutamate (98%), glycine (98%), alanine (98%), cysteine (98%), tyrosine (99%), proline (98%), gallic acid (99%), rutin (95%), saponin (98%), 2,2′-azino-bis (3-ethylbenzthiazoline-6-sulfonic acid) (ABTS) (98%), sodium cholate (65%), sodium taurocholate (98%), sodium deoxycholate (98%), and sodium glycocholate (97%), as well as α-amylase (100,000 U/g), α-glucosidase (50,000 U/g), and pancreatic lipase (30,000 U/g), were obtained from Shanghai Yuanye Bio-Technology Co., Ltd. (Shanghai, China). Acetonitrile (chromatographically pure) was purchased from Macklin Biochemical Co. Ltd. (Shanghai, China). All other chemicals were analytical reagent grade.

2.2. Germination of Quinoa

Dehulled quinoa was soaked in NaClO (0.1%) for 30 min for surface sterilization and rinsed with distilled water at least three times until no NaClO residue remained on the surface. After soaking in distilled water at 24 ± 1 °C for 14 h, the quinoa samples were laid in a culture dish with two layers of filter paper and separately placed in a biochemistry cultivation cabinet at 24 ± 1 °C for 24 h. The controlled sprouting process was performed in the dark, and the water was changed every 12 h. After freezing at −20 °C overnight, the samples were vacuum-freeze-dried for 32 h, pulverized, and then kept at −20 °C.

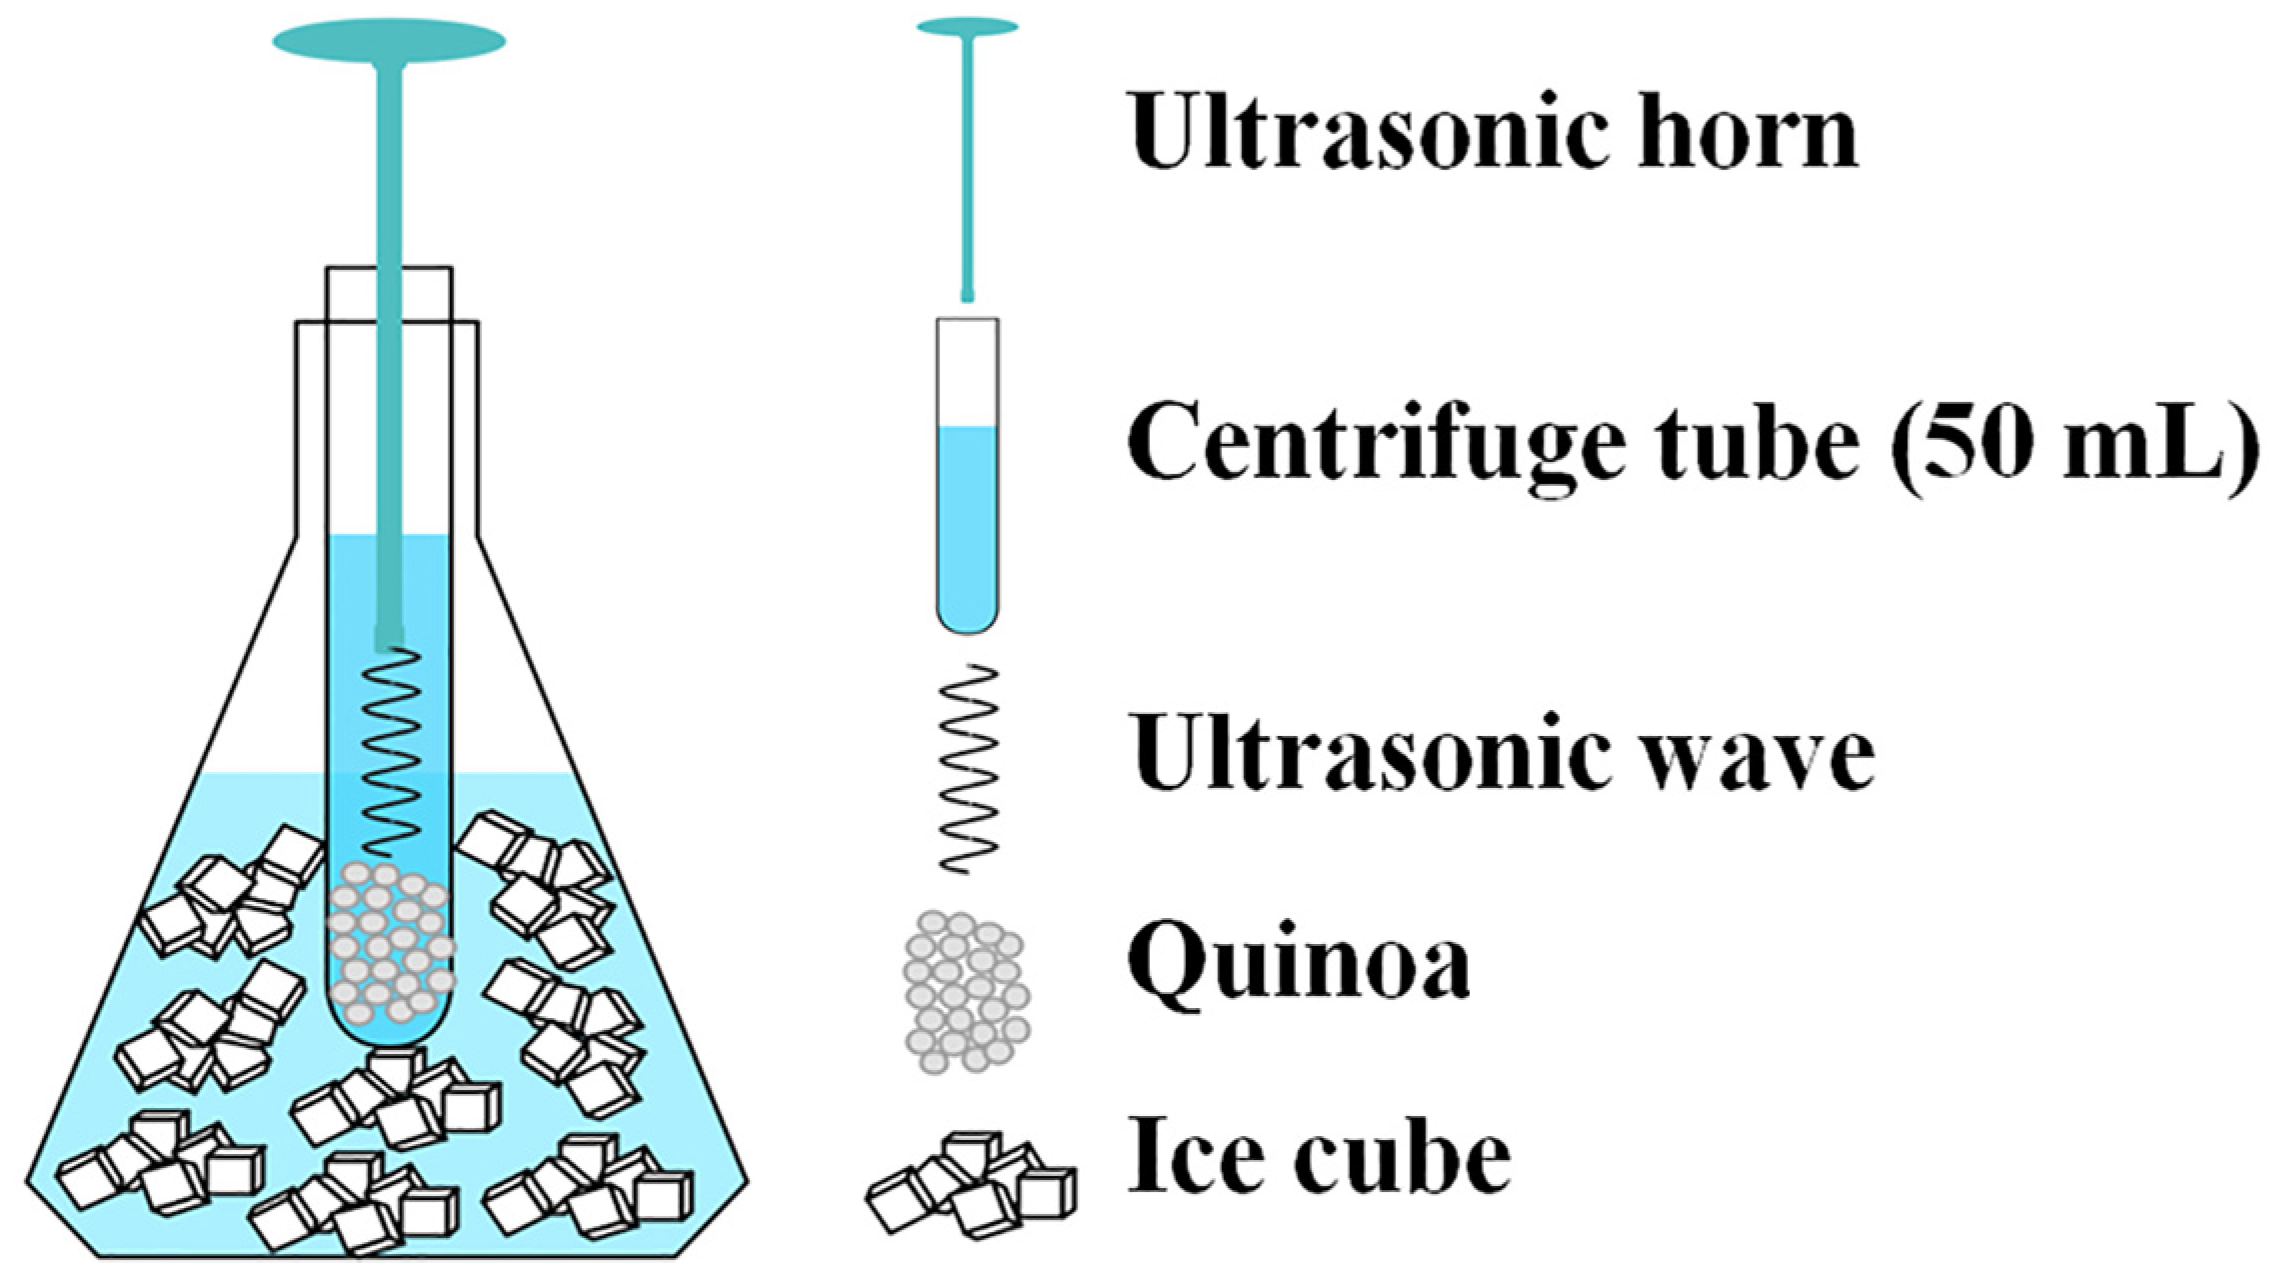
2.3. Ultrasonic Treatment

As shown in Figure 1, after surface disinfection, the effects of varying ultrasonic power (0, 50, 100, 150, and 200 W) and time (0, 2, 4, 6, and 8 min) on the GABA content of quinoa sprouts were investigated, using a single-factor test with an ultrasonic cell pulverizer (Scientz-IID, Ningbo Scientz Biotechnology Co., Ltd., Ningbo, China). The ultrasound treatment time and interval time were both 3 s. During the ultrasonic process, an ice water bath was applied to prevent excessive temperature increase. The ultrasonically stimulated quinoa was immediately soaked and sprouted.

2.4. Determination of GABA Content, Moisture Absorption, Turbidity of Soaking Water, and Glutamate Decarboxylase (GAD) Activity

The determination of the GABA content was carried out according to a previously reported method, with slight modifications [23]. The samples (1.00 g) were evenly admixed with citric acid (0.01 mol/L, 5.00 g) and shaken for 2 h for GABA extraction. The supernatant was centrifuged at 4000 rpm for 15 min. Then, 1 mL each of the supernatant, NaHCO3 (1 mol/L, pH = 9), and 1-fluoro-2,4-dinitrophenylacetonitrile solution (0.1%) were added to a volumetric flask in turn, mixed well, allowed to react at 60 °C for 90 min, and diluted to 10 mL with phosphate buffer (0.01 mol/L, pH = 7.2). After filtration, the GABA content was determined using an Agilent 1260 HPLC with a Universil C18 column (4.6 mm × 250 mm, 5 μm). The mobile phases were phosphate buffer (0.01 mol/L, pH = 7.2): acetonitrile: ultra-pure water = 70:8:22, with a 1-mL/min flow rate. The GABA peak was detected and quantified at 360 nm, at a column temperature of 40 °C.
Moisture absorption was determined based on the difference between the initial mass (3.00 g) and the mass after treatment (the surface water on soaked quinoa grains was wiped with filter papers) divided by the initial mass. The turbidity of the soaking water was determined by transferring quinoa (3.00 g) that had been surface disinfected to a 50 mL centrifuge tube, containing 30 mL of water, for power ultrasound treatment. The absorbance of the soaked water samples was assessed using a spectrophotometer (WFZ UV-2802H, Unico Instrument Co., Ltd., Shanghai, China) at 500 nm. Deionized water was used as a blank [19]. GAD activity was measured according to the instructions of the GAD Elisa Kit (Suzhou Comin Biotechnology Co., Ltd., Suzhou, China).

2.5. Analysis of Nutritional Quality

The protein, fat, dietary fiber (DF), and ash contents were analyzed according to Chinese standard methods GB5009.5-2016 [24], GB5009.6-2016 [25], GB5009.88-2014 [26], and GB5009.4-2016 [27]. Starch and reducing sugar analyses were conducted based on a previously described protocol [20], applied with a few modifications. The ground sample was admixed evenly with ethanol (80%, v/v), and then centrifuged twice (4000 rpm, 15 min), and the precipitate and supernatants were collected separately. HCl (6 mol/L) was used to acid-hydrolyze the precipitate at 100 °C for 20 min. The reducing sugar contents in the supernatants, and the glucose contents in the hydrolysate, which were used for starch content determination, were evaluated according to the 3,5-dinitrosalicylic acid (DNS) colorimetric method. Subsequently, 1 mL of the extract was mixed with 1.5 mL of DNS reagent, reacted in a boiling water bath for 5 min, and cooled to room temperature in an ice water bath. Then, it was fixed to 25 mL with distilled water, and the absorption was measured at 540 nm.
Scanning electron microscopy (SEM) was used to describe the starch morphology and particle size. Starch was extracted and purified as previously described [28]. Dry particles were sprinkled on the double-sided tape connected to the sample stub, a thin layer of gold was applied, and then observations were performed at 40,000-fold magnification using SEM (Tescan Mira4, Brno, Czech Republic) at an acceleration potential of 5 kV.
The proteins in the quinoa and sprouts were extracted using alkali extraction and acid precipitation methods [29]. A solution of flour and distilled water was prepared, in a ratio of 1:10. Protein solutions, whose pH values were adjusted to 8.0 with NaOH (1.0 mol/L), were centrifuged (4000 rpm, 15 min) after stirring (55 °C, 1.5 h) to remove insoluble materials. The supernatants, whose pH values were adjusted to 4.5 with HCl (1.0 mol/L), were stirred for 1.5 h and centrifuged (4000 rpm, 15 min). The precipitates were rinsed with distilled water, the pH was adjusted to neutral, and they were freeze-dried and preserved at −20 °C. The Kjeldahl method was used to determine the protein content. SDS-PAGE was performed on stacking gel (5%) and separating gel (12%), with a thickness of 1 mm, to detect the effect of ultrasound stress on protein patterns [30]. A 10% protein solution (w/v) was dissolved in 5× sample buffer and boiled for 5 min. Gels (12 wells) were used to load the samples (3 μL), which were subjected to electrophoresis via stacking and separating gels at constant voltages of 80 V and 120 V, respectively. The gels were then stained with Coomassie Brilliant Blue R250. The determination of amino acids was performed using an amino acid analyzer (L 8900, Hitachi, Japan) [31]. The sample (100 mg) was placed in an ampoule, mixed with 10 mL of 6 mol/L HCl, sealed with nitrogen, and hydrolyzed at 110 °C for 24 h. After hydrolysis, the sample was fixed to 50 mL, and 2 mL of the sample was deacidified to dryness at 45 °C on a rotary evaporator. The residual was dissolved in 2 mL of sample buffer and passed through a 0.45 μm membrane filter for on-line detection. The amino acid content was determined using a cationic resin chromatography column (200 mm × 4.6 mm) and an ultraviolet detector. The detection wavelength of proline was 440 nm, and that used for other amino acids was 570 nm, at a column temperature of 55 °C. The chemical score (CS), amino acid score (AAS), and essential amino acid index (EAAI) were calculated based on the amino acid composition [32]. The calculation formulas are as follows:
C S = A A F i / A A E i A A S = A A F i / A A X i E A A I = ( A A F 1 / A A E 1 ) × ( A A F 2 / A A E 2 ) × × ( A A F i / A A E i ) i × 100
where:
AAFi denotes the amount of a certain EAA in the sample, AAEi denotes the amount of a certain EAA in the whole egg protein, AAXi denotes the amount of a certain EAA recommended by the FAO/WHO model protein, and i denotes the number of amino acid species.
The contents of fatty acids were analyzed according to the Chinese standard method GB5009.168-2016 [33].
TPC was evaluated spectrophotometrically using the Folin–Ciocalteu reagent [34]. Gallic acid was used as standard at a concentration of 0.03–2 mg/mL. The reaction system contained 2 mL of Folin–Ciocalteu reagent (1:5 H2O), 0.5 mL of H2O, 0.5 mL of the sample, and 10 mL of Na2CO3 (10%) after 3 min. After 30 min, the absorbance was measured at 725 nm against a blank sample using a spectrophotometer (WFZ UV-2802H, Unico Instrument Co., Ltd., China). Values were expressed as milligrams of gallic acid equivalent per gram of dry extract (mg GAE/g). To determine the total flavonoid content (TFC), 0.5 mL of sample was mixed with 0.3 mL of AlCl3 (100 g/L), diluted to 2 mL, and measured at a wavelength of 510 nm [35]. Rutin was used as standard at a concentration of 0.03–2 mg/mL. The results were expressed as milligrams of rutin equivalent per gram of dry extract (mg RE/g). As described previously, vanillin-glacial acetic acid reagent was used to measure TSC [36]. Saponin was used as standard at a concentration of 0–500 μg/mL. For this determination, 0.2 mL of sample was mixed with 0.2 mL of vanillin-glacial acetic acid reagent (5%) and 0.8 mL of KMnO4, and allowed to react at 70 °C for 15 min before glacial acetic acid (4 mL) was added, and the TSC was immediately measured at a wavelength of 545 nm. Values were calculated as milligrams of saponin per gram of dried material (mg/g).

2.6. Analysis of Functional Characteristics

2.6.1. Determination of Antioxidant Properties

Each powder (2.00 g) was mixed evenly with methanol (25 mL) at 25 °C and ultrasonicated for 40 min. Then, the mixture was centrifuged (5000 rpm, 15 min) to obtain the supernatant. The supernatant (0.2 mL) was blended with 1 mL of 0.15 mM DPPH radical solution in methanol, incubated in darkness for 30 min, and analyzed spectrophotometrically at 517 nm [37]. The 2,2′-azino-bis (3-ethylbenzthiazoline-6-sulfonic acid) (ABTS) assays were performed using 0.1 g of ABTS and 0.029 g of K2S2O8 dissolved in phosphate-buffered saline (PBS, pH = 6.6), at a constant volume of 100 mL. ABTS+• was produced via oxidation of ABTS with K2S2O8. After incubation in the dark for 16 h, the mixture was diluted with PBS (pH = 6.6) until the absorbance value was 0.7 ± 0.05 at 734 nm. Each mixture contained the above solution (3.9 mL) and sample (0.1 mL) and was reacted for 5 min, and then absorbance was measured at 734 nm [38]. The calculation formulas are as follows:
T h e   s c a n n i n g   o f   D P P H   ( % ) = ( 1 A 1 A 2 A 3 ) × 100 T h e   s c a n n i n g   o f   A B T S +   ( % ) = A 3 A 1 A 3 × 100
where:
A1 indicates the absorbance of the sample with the free radical reaction system, A2 indicates the absorbance of the sample without the free radical reaction system, and A3 indicates the absorbance of the solvent with the free radical reaction system.

2.6.2. Determination of Hypoglycemic Activities

Glucose adsorption capacity (GAC) [39]: According to the method reported in the literature, 0.10 g of sample was mixed with 5 mL of glucose solution (50, 100, and 200 mmol/L), oscillated at 37 °C for 6 h, and centrifuged at 4000 rpm for 20 min. The supernatant was used for the glucose content determination using the DNS colorimetric method.
G A C   ( m m o l / g ) = ( c 0 + c 1 c 2 ) × V m
where:
c0 represents the concentration of the glucose solution, c1 represents the concentration of the sample solution, and c2 represents the concentration of the system after reaction.
For the determination of the glucose dialysis retardation index (GDRI) [39], 0.4 g of sample was mixed with 15 mL of 100 mmol/L glucose solution. Then, the mixture was transferred into a dialysis bag with a molecular weight cutoff of 14,000 and dialyzed against 200 mL of distilled water. From 0 to 150 min, the dialysate was collected every 30 min to determine the glucose content using the DNS colorimetric method.
G D R I   ( % ) = c 0 c c 0 × 100
where:
c is the total glucose diffused from the sample, and c0 is the total glucose diffused from the control.
For the α-amylase activity inhibition ratio (α-AAIR) [39], 0.0250 g of sample was mixed with 75 μL of α-amylase (40 U/mL) and 75 μL of 1% starch solution. The mixture was diluted to 10 mL and incubated at 37 °C for 15 min and bathed in boiling water for 10 min to deactivate the enzymes. After centrifugation at 12,000 rpm for 10 min, the supernatant was used to determine the glucose content.
α AAIR   ( % ) = A 0 A 1 A 0 × 100
where:
A0 denotes the glucose concentration of the control, and A1 denotes the glucose concentration of the sample.
For the α-glucosidase activity inhibition ratio (α-GAIR) [40], α-glucosidase was dissolved in PBS buffer (100 mmol/L, pH = 7.0), 1.0 mg of sample was mixed with 40 μL of 1 U/mL α-glucosidase, and the mixture was incubated at 37 °C for 15 min. Then, 20 μL of 2.5 mmol/L p-nitrophenyl α-D-glucopyranoside was added to the mixture and further incubated at 37 °C for 10 min. Subsequently, 150 μL of 0.2 mol/L Na2CO3 was added to terminate the reaction, and the absorption was measured at 405 nm.
α GAIR   ( % ) = ( 1 A 1 A 2 A 3 A 4 ) × 100
where:
A1 indicates the concentration of the enzyme and sample, A2 indicates the concentration of the sample and PBS buffer, A3 indicates the concentration of the enzyme without the sample, and A4 indicates the concentration of PBS buffer.

2.6.3. Determination of Hypolipidemic Activities

To determine the lipid-binding capacity (LBC) [41], 0.10 g of sample was accurately weighed, mixed with 5 mL of oil, and shaken at 37 °C for 60 min. After centrifugation at 4000 rpm for 20 min, the unbound oil was removed. Soybean oil and lard were chosen as representative unsaturated and saturated fats, respectively.
LBC ( % ) = m 1 m 0 m 0 × 100
where:
m0 is the mass of the sample, and m1 is the mass of the sample after the adsorption of liquid.
Cholesterol binding capacity (CBC) [42] was determined according to a previously reported method, with slight modifications. A yolk was divided from the egg white and diluted with 9 times the volume of distilled water. Quinoa (0.10 g) was mixed with 4 mL of diluted yolk, and then shaken in a water bath (120 rpm, 37 °C) for 2 h, centrifugated at 4000 rpm for 20 min, and diluted by 10 times. Thereafter, 0.4 mL of supernatant was blended with 1.5 mL of o-phthalaldehyde and 1 mL of H2SO4, reacted for 10 min in darkness, and measured at 550 nm.
CBC   ( % ) = A 0 A 1 A 0 × 100
where:
A0 is the cholesterol concentration of the control, and A1 is the cholesterol concentration of the sample.
To determine the bile salt-binding capacity (BBC) [43], four cholate salts (sodium cholate, sodium taurocholate, sodium deoxycholate, and sodium glycocholate) were used. According to the method reported in the literature, the samples (0.0250 g) were added with 0.01 mol/L HCl (0.25 mL) and oscillated at 37 °C for 1 h, simulating gastric digestion in vitro. The reaction mixture, the pH of which was adjusted to 7.0, was added to 4 mL of 2 g/L bile solution, dissolved in 0.01 mol/L phosphate buffer at pH 7.0. It was shaken at 37 °C for 20 min to simulate intestinal digestion in vitro, and centrifuged at 8000 rpm for 20 min. Then, 0.3 mL of supernatant was blended with 3 mL of H2SO4 (45%, v/v) and subjected to a water bath at 70 °C for 20 min and an ice water bath for 5 min. The concentration was measured at 387 nm.
BBC   ( % ) = A 0 A 1 A 0 × 100
where:
A0 is the initial concentration of the bile salt, and A1 is the concentration of the bile salt after adsorption.
For determining the pancreatic lipase activity inhibition ratio (PAIR) [44], 0.050 g of sample, 0.1 mL of porcine pancreatic lipase (60 U/mL), 1 mL of soybean oil, and 5 mL of phosphate buffer (0.1 mol/L, pH 7.0) were thoroughly mixed together and oscillated at 37 °C for 1 h. The mixture was bathed in boiling water for 10 min to terminate the reaction. Then, NaOH standard solution (0.01 mol/L) was used for titration with phenolphthalein as an indicator.
PAIR   ( % ) = V 0 V 1 V 0 × 100
where:
V0 is the titration volume of NaOH without adsorption, and V1 is the titration volume of NaOH with adsorption.

2.7. Statistical Analysis

The data reported in this study are expressed as the mean ± S.D. One-way ANOVA, performed with SPSS version 25 (SPSS Institute, Chicago, IL, USA), was used to identify significant differences between the sample means. Values of p < 0.05 and p < 0.01 indicate significant and extremely significant differences, respectively.

3. Results and Discussion

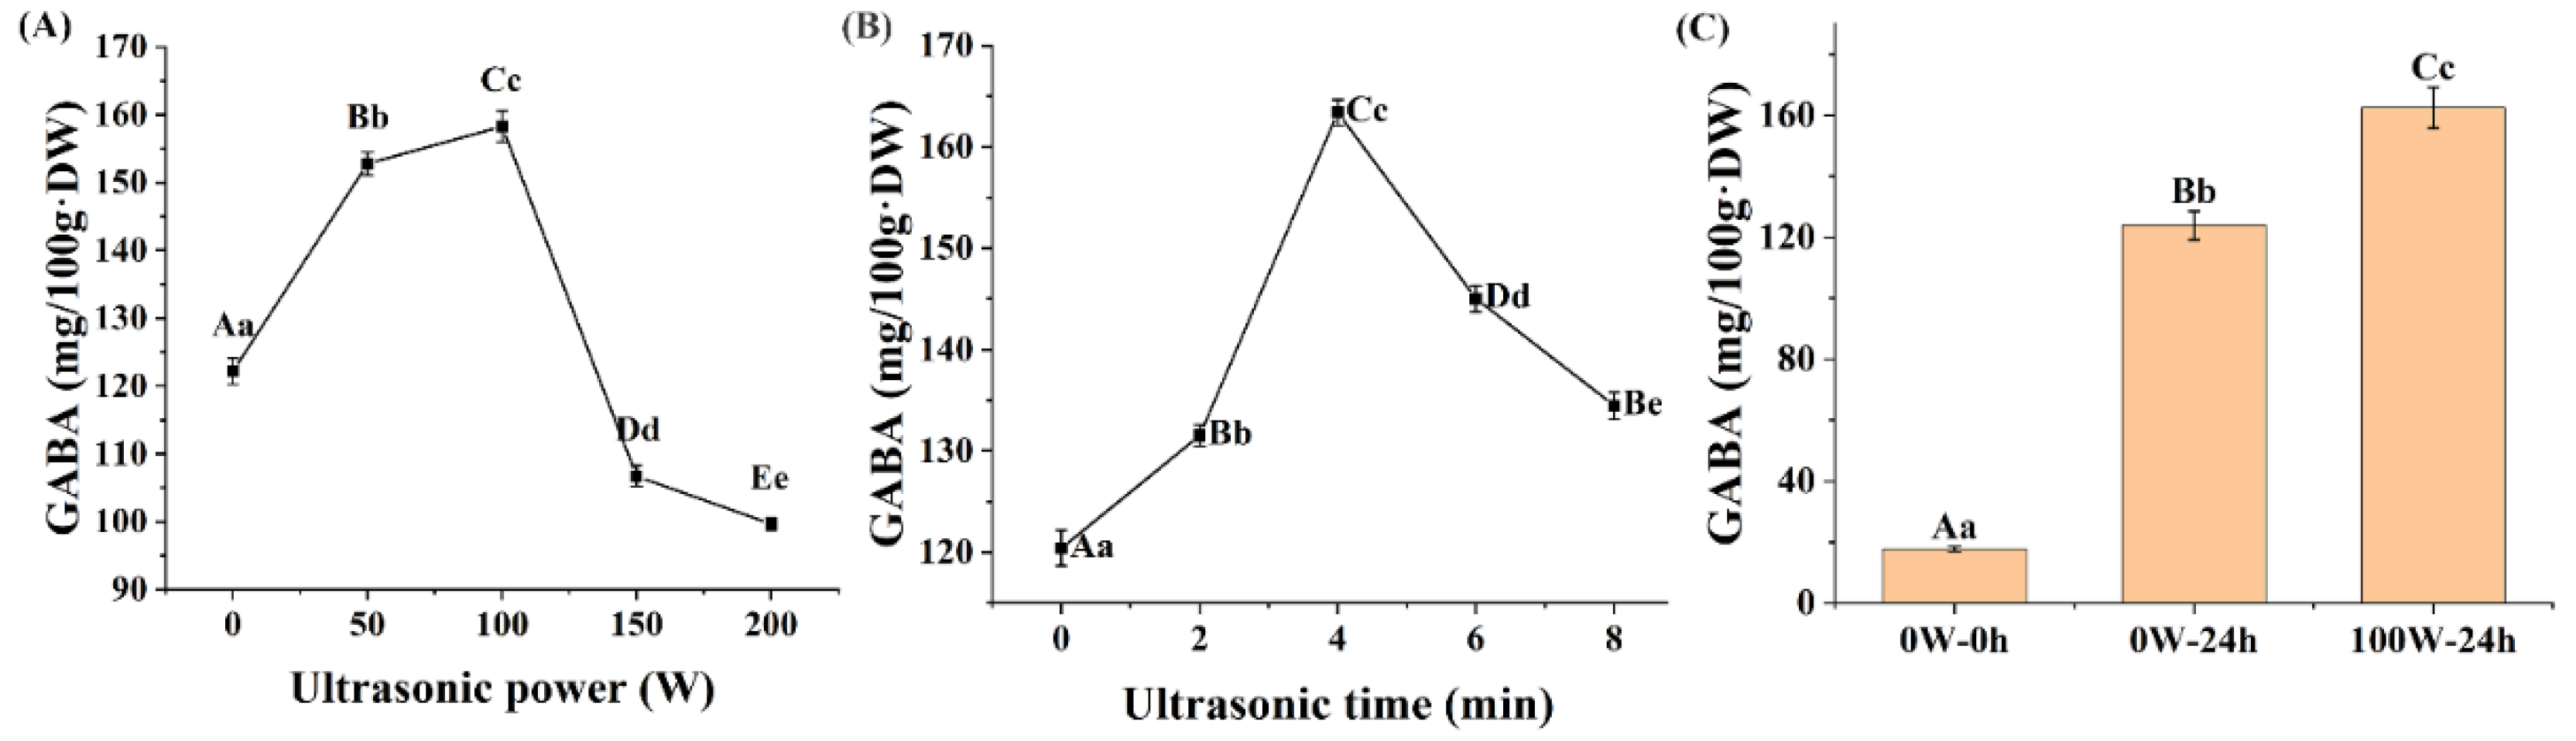
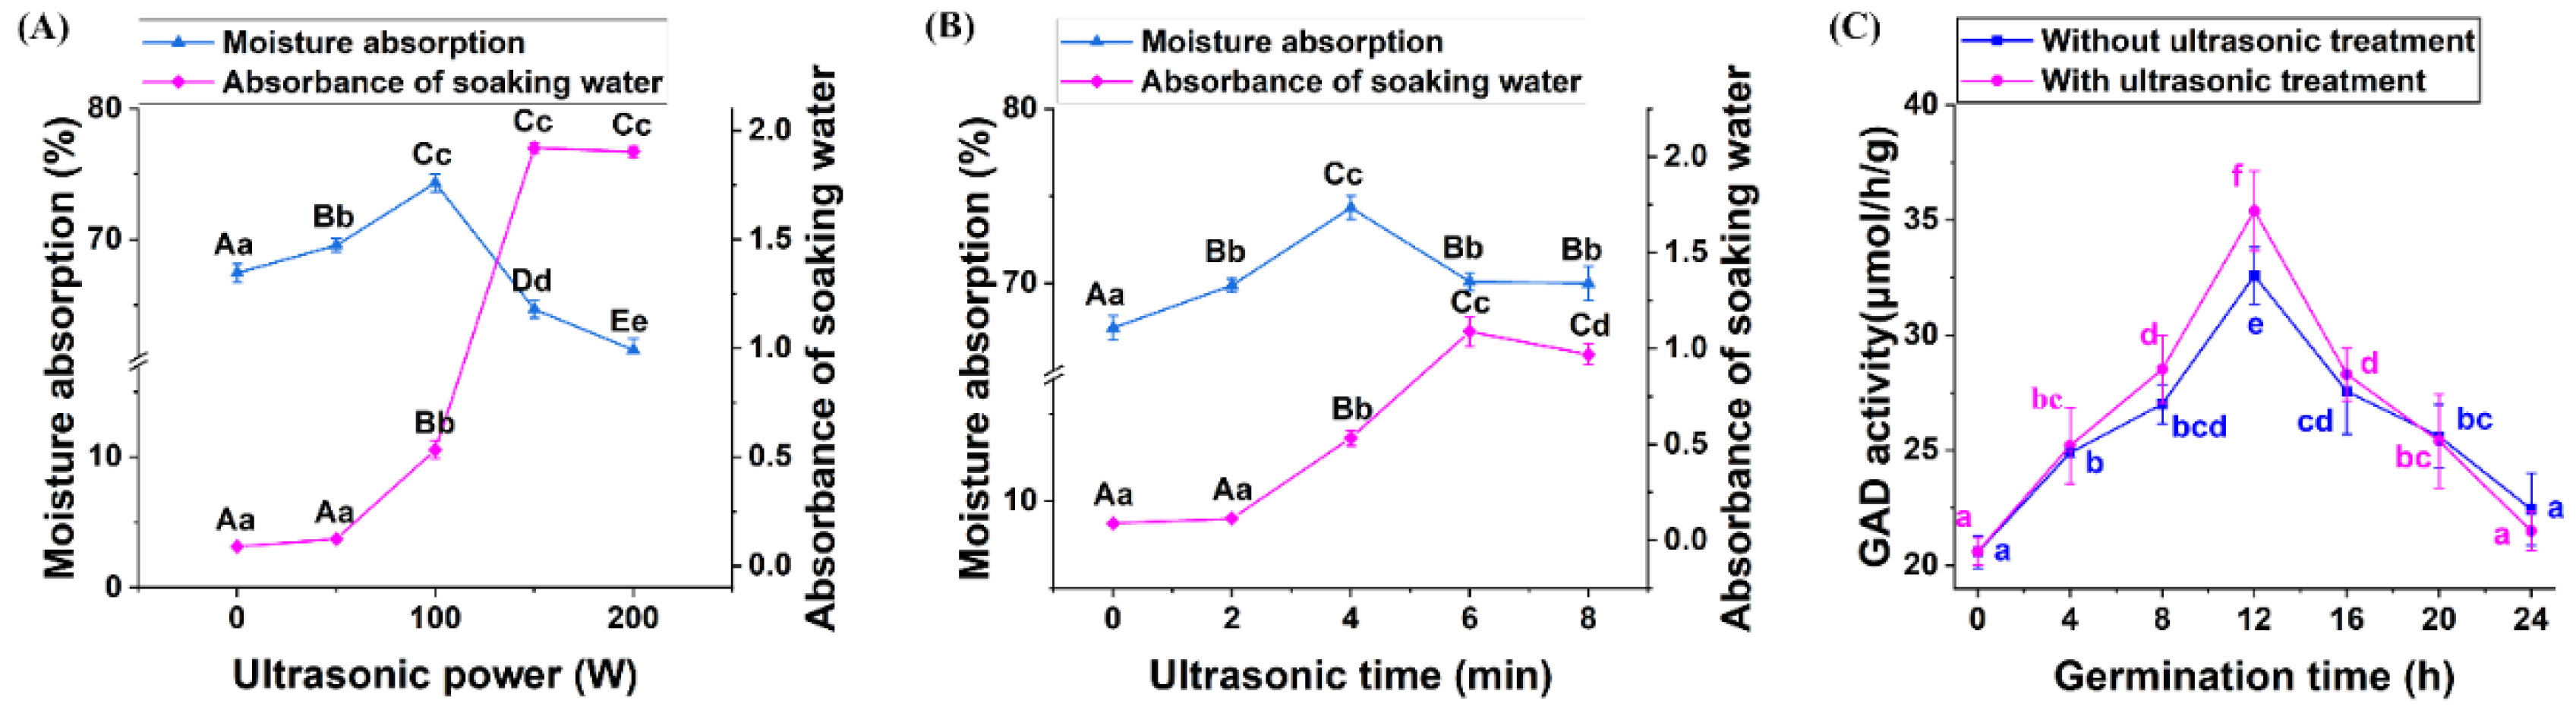
3.1. Effects of Ultrasonic Treatment on the GABA Accumulation of Quinoa during Germination

GABA is widely distributed in plant species at low levels [15] and it accumulates under stress conditions as a stress response factor [16]. Ultrasound is an environmentally friendly and non-thermal stress method. As shown in Figure 2A,B, the GABA contents reached a peak value under 100 W and 4 min of ultrasonic treatment after germination, and then decreased. Compared with quinoa without ultrasonic stimulation and germination (17.75 ± 0.83 mg/100 g·DW), and quinoa with 24 h germination without ultrasonic stimulation (123.85 ± 4.66 mg/100 g·DW), the GABA content of 24 h germinated quinoa treated with 100 W ultrasonication for 4 min (162.47 ± 06.69 mg/100 g·DW) increased by 815.3% and 31.2%, respectively (Figure 2C). Studies on red rice [18], soybean [22], maize [45], oat [19], and whole-grain brown rice [20] showed that GABA contents could be enriched via ultrasound treatment, to 41.58 mg/100 g·DW–338.38 mg/100 g·DW, which represents a range of 5.36–69.2%. Furthermore, the application of ultrasound stress after germination could generate more GABA in quinoa per unit of time than those generated in the above cereals.
During the ultrasonic process in an aqueous medium, mechanical and chemical effects on seeds are induced by the collapse of cavitation bubbles, which are produced through a series of compression and rarefaction processes [46]. As observed in Arabidopsis, low-frequency short-duration ultrasonic treatment promoted water uptake and oxygen supply because ultrasonic cavitation altered the permeability of the cell membrane [47]. Correspondingly, a 10.21% increase in water absorption after ultrasonic treatment (100 W, 4 min) was observed (Figure 3A,B), which may promote the activities of enzymes required for germination. As shown in Figure 3C, at 12 h of germination, ultrasonic stress caused a significant increase in GAD activity, which irreversibly converted glutamate to GABA [48]. However, with increasing sonication time or power, physical and chemical damage occurs, owing to the very rapid local changes in temperature and pressure caused by ultrasound waves, which can produce fatal effects on seeds soaked in a water bath [49]. The results showed that the turbidity of the quinoa soaking water increased and the water absorption decreased significantly when the ultrasonic conditions exceeded 100 W or 4 min, indicating that the cell membrane and seed coat, as physical barriers for quinoa, were probably damaged. Thus, proper ultrasonic stress may have enhanced the GAD activity of quinoa seeds by promoting cell wall permeability and water absorption, which, in turn, facilitated GABA accumulation.
The previous experimental results indicated that the GABA content of quinoa sprouts peaked at 24 h of germination without ultrasonic stress. Further experiments revealed that ultrasonic treatment at 100 W for 4 min at the pre-germination stage was the optimal enrichment condition for GABA. Therefore, the samples were divided into three groups: 0 W–0 h, quinoa plants without ultrasonic stimulation and germination; 0 W–24 h, quinoa plants with 24 h germination; 100 W–24 h, ultrasound-treated (100 W, 4 min) quinoa plants with 24 h germination. The three treatments of quinoa (0 W–0 h, 0 W–24 h, and 100 W–24 h) were used for subsequent experiments.

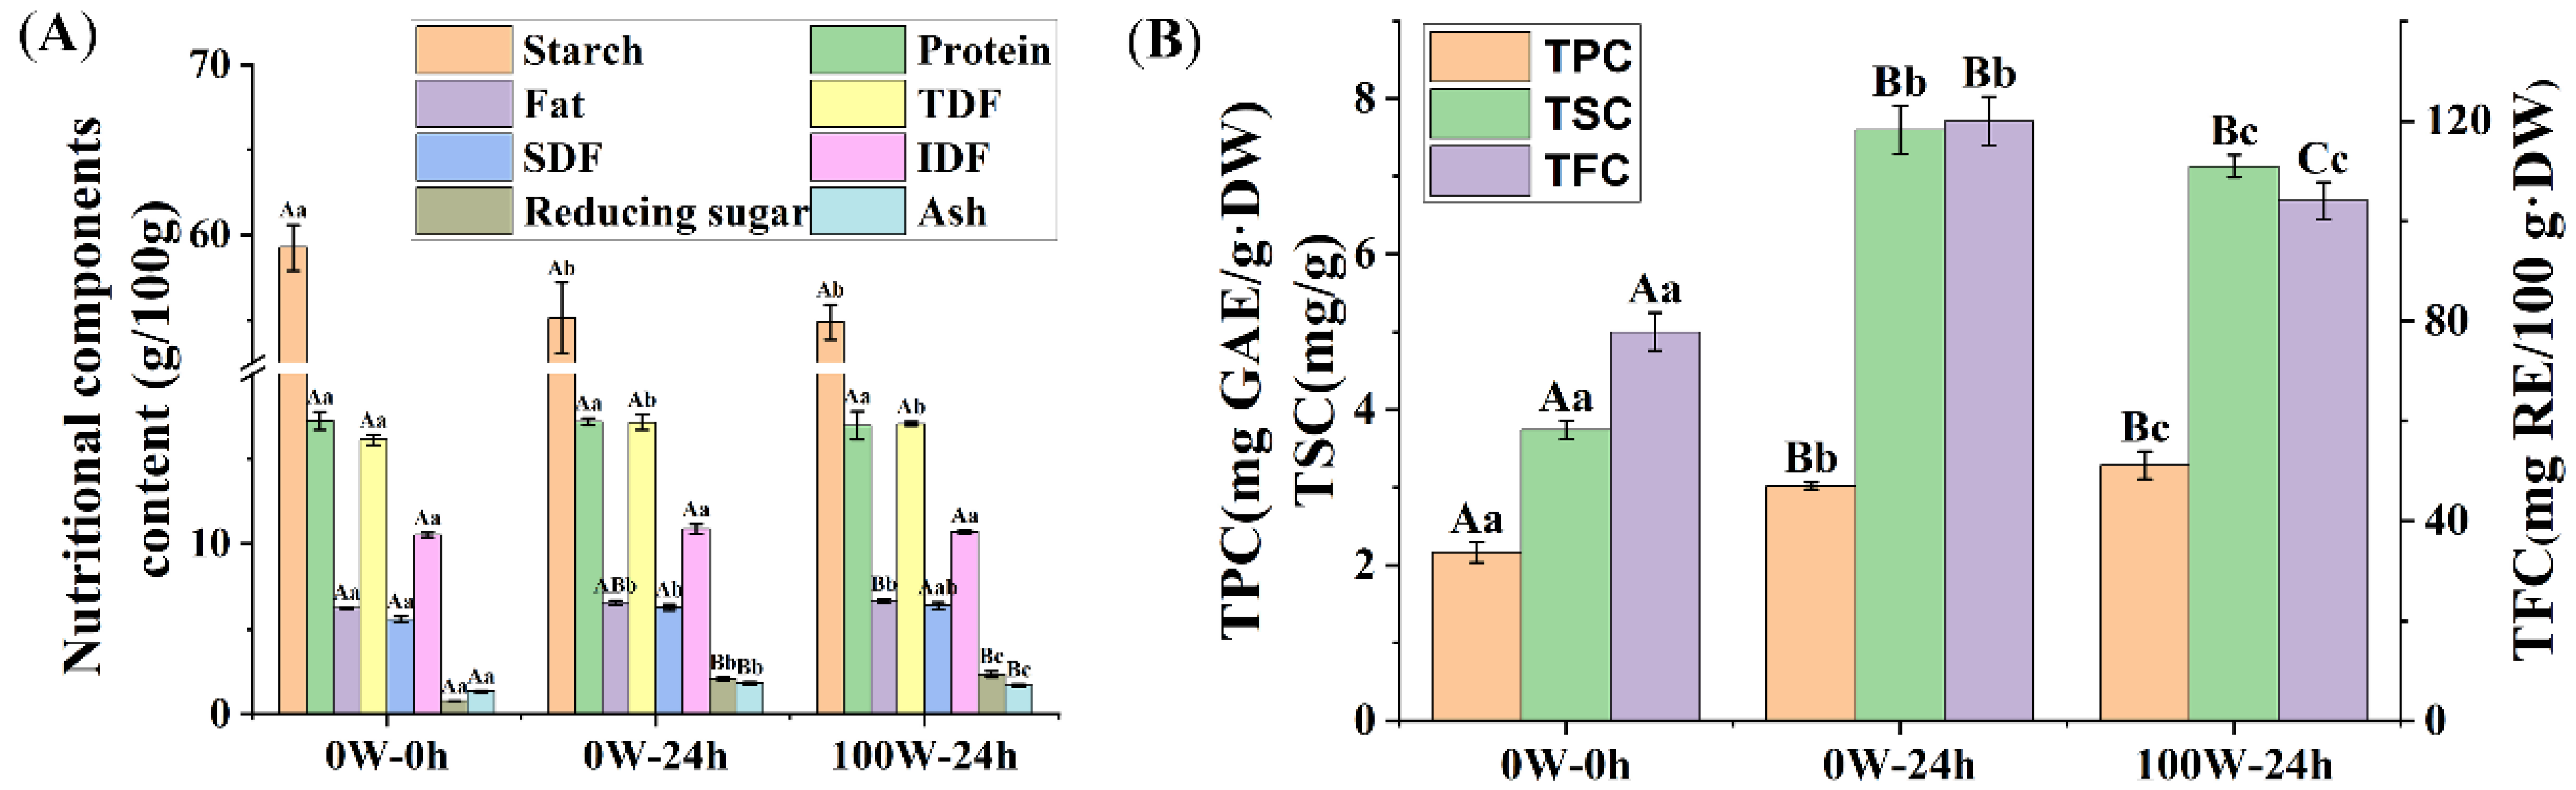
3.2. Effects of Ultrasonic Treatment on the Nutritional Quality of Quinoa during Germination

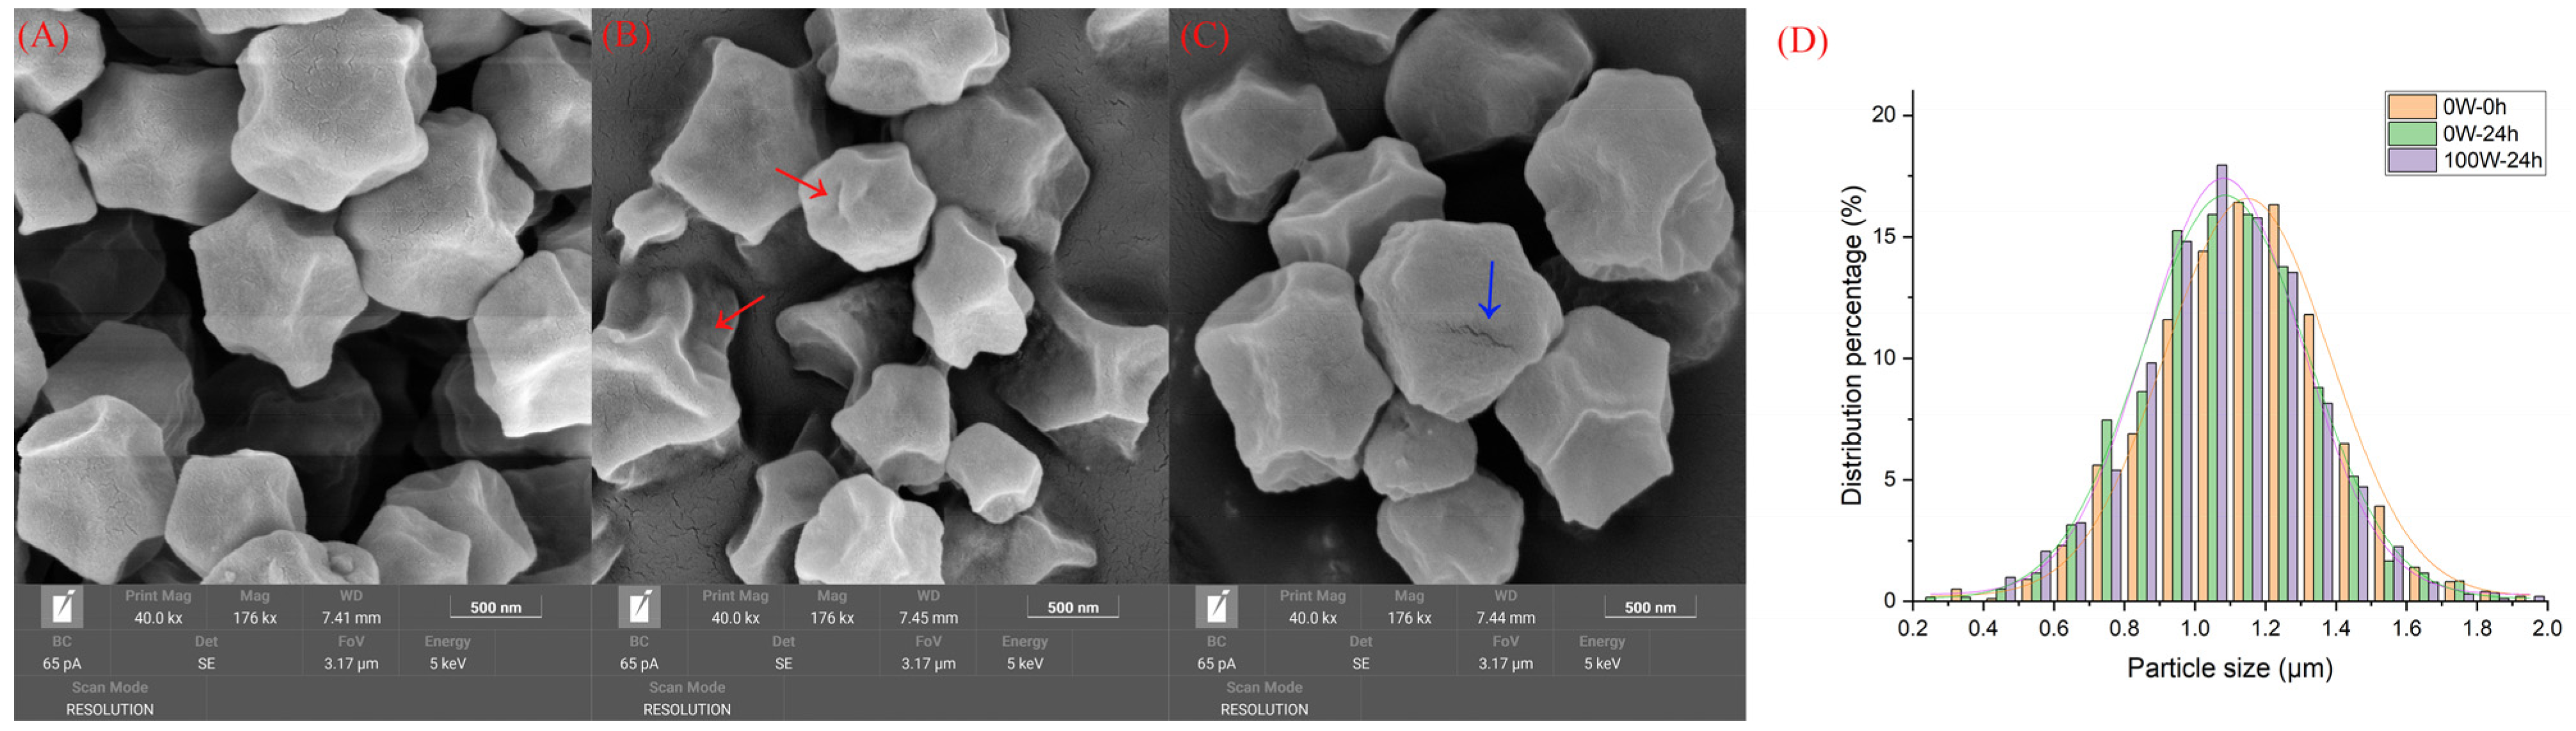
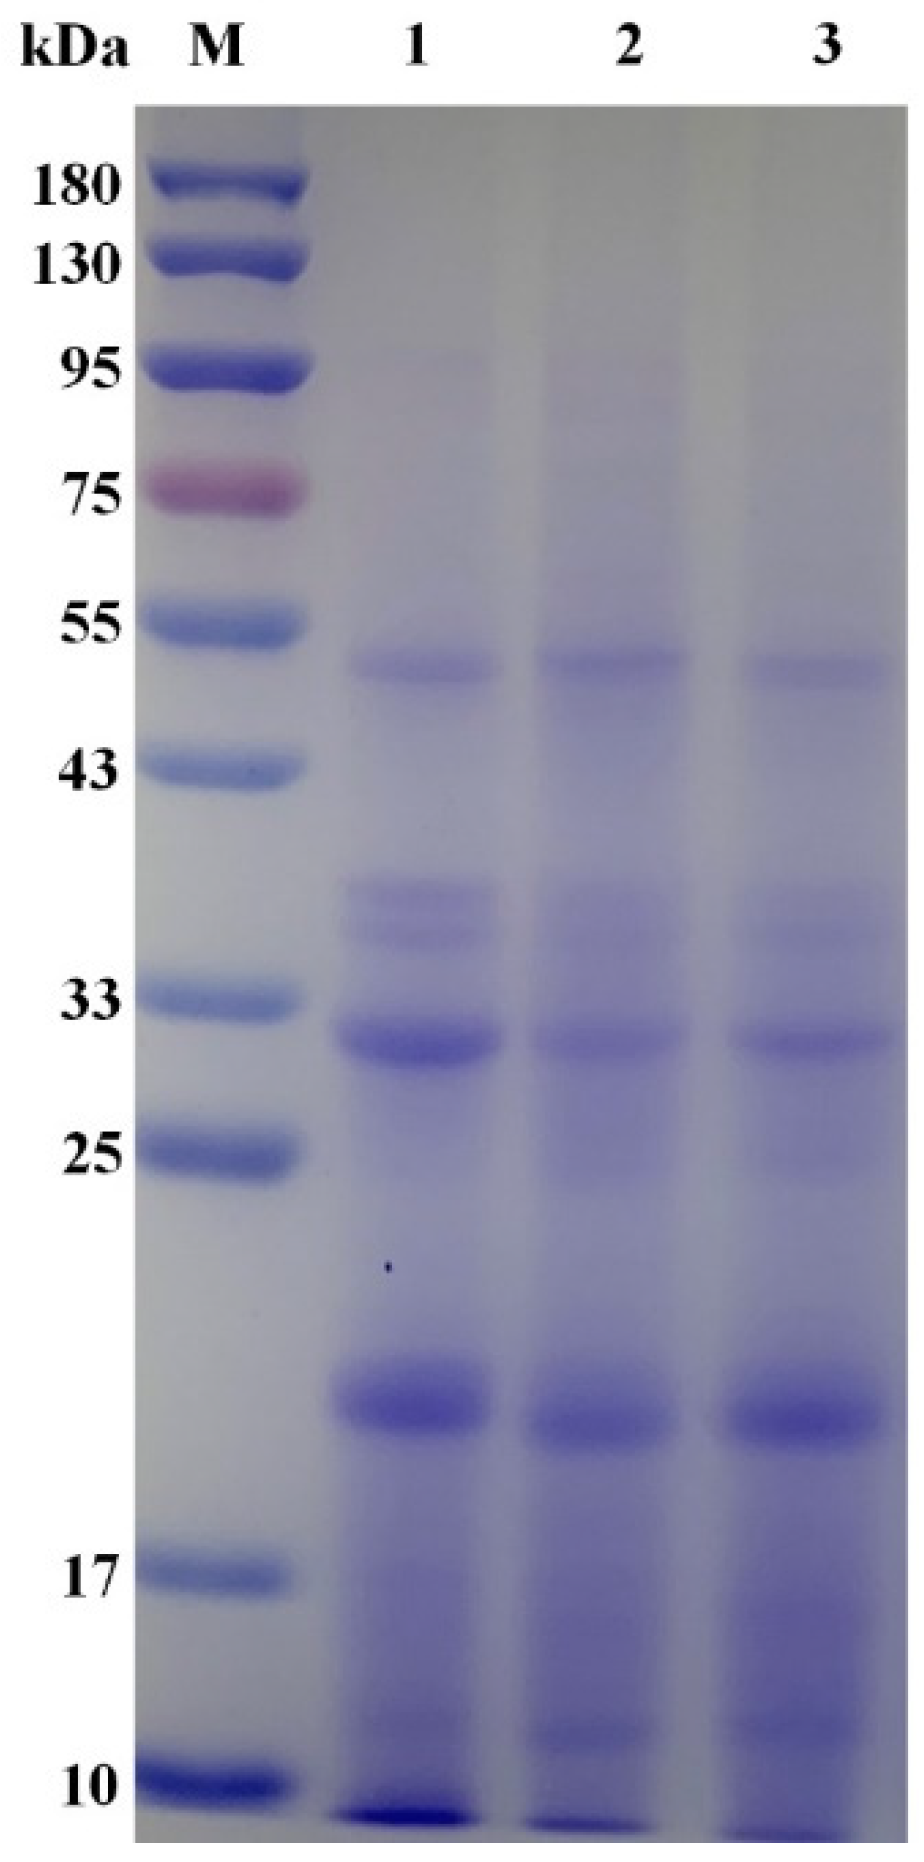
3.2.1. Effects of Ultrasonic Treatment on the Basic Nutritional Components in Quinoa during Germination

The changes in the basic nutritional components, such as the starch, protein, fat, total dietary fiber (TDF), soluble dietary fiber (SDF), insoluble dietary fiber (IDF), reducing sugar, and ash contents of quinoa are shown in Figure 4A. Compared with the 0 W–0 h quinoa, the starch contents of the 0 W–24 h quinoa decreased by 6.99%, while the fat, TDF, SDF, IDF, reducing sugar, and ash contents increased by 4.92%, 6.52%, 12.34%, 3.44%, 171.98%, and 38.53%, respectively (p < 0.05). Compared with the 0 W–24 h quinoa, the ash contents of the 100 W–24 h quinoa decreased by 8.14%, while the reducing sugar contents increased by 13.01% (p < 0.05). Significant differences were not observed in the protein content of quinoa samples among the 0 W–0 h quinoa and the 0 W–24 h, and 100 W–24 h treatments. This suggests that ultrasonic stimulation prior to sprouting can accelerate starch decomposition, as observed in whole-grain brown rice [20]. This phenomenon could be related to the more active enzymatic hydrolysis process under ultrasonic treatment, which disrupts starch–lipid and starch–protein compounds and promotes starch hydrolysis, thus leading to increased sensitivity of starch to amylase; however, amylase activity could be impaired with ultrasound treatment, depending on the treatment conditions [50,51]. In addition, proteolysis caused by germination does not significantly change the total protein content and was more severe after at least two days of germination [52]. In this experiment, ultrasound treatment and germination did not significantly reduce protein content, possibly because the germination time was only 24 h.
To further illustrate the effects of ultrasound treatment on quinoa starch granule morphology and granule size distribution, the microstructure of the starch was characterized using SEM. Quinoa starch exhibited granular polygons, and the particle surface appeared rough (Figure 5A–C), which is consistent with previous reports [53]. On the surfaces of the quinoa starch particles, germination for 24 h increased crimples, and ultrasound stress caused fissures that increased the exposure of starch to enzymes and ultimately promoted the hydrolysis of starch and the biosynthesis of reducing sugar. Previous studies have shown that more pinholes and evident curls appeared on the surface of sprouting quinoa starch particles, compared with the surface of native starch [54]. Meanwhile, germination for 24 h shifted the bell-shaped particle size distribution to the left. This changing pattern was enhanced through ultrasound stimulation (Figure 5D). The average particle size of quinoa starch ranged from 1.0809 ± 0.0044 μm (100 W–24 h) to 1.1483 ± 0.0066 μm (0 W–0 h), indicating that the quinoa starch granule sizes significantly decreased, by 5.87%, under ultrasound and germination. These results were consistent with the observation of the effect of ultrasonic pre-treatment on whole rice starch during germination, which was attributed to ultrasound promoting the degradation of starch particles in reaction to enzymatic attack [20].
Differences in the protein patterns among quinoa samples were analyzed using SDS-PAGE, as presented in Figure 6. According to previous studies, quinoa proteins are composed of 11S-globulin (containing peptides with molecular weights of 22–23 kDa and 32–39 kDa) and 2S-protein (with a molecular weight of 9 kDa) [29]. The electrophoretic protein patterns on the gels were relatively constant. However, some protein bands from the 0 W–24 h and 100 W–24 h treatments, on the electrophoresis gel, showed lower intensities compared with those from the 0 W–0 h quinoa. Proteolysis was more pronounced for proteins ranging from 33 to 43 kDa. Germination and ultrasound treatment had effects on the peptide chains of the proteins, as indicated by changes in the intensities of some protein bands. Similar tendencies have been shown in soybean and oat [22,55].
The changes in the amino acid contents of quinoa are shown in Table 1. Notably, the levels of lysine in all quinoa samples (4.19–4.43 g/100 g protein) were higher than those in barley (2.32–2.82 g/100 g protein), wheat (1.09–1.51 g/100 g protein), and rye (1.97–3.42 g/100 g protein) [56]. Meanwhile, ultrasound treatment was only beneficial for accumulating total acid amino acids, not total basic amino acids. Considering the proteins of the 0 W–0 h quinoa, leucine, glutamate, and isoleucine were the three main amino acids, while, among the proteins of the 0 W–24 h and 100 W–24 h treatments, leucine, glutamate, and methionine were the three main amino acids, accounting for 24.41–25.06% of total amino acids. Germination and ultrasound treatment promoted the accumulation of aspartate, glutamate, alanine, and proline. Studies have shown that proline accumulation is related to abiotic stress tolerance [57]. Alanine, which promoted the cellular energy metabolism of germinated rice, showed similar trends as GABA under ultrasonic treatment [18]. Pyruvate, α-ketoglutaric acid, and oxaloacetic acid, produced during the aerobic decomposition of sugar, can be aminated and converted into alanine, glutamate, and aspartate, respectively. To resist the oxidative stress caused by abiotic stress, GABA can be synthesized from glutamate and arginine through the GABA shunt and polyamine degradation pathways, respectively. This finding shows that the abiotic stress caused by ultrasound treatment can be alleviated by improving carbon metabolism and amino acid biosynthesis during the germination of quinoa. Meanwhile, germination increased the contents of valine and methionine and decreased the contents of isoleucine and leucine. In a study on mung bean, germination increased the contents of valine and methionine [31]. As shown in Table 1, ultrasound treatment also enhanced the accumulation of phenylalanine and the consumption of valine, methionine, isoleucine, and arginine. Polyamines are derived from arginine [58], which is further synthesized into GABA. As shown in Table 2, germination and sonication had essentially no effect on the nutritional value of essential amino acids, but it is noteworthy that germination and sonication slightly increased the amino acid score (AAS) and chemical score (CS) values for lysine.
Quantitative analysis of the composition of 37 fatty acids in quinoa was conducted using gas chromatography. As shown in Table 3, 14 fatty acids were detected, and they were all long-chain fatty acids. In all quinoa samples, linoleate (52.90–53.77%), oleate (20.06–21.46%), palmitate (9.67–10.00%), and alpha linoleate (8.74–9.34%) were the main fatty acids. Moreover, n6/n3 polyunsaturated fatty acids (PUFAs) were improved by 4.85% and 6.79% via germination and ultrasound treatment, respectively, and these values are closer to the recommended daily intake in a healthy diet (4:1). The n6/n3 PUFA ratio of the 100 W–24 h quinoa (5.48/1) was lower than those of olive oil (13.4/1), corn oil (52/1) [59], soybean oil (7.4/1), and Spanish experimental quinoa (9/1) [60], and better than the average ratios in both Western diets (15.0/1–16.7/1) and Chinese diets (20/1–30/1) [61]. An imbalance in n6/n3 PUFAs is associated with inflammatory diseases, including diabetes, cardiovascular diseases, and cancer [61].

3.2.2. Effects of Ultrasonic Treatment on the Phytochemical Composition of Quinoa during Germination

As shown in Figure 4B, the TPC, TFC, and TSC of the 0 W–24 h quinoa were 39.76%, 27.43%, and 103.21% higher than those of the 0 W–0 h quinoa (p < 0.01). The same trends for the TPC and TFC were found in mung bean seeds [31], amaranth flour [62], fava bean [34], and soybean [63]. In fava bean, the levels of saponins increased by germination [34]. However, another study on quinoa revealed that the saponin content, of 0.860 mg/100 g, decreased to 0.086 mg/100 g after 48 h of germination [64]. In addition to the controversy regarding the effect of germination on saponin content, various studies have found that the TPC and TFC were promoted by germination, which is consistent with the experimental results in this study. However, changes in the TPC, TFC, and TSC values were relatively complex under abiotic stress. Compared with the 0 W–24 h quinoa, the TPC of the 100 W–24 h quinoa increased by 8.7%, whereas the TFC and TSC of the 100 W–24 h quinoa decreased by 13.32% and 6.18%, respectively (Figure 2B). In oats, ultrasound treatment increased the TPC level [19]. Meanwhile, the TSC was reduced in tomato and cucumber under salinity stress, whereas the TPC increased [65]. A study on Haloxylon stocksii, a moderately salt-tolerant plant, showed that its TFC and TSC levels decreased under saline conditions [66]. The above research results are consistent with the experimental results in this study. Plants under abiotic stress (including ultrasonic stress) regulate the biosynthesis and consumption of polyphenols, flavonoids, and saponins in response to oxidative stress, which involve the removal of reactive oxygen species and the phenylpropanoid pathway, as well as other biosynthetic pathways. Among them, saponins that protect plants against oxidative stress are attracting increasing attention.

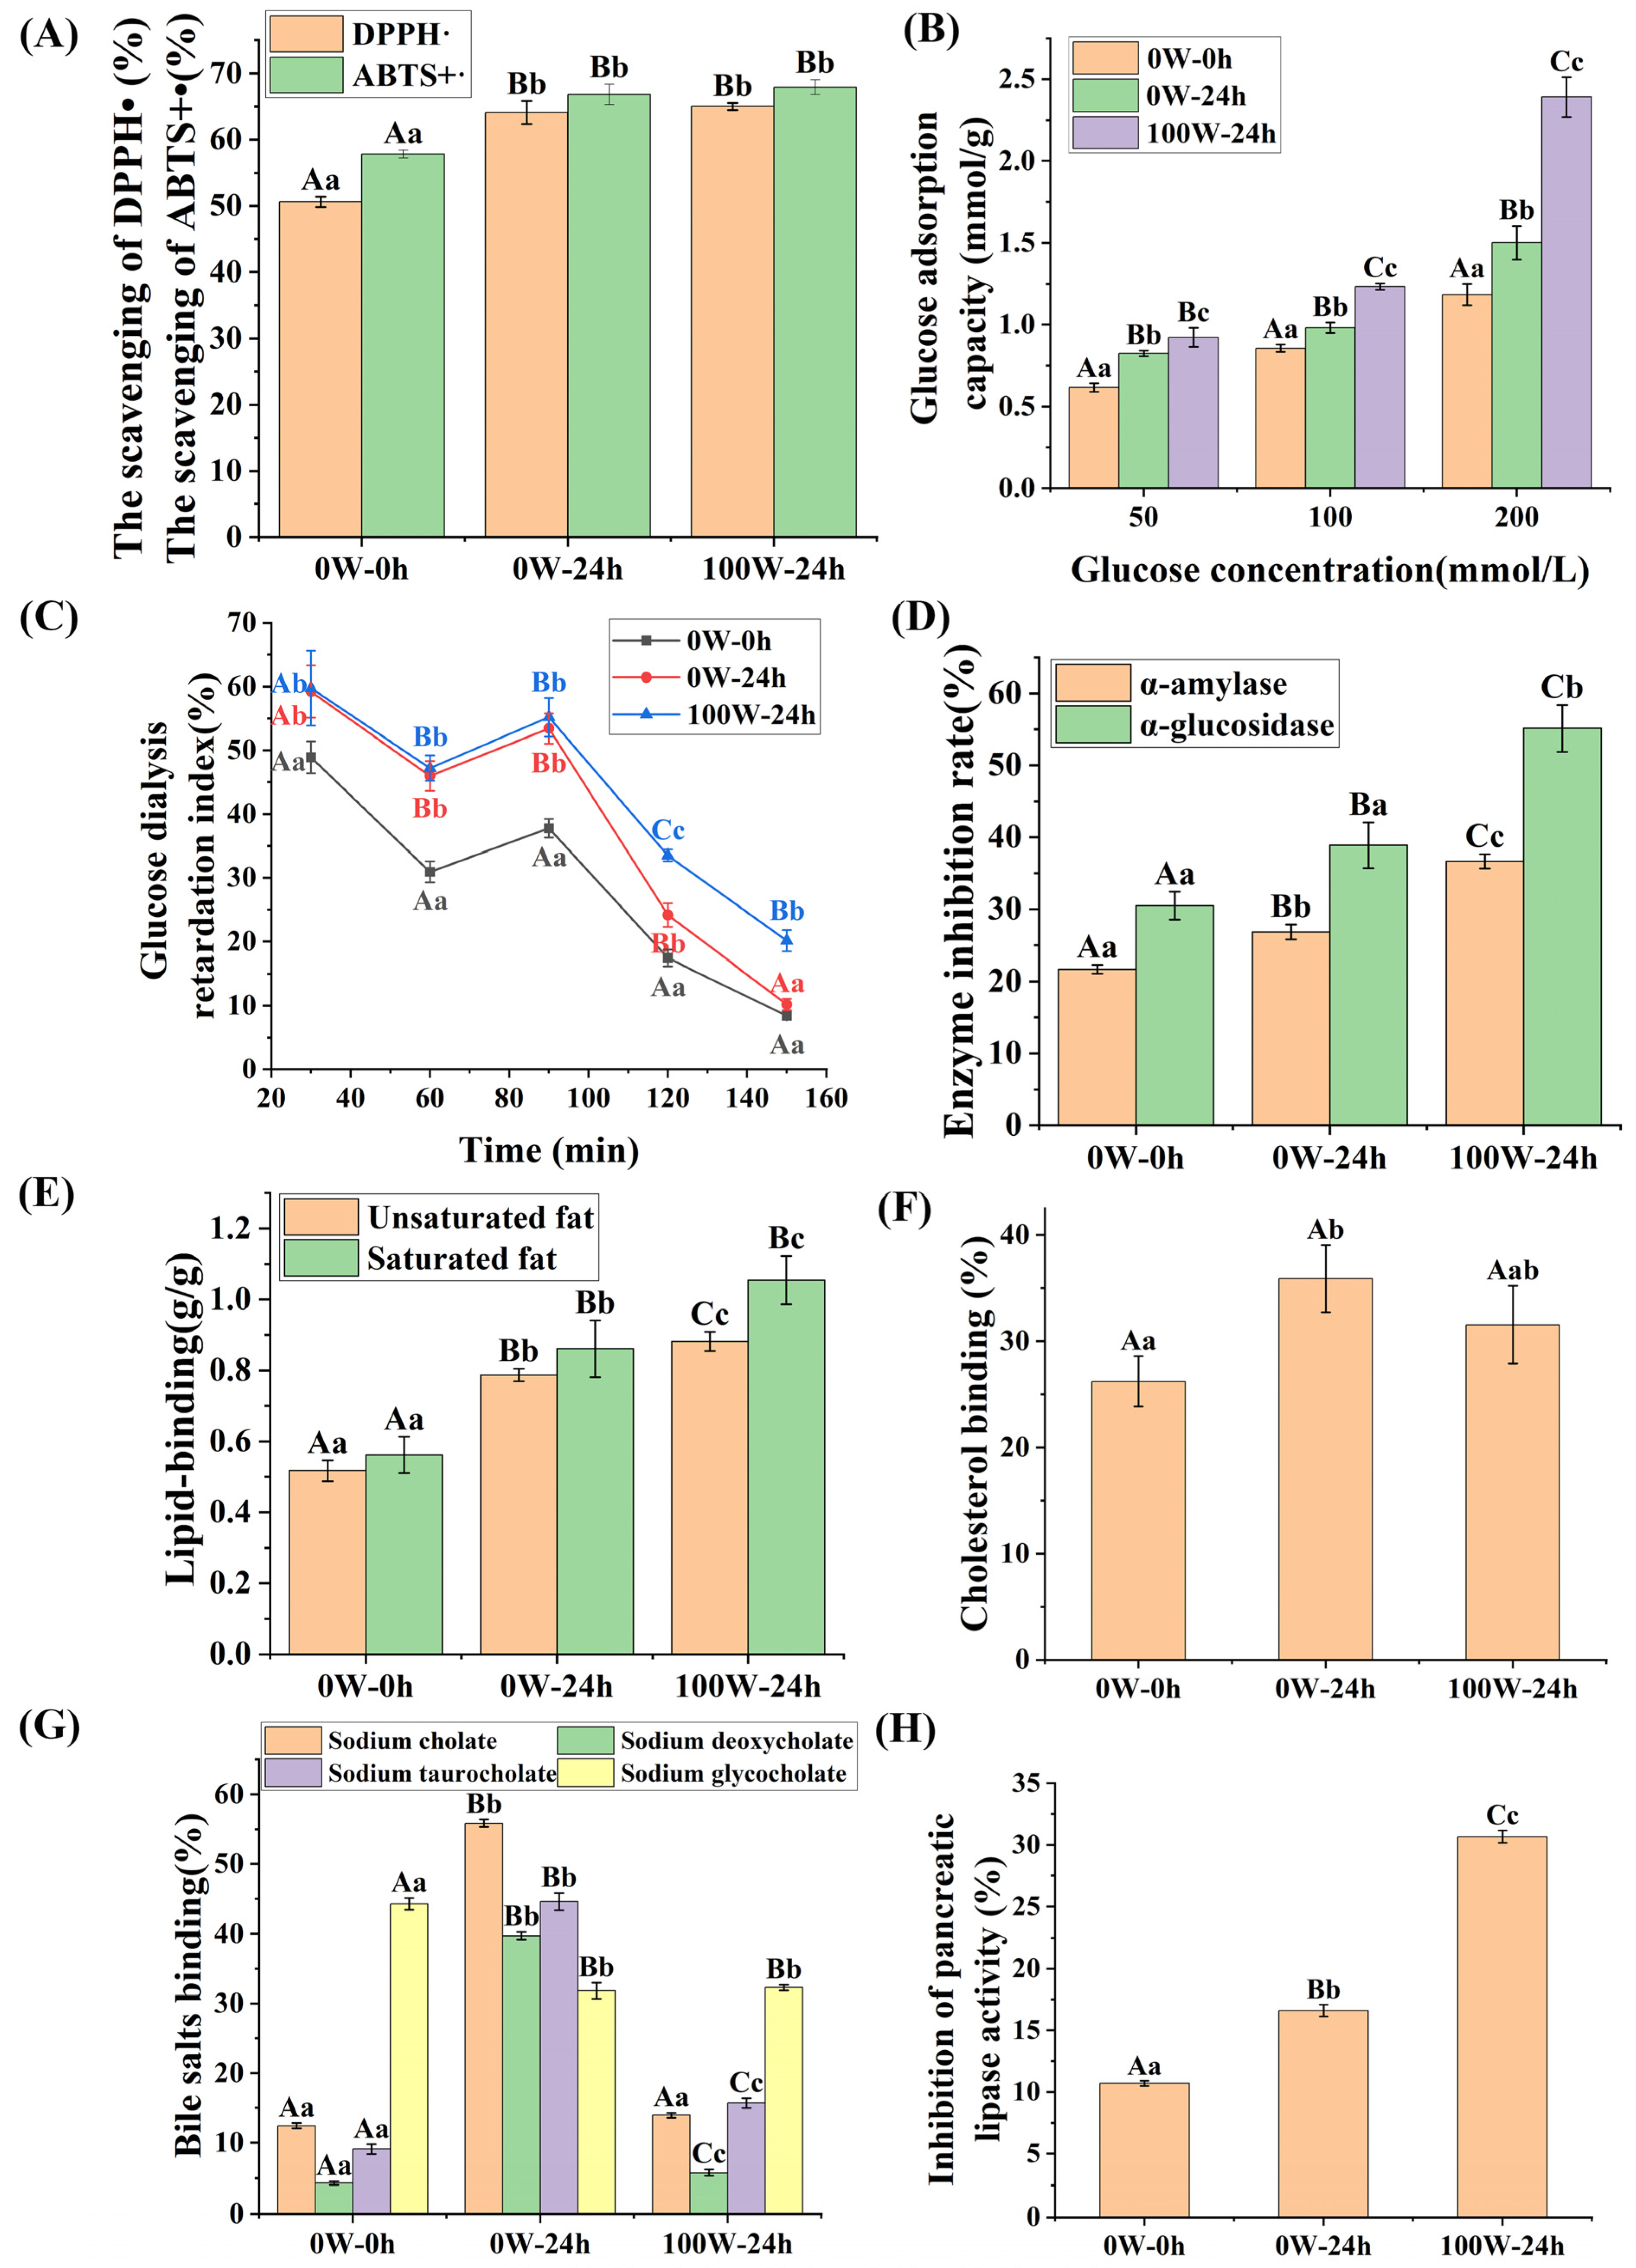
3.3. Effects of Ultrasonic Treatment on the Functional Characteristics of Quinoa during Germination

To explore the effects of ultrasound stress on the functional properties of quinoa, we determined the antioxidant, hypoglycemic, and hypolipidemic capacities of quinoa.

3.3.1. Effects of Ultrasonic Treatment on the Antioxidant Properties of Quinoa during Germination

The scavenging of DPPH• and ABTS+• among the treatments followed a descending order of 100 W–24 h ≥ 0 W–24 h > 0 W–0 h, 100 W24 h ≥ 0 W–24 h > 0 W–0 h (Figure 7A). Free radical scavenging was markedly enhanced by germination, which was further promoted by ultrasonic treatment, with no statistical difference. These data indicate that the scavenging of DPPH• and ABTS+• were positively associated with the TPC. Research on peanuts has shown that the TPC and TFC values, as well as the antioxidant activity, are significantly promoted by germination, and the antioxidant activity of germinated peanut extract is closely related to its TPC and TFC [67]. Furthermore, saponins that defend against oxidative stress have attracted increasing attention. Alfalfa saponins have been identified as potential inartificial antioxidants, owing to their remarkable antioxidant activity [68], and notoginsenoside R1 can alleviate neuronal injury by restraining the production of reactive oxygen [69]. Compared with ungerminated amaranth flours, germinated samples exhibited an increase in antioxidant activity, by 54.3% [62]. Various studies have indicated that the antioxidant activities of wheat [70], barley [71], brown rice [72], and oats [73] increases by 20–190% after germination (15–28 °C, 2–5 d). Sprouting generally promotes antioxidant activity in cereals, which is consistent with this study. However, the effects of abiotic stress on antioxidant activity are relatively complex. In oats, ultrasound treatment increased antioxidant activity [19], whereas, in tomato and cucumber plants, salinity stress reduced antioxidant activity [65].

3.3.2. Effects of Ultrasonic Treatment on the Hypoglycemic Activity of Quinoa during Germination

The hypoglycemic effects of quinoa are shown in Figure 7B–D. Figure 7B shows that the GAC of the 0 W–0 h quinoa and the 0 W–24 h, and 100 W–24 h treatments increased, from 0.62 mmol/g to 2.39 mmol/g, successively. Figure 7C shows that the 100 W–24 h treatment generated the highest GDRI, followed by the 0 W–24 h treatment, with both rates exceeding that of the 0 W–0 h treatment. GDRI is an effective index in vitro and is frequently used to calculate the delay of glucose absorption in the gastrointestinal tract. GAC and GDRI might be related to the content and structure of DF and the amounts of functional groups exposed to glucose in quinoa. These groups (especially the phenolic group), with outstanding affinity to glucose, can effectively inhibit the diffusion of glucose [74]. High concentrations of SDF can delay the diffusion of glucose by enhancing the binding of glucose molecules to the fiber network [75]. For DF, ultrasound treatment and enzymolysis resulted in a honeycomb network structure, which increased the contact area with glucose, leading to relatively high GAC and GDRI values [39,76]. These results indicated that ultrasound treatment and germination enhanced the GAC of quinoa, which might benefit the delay of glucose absorption in the gastrointestinal tract and inhibit the rise of postprandial blood glucose. The strategy of controlling hyperglycemia via inhibition of α-amylase and α-glucosidase, associated with carbohydrate digestion, is considered as a viable prophylactic treatment [77]. Pairwise comparisons of three quinoa samples showed that germination increased α-AAIR and α-GAIR by 23.64% and 27.53%, respectively, and ultrasound treatment further enhanced α-AAIR and α-GAIR by 36.62% and 41.77%, respectively (Figure 7D). The DF prevents the reaction of the enzyme and substrate, which inhibits the catalytic efficiency of starch hydrolysis [78], while phenolic substances compete with the substrate for the active binding sites of α-amylase and α-glucosidase [79]. The results indicated that quinoa flours subjected to ultrasound treatment and germination present decreased generation of glucose and sorption of glucose in the gastrointestinal tract, thus leading to a lower postprandial blood glucose.

3.3.3. Effects of Ultrasonic Treatment on the Hypolipidemic Activity of Quinoa Plants during Germination

The results of the hypolipidemic effects of quinoa are shown in Figure 7E–H. As shown in Figure 7E, the 100 W–24 h treatment generated the highest LBC, followed by the 0 W–24 h treatment, and both values exceeded those of the 0 W–0 h quinoa. Moreover, the holding capacities of saturated fat in quinoa were better than those of unsaturated fat, which are important indicators for predicting weight loss. Quinoa samples are rich in polysaccharides and dietary fiber, and their honeycomb network structure might be enhanced by ultrasound treatment and germination [76,80]. The above evidence indicated that ultrasound treatment and germination might increase the contact areas between the quinoa flours and liquid and cholesterol, forming macromolecules in the gastrointestinal tract to prevent them from being absorbed by the human body [81].
According to Figure 7F, germination increased the CBC by 36.93% (p < 0.05), while ultrasound treatment had no significant effect on it (p > 0.05). Cholesterol is a principal factor underlying cardiovascular disease. Polysaccharides and DF, with a honeycomb network structure, could also enhance the cholesterol adsorption capacity. Cholic, deoxycholic, glycocholic, and taurocholic acids are the major bile acids in the human body, and over 90% exist in a bound state (especially sodium salts). Bile acids are adsorbed in the intestine and excreted to the outside of the body, which can promote the conversion of cholesterol into free bile acid in the liver. In this manner, the cholesterol and lipid levels in the body could be reduced [42]. As shown in Figure 7G, the comparison between the 0 W–24 h treatment and the 0 W–0 h quinoa showed that germination increased the binding capacity of sodium cholate, sodium deoxycholate, and sodium taurocholate by 349.0%, 821.4%, and 391.4%, respectively (p < 0.01). The comparison between the 100 W–24 h and 0 W–24 h treatments showed that ultrasound treatment reduced the binding capacity of sodium cholate, sodium deoxycholate, and sodium taurocholate by 74.99%, 85.52%, and 64.85%, respectively (p < 0.01), and these values were still higher than those of the 0 W–0 h quinoa. The binding capacities of sodium glycocholate of the 0 W–0 h quinoa and the 0 W–24 h, and 100 W–24 h treatments were 44.27 ± 0.85%, 31.83 ± 1.16%, and 32.29 ± 0.42%. Ultrasound treatment and germination have different effects on the binding capacities of different bile acids, which may be related to the characteristics of each bile acid. This trend is similar to previous research results [43]. The adsorption of bile acids, hydrophobic substances, depends on hydrophobic and electrostatic interactions. However, ultrasound treatment exposed a large number of hydrophilic groups in protein and dietary fiber [80,82], resulting in a significant decline in the BBC.
Figure 7H shows that germination and ultrasound treatment increased the PAIR by 55.23% and 84.64% (p < 0.01), respectively. Germination significantly increased the TPC and TSC values in quinoa, which have been reported to inhibit pancreatic lipase [83]. Ultrasound treatment made the structure of DF more loose, increased the binding with pancreatic lipase, reduced the contact between pancreatic lipase and substrate, and thus increased the PAIR [84]. In summary, germination can theoretically improve hypolipidemic activity, while ultrasound treatment affects hypolipidemic activity, based on a variety of factors that can be verified in vivo.

4. Conclusions

In this study, we investigated the changes in GABA content and the nutritional and functional attributes of quinoa under pre-germination ultrasound stress. Ultrasonic conditions substantially promoted GABA content, compared with that recorded in untreated quinoa, and enhanced the enrichment of some secondary metabolites, such as TPC, without reducing basic nutritional qualities. Meanwhile, ultrasonic stress and germination increased crimples and fissures on the surface of quinoa starch particles, and it also promoted the hydrolysis of starch and the biosynthesis of reducing sugar. Ultrasound stress optimized the composition of fatty acids, including n3 PUFAs (% of TFAs) and the n6/n3 PUFA ratio. Furthermore, the antioxidant, hypolipidemic, and hypoglycemic capacities of quinoa in vitro could be improved through ultrasonic-stimulated pre-germination. Our results provide data for further research on the effects of ultrasonic stress on grains and theoretical support for the intensive processing and development of functional whole-grain foods based on quinoa. Further mechanistic studies and long-term animal studies are warranted to determine the principles of ultrasonic stress and the functional properties of ultrasound-stressed germinated quinoa.

Author Contributions

M.W.: writing—original draft preparation, conceptualization, methodology, data curation, formal analysis, and validation. Q.Z.: methodology and writing—review and editing. L.Z.: investigation and writing—review and editing. T.R.: software and visualization. Y.Z.: software and data curation. W.L.: funding acquisition and investigation. W.Z.: conceptualization, project administration, validation, and writing—review and editing. J.W.: resources and supervision. All authors have read and agreed to the published version of the manuscript.

Funding

This work was funded by the Key R&D Program of Hebei Province: Development and application of key technologies of Quinoa industrialization in Bashang (the funder: Hebei Provincial Department of Science and Technology; the funding number: No.19227527D) and the Hebei Province Modern Agricultural Industry System Innovation Team Project (the funder: Hebei Provincial Department of Agriculture; the funding number: HBCT2023170206).

Institutional Review Board Statement

Not applicable.

Informed Consent Statement

Not applicable.

Data Availability Statement

Data is contained within the article.

Conflicts of Interest

The authors declare no conflict of interest.

References

  1. Navruz-Varli, S.; Sanlier, N. Nutritional and health benefits of quinoa (Chenopodium quinoa Willd.). J. Cereal Sci. 2016, 69, 371–376. [Google Scholar] [CrossRef]
  2. Shahbandeh, M. Global Quinoa Market Value 2022–2026. Available online: https://www.statista.com/statistics/1128506/global-quinoa-market-value-by-country/ (accessed on 10 January 2023).
  3. Hussain, M.I.; Farooq, M.; Syed, Q.A.; Ishaq, A.; Al-Ghamdi, A.A.; Hatamleh, A.A. Botany, Nutritional Value, Phytochemical Composition and Biological Activities of Quinoa. Plants 2021, 10, 2258. [Google Scholar] [CrossRef] [PubMed]
  4. Harborne, J.B.; Williams, C.A. Advances in flavonoid research since 1992. Phytochemistry 2000, 55, 481–504. [Google Scholar] [CrossRef] [PubMed]
  5. Han, Y.; Chi, J.; Zhang, M.; Zhang, R.; Fan, S.; Dong, L.; Huang, F.; Liu, L. Changes in saponins, phenolics and antioxidant activity of quinoa (Chenopodium quinoa willd) during milling process. LWT Food Sci. Technol. 2019, 114, 108381. [Google Scholar] [CrossRef]
  6. Vasques Farinazzi-Machado, F.M.; Barbalho, S.M.; Oshiiwa, M.; Goulart, R.; Pessan Junior, O. Use of cereal bars with quinoa (Chenopodium quinoa W) to reduce risk factors related to cardiovascular diseases. Cienc. E Tecnol. De Aliment. 2012, 32, 239–244. [Google Scholar] [CrossRef]
  7. Navarro-Perez, D.; Radcliffe, J.; Tierney, A.; Jois, M. Quinoa Seed Lowers Serum Triglycerides in Overweight and Obese Subjects: A Dose-Response Randomized Controlled Clinical Trial. Curr. Dev. Nutr. 2017, 1, e001321. [Google Scholar] [CrossRef] [PubMed]
  8. Majzoobi, M.; Wang, Z.; Teimouri, S.; Pematilleke, N.; Brennan, C.S.; Farahnaky, A. Unlocking the Potential of Sprouted Cereals, Pseudocereals, and Pulses in Combating Malnutrition. Foods 2023, 12, 3901. [Google Scholar] [CrossRef]
  9. Singh, A.K.; Rehal, J.; Kaur, A.; Jyot, G. Enhancement of Attributes of Cereals by Germination and Fermentation: A Review. Crit. Rev. Food Sci. Nutr. 2015, 55, 1575–1589. [Google Scholar] [CrossRef]
  10. Ikram, A.; Saeed, F.; Afzaal, M.; Imran, A.; Niaz, B.; Tufail, T.; Hussain, M.; Anjum, F.M. Nutritional and end-use perspectives of sprouted grains: A comprehensive review. Food Sci. Nutr. 2021, 9, 4617–4628. [Google Scholar] [CrossRef]
  11. Wang, T.; He, F.; Chen, G. Improving bioaccessibility and bioavailability of phenolic compounds in cereal grains through processing technologies: A concise review. J. Funct. Foods 2014, 7, 101–111. [Google Scholar] [CrossRef]
  12. Maria Paucar-Menacho, L.; Martinez-Villaluenga, C.; Duenas, M.; Frias, J.; Penas, E. Response surface optimisation of germination conditions to improve the accumulation of bioactive compounds and the antioxidant activity in quinoa. Int. J. Food Sci. Technol. 2018, 53, 516–524. [Google Scholar] [CrossRef]
  13. Lazo-Velez, M.A.; Guajardo-Flores, D.; Mata-Ramirez, D.; Gutierrez-Uribe, J.A.; Serna-Saldivar, S.O. Characterization and Quantitation of Triterpenoid Saponins in Raw and Sprouted Chenopodium berlandieri spp. (Huauzontle) Grains Subjected to Germination with or without Selenium Stress Conditions. J. Food Sci. 2016, 81, C19–C26. [Google Scholar] [CrossRef] [PubMed]
  14. Carlos Enciso-Roca, E.; Javier Aguilar-Felices, E.; Aldo Tinco-Jayo, J.; Luis Arroyo-Acevedo, J.; Herrera-Calderon, O. Biomolecules with Antioxidant Capacity from the Seeds and Sprouts of 20 Varieties of Chenopodium quinoa Willd. (Quinoa). Plants 2021, 10, 2417. [Google Scholar] [CrossRef]
  15. Hou, D.; Tang, J.; Feng, Q.; Niu, Z.; Shen, Q.; Wang, L.; Zhou, S. Gamma-aminobutyric acid (GABA): A comprehensive review of dietary sources, enrichment technologies, processing effects, health benefits, and its applications. Crit. Rev. Food Sci. Nutr. 2023, 1–23. [Google Scholar] [CrossRef]
  16. Yuan, D.; Wu, X.; Gong, B.; Huo, R.; Zhao, L.; Li, J.; Lue, G.; Gao, H. GABA Metabolism, Transport and Their Roles and Mechanisms in the Regulation of Abiotic Stress (Hypoxia, Salt, Drought) Resistance in Plants. Metabolites 2023, 13, 347. [Google Scholar] [CrossRef]
  17. Hasan, M.M.; Bashir, T.; Bae, H. Use of Ultrasonication Technology for the Increased Production of Plant Secondary Metabolites. Molecules 2017, 22, 1046. [Google Scholar] [CrossRef]
  18. Ding, J.; Ulanov, A.V.; Dong, M.; Yang, T.; Nemzer, B.V.; Xiong, S.; Zhao, S.; Feng, H. Enhancement of gama-aminobutyric acid (GABA) and other health-related metabolites in germinated red rice (Oryza sativa L.) by ultrasonication. Ultrason. Sonochem. 2018, 40, 791–797. [Google Scholar] [CrossRef]
  19. Ding, J.; Johnson, J.; Chu, Y.F.; Feng, H. Enhancement of gamma-aminobutyric acid, avenanthramides, and other health-promoting metabolites in germinating oats (Avena sativa L.) treated with and without power ultrasound. Food Chem. 2019, 283, 239–247. [Google Scholar] [CrossRef]
  20. Xia, Q.; Tao, H.; Li, Y.; Pan, D.; Cao, J.; Liu, L.; Zhou, X.; Barba, F.J. Characterizing physicochemical, nutritional and quality attributes of wholegrain Oryza sativa L. subjected to high intensity ultrasound-stimulated pre-germination. Food Control 2020, 108, 106827. [Google Scholar] [CrossRef]
  21. Ampofo, J.O.; Ngadi, M. Ultrasonic assisted phenolic elicitation and antioxidant potential of common bean (Phaseolus vulgaris) sprouts. Ultrason. Sonochem. 2020, 64, 104974. [Google Scholar] [CrossRef]
  22. Yang, H.; Gao, J.; Yang, A.; Chen, H. The ultrasound-treated soybean seeds improve edibility and nutritional quality of soybean sprouts. Food Res. Int. 2015, 77, 704–710. [Google Scholar] [CrossRef]
  23. Li, N.N.; Liu, Y.; Zhao, Y.; Zheng, X.Q.; Lu, J.L.; Liang, Y.R. Simultaneous HPLC Determination of Amino Acids in Tea Infusion Coupled to Pre-column Derivatization with 2,4-Dinitrofluorobenzene. Food Anal. Methods 2016, 9, 1307–1314. [Google Scholar] [CrossRef]
  24. Chinese National Standardization Administration (GB). GB/T 5009.5-2016: Determination of Protein in Food; Standards Press of China: Beijing, China, 2016. [Google Scholar]
  25. Chinese National Standardization Administration (GB). GB/T 5009.6-2016: Determination of Fat in Food; Standards Press of China: Beijing, China, 2016. [Google Scholar]
  26. Chinese National Standardization Administration (GB). GB/T 5009.88-2014: Determination of Dietary Fiber in Food; Standards Press of China: Beijing, China, 2014. [Google Scholar]
  27. Chinese National Standardization Administration (GB). GB/T 5009.4-2016: Determination of Ash Content in Food; Standards Press of China: Beijing, China, 2016. [Google Scholar]
  28. Lim, S.T.; Lee, J.H.; Shin, D.H.; Lim, H.S. Comparison of protein extraction solutions for rice starch isolation and effects of residual protein content on starch pasting properties. Starch-Starke 1999, 51, 120–125. [Google Scholar] [CrossRef]
  29. Pinuel, L.; Boeri, P.; Zubillaga, F.; Alejandro Barrio, D.; Torreta, J.; Cruz, A.; Vasquez, G.; Pinto, A.; Carrillo, W. Production of White, Red and Black Quinoa (Chenopodium quinoa Willd Var. Real) Protein Isolates and Its Hydrolysates in Germinated and Non-Germinated Quinoa Samples and Antioxidant Activity Evaluation. Plants 2019, 8, 257. [Google Scholar] [CrossRef] [PubMed]
  30. Sharma, N.; Sharma, R.; Rajput, Y.S.; Mann, B.; Gandhi, K. Distinction between glycomacropeptide and beta-lactoglobulin with ‘stains all’ dye on tricine SDS-PAGE gels. Food Chem. 2021, 340, 127923. [Google Scholar] [CrossRef]
  31. Pham Van, H.; Nguyen Thi Hoang, Y.; Nguyen Thi Lan, P.; Nguyen Phung Ha, T.; Nguyen Thi Thu, T. Nutritional composition, enzyme activities and bioactive compounds of mung bean (Vigna radiata L.) germinated under dark and light conditions. LWT Food Sci. Technol. 2020, 133, 110100. [Google Scholar] [CrossRef]
  32. Miao, J.; Lin, H.; Zhang, S.; Huo, J.; Deng, S. Effect on amino acid and mineral content of the loach (Misgurnus anguillicaudatus) by adding Fe (II) chelating hairtail protein hydrolysates (Fe (II)-HPH) to the feed. Food Sci. Nutr. 2020, 8, 1575–1582. [Google Scholar] [CrossRef]
  33. Chinese National Standardization Administration (GB). GB/T 5009.168-2016: Determination of Fatty Acids in Food; Standards Press of China: Beijing, China, 2016. [Google Scholar]
  34. Hassan Mekky, R.; Thabet, M.M.; Rodriguez-Perez, C.; Elnaggar, D.M.Y.; Mahrous, E.A.; Segura-Carretero, A.; Abdel-Sattar, E. Comparative metabolite profiling and antioxidant potentials of seeds and sprouts of three Egyptian cultivars of Vicia faba L. Food Res. Int. 2020, 136, 109537. [Google Scholar] [CrossRef]
  35. Farag, M.A.; El-Din, M.G.S.; Selim, M.A.-F.; Owis, A.I.; Abouzid, S.F. Mass spectrometry-based metabolites profiling of nutrients and anti-nutrients in major legume sprouts. Food Biosci. 2021, 39, 100800. [Google Scholar] [CrossRef]
  36. Zhang, H.; Birch, J.; Xie, C.; Yang, H.; Dias, G.; Kong, L.; Bekhit, A.E.-D. Optimization of extraction parameters of antioxidant activity of extracts from New Zealand and Chinese Asparagus officinalis L. root cultivars. Ind. Crops Prod. 2018, 119, 191–200. [Google Scholar] [CrossRef]
  37. Ajitha, M.J.; Mohanlal, S.; Suresh, C.H.; Jayalekshmy, A. DPPH Radical Scavenging Activity of Tricin and Its Conjugates Isolated from “Njavara” Rice Bran: A Density Functional Theory Study. J. Agric. Food Chem. 2012, 60, 3693–3699. [Google Scholar] [CrossRef] [PubMed]
  38. Swieca, M.; Seczyk, L.; Gawlik-Dziki, U.; Dziki, D. Bread enriched with quinoa leaves—The influence of protein-phenolics interactions on the nutritional and antioxidant quality. Food Chem. 2014, 162, 54–62. [Google Scholar] [CrossRef]
  39. Tang, C.D.; Wu, L.R.; Zhang, F.S.; Kan, J.Q.; Zheng, J. Comparison of different extraction methods on the physicochemical, structural properties, and in vitro hypoglycemic activity of bamboo shoot dietary fibers. Food Chem. 2022, 386, 132642. [Google Scholar] [CrossRef] [PubMed]
  40. Ni, Z.; Li, J.; Wang, Y.; Wendi, L.V.; Zhang, S.; Peng, G.; Lu, Y.; Sun, H.; Dong, Y. Physicochemical properties, antioxidant activities and hypoglycemic effects of soluble dietary fibers purified from Lentinula edodes. Food Sci. Technol. 2023, 43, e131122. [Google Scholar] [CrossRef]
  41. Zhang, W.; Zeng, G.; Pan, Y.; Chen, W.; Huang, W.; Chen, H.; Li, Y. Properties of soluble dietary fiber-polysaccharide from papaya peel obtained through alkaline or ultrasound-assisted alkaline extraction. Carbohydr. Polym. 2017, 172, 102–112. [Google Scholar] [CrossRef] [PubMed]
  42. Zhu, Y.; Chu, J.X.; Lu, Z.X.; Lv, F.X.; Bie, X.M.; Zhang, C.; Zhao, H.Z. Physicochemical and functional properties of dietary fiber from foxtail millet (Setaria italic) bran. J. Cereal Sci. 2018, 79, 456–461. [Google Scholar] [CrossRef]
  43. Sun, Y.J.; Yang, K.; Zhang, X.; Li, L.F.; Zhang, H.X.; Zhou, L.; Liang, J.; Li, X. In vitro binding capacities, physicochemical properties and structural characteristics of polysaccharides fractionated from Passiflora edulis peel. Food Biosci. 2022, 50, 102016. [Google Scholar] [CrossRef]
  44. Zhang, T.; Wu, S.; Ai, C.; Wen, C.; Liu, Z.; Wang, L.; Jiang, L.; Shen, P.; Zhang, G.; Song, S. Galactofucan from Laminaria japonica is not degraded by the human digestive system but inhibits pancreatic lipase and modifies the intestinal microbiota. Int. J. Biol. Macromol. 2021, 166, 611–620. [Google Scholar] [CrossRef]
  45. Zhang, L.; Hao, N.; Li, W.; Zhang, B.; Shi, T.; Xie, M.; Yu, M. Effect of Ultrasonic Induction on the Main Physiological and Biochemical Indicators and γ–Aminobutyric Acid Content of Maize during Germination. Foods 2022, 11, 1358. [Google Scholar] [CrossRef]
  46. Liu, J.; Wang, Q.; Karagic, D.; Liu, X.; Cui, J.; Gui, J.; Gu, M.; Gao, W. Effects of ultrasonication on increased germination and improved seedling growth of aged grass seeds of tall fescue and Russian wildrye. Sci. Rep. 2016, 6, 22403. [Google Scholar] [CrossRef]
  47. Lopez-Ribera, I.; Vicient, C.M. Use of ultrasonication to increase germination rates of Arabidopsis seeds. Plant Methods 2017, 13, 31. [Google Scholar] [CrossRef] [PubMed]
  48. Liu, X.; Ma, H.; Liu, J.; Liu, D.; Wang, C. The γ-Aminobutyric Acid (GABA) Synthesis Gene Regulates the Resistance to Water Core-Induced Hypoxia Stress for Pear Fruits. Agronomy 2023, 13, 1062. [Google Scholar] [CrossRef]
  49. Rastogi, N.K. Opportunities and Challenges in Application of Ultrasound in Food Processing. Crit. Rev. Food Sci. Nutr. 2011, 51, 705–722. [Google Scholar] [CrossRef] [PubMed]
  50. Shewale, S.D.; Pandit, A.B. Enzymatic production of glucose from different qualities of grain sorghum and application of ultrasound to enhance the yield. Carbohydr. Res. 2009, 344, 52–60. [Google Scholar] [CrossRef] [PubMed]
  51. Yu, Z.-L.; Zeng, W.-C.; Zhang, W.-H.; Liao, X.-P.; Shi, B. Effect of ultrasound on the activity and conformation of a-amylase, papain and pepsin. Ultrason. Sonochem. 2014, 21, 930–936. [Google Scholar] [CrossRef]
  52. Świeca, M.; Dziki, D. Improvement in sprouted wheat flour functionality: Effect of time, temperature and elicitation. Int. J. Food Sci. Technol. 2015, 50, 2135–2142. [Google Scholar] [CrossRef]
  53. Jiang, F.; Du, C.; Guo, Y.; Fu, J.; Jiang, W.; Du, S. Physicochemical and structural properties of starches isolated from quinoa varieties. Food Hydrocoll. 2020, 101, 105515. [Google Scholar] [CrossRef]
  54. Xing, B.; Teng, C.; Sun, M.; Zhang, Q.; Zhou, B.; Cui, H.; Ren, G.; Yang, X.; Qin, P. Effect of germination treatment on the structural and physicochemical properties of quinoa starch. Food Hydrocoll. 2021, 115, 106604. [Google Scholar] [CrossRef]
  55. Aparicio-Garcia, N.; Martinez-Villaluenga, C.; Frias, J.; Penas, E. Sprouted oat as a potential gluten-free ingredient with enhanced nutritional and bioactive properties. Food Chem. 2021, 338, 127972. [Google Scholar] [CrossRef]
  56. Rani, M.; Singh, G.; Siddiqi, R.A.; Gill, B.S.; Sogi, D.S.; Bhat, M.A. Comparative Quality Evaluation of Physicochemical, Technological, and Protein Profiling of Wheat, Rye, and Barley Cereals. Front. Nutr. 2021, 8, 694679. [Google Scholar] [CrossRef]
  57. Szabados, L.; Savoure, A. Proline: A multifunctional amino acid. Trends Plant Sci. 2010, 15, 89–97. [Google Scholar] [CrossRef] [PubMed]
  58. Alcazar, R.; Marco, F.; Cuevas, J.C.; Patron, M.; Ferrando, A.; Carrasco, P.; Tiburcio, A.F.; Altabella, T. Involvement of polyamines in plant response to abiotic stress. Biotechnol. Lett. 2006, 28, 1867–1876. [Google Scholar] [CrossRef] [PubMed]
  59. Ali, A.A.; Subash-Babu, P. Effects of increasing ratios of dietary omega-6/omega-3 fatty acids on human monocyte immunomodulation linked with atherosclerosis. J. Funct. Foods 2018, 41, 258–267. [Google Scholar] [CrossRef]
  60. Matias, J.; Rodriguez, M.J.; Granado-Rodriguez, S.; Cruz, V.; Calvo, P.; Reguera, M. Changes in Quinoa Seed Fatty Acid Profile Under Heat Stress Field Conditions. Front. Nutr. 2022, 9, 456. [Google Scholar] [CrossRef] [PubMed]
  61. Simopoulos, A.P. The importance of the omega-6/omega-3 fatty acid ratio in cardiovascular disease and other chronic diseases. Exp. Biol. Med. 2008, 233, 674–688. [Google Scholar] [CrossRef] [PubMed]
  62. Sandoval-Sicairos, E.S.; Dominguez-Rodriguez, M.; Montoya-Rodriguez, A.; Milan-Noris, A.K.; Reyes-Moreno, C.; Milan-Carrillo, J. Phytochemical Compounds and Antioxidant Activity Modified by Germination and Hydrolysis in Mexican Amaranth. Plant Foods Hum. Nutr. 2020, 75, 192–199. [Google Scholar] [CrossRef]
  63. Chen, Y.; Chang, S.K.C. Macronutrients, Phytochemicals, and Antioxidant Activity of Soybean Sprout Germinated with or without Light Exposure. J. Food Sci. 2015, 80, S1391–S1398. [Google Scholar] [CrossRef]
  64. Suarez-Estrella, D.; Borgonovo, G.; Buratti, S.; Ferranti, P.; Accardo, F.; Pagani, M.A.; Marti, A. Sprouting of quinoa (Chenopodium quinoa Willd.): Effect on saponin content and relation to the taste and astringency assessed by electronic tongue. LWT Food Sci. Technol. 2021, 144, 7. [Google Scholar] [CrossRef]
  65. Abdel-Farid, I.B.; Marghany, M.R.; Rowezek, M.M.; Sheded, M.G. Effect of Salinity Stress on Growth and MetabolomicProfiling of Cucumis sativus and Solanum lycopersicum. Plants 2020, 9, 1626. [Google Scholar] [CrossRef]
  66. Ehsen, S.; Abideen, Z.; Rizvi, R.F.; Gulzar, S.; Aziz, I.; Gul, B.; Khan, M.A.; Ansari, R. Ecophysiological adaptations and anti-nutritive status of sustainable cattle feed Haloxylon stocksii under saline conditions. Flora 2019, 257, 151425. [Google Scholar] [CrossRef]
  67. Zhou, Z.; Fan, Z.; Meenu, M.; Xu, B. Impact of Germination Time on Resveratrol, Phenolic Acids, and Antioxidant Capacities of Different Varieties of Peanut (Arachis hypogaea L.) from China. Antioxidants 2021, 10, 1714. [Google Scholar] [CrossRef] [PubMed]
  68. Shi, Y.H.; Wang, J.; Guo, R.; Wang, C.Z.; Yan, X.B.; Xu, B.; Zhang, D.Q. Effects of alfalfa saponin extract on growth performance and some antioxidant indices of weaned piglets. Livest. Sci. 2014, 167, 257–262. [Google Scholar] [CrossRef]
  69. Ma, B.; Meng, X.; Wang, J.; Sun, J.; Ren, X.; Qin, M.; Sun, J.; Sun, G.; Sun, X. Notoginsenoside R1 attenuates amyloid-beta-induced damage in neurons by inhibiting reactive oxygen species and modulating MAPK activation. Int. Immunopharmacol. 2014, 22, 151–159. [Google Scholar] [CrossRef]
  70. Zilic, S.; Basic, Z.; Sukalovic, V.H.-T.; Maksimovic, V.; Jankovic, M.; Filipovic, M. Can the sprouting process applied to wheat improve the contents of vitamins and phenolic compounds and antioxidant capacity of the flour? Int. J. Food Sci. Technol. 2014, 49, 1040–1047. [Google Scholar] [CrossRef]
  71. Ha, K.S.; Jo, S.H.; Mannam, V.; Kwon, Y.I.; Apostolidis, E. Stimulation of Phenolics, Antioxidant and alpha-Glucosidase Inhibitory Activities During Barley (Hordeum vulgare L.) Seed Germination. Plant Foods Hum. Nutr. 2016, 71, 211–217. [Google Scholar] [CrossRef] [PubMed]
  72. Cornejo, F.; Caceres, P.J.; Martinez-Villaluenga, C.; Rosell, C.M.; Frias, J. Effects of germination on the nutritive value and bioactive compounds of brown rice breads. Food Chem. 2015, 173, 298–304. [Google Scholar] [CrossRef] [PubMed]
  73. Xu, J.G.; Tian, C.R.; Hu, Q.P.; Luo, J.Y.; Wang, X.D.; Tian, X.D. Dynamic Changes in Phenolic Compounds and Antioxidant Activity in Oats (Avena nuda L.) during Steeping and Germination. J. Agric. Food Chem. 2009, 57, 10392–10398. [Google Scholar] [CrossRef] [PubMed]
  74. Zheng, Y.J.; Xu, B.F.; Shi, P.Q.; Tian, H.L.; Li, Y.; Wang, X.Y.; Wu, S.; Liang, P.F. The influences of acetylation, hydroxypropylation, enzymatic hydrolysis and crosslinking on improved adsorption capacities and in vitro hypoglycemic properties of millet bran dietary fibre. Food Chem. 2022, 368, 130883. [Google Scholar] [CrossRef]
  75. Ma, M.M.; Mu, T.H. Effects of extraction methods and particle size distribution on the structural, physicochemical, and functional properties of dietary fiber from deoiled cumin. Food Chem. 2016, 194, 237–246. [Google Scholar] [CrossRef]
  76. Gu, M.D.; Fang, H.C.; Gao, Y.H.; Su, T.; Niu, Y.G.; Yu, L.L. Characterization of enzymatic modified soluble dietary fiber from tomato peels with high release of lycopene. Food Hydrocoll. 2020, 99, 105321. [Google Scholar] [CrossRef]
  77. Gong, L.; Feng, D.; Wang, T.; Ren, Y.; Liu, Y.; Wang, J. Inhibitors of α-amylase and α-glucosidase: Potential linkage for whole cereal foods on prevention of hyperglycemia. Food Sci. Nutr. 2020, 8, 6320–6337. [Google Scholar] [CrossRef] [PubMed]
  78. Benitez, V.; Rebollo-Hernanz, M.; Hernanz, S.; Chantres, S.; Aguilera, Y.; Martin-Cabrejas, M.A. Coffee parchment as a new dietary fiber ingredient: Functional and physiological characterization. Food Res. Int. 2019, 122, 105–113. [Google Scholar] [CrossRef] [PubMed]
  79. Aalim, H.; Luo, Z.S. Insight into rice (Oryza sativa L.) cooking: Phenolic composition, inhibition of alpha-amylase and alpha-glucosidase, and starch physicochemical and functional properties. Food Biosci. 2021, 40, 100917. [Google Scholar] [CrossRef]
  80. Dong, Y.F.; Li, Q.; Zhao, Y.H.; Cao, J.X. Effects of ultrasonic assisted high-temperature cooking method on the physicochemical structure characteristics and in vitro antioxidant capacities of dietary fiber from Dendrocalamus brandisii Munro shoots. Ultrason. Sonochem. 2023, 97, 106462. [Google Scholar] [CrossRef] [PubMed]
  81. Qin, Y.Y.; Xie, J.; Xue, B.; Li, X.H.; Gan, J.H.; Zhu, T.; Sun, T. Effect of acid and oxidative degradation on the structural, rheological, and physiological properties of oat beta-glucan. Food Hydrocoll. 2021, 112, 106284. [Google Scholar] [CrossRef]
  82. Luo, L.; Yang, Z.; Wang, H.; Ashokkumar, M.; Hemar, Y. Impacts of sonication and high hydrostatic pressure on the structural and physicochemical properties of quinoa protein isolate dispersions at acidic, neutral and alkaline pHs. Ultrason. Sonochem. 2022, 91, 106232. [Google Scholar] [CrossRef]
  83. Herrera, T.; del Hierro, J.N.; Fornari, T.; Reglero, G.; Martin, D. Inhibitory effect of quinoa and fenugreek extracts on pancreatic lipase and alpha-amylase under in vitro traditional conditions or intestinal simulated conditions. Food Chem. 2019, 270, 509–517. [Google Scholar] [CrossRef]
  84. Ding, Q.Z.; Li, Z.K.; Wu, W.; Su, Y.Y.; Sun, N.Z.; Luo, L.; Ma, H.L.; He, R.H. Physicochemical and functional properties of dietary fiber from Nannochloropsis oceanica: A comparison of alkaline and ultrasonic-assisted alkaline extractions. LWT Food Sci. Technol. 2020, 133, 110080. [Google Scholar] [CrossRef]
Figure 1. Schematic diagram of ultrasound stress process.
Foods 13 00057 g001
Figure 2. Effects of ultrasonic treatment on the γ-aminobutyric acid (GABA) contents of quinoa sprouts 1 ((A) effects of ultrasonic power on the GABA contents of quinoa sprouts 2; (B) effects of ultrasonic time on the GABA contents of quinoa sprouts 3; and (C) the GABA contents at 0 W–0 h, 0 W–24 h, and 100 W–24 h 4). 1 Different lowercase and capital letters indicate significant and extremely significant differences, at p < 0.05 and p < 0.01, respectively. 2 Quinoa was treated with ultrasound for 4 min. 3 Quinoa was treated with ultrasound at 100 W. 4 0 W–0 h, quinoa plants without ultrasonic stimulation and germination; 0 W–24 h, quinoa plants with 24 h germination; 100 W–24 h, ultrasound-treated (100 W, 4 min) quinoa plants with 24 h germination.
Foods 13 00057 g002
Figure 3. Effects of ultrasonic treatment on the moisture absorption, turbidity of soaking water, and glutamate decarboxylase (GAD) activity of quinoa sprouts 1 ((A) effects of ultrasonic power on the moisture absorption and turbidity of soaking water of quinoa 2; (B) effects of ultrasonic time on the moisture absorption and turbidity of soaking water of quinoa 3; and (C) effects of ultrasonic treatment at 100 W for 4 min on the GAD activity of quinoa sprouts 4). 1 Different lowercase and capital letters indicate significant and extremely significant differences, at p < 0.05 and p < 0.01, respectively. 2 Quinoa was treated with ultrasound for 4 min. 3 Quinoa was treated with ultrasound at 100 W. 4 Quinoa was treated with ultrasound for 4 min at 100 W.
Foods 13 00057 g003
Figure 4. Effects of ultrasonic treatment on the basic nutritional components (A) and phytochemical composition (B) in sprouts 1.1 For the 0 W–0 h quinoa and the 0 W–24 h, and 100 W–24 h treatments, different lowercase and capital letters were used to indicate significant and extremely significant differences, at p < 0.05 and p < 0.01, respectively.
Foods 13 00057 g004
Figure 5. Effects of ultrasonic treatment on the microstructures 1 ((A) 0 W–0 h; (B) 0 W–24 h; and (C) 100 W–24 h) and particle size distributions (D) of starch samples extracted from quinoa samples under different treatments during germination. The image magnification was approximately 40 k× for whole granules. 1 The red and blue arrows were used to point to crimples and fissures, respectively.
Foods 13 00057 g005
Figure 6. Effects of ultrasonic treatment and germination on the protein profiles of quinoa. (M, standard protein marker; lane 1, 0 W–0 h; lane 2, 0 W–24 h; lane 3, 100 W–24 h).
Foods 13 00057 g006
Figure 7. Effects of ultrasonic treatment on the functional characteristics of quinoa during germination 1 ((A) antioxidant property; (B) glucose adsorption capacity; (C) glucose dialysis retardation index; (D) α-amylase and α-glucosidase activity inhibition ration; (E) lipid-binding capacity; (F) cholesterol-binding capacity; (G) bile salt-binding capacity; (H) inhibition of pancreatic lipase activity). 1 Among the 0 W–0 h quinoa and the 0 W–24 h, and 100 W–24 h treatments, different lowercase and capital letters indicate significant and extremely significant differences, at p < 0.05 and p < 0.01, respectively.
Foods 13 00057 g007
Table 1. Effects of ultrasonic treatment on the amino acid contents of quinoa during germination 1.
Amino Acid (g/100g Protein)0 W–0 h0 W–24 h100 W–24 h
Threonine2.93 ± 0.02 Aa2.92 ± 0.01 Aa2.91 ± 0.04 Aa
Valine5.22 ± 0.02 Aa6.29 ± 0.04 Bb5.54 ± 0.02 Cc
Methionine6.38 ± 0.01 Aa7.50 ± 0.03 Bb7.42 ± 0.03 Cc
Isoleucine7.64 ± 0.02 Aa7.18 ± 0.04 Bb6.81 ± 0.02 Cc
Leucine9.36 ± 0.04 Aa8.80 ± 0.02 Bb8.75 ± 0.05 Bb
Phenylalanine2.81 ± 0.02 Aa2.84 ± 0.01 Aa2.97 ± 0.02 Bb
Lysine4.19 ± 0.01 Aa4.43 ± 0.02 Bb4.34 ± 0.03 Cc
Histidine2.36 ± 0.01 Aa2.32 ± 0.01 Bb2.36 ± 0.02 Aa
Arginine5.23 ± 0.01 Aa5.43 ± 0.02 Bb5.36 ± 0.03 Bc
Aspartate6.11 ± 0.01 Aa6.48 ± 0.03 Bb6.69 ± 0.03 Cc
Serine2.91 ± 0.01 Aa3.15 ± 0.04 Bb3.10 ± 0.03 Bb
Glutamate8.06 ± 0.06 Aa8.31 ± 0.03 Bb8.24 ± 0.04 Bb
Glycine3.36 ± 0.01 Aa3.38 ± 0.01 Aa3.47 ± 0.02 Bb
Alanine2.61 ± 0.01 Aa3.03 ± 0.02 Bb3.38 ± 0.03 Cc
Cysteine0.88 ± 0.01 Aa0.87 ± 0.01 Aa0.87 ± 0.02 Aa
Tyrosine3.07 ± 0.02 Aa3.12 ± 0.02 Ab2.94 ± 0.01 Bc
Proline4.77 ± 0.01 Aa5.72 ± 0.09 Bb6.26 ± 0.07 Cc
Total amino acids77.89 ± 0.06 Aa81.78 ± 0.17 Bb81.40 ± 0.04 Cc
Total hydrophobic amino acids38.80 ± 0.04 Aa41.37 ± 0.13 Bb41.13 ± 0.05 Cc
Total hydrophilic amino acids39.10 ± 0.04 Aa40.41 ± 0.04 Bb40.27 ± 0.07 Bc
Total acid amino acids14.16 ± 0.05 Aa14.79 ± 0.02 Bb14.92 ± 0.01 Cc
Total basic amino acids34.32 ± 2.87 Aa35.56 ± 3.11 Aa35.19 ± 2.98 Aa
Total aromatic amino acids5.88 ± 0.04 Aa5.96 ± 0.02 Bb5.91 ± 0.01 ABac
Total essential amino acids38.53 ± 0.06 Aa39.97 ± 0.11 Bb38.74 ± 0.03 Cc
Total half essential amino acids7.59 ± 0.01 Aa7.75 ± 0.03 Bb7.72 ± 0.05 Bb
1 In the same row, different lowercase and capital letters indicate significant and extremely significant differences, at p < 0.05 and p < 0.01, respectively. The data reported in this chart are expressed as the mean ± S.D (n = 3).
Table 2. Effects of ultrasonic treatment on the nutritional values of quinoa during germination 1.
Evaluation CriterionAmino Acid0 W–0 h0 W–24 h100 W–24 h
AASIsoleucine2.732.562.43
Leucine1.421.331.32
Lysine0.720.760.75
Methionine + Cysteine2.903.353.31
Phenylalanine + Tyrosine0.930.950.93
Valine1.541.851.63
Threonine0.840.830.83
CSIsoleucine1.411.331.26
Leucine1.091.021.02
Lysine0.600.630.62
Methionine + Cysteine1.271.471.45
Phenylalanine + Tyrosine0.630.640.64
Valine0.790.950.84
Threonine0.620.620.62
EAAI 86.6490.0587.16
1 AAS: amino acid score; CS: chemical score; EAAI: essential amino acid index.
Table 3. Effects of ultrasonic treatment on the fatty acid composition of quinoa during germination 1,2.
Fatty AcidAbbreviation0 W–0 h0 W–24 h100 W–24 h
SFAs (g/100 g)
MyristateC14:00.0109 ± 0.0001 Aa0.0121 ± 0.0001 Bb0.0126 ± 0.0000 Cc
PentadecanoateC15:00.0037 ± 0.0000 Aa0.0044 ± 0.0000 Bb0.0044 ± 0.0000 Bb
PalmitateC16:00.5545 ± 0.0035 Aa0.5959 ± 0.0013 Bb0.6032 ± 0.0010 Cc
StearateC18:00.0276 ± 0.0011 Aa0.0336 ± 0.0002 Bb0.0327 ± 0.0003 Bb
ArachidateC20:00.0263 ± 0.0003 Aa0.0279 ± 0.0003 Bb0.0285 ± 0.0000 Bc
BehenateC22:00.0358 ± 0.0001 Aa0.0412 ± 0.0003 Bb0.0427 ± 0.0002 Cc
TricosanoateC23:00.1294 ± 0.0007 Aa0.1078 ± 0.0015 Bb0.0959 ± 0.0001 Cc
LignocerateC24:00.0205 ± 0.0004 Aa0.0258 ± 0.0004 Bb0.0277 ± 0.0007 Cc
MUFAs (g/100 g)
OleateC18:1N9C1.2299 ± 0.0073 Aa1.2057 ± 0.0092 Bb1.2309 ± 0.0024 Aa
11-eicosenoateC20:10.0772 ± 0.0007 Aa0.0789 ± 0.0010 ABb0.0799 ± 0.0007 Bb
NervonoateC24:10.0100 ± 0.0001 Aa0.0108 ± 0.0001 Bb0.0109 ± 0.0002 Bb
PUFAs (g/100 g)
LinoleateC18:2N63.0319 ± 0.0200 Aa3.2308 ± 0.0287 Bb3.2291 ± 0.0056 Bb
Alpha linolenateC18:3N30.5012 ± 0.0033 Aa0.5610 ± 0.0065 Bb0.5605 ± 0.0019 Bb
ArachidonateC20:4N60.0722 ± 0.0005 Aa0.0732 ± 0.0007 Ab0.0750 ± 0.0001 Bc
TFAs (g/100 g)5.7311 ± 0.0378 Aa6.0094 ± 0.0498 Bb6.0341 ± 0.0107 Bb
SFAs (% of TFAs)14.11 ± 0.02 Aab14.13 ± 0.05 Aa14.05 ± 0.01 Ab
MUFAs (% of TFAs)22.98 ± 0.01 Aa21.56 ± 0.01 Bb21.90 ± 0.01 Cc
PUFAs (% of TFAs)62.90 ± 0.01 Aa64.32 ± 0.06 Bb64.05 ± 0.02 Cc
UFAs (% of TFAs)85.89 ± 0.02 Aab85.88 ± 0.06 Aa85.95 ± 0.02 Ab
n3 PUFAs (% of TFAs)8.74 ± 0.00 Aa9.34 ± 0.03 Bb10.00 ± 0.00 Cc
n6 PUFAs (% of TFAs)54.16 ± 0.01 Aa54.98 ± 0.03 Bb54.76 ± 0.01 Cc
n6/n3 PUFAs6.19 ± 0.00 Aa5.89 ± 0.01 Bb5.48 ± 0.00 Cc
1 In the same row, different lowercase and capital letters were used to indicate significant and extremely significant differences, at p < 0.05 and p < 0.01, respectively. The data reported in this chart are expressed as the mean ± S.D (n = 3). 2 SFA: saturated fatty acid; MUFA: monounsaturated fatty acid; PUFA: polyunsaturated fatty acid; TFA: total fatty acid.
Disclaimer/Publisher’s Note: The statements, opinions and data contained in all publications are solely those of the individual author(s) and contributor(s) and not of MDPI and/or the editor(s). MDPI and/or the editor(s) disclaim responsibility for any injury to people or property resulting from any ideas, methods, instructions or products referred to in the content.

