Article

Adaptation of a Commercial Qualitative BAX® Real-Time PCR Assay to Quantify Campylobacter spp. in Whole Bird Carcass Rinses

1
Meat Science and Animal Biologics Discovery Program, Department of Animal and Dairy Sciences, University of Wisconsin, Madison, WI 53706, USA
2
Department of Animal Science, University of Wyoming, Laramie, WY 82071, USA
3
Hygiena, 2 Boulden Circle, New Castle, DE 19720, USA
*
Author to whom correspondence should be addressed.
Foods 2024, 13(1), 56; https://doi.org/10.3390/foods13010056
Submission received: 31 October 2023 / Revised: 14 December 2023 / Accepted: 20 December 2023 / Published: 22 December 2023

Abstract

:
Poultry is the primary reservoir of Campylobacter, a leading cause of gastroenteritis in the United States. Currently, the selective plating methodology using selective agars, Campy Cefex and Modified Charcoal Cefoperazone Deoxycholate agar, is preferentially used for the quantification of Campylobacter spp. among poultry products. Due to the specific nature of Campylobacter, this methodology is not sensitive, which can lead to skewed detection and quantification results. Therefore, Campylobacter detection and quantification methods are urgently needed. The objective was to develop a shortened enrichment-based quantification method for Campylobacter (CampyQuant™) in post-chill poultry rinsates using the BAX® System Real-Time PCR assay for Campylobacter. The specificity and sensitivity for the detection of C. jejuni, C. coli, and C. lari in pure culture were determined. The BAX® System Real-Time PCR assay consistently detected and identified each species 100% of the time with an enumeration range of 4.00 to 9.00 Log10 CFU/mL. Enrichment time parameters for low-level concentrations (0.00, 1.00, and 2.00 Log10 CFU/mL) of Campylobacter using the BAX® System Real-Time PCR assay were elucidated. It was determined that an enrichment time of 20 h was needed to detect at least 1.00 Log10 CFU/mL of Campylobacter spp. Using the BAX® System Real-Time PCR assay for Campylobacter. As a result, time of detection, detection limits, and enrichment parameters were used to develop the CampyQuant™ linear standard curve using the detected samples from the BAX® System Real-Time PCR assay to quantify the levels in post-chill poultry rinsates. A linear fit equation was generated for each Campylobacter species using the cycle threshold from the BAX® System Real-Time PCR assay to estimate a pre-enrichment of 1.00 to 4.00 Log10 CFU/mL of rinsates detected. The statistical analyses of each equation yielded an R2 of 0.93, 0.76, and 0.94 with a Log10 RMSE of 0.64, 1.09, and 0.81 from C. jejuni, C. coli, and C. lari, respectively. The study suggests that the BAX® System Real-Time PCR assay for Campylobacter is a more rapid, accurate, and efficient alternative method for Campylobacter enumeration.

Graphical Abstract

1. Introduction

As Campylobacter is among the leading causative agents of gastroenteritis in the US, it is considered a major foodborne pathogen of public health interest. This zoonotic microorganism can be isolated from a wide range of food animals; however, it represents a critical food safety problem for poultry production [1]. Currently, more than 25 species of Campylobacter have been identified, and some species such as Campylobacter jejuni (C. jejuni), Campylobacter lari (C. lari), and Campylobacter coli (C. coli), are responsible for most human campylobacteriosis infections [2,3]. The members of this genus are thermophilic, microaerophilic bacterium with optimal temperatures for growth between 37 and 45 °C [4,5,6]. Research has shown that it grows best in an environment with 5% O2, 10% CO2, and 85% N2 [7]. Due to the microaerophilic nature of Campylobacter, it is assumed that they are less resilient as they appear to be very sensitive to environmental conditions compared to other foodborne pathogens such as Salmonella and Staphylococcus aureus [8].
The primary source of human campylobacteriosis originates from poultry products. Approximately 20 to 30% of human infections are linked to the mishandling and consumption of broiler meat, while 50 to 80% may be attributed to chicken, which is a reservoir for Campylobacter [9]. Over recent years, there has been a 12% increase in Campylobacter cases reported between 2015 and 2017 [10]. This can partly be attributed to the fact that the epidemiology of campylobacteriosis in poultry is still poorly understood [11]. As a result, the rapid and reliable detection and quantification of Campylobacter directly from poultry samples remains a challenge.
Currently, the identification and quantification of Campylobacter spp. relies on culture-based methods and phenotyping [12]. These conventional methods include selective plate enumeration, optical microscopy, and fluorescence optical density measurements that lead to an elevated level of specificity; however, these methods do possess disadvantages. When culturing Campylobacter spp., in stressful environments, cells can become viable but nonculturable (VBNC) and further complicate enumeration [13]. Detection and quantitation can be time-consuming, requiring prolonged incubation periods, and it can take several days to retrieve the results [14,15].
Molecular assays such as real-time polymerase chain reaction (RT-PCR) provide an alternative to microbiological methods of Campylobacter detection and quantification [15]. The real-time PCR assay is a rapid and specific nucleic acid amplification method for detection with advantages in terms of turnaround time, specificity, and sensitivity. The BAX® System Real-Time PCR assay for Campylobacter is a commercial PCR assay system approved by the Association of Official Agricultural Chemists (AOAC) International for the detection of Campylobacter in food and environmental samples. The BAX® System amplifies an approximately 400-base-pair species-specific genomic region [16]. The BAX® System Real-Time PCR assay is specific to the multiplex detection and quantification of C. jejuni, C. lari, and C. coli. The assay does not amplify sequences of other Campylobacter species or react with non-Campylobacter bacteria prominent in poultry samples, such as Salmonella, Escherichia coli, and Lactobacillus spp. [17]. The BAX® System Real-Time PCR assay minimizes problems common to phenotypic and antibody-based methods, such as cross-reaction with related organisms [18]. Thus, it provides the opportunity for specific screening of Campylobacter in poultry samples [18].
Therefore, the objective of this study was to develop and optimize a rapid quantification method for Campylobacter species (CampyQuant™) in post-chill whole bird carcass rinsates (WBCR) using the BAX® System Real-Time PCR assay for Campylobacter. As such, the first objective was to determine the optimal enrichment media, buffered peptone water (BPW), and 2× blood-free Bolton broth (2× BFBB), to optimize the parameters of the BAX® System Real-Time PCR assay. As BPW is a widely used enrichment media by the United States Department of Agriculture–Food Safety Inspection Service (USDA-FSIS) for foodborne pathogen enrichment (Salmonella), the use of it as an enrichment media in the current assay would have allowed for the identification and quantification of Campylobacter alongside several other pathogens [19]. The 2× BFBB was chosen as the other enrichment media due to its use by the USDA-FSIS as the primary enrichment media for Campylobacter [20]. After determining the optimal enrichment media, the detection limit was determined to mitigate enrichment parameters and establish a detection limit for each Campylobacter species using the BAX® System Real-Time PCR assay for Campylobacter. Lastly, the media comparison and enrichment time of detection parameters were used to develop a standard linear curve using the detected samples from the BAX® System Real-Time PCR assay. The development of this standard curve, in turn, allows the BAX® System to act as a potential quantification method for C. jejuni, C. coli, and C. lari in poultry rinsates.

2. Materials and Methods

2.1. Campylobacter spp. Pure Cultures

Campylobacter species C. jejuni American Type Culture Collection® (ATCC®) 700819, C. coli ATCC® BAA—1061™, and C. lari ATCC® BAA—1060™ were used for this study. The ATCC® strains utilized in the current study were chosen due to the extensive data available on their ecology, functionality, and genetic and biochemical characteristics. To obtain precultures for the growth experiments, frozen stock cultures (−80 °C) of each Campylobacter species (C. jejuni, C. coli, and C. lari) were plated on modified Charcoal Cefoperazone Deoxycholate Agar (mCCDA; Himedia, Mumbai, India) and incubated under microaerophilic conditions (5% O2, 10% CO2, and 85% N2) using the Anoxomat® III system (Advanced Instruments, Norwood, MA, USA) at 42 °C for 48 h. After incubation, one isolated colony was inoculated in 10 mL of blood-free Bolton broth (BFBB; Criterion, Hardy Diagnostics, Santa Maria, CA, USA), followed by incubation under microaerophilic conditions at 42 °C for 48 h using the Anoxomat® III system. The cell density of the inoculum used throughout the study was 9 Log10 CFU/mL, as determined by spread plating on mCCDA plates.

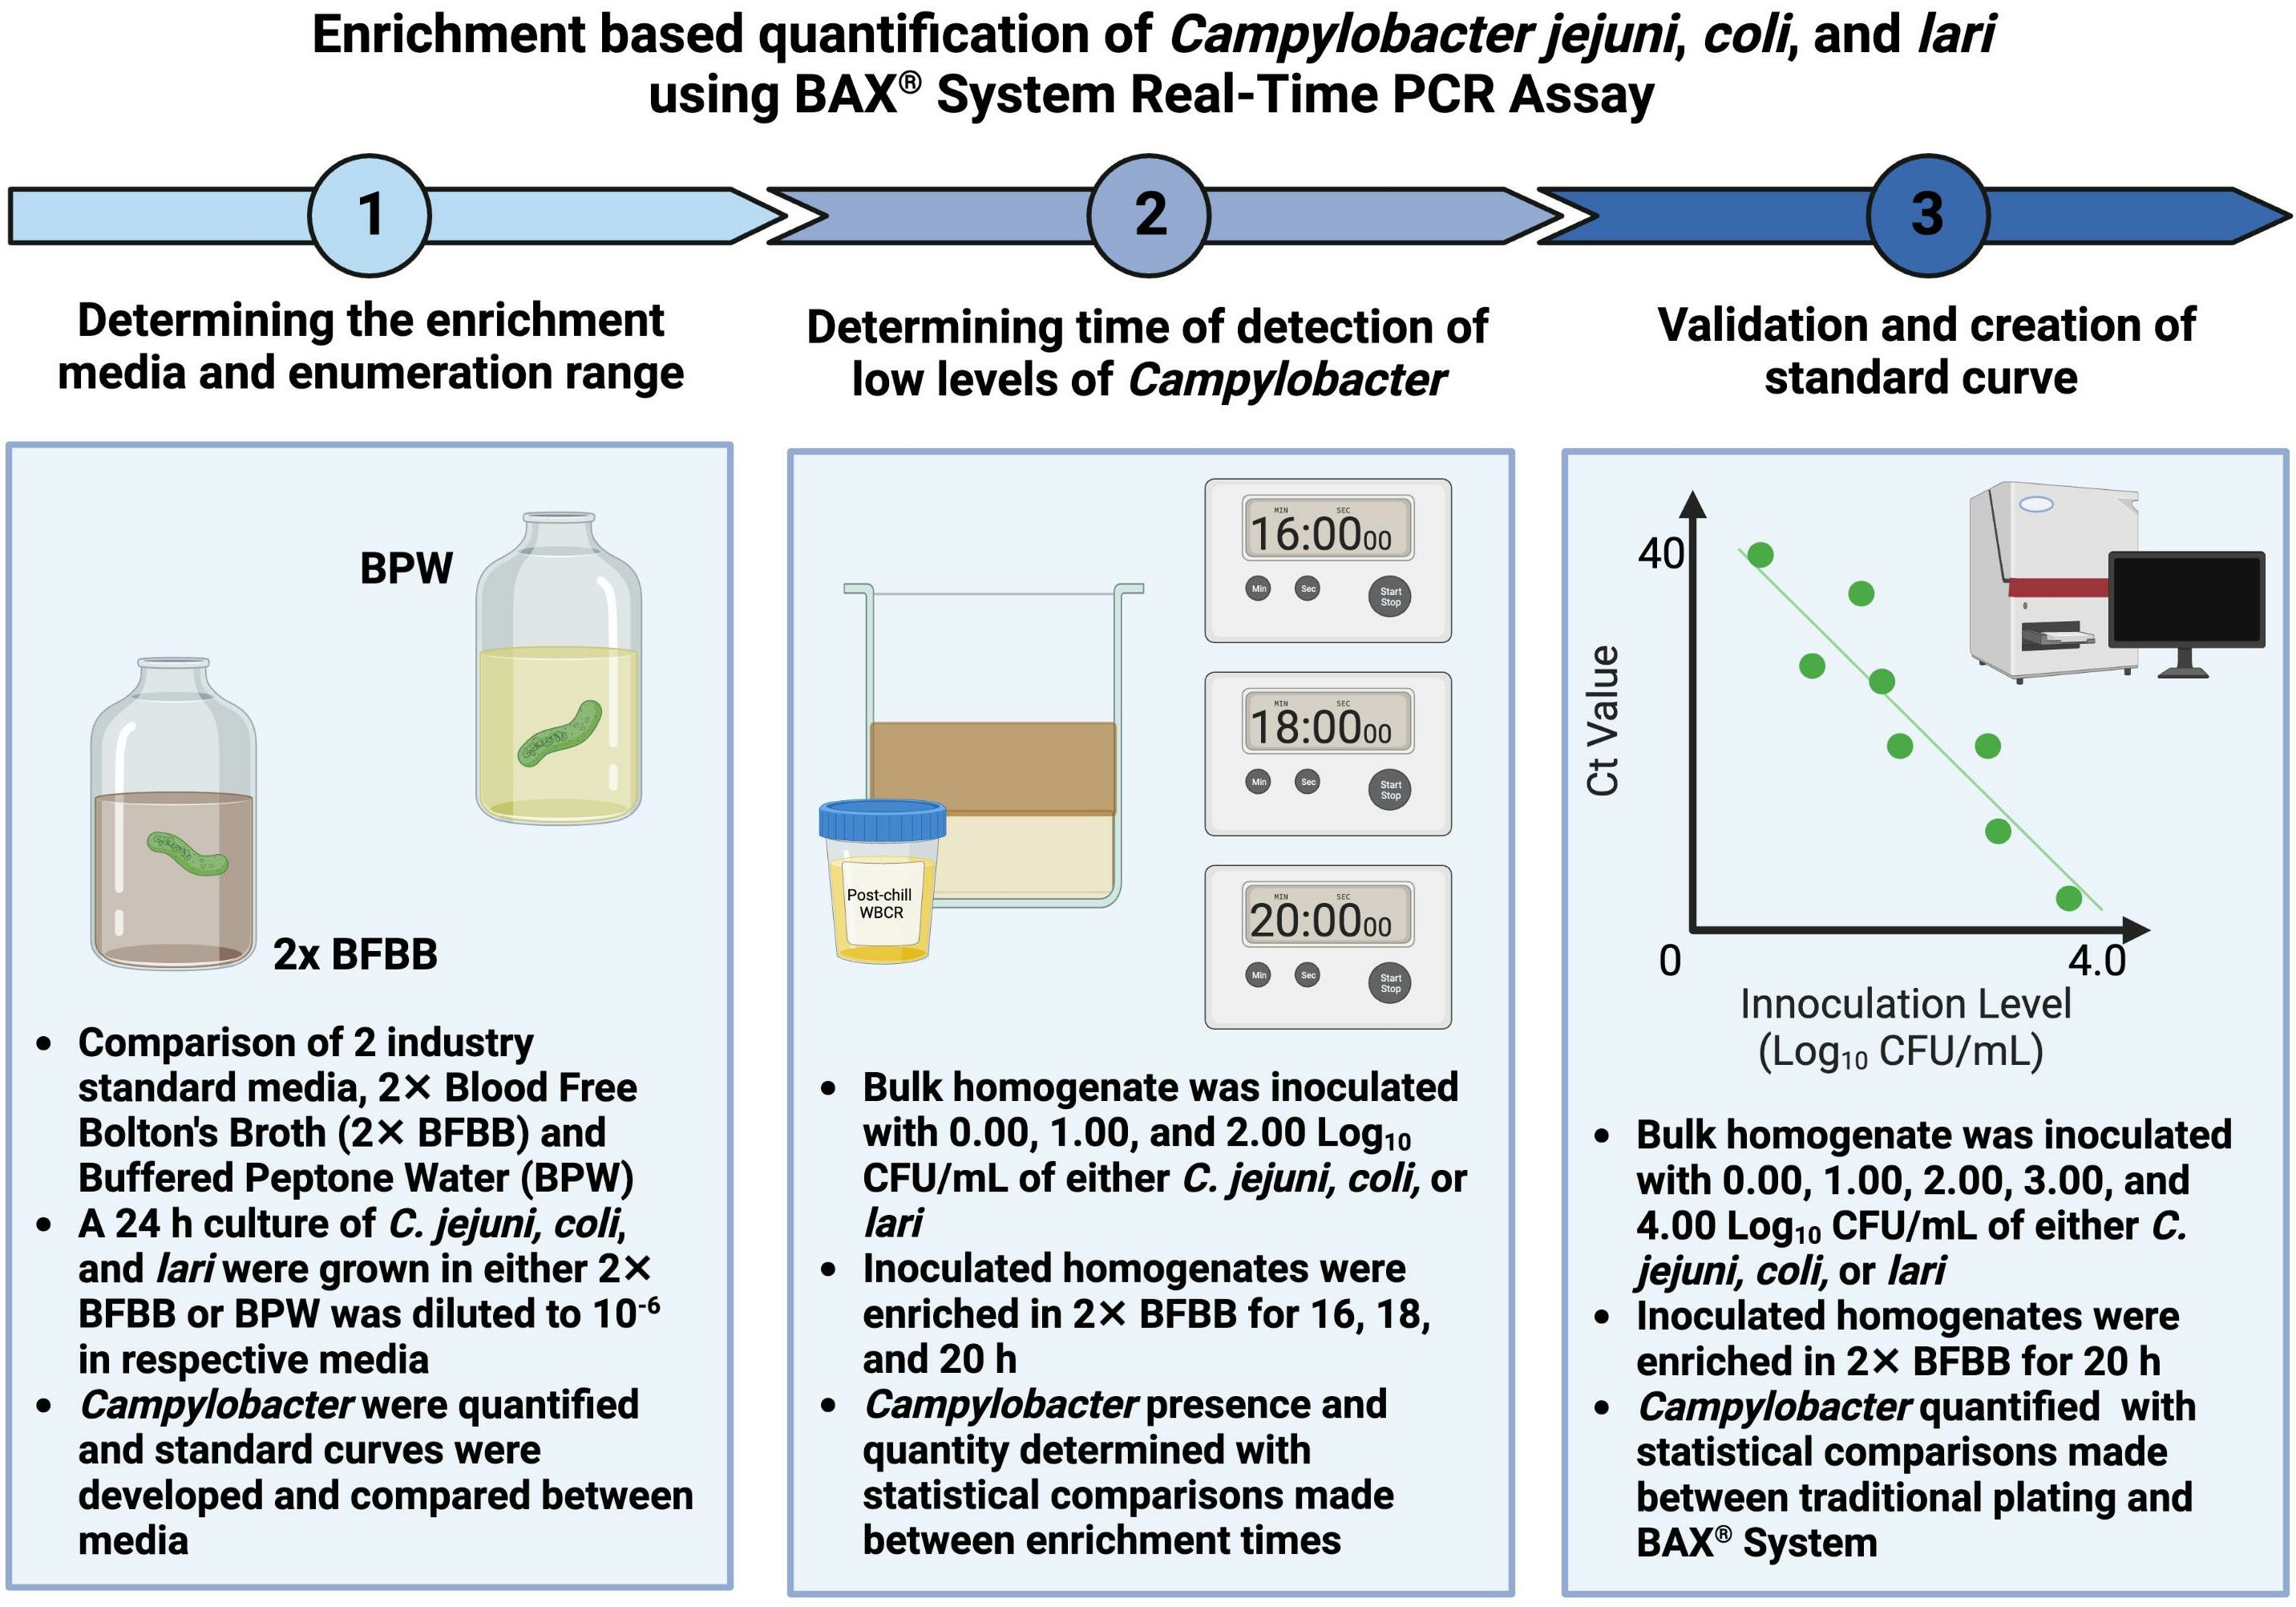
2.2. Objective 1: Determining Optimal Enrichment Media and Enumeration Range of BAX® System Real-Time PCR Assay

After 48 h of growth, 1 mL of Campylobacter jejuni, coli, and lari cultures were individually transferred to 19 mL of fresh 2× BFBB with 2× the antibiotic supplement (Cefoperazone 40 mg/L, Vancomycin 40 mg/L, Trimethoprim 40 mg/L, and Cycloheximide 50 mg/L) and BPW and incubated under microaerophilic conditions (5% O2, 10% CO2, and 85% N2) using one anaerobic pack sachet (Thermofisher Scientific, Waltham, MA, USA) for 24 h. Following 24 h incubation, a 10-fold dilution to 10−6 was performed on each medium using 9 mL of the respective medium (2× BFBB or BPW) and 1 mL of the 24 h Campylobacter species inoculum. Samples were spread plated using 100 μL of diluent on Modified Charcoal Cefoperazone Deoycholate Agar (mCCDA) to determine the concentration of Campylobacter. Additionally, Campylobacter in all media samples and dilutions was detected using the BAX® System Real-Time PCR assay for Campylobacter (KIT2018, Hygiena, Camarillo, CA, USA) according to the manufacturer’s instructions. The experiment was repeated three times with three technical replications per medium (N = 54 total number of samples; media: k = 2; species: k = 3; biological replicates: n = 3; trial: t = 3; Appendix AFigure A1). A standard curve was obtained from the amplification (cycle threshold; CT) of the genomic DNA extracted from the dilutions (1:10) of the pure culture samples using the BAX® System.

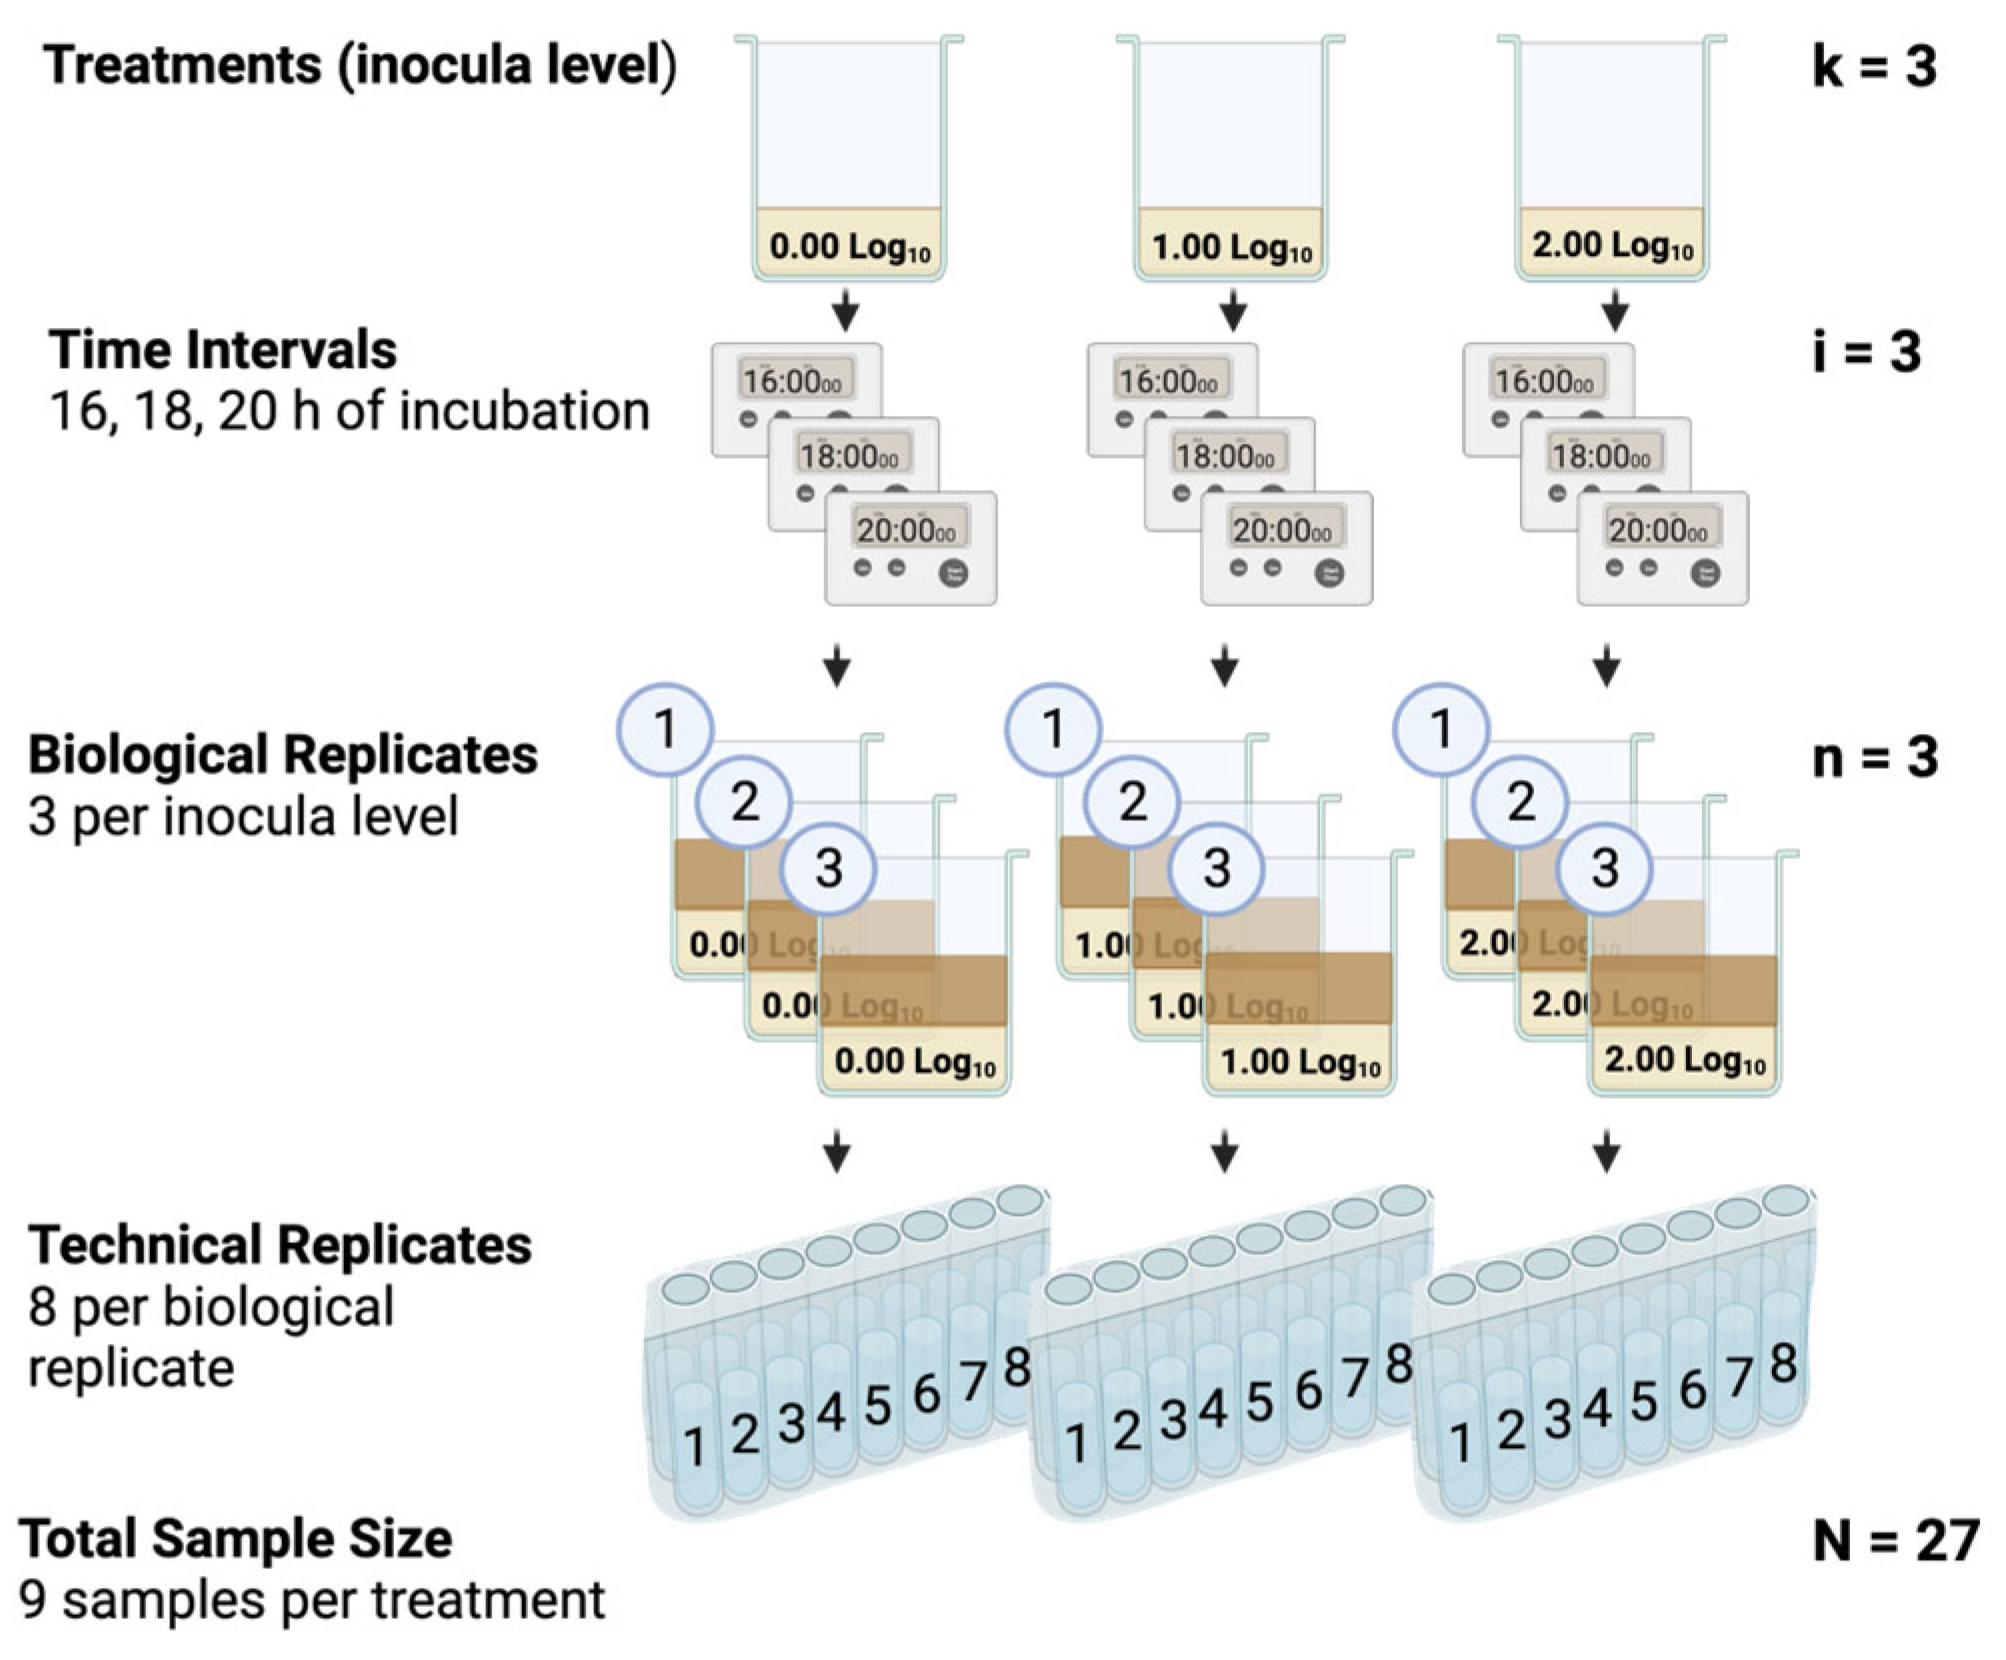
2.3. Objective 2: Time of Detection of Campylobacter spp. in Enriched Poultry Rinsates

Poultry post-chill rinsates were obtained from a commercial poultry producer in the southeastern United States and shipped via overnight courier to the Meat Science and Animal Biologics Discovery (MSABD) building at the University of Wisconsin-Madison (UW-Madison, Madison, WI, USA) in an insulated shipping cooler with frozen gel packets (ULINE, Pleasant Prairie, WI, USA). Upon arrival at MSABD, rinsates were stored at −20 °C until use.
No more than 24 h prior to the onset of the experiment, rinsates were thawed and combined to create bulk rinsates to reduce the variation between biological rinsate samples. Additionally, prior to the study, the bulk rinsate was screened for the presence of Campylobacter using the BAX® System Real-Time PCR assay for Campylobacter (KIT2018, Hygiena, Camarillo, CA, USA) according to the manufacturer’s instructions to determine if there was a significant presence of indigenous Campylobacter. Only bulk rinsates confirmed free of Campylobacter were utilized for the remainder of the study.
The pH of the bulk rinsate was measured with a SympHony pH meter and probe (VWR International, Radnor, PA, USA) to determine if the rinsates needed to be neutralized (7 pH) since many poultry processors use processing aids that alter the pH and this could impact downstream microbiological inferences [21]. All bulk homogenate rinsates in the current study had a pH of 7 ± 0.2 and did not require neutralization using sodium thiosulfate, sodium bicarbonate, and soy lecithin [21].
From the bulk post-chill poultry rinsates, 30 mL was aliquoted into 24 oz sterile Whirl-Pak (Nasco, Fort Atkinson, WI, USA) bags and inoculated at a targeted 0.00, 1.00, and 2.00 Log10 CFU/mL of C. jejuni (ATCC® 700819™), C. coli (ATCC® BAA—1061™), or C. lari (ATCC® BAA—1060™) (N = 216 total number of samples; k = 3 number of treatments; n = 24 number of samples per treatment group per timepoint; 3 timepoints; 8 technical replicates/bio replicate; 1 non-inoculated sample/enrichment time; Appendix AFigure A2). Subsequently, 30 mL of pre-warmed (42 °C) 2× BFBB with 2× the antibiotic supplement was added to each sample and incubated at 42 °C for either 16, 18, or 20 h, respectively [20].
When this research was performed, 2× BFBB with 2× antibiotic supplements was recommended by the USDA-FSIS to enrich Campylobacter in poultry rinsates [20,22]. Per the USDA-FSIS, samples were incubated under microaerophilic conditions using one anaerobic pack sachet (ThermoFisher Scientific, Waltham, MA, USA) inside a 7 L anaerobic box (Mitsubishi, New York City, NY, USA). At each enrichment time, samples were removed from the incubator. Campylobacter presence and quantity were determined the BAX® System Real-Time PCR assay for Campylobacter (KIT2018, Hygiena, Camarillo, CA, USA) according to the manufacturer’s package insert, with 8 technical replicates per biological replicate (n = 3).

2.4. Objective 3: Validation and Standard Curve Development of Quantification of BAX® System Real-Time PCR Assay

After elucidating the enrichment time parameters for the limit of detection using the BAX® System Real-Time PCR assay, a standard curve was developed for each species. Bulk post-chill WBCR were prepared as previously described in Objective 2. The initial concentrations of C. jejuni, C. coli, and C. lari before dilutions were 9.01, 9.13, and 9.05 Log10 CFU/mL, respectively.
For each serovar, C. jejuni (ATCC® 700819™), C. coli (ATCC® BAA—1061™), or C. lari (ATCC® BAA—1060™), 30 mL of the bulk post-chill WBCR was aliquoted into 24 oz Whirl-Pak bags (N = 39). Samples were either uninoculated (n = 1) or inoculated with 1.00, 2.00, 3.00, or 4.00 Log10 CFU/mL (n = 3 at each inoculation level) of Campylobacter spp. Pre-warmed (42 °C) 2× BFBB (30 mL) with 2× antibiotic supplements was aseptically added to the inoculated post-chill WBCR (30 mL). Enrichments prior to incubation were enumerated on Campy Cefex to confirm inoculation level. Samples were subsequently incubated under microaerophilic conditions using one anaerobic pack sachet (ThermoFisher Scientific, Waltham, MA, USA) inside a 7 L anaerobic box (Mitsubishi, New York City, NY, USA) at 42 °C for 20 h. Campy Cefex plates were used throughout the study to retain consistency with regulatory and industry standards [20] (USDA-FSIS, 2021). Plated samples were incubated for 48 h using the Anoxomat® III system (Advanced Instruments, Norwood, MA, USA).
Enriched samples were tested in quintuplet with the BAX® System Real-Time PCR assay for Campylobacter (KIT2018, Hygiena, Camarillo, CA, USA) according to the manufacturer’s package insert. The generation of a lysate and subsequent amplification of the genomic DNA of the inoculated samples was performed using the BAX® standard protocols for poultry WBCR [23]. After the 20 h incubation, 5 µL of the samples was run on the BAX® System Real-Time PCR to obtain a CT value. A linear regression curve was generated using CT values detected from the PCR and inoculated sample concentration.

2.5. Statistical Analyses

2.5.1. Objective 1: Determining Optimal Enrichment Media and Enumeration Range of BAX® System Real-Time PCR Assay

All statistical analyses for this study were performed in JMP 14.0 (SAS Institute Inc., Cary, NC, USA). Among the pure cultures, each dilution series of the sample was statistically analyzed using linear regression analysis to determine if there was a relationship between CT value and Campylobacter detection in the BAX® System Real-Time PCR. After linear regression, a Mann–Whitney U test was used to determine significant differences within species and the detection limit between different media for each species in the BAX® System Real-Time PCR. Quantification metric parameters including specificity, sensitivity, efficiency, accuracy, positive and negative likelihood ratios (PLR, NLR), prevalence, positive predictive value (PPV), and negative predictive value (NPV) were calculated for each species and media using the following equations:
S p e c i f i c i t y = 1 f a l s e   p o s i t i v e s   t r u e   n e g a t i v e s + f a l s e   p o s i t i v e s
S e n s i t i v i t y = 1 f a l s e   n e g a t i v e s t r u e   p o s i t i v e s + f a l s e   n e g a t i v e s
E f f i c i e n c y = 1 + 10 ( 1 / s l o p e )
A c c u r a c y = s e n s i t i v i t y × p r e v a l e n c e + ( s p e c i f i c t y × 1 p r e v a l e n c e )
P L R = s e n s i t i v i t y 1 s p e c i f i c i t y
N L R = 1 s e n s i t i v i t y s p e c i f i c i t y
P r e v a l e n c e = p o s i t i v e   s a m p l e s t o t a l   s a m p l e s
P P V = t r u e   p o s i t i v e s t r u e   p o s i t i v e s + f a l s e   p o s i t i v e s
N P V = t r u e   n e g a t i v e s t r u e   n e g a t i v e s + f a l s e   n e g a t i v e s
The main effect and interaction of media and species were evaluated for the BAX System quantification metric parameters such as sensitivity, accuracy, prevalence, NLR, and NPV using a Mann–Whitney U test. Other metric parameters were not statistically analyzed because the numerical values were the same, resulting in no differences. Further analysis was conducted on quantification metric parameters to determine differences between Campylobacter species (C. jejuni, C. coli, and C. lari) in 2× BFBB and BPW and between the enrichment media in Campylobacter species. Pairwise differences were analyzed using an χ2 analysis. Significant differences were considered at p ≤ 0.05.

2.5.2. Objective 2: Time of Detection of Campylobacter spp. in Enriched WBCR

To determine the appropriate time needed for Campylobacter detection in the BAX® System Real-Time PCR, three time points were used, 16, 18, and 20 h, based on the growth kinetics of the three isolates used in this study [24]. PCR quantification metric parameters, sensitivity, specificity, PLR, NLR, prevalence, PPV, NPV, and accuracy, were calculated for each species and time point. Furthermore, the quantification metrics were analyzed for main effect and interactions using a Mann–Whitney U test. Pairwise differences comparing significances between the time (16, 18, and 20 h) of Campylobacter jejuni, coli, and lari and the species Campylobacter species (C. jejuni, C. coli, and C. lari) at 16, 18, and 20 h of enrichment were evaluated using an χ2 Analysis. Significant differences were considered at p ≤ 0.05.

2.5.3. Objective 3: Validation and Standard Curve Development of Quantification of BAX® System Real-Time PCR Assay

In poultry WBCR, for each Campylobacter species, 1.00 to 4.00 Log10 CFU/mL of sample was statistically analyzed using a linear regression model to determine the relationship with CT values from the BAX® System and plate counts. Additionally, PCR quantification metric parameters, sensitivity, accuracy, prevalence, NLR, and NPV, were analyzed among CampyQuant™ and Campy Cefex plates. Campylobacter WBCR samples’ main effects and comparisons quantified using Campy Cefex and CampyQuant™ were explored for sensitivity, accuracy, prevalence, NLR, and NPV using a Mann–Whitney U test. Pairwise differences were determined using an χ2 analysis. An ANCOVA test was run to investigate if there was a significant different linear slope between C. jejuni, C. coli, and C. lari after 20 h of enrichment in poultry rinsate samples. Significant differences were considered at p ≤ 0.05.

3. Results

3.1. Objective 1: Determining Optimal Enrichment Media and Enumeration Range of BAX® System Real-Time PCR Assay

The first objective aimed at determining the optimal enrichment media of the BAX® System Real-Time PCR Campylobacter (jejuni, coli, lari) assay. To accomplish this objective, two standard media, 2× BFBB and BPW, were inoculated with varying levels of either a 24 h culture of Campylobacter jejuni, coli, or lari that were grown in respective media and the cycle thresholds (CT) were determined using the BAX® System Real-Time PCR Campylobacter (jejuni, coli, lari) assay. The sensitivity, specificity, efficiency, positive likelihood ratio (PLR), negative likelihood ratio (NLR), prevalence, positive predictive value (PPV), negative predictive value (NPV), and accuracy of the detection of Campylobacter species within media and differences of media within species, as well as their interaction, were analyzed. Lastly, the enumeration range and linear fit of Campylobacter jejuni, coli, and lari was compared between 2× BFBB and BPW, with the slopes being compared using ANCOVA.

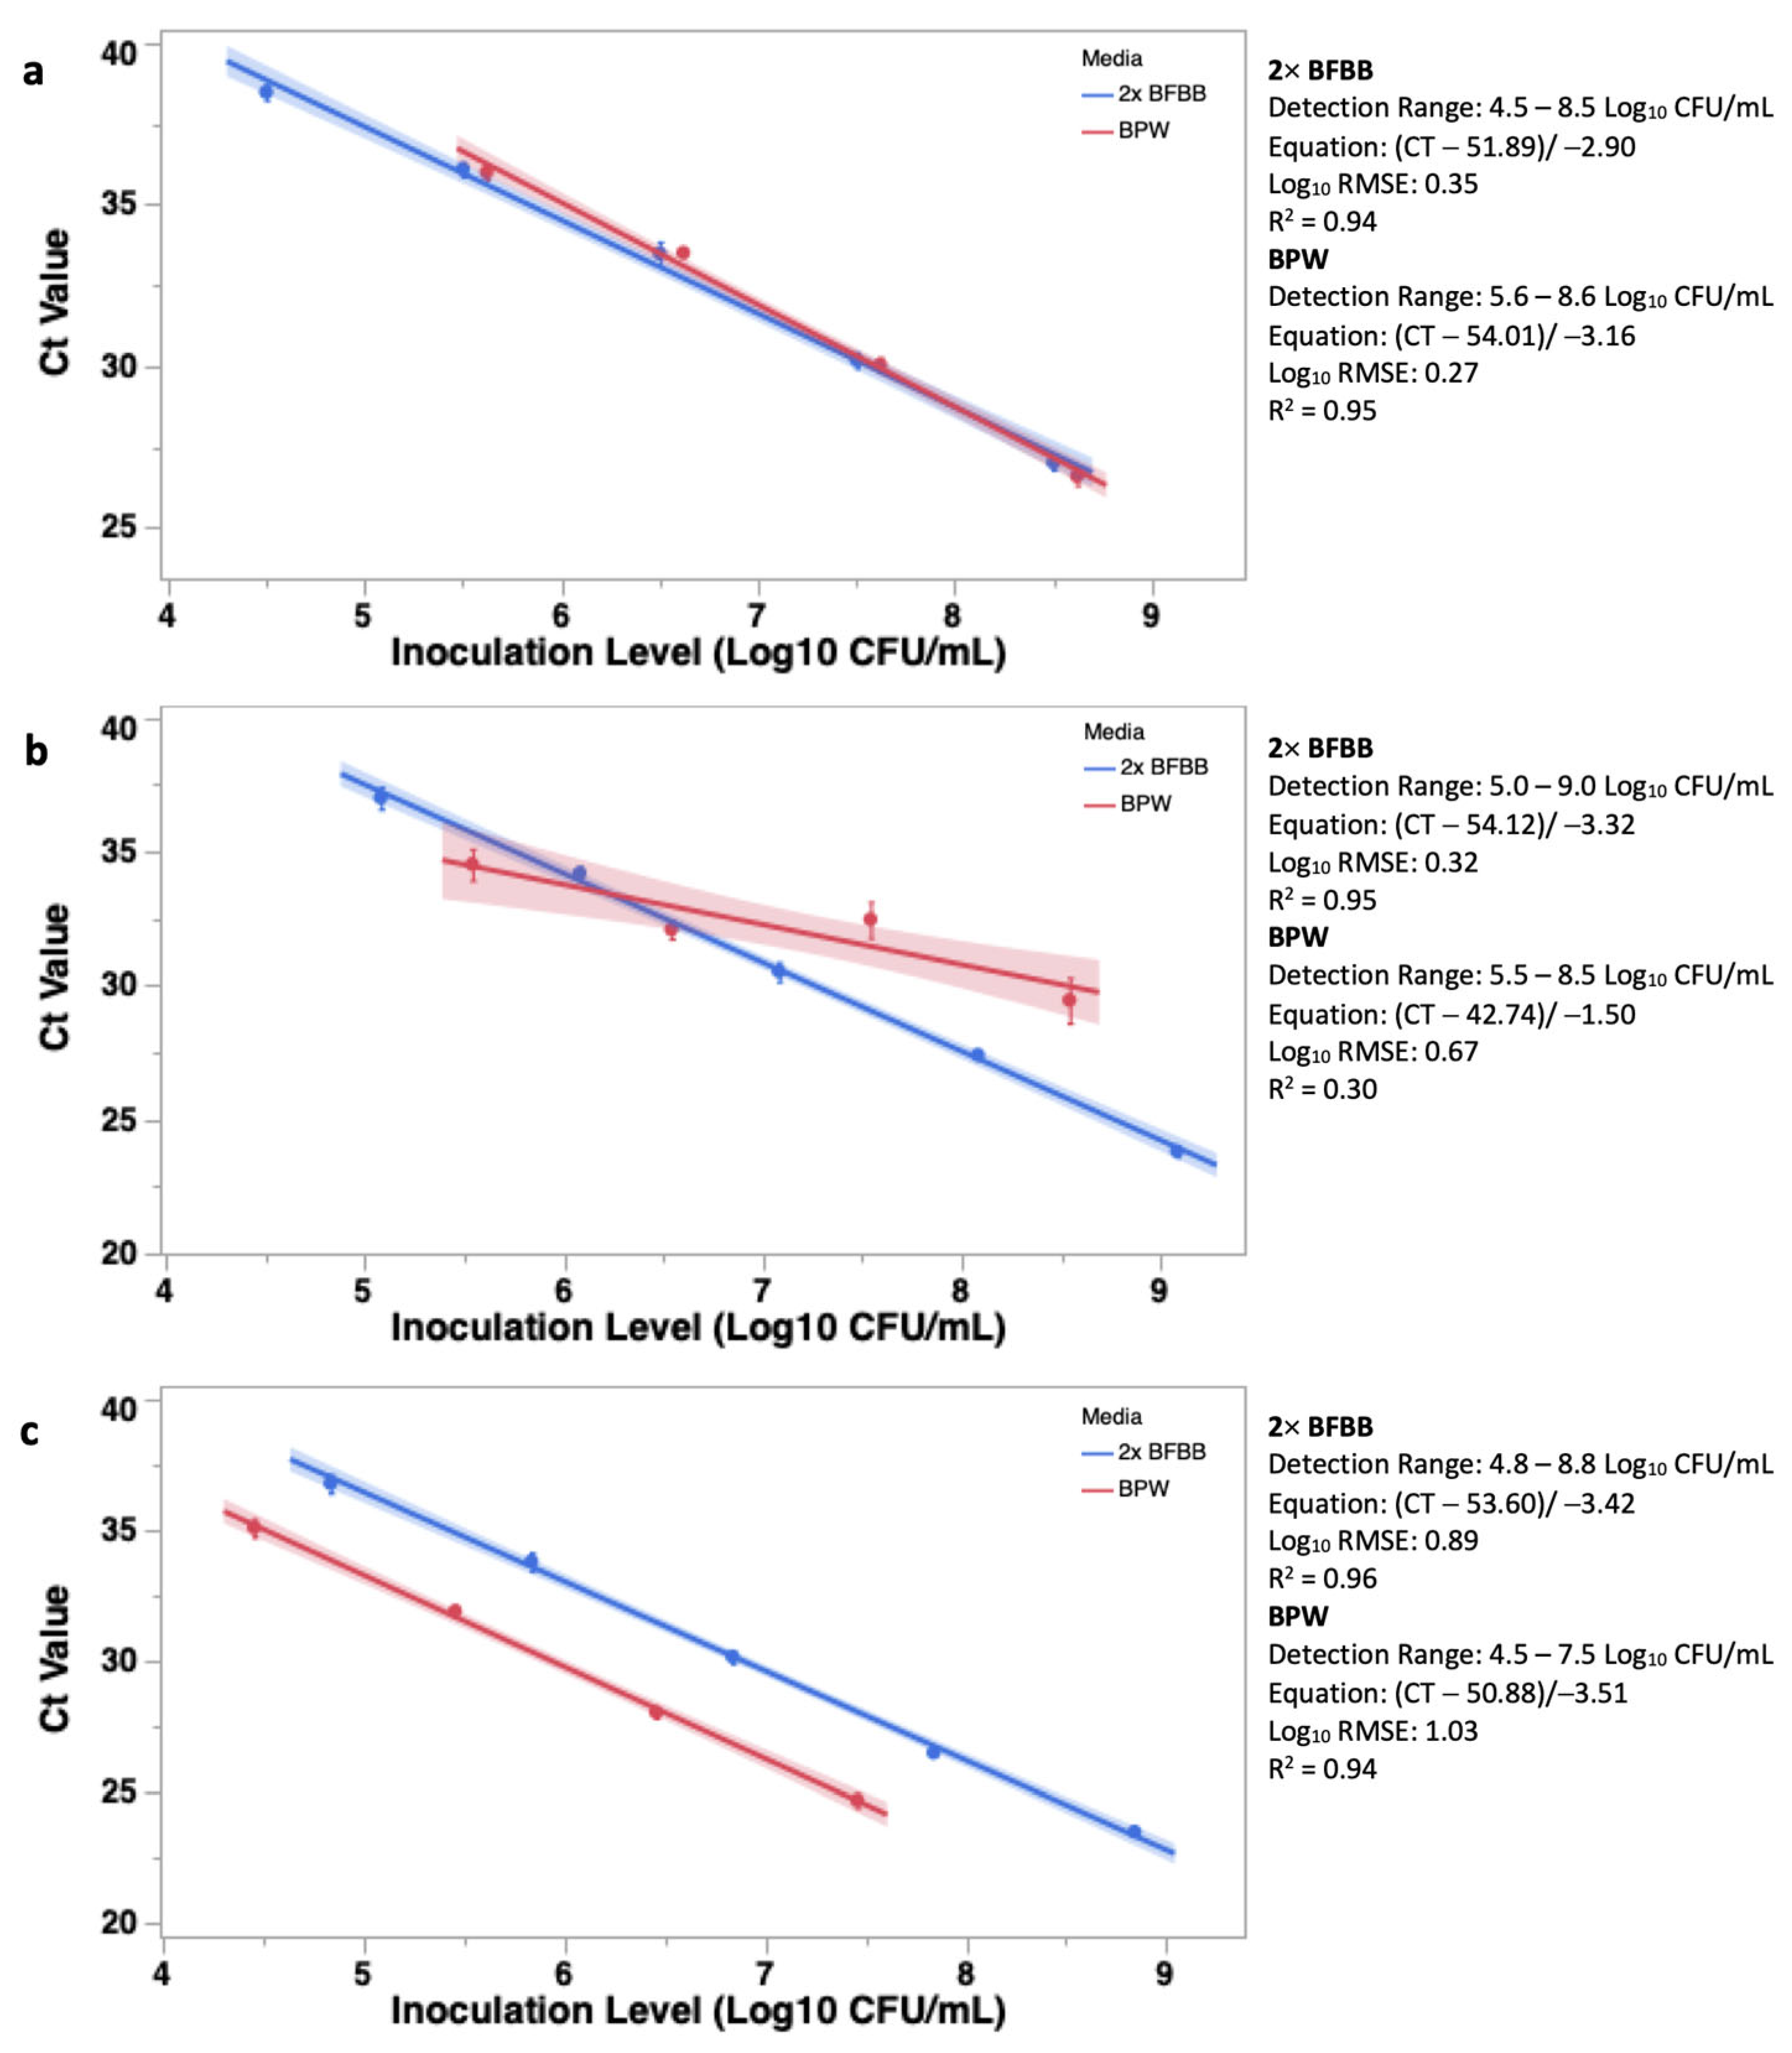
3.1.1. Optimal Enrichment Media

There was no interaction between Campylobacter species and media on quantification quality parameters (p > 0.05), except for accuracy (p < 0.05; Table 1). The accuracy of detection of Campylobacter was highest among C. jejuni and C. coli enriched in 2× BFBB (93.8 and 96.3%) compared to C. jejuni, coli, and lari enriched in BPW (81.9, 79.0, and 84.0%). The accuracy of detection of C. lari when enriched in 2× BFBB was not different than when enriched in BPW (89.8 and 84.0%). There was not a main effect of Campylobacter species on PCR quantification quality metrics; however, there was a main effect of media on the sensitivity, prevalence, NLR, NPV, and accuracy (p < 0.05; Table 1). The sensitivity (92.5 and 78.3%), prevalence (87.2 and 70.5%), NLR (7.6 and 26.7%), NPV (40.74 and 14.1%), and accuracy (93.3 and 81.6%) were higher among Campylobacter species grown and inoculated in 2× BFBB than in BPW (p < 0.05). Additionally, the impact that media had on the performance characteristics within individual Campylobacter species and the effect of species on the performance within each media is defined in Tables S1–S3. Similar effects were seen within these analyses as in the full model and for brevity will not be discussed in the text.

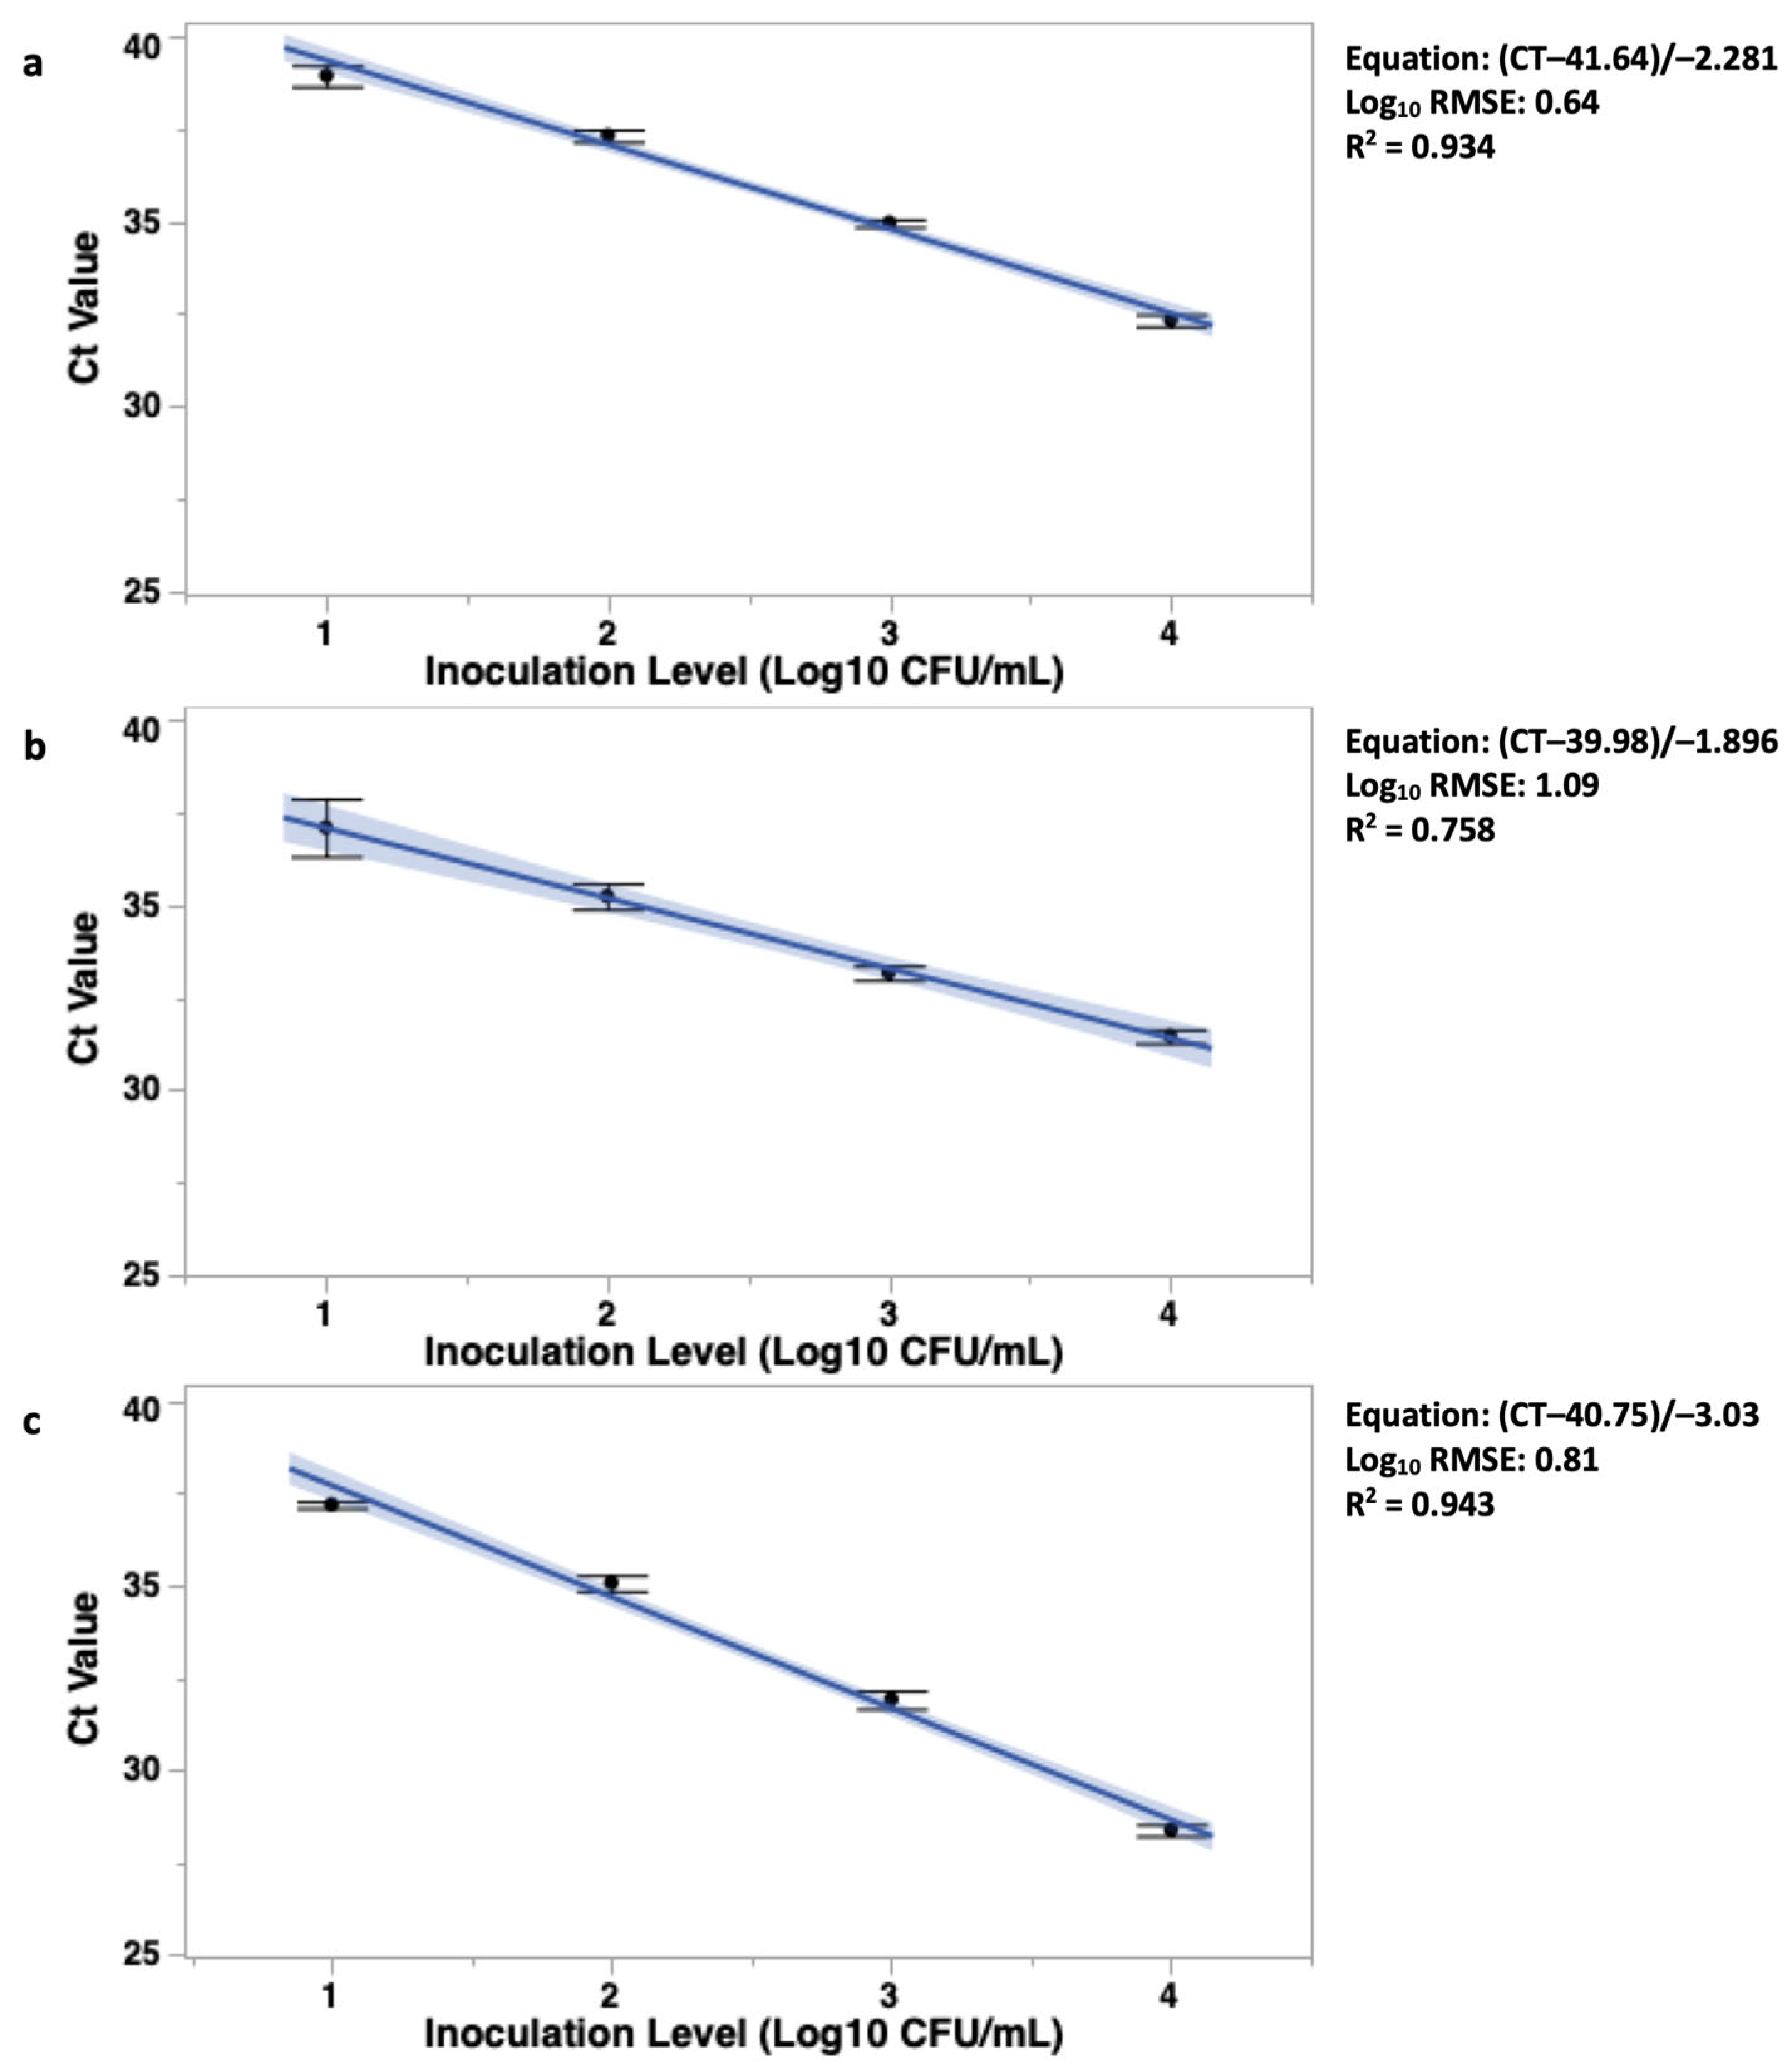
3.1.2. Enumeration Range and Linear Fit

After growth in 2× BFBB or BPW, Campylobacter jejuni, coli, and lari were serially diluted in respective media and the cycle thresholds (CT) were determined using the BAX® System Real-Time PCR Campylobacter (jejuni, coli, lari) assay. The 24 h culture was also plated onto mCCDA to confirm the inoculation level to determine linear fit and to compare the slopes between the two media, 2× BFBB or BPW. Overall, the initial concentration of C. jejuni, coli, and lari were 8.5, 9.0, and 8.8 and 8.6, 8.5, and 7.5 Log10 CFU/mL in 2× BFBB and BPW, respectively. Linear curves were developed within the range of the lower limit of detection in BPW (Table S4). The lower limit of detection was determined as the initial inoculation level producing a CT value within range (<40) of the BAX® System. The lower limit of detection of C. jejuni, coli, and lari was 3.03, 2.93, and 3.13 Log10 CFU/mL in 2× BFBB, whereas the lower limit was 5.60, 5.50, and 4.50 Log10 CFU/mL in BPW (Table S4). As such, across Campylobacter species, only four dilutions in BPW ranging from 5.6 to 8.6, 5.5 to 8.5, and 4.5 to 7.5 Log10 CFU/mL were able to be utilized for linear fit.
There was a significant difference between the slopes of C. jejuni detected in 2× BFBB and BPW (−2.90 and −3.16, F < 0.01; Figure 1a). However, the linear fit (R2 = 0.94 and 0.95) and Log10 RMSE (0.35 and 0.27) were similar (Figure 1a). There were also differences between the slopes of C. coli inoculated into 2× BFBB and BPW, with the slope being greater in 2× BFBB (−3.32 and −1.50, F < 0.01; Figure 1b). The fit of the data (R2 = 0.95 and 0.30) and Log10 RMSE (0.32 and 0.67) were stronger among the linear curves belonging to 2× BFBB (Figure 1b). There was also a difference in the slopes generated when C. lari was inoculated into 2× BFBB or BPW, with the slope of BPW being greater than that of 2× BFBB (−3.42 and −3.51; F < 0.01; Figure 1c). The linear fit (R2 = 0.96 and 0.94) and Log10 RMSE (0.35 and 0.27) were similar (Figure 1c).

3.2. Objective 2: Time of Detection of Campylobacter spp. in Enriched Poultry WBCR

The results of the first objective indicated that the optimal enrichment media is 2× BFBB. However, samples needed to be within the enumerable range to achieve optimal quantification outcomes, as identified in objective 1. As such, the samples would need to be enriched to be within the quantifiable range. Therefore, the second objective was to determine the time of enrichment necessary for the detection of low Campylobacter jejuni, coli, and lari concentrations in commercial poultry WBCR. As the WBCR were collected from a commercial poultry operation post-chill, the impact of the indigenous microbiota on the detection of low Campylobacter jejuni, coli, and lari concentrations using the BAX® System Real-Time PCR assay could be explored. Post-chill WBCR (7.04 pH) were inoculated with a target concentration of 0.00, 1.00, and 2.00 Log10 CFU/mL of individual Campylobacter species and enriched in 2× BFBB for either 16, 18, or 20 h. At each time point, the Campylobacter within enriched and inoculated poultry WBCR were subjected to the BAX® System Real-Time PCR assay. The PCR quality parameter metrics were determined and statistically compared.
The target inoculation levels of 0.00, 1.00, and 2.00 Log10 CFU/mL of individual Campylobacter species were confirmed via plating on mCCDA and were determined to be 0.58, 1.58, and 2.58 Log10 CFU/mL for C. jejuni, 0.17, 1.17, and 2.17 Log10 CFU/mL for C. coli, and 0.03, 1.03, and 2.03 Log10 CFU/mL for C. lari. The prevalence of individual inoculation levels was determined and increased with Log10 CFU/mL concentration and enrichment time (Table S5). At 20 h of enrichment, both the target inoculation of 1 and 2 Log10 CFU/mL had a prevalence greater than 88% among the inoculated samples (Table S5).
To further delineate the effect of enrichment time on the PCR performance, the main effect and interaction of enrichment time (16, 18, and 20 h) and Campylobacter species (C. jejuni, coli, and lari) was determined (Table 2). There was an interaction between the enrichment time and Campylobacter species on PCR performance metrics, sensitivity, NLR, NPV, and accuracy (p < 0.05; Table 2). The sensitivity was the greatest at 20 h of enrichment among C. jejuni inoculated rinsates (94.4%) and was not different from the sensitivity of C. jejuni detection at 18 h of enrichment (86.1%). The sensitivities of 20 h of enrichment of C. coli and C. lari (63.9 and 72.2%) were not different from one another or different from C. jejuni at 16 h (66.7%). The sensitivity of C. coli at 16 and 18 h of enrichment (14.6 and 25.7%) and C. lari at 16 h of enrichment were the lowest among samples (13.9%). The NLR was lowest at 20 h of enrichment among C. jejuni inoculated samples (5.6%) which was not different than C. jejuni inoculated samples enriched for 18 h (13.9%). The NLR of C. lari inoculated samples enriched for 20 h (27.7%) was not different from those inoculated with C. jejuni and enriched for 16 or 18 h (33.3 and 13.9%) or those inoculated with C. coli and enriched for 20 h (36.1%). The NPV was highest among those inoculated with C. jejuni and enriched for 20 h (44.4%) and was significantly different than all other samples. Those inoculated with C. jejuni and enriched for 18 h (17.0%) had a higher NPV than those inoculated with C. lari and enriched for 16 h (5.1%). The accuracy was highest among samples inoculated with C. jejuni and enriched for 18 and 20 h (71.4 and 78.1%) compared to all other samples. The accuracy was significantly lower among those inoculated with C. coli (3.0 and 8.6%) and C. lari (1.2 and 27.3%) and enriched for 16 or 18 h, as compared to those enriched for 20 h (39.2 and 50.4%).
Although there was not a significant interaction between the enrichment time and Campylobacter species, there was a main effect for both (Table 2, p < 0.05). The prevalence increased as the enrichment time progressed, with 20 h (73.8%) being greater than both 16 and 18 h (34.2 and 55.1%). Among the three species of Campylobacter, the highest prevalence was calculated among samples inoculated with C. jejuni (79.1%), as compared to C. coli and C. lari (37.3 and 46.7%). There was no difference between the prevalence calculated among samples inoculated with C. coli and C. lari (37.3 and 46.7%).
Additionally, the impact that the enrichment time had on the performance characteristics within individual Campylobacter species and the effect of species on the performance within each enrichment time are defined in Tables S5–S7. Similar effects were seen within these analyses as in the full model and for brevity will not be discussed in the text. In summation, 20 h enrichment resulted in better sensitivity, accuracy, prevalence, and NLR and NPV values for all Campylobacter species, as compared to 16 and 18 h enrichment (Table 2 and Tables S5–S7). These results suggest that after 20 h of enrichment in poultry rinsates, Campylobacter could be detected from low concentrations of 1.00 and 2.00 Log10 CFU/mL.

3.3. Objective 3: Validation and Standard Curve Development of Quantification of BAX® System Real-Time PCR Assay

After determining that the enrichment time needed for low concentrations of Campylobacter to be detected in the BAX® System Real-Time PCR assay was 20 h of incubation, a CampyQuant™ standard curve was developed for Campylobacter quantification in poultry WBCR (7.03 pH) using a linear regression model. The resulting linear fit equation generated from the CT value from the amplification of Campylobacter within the inoculated rinsates (1.00 to 4.00 Log10 CFU/mL) that were enriched for 20 h was subsequently employed. The sensitivity, prevalence, NLR, NPV, and accuracy of the BAX® System Real-Time PCR assay were compared to the current standard quantification method using traditional spread plating on Campy Cefex agar where the main effect and interaction of the quantification method and Campylobacter species were determined.

3.3.1. CampyQuant™ Linear Fit and Subsequent Equation

The linear fit and resulting equation was generated for each Campylobacter species using the CT values from the BAX® System to estimate the pre-enrichment Log10 CFU/mL of WBCR. The linear equation was used to simulate the logarithmic growth of the bacteria in order to estimate the pre-enriched Campylobacter levels in poultry carcass rinses. All three Campylobacter species had a relation between data and the linear equation, with an R2 of 0.934 (1), 0.758 (2), and 0.943 (3), respectively, with C. jejuni and C. lari exhibiting a stronger relationship than C. coli. The Log10 RMSE was also within 1 Log10 CFU/mL at 0.64 (1), 1.09 (2) and 0.81 (3) Log10 RMSE. The equations generated were as follows:
C .   j e j u n i   L o g 10   C F U / m L = C T 41.64 2.281
C .   c o l i   L o g 10   C F U / m L = C T 39.98 1.896
C .   l a r i   L o g 10   C F U / m L = C T 40.75 3.03
Also, using CampyQuant™, an ANCOVA test was used to investigate if there was a significant difference between the linear slopes of curve generated from C. jejuni, C. coli, and C. lari after 20 h of enrichment in poultry rinsate samples. There were differences among the slopes of the three Campylobacter species (F < 0.05; Figure 2). The C. coli linear slope was the least horizontal at −1.89, followed by C. jejuni with a linear slope of −2.28. The lowest linear slope was C. lari, at −3.03.

3.3.2. Campylobacter spp. Levels from Each Quantification Method

Using the equations generated from linear regression, CampyQuant™ estimates of C. jejuni, coli, and lari were generated and compared to the spread-plated estimates of the three species based on the industry standard Campy Cefex (Table 3). The main effect and subsequent interaction of quantification method and species was explored at individual inoculation levels (Table 3). There was an interaction of quantification method and Campylobacter species on the estimated Campylobacter levels at each inoculation level (p < 0.05; Table 3). At 1.00 Log10 CFU/mL (p < 0.05), C. jejuni detection in Campy Cefex (1.64 Log10 CFU/mL) was significantly higher than C. jejuni detected with CampyQuant™ (1.18 Log10 CFU/mL) or C. lari detected with either CampyQuant™ or Campy Cefex (1.18 and 0.70 Log10 CFU/mL). There were no differences in detection of C. jejuni on Campy Cefex (1.64 Log10 CFU/mL), C. coli on CampyQuant™ (1.212 Log10 CFU/mL), or C. coli on Campy Cefex (1.26 Log10 CFU/mL). At 2.00 Log10 CFU/mL, C. jejuni enumerated on Campy Cefex plates (2.18 Log10 CFU/mL) was significantly higher than C. jejuni quantified using CampyQuant™ (1.89 Log10 CFU/mL), C. coli quantified on Campy Cefex plates (1.74 Log10 CFU/mL), and C. lari quantified on both CampyQuant™ (1.88 Log10 CFU/mL) and Campy Cefex plates (1.50 Log10 CFU/mL). Moreover, there was no difference between quantification of C. jejuni on Campy Cefex plates (2.18 Log10 CFU/mL) and C. coli enumeration using CampyQuant™ (2.09 Log10 CFU/mL). At 3 Log10 CFU/mL, C. coli quantified on Campy Cefex plates (3.23 Log10 CFU/mL) was the highest concentration seen and significantly different from C. coli using CampyQuant™ (2.74 Log10 CFU/mL) and C. lari using either CampyQuant™ (2.92 Log10 CFU/mL) or Campy Cefex plates (2.68 Log10 CFU/mL). No differences were seen between C. coli using Campy Cefex plates and C. jejuni enumerated using either CampyQuant™ (2.93 Log10 CFU/mL) or Campy Cefex plates (3.05 Log10 CFU/mL). At 4.00 Log10 CFU/mL, the highest concentration used in the study, C. coli quantified using Campy Cefex (4.13 Log10 CFU/mL) was significantly higher than C. coli with CampyQuant™ (3.90 Log10 CFU/mL) and C. lari enumerated using Campy Cefex plates (3.55 Log10 CFU/mL). When compared to C. coli using Campy Cefex, no differences were observed against C. jejuni quantified with either CampyQuant™ or Campy Cefex (4.08 and 4.03 Log10 CFU/mL) and C. lari quantified using CampyQuant™ (4.09 Log10 CFU/mL). Additionally, the impact that the quantification method had on the estimation of Campylobacter within individual Campylobacter species is defined in Table S8. Similar effects were seen within these analyses as in the full model and for brevity will not be discussed in the text.

3.3.3. Performance Parameters

Quantification metric parameters (sensitivity, prevalence, NLR, NPV, and accuracy) were statistically compared to determine the main effect and interaction of the quantification method (CampyQuant™ vs. Campy Cefex) and Campylobacter species on the aforementioned metrics (Table 4). The Mann–Whitney U test showed no interactions between the quantification method and Campylobacter species (p > 0.05; Table 4). A main effect was seen between the three Campylobacter species for NPV (p < 0.05; Table 4). C. jejuni had the highest NPV (CampyQuant™ 34.4%; Campy Cefex 30.5%) among species, followed by C. lari (CampyQuant™ 26.1%; Campy Cefex 27.8%) and, lastly, C. coli (CampyQuant™ 20.6%; Campy Cefex 15.9%). Additionally, the impact the quantification method had on the performance parameters within individual Campylobacter species and the effect of species on performance parameters within each quantification method are detailed in Tables S9–S11. Similar effects were seen within these analyses as in the full model and for brevity will not be discussed in the text.

4. Discussion

In 2016, the USDA-FSIS proposed the performance standards for Campylobacter and Salmonella in an effort to mitigate pathogen presence in poultry carcasses [25]. Currently, prevalence-based data are used to determine process controls. However, little insight is provided. In addition, regulatory baselines and the literature have, for the most part, utilized direct plating to estimate Campylobacter concentrations in poultry products. Currently, limited published literature evaluates the efficacy of various enrichment media in combination with assay performance for detecting Campylobacter in food matrices. Pre- and post-harvest poultry research on Campylobacter and Salmonella have primarily relied on culture-based methods such as ISO 10272 [15,26,27,28]. This study aimed to develop and optimize a more rapid quantification method for Campylobacter (CampyQuant™) in post-chill poultry WBCR using a shortened enrichment-based quantification. The authors adapted a commercialized assay, the BAX® System Real-Time PCR Campylobacter assay, to be utilized as an enrichment-based quantification method.

4.1. Objective 1: Determining Optimal Enrichment Media and Enumeration Range of BAX® System Real-Time PCR Assay

In the present study, two current industry standard media, 2× BFBB and BPW, were compared to determine the detection parameters of the BAX® System Real-Time PCR assay, as well as determine the best-fit media for enrichment-based PCR quantification. The results of objective 1 indicated that the BAX® System could detect Campylobacter in both respective media, but the optimal media was 2× BFBB. These results are in congruence with the ISO 10272-1:2017 method for detecting Campylobacter spp. in food [26], which also recommends using 2× BFBB. It was determined in the current study that WBCR enriched in 2× BFBB had the lowest detection limit for all Campylobacter species in the BAX® System Real-Time PCR assay (C. jejuni: 3.03; C. coli: 2.93; C. lari: 3.13 Log10 CFU/mL). Main effect differences between media 2× BFBB and BPW were observed for all quantification metric parameters analyzed. When the full model was examined, an interaction among Campylobacter species and the media was observed, with 2× BFBB resulting in greater accuracy than BPW in both C. jejuni and C. coli. Similar results were seen in a study by Solis-Soto et al. [29]. Solis-Soto et al. [29] used various enrichment broths, including Preston’s, Bolton’s broth, Blood-Free Enrichment Broth (BFEB), and Modified-BFEB (M-BFEB) to determine the recovery rate of Campylobacter spp. Solis-Soto et al. [29] indicated that Campylobacter could be recovered from all enrichment broths; however, Bolton’s broth resulted in the greatest detection sensitivity by consistently allowing detection as low as 10 C. jejuni cells. Campylobacter cell recovery was followed by BFEB, M-BFEB, and Preston, with the lowest sensitivity of 103 cells [29].
As BPW is a non-selective media, it has sufficient nutrients to allow multiple organisms present to grow. However, it is possible that non-neutralized antimicrobials used throughout processing can appear in the rinsates and subsequently interfere with Campylobacter recovery [21]. Moreover, competition between competing organisms during enrichment will likely inhibit Campylobacter growth. Therefore, the current study suggests that 2× BFBB be used as the optimal medium for Campylobacter detection. Using 2× BFBB as the enrichment broth, the BAX® System Real-Time PCR assay appeared to be highly specific for each primer set for the detection of C. jejuni, C. coli, and C. lari, with 100% specificity for each. Therefore, 2× BFBB was used for the enrichment time of detection and validation studies to remain consistent with industry standards [20].

4.2. Objective 2: Time of Detection of Campylobacter spp. in Enriched Poultry WBCR

Although interventions are in place to reduce Campylobacter and other foodborne pathogens, they are not entirely eliminated. Broiler chickens, a natural reservoir for Campylobacter, typically harbor 105 to 108 in their gastrointestinal tract when harvested for processing [7]. Currently, there are no Campylobacter detection limitations on poultry products in the United States. However, the European Union (EU) allows less than 3.00 Log10 CFU/g of Campylobacter on poultry carcasses [30]. For the development of quantitation parameters, 3.00 Log10 CFU/mL was considered the detection limit of Campylobacter in poultry rinsates in the current study. Therefore, a pre-enrichment step is needed to detect and quantify the pathogen. As a result, further research was performed to determine the appropriate time of enrichment for low-level Campylobacter to grow sufficiently to reach the level of detection in the BAX® System Real-Time PCR. The enrichment times in the current study were based on the growth kinetics of C. jejuni, C. coli, and C. lari pure cultures enriched in 2× BFBB [24]. Therefore, the current research investigated the enrichment time needed during the exponential phase for all three species to exceed the limit of detection in the presence of WBCR indigenous microbiota.
In poultry WBCR inoculated with each Campylobacter spp., the detection limit was 3.90, 4.50, and 3.80 Log10 CFU/mL in the BAX® System Real-Time PCR assay for C. jejuni, C. coli, and C. lari, respectively. The detection limit of the BAX® System Real-Time PCR assay was less effective for poultry WBCR samples than for pure culture (C. jejuni: 3.03; C. coli: 2.93; C. lari: 3.13 Log10 CFU/mL). The higher detection limit of poultry WBCR is likely because foodborne pathogens such as Campylobacter are generally in lower abundance on processed poultry carcass microbiota and thus require propagation for detection. In addition, competitor organisms, loss of template during DNA extraction, and inhibitors present in the rinsate could reduce the detection efficiency [31]. Similar results were seen in a study by Zhang et al. [31]). Using their multiplex PCR for Campylobacter detection, they reported a limit of detection of 4.3 CFU/g in pure culture but 103 CFU/g in cecal contents. Therefore, enrichment was necessary to enumerate low levels of Campylobacter species.
Additionally, the poultry rinsates consisted of a wide range of microorganisms, which could influence Campylobacter growth and biochemical interactions in media, potentially supporting the development of non-Campylobacter colonies. Ricke et al. [15] suggested that different poultry matrices could induce biochemical changes to Campylobacter and actively interfere with the sensitivity and specificity of certain isolation and detection methods. These results further support the difficulties associated with Campylobacter detection using either molecular-based or culture-based methods in complex matrices [15,31].
According to the USDA-FSIS [20] method of isolation, Campylobacter can require up to 48 h of enrichment before it is detectable. In this study, the BAX® System Real-Time PCR assay for Campylobacter yielded 100% detection in all samples after 20 h incubation in poultry rinsates for concentrations of 2.00 Log10 CFU/mL (Table 2). Also, the performance characteristics of the assay improved as time progressed to 20 h, proving 20 h to be the optimal enrichment period to be utilized for the final validation of the BAX® System Real-Time PCR Campylobacter assay.

4.3. Objective 3: Validation and Standard Curve Development of Quantification of BAX® System Real-Time PCR Assay

To validate the use of CampyQuant™ in poultry WBCR, the detected Campylobacter concentrations from the poultry WBCR samples and CT values from the BAX® System Real-Time PCR assay were used to develop standard curves with an enumerable range of 1.00 to 4.00 Log10 CFU/mL. In poultry WBCR, the BAX® System Real-Time PCR assay was 100% specific for the detection of Campylobacter levels of 1.00 to 4.00 Log10 CFU/mL after 20 h enrichment. The Log10 RMSE evaluates the standard deviation of the data and illustrates the utility of the CT values for estimating the respective Campylobacter concentrations. From these results, using CampyQuant™ for C. jejuni, C. coli, and C. lari quantification, there was a variation of approximately 0.64, 1.09, and 0.81 Log10 CFU/mL in rinsate samples quantified between 1.00 and 4.00 Log10 CFU/mL after 20 h enrichment, respectively. While the variability of each standard curve fluctuated, it is likely the variability of the spread plating, which is still considered an acceptable standard, as being potentially subject to phenotypic-based assumptions [32]. However, when evaluated, CampyQuant™ estimates with 95% confidence intervals reached the targeted inoculated levels of each Campylobacter species. As observed, the paired evaluation of the CampyQuant™ and the Campy Cefex plating method on inoculated samples produced comparable estimates, with confidence intervals bracketing the targeted inoculated levels of Campylobacter.
Quantification parameters such as sensitivity, accuracy, prevalence, NLR, and NPV were evaluated between the quantification method (CampyQuant™ vs. Campy Cefex) and the Campylobacter species for main effects and interactions. The results from the study demonstrate that the BAX® System Real-Time PCR assay for Campylobacter detection appears to be precise and accurate compared to the culture enumeration method, Campy Cefex (Table 3 and Table 4). Additionally, CampyQuant™ does lend some advantages for Campylobacter detection and quantification. Some physiological and metabolic biological characteristics of Campylobacter can be altered due to environmental stress, which can cause Campylobacter cells to be viable but nonculturable [33]. In the present study, it is possible that cells could be viable but nonculturable on Campy Cefex plates. This could lead to underestimations of Campylobacter colonies on Campy Cefex plates. However, these VBNC populations can be accounted for using the CampyQuant™ assay.
In addition, the conventional culture method in this study is that selective media is not able to specify differences between different Campylobacter species just by visually examining the colony morphology. The specificity of the assay by the species-specific amplification of DNA was 100%, as all Campylobacter samples were detected as such in the present study. Moreover, the cells on the Campy Cefex plates may not be as specific as the RT-PCR. In a study by Kim et al. [34], they compared sequences from poultry carcass rinsates from Campy Cefex plates. The plate colonies recovered revealed a significant range of non-Campylobacter bacteria, such as Oscillospira, Acinetobacter, Enterococcus, and Bacillus [34]. The recovery of non-Campylobacter bacteria shows the potential for false positives to occur with some culture methods.
Nevertheless, molecular methods for Campylobacter detection and quantification do have some concerns. Traditional DNA-based PCR is able to detect the genomic DNA of dead or nonviable Campylobacter spp. However, the detection of these organisms, which would be expected not to be capable of causing disease, should be considered false-positive samples [15]. However, the growth of viable cells will dominate the nonviable cells during enrichment. In addition, the free genomic DNA from the dead cells is denatured from the DNase enzymatic activity from the enriched Campylobacter cells [35,36]. This process allows for potential dead cells to be excluded from the detection signal of the PCR.
Slopes of species-specific CampyQuant™ curves were explored for significant differences. The ANCOVA test revealed a significant difference among the species of Campylobacter (F-Value of 0.023). Differences were expected because each Campylobacter species possesses unique metabolic requirements [37]. These unique metabolic characteristics of each Campylobacter species would be anticipated to have specific interactions with the poultry WBCR, which can alter the detection in the RT-PCR. For example, Wagley et al. [38] studied the different carbon substrate utilization patterns of Campylobacter species. It was revealed that C. coli and C. jejuni differed in their ability to utilize propionic acid as a carbon source in a culture medium.
Additionally, these differences in metabolism can also result in growth rate differences. In a study by Axelsson-Olsson et al. [39], they compared the growth rates of different Campylobacter species after 48 h. The study revealed that C. jejuni, C. coli, and C. lari exhibited significantly different exponential phases from each other [39]. The metabolic requirement and growth kinetic differences between species can cause the differences observed in the standard curve slopes. Therefore, each Campylobacter species should be quantified with its respective specific CampyQuant™ standard curve.

5. Conclusions

In summary, the BAX® System Real-Time PCR assay detected Campylobacter in all post-chill rinsate samples through an enumerable range of 1.00 to 4.00 Log10 CFU/mL. Based on the results of the current study, 20 h 2× BFBB enriched WBCR samples can be quantified using the CampyQuant™ linear equation for C. jejuni, C. coli, and C. lari. All subsequent linear equations generated in the current study corresponded to the data, with an R2 of 0.934, 0.758, and 0.943, respectively. While C. jejuni and C. lari exhibited a strong association, C. coli was lower, which could lead to more errors in quantitative estimates for this species. However, the speed of the assay represents a sufficient enough advantage to still use this method in practical settings. The Log10 RMSE was also within 1 Log10 CFU/mL at 0.64, 1.09, and 0.81 Log10 RMSE. The linear equations generated to be used in the quantification of C. jejuni Equation (1), C. coli Equation (2), and C. lari Equation (3) are
C .   j e j u n i   L o g 10   C F U / m L = C T 41.64 2.281
C .   c o l i   L o g 10   C F U / m L = C T 39.98 1.896
C .   l a r i   L o g 10   C F U / m L = C T 40.75 3.03
Further validations of this method on enumerating Campylobacter spp. in commercial processing plants among post-chill WBCR containing a complex microbial background are a logical next step. The current study utilized bulk homogenate post-chill WBCR, which may represent potential limitations with different rinsate microbiota compositional profiles that may influence the quantitation parameters. Testing across different processing samples and conditions is likely needed to determine the ultimate utility of the method proposed in the current study. However, the development of linear equations generated in the current study is necessary for the further validation of the BAX® System Real-Time PCR Campylobacter assay. Also, the linear equations generated from this work can only be utilized in WBCR as they were the only matrices validated in the current research. Due to the effect that individual matrices have on the specific growth rate of pathogens, whether this be indigenous microbiota or matrix composition, individual matrices would need to be validated separately to generate unique linear curves to be utilized in this enrichment-based quantification [40].
Ultimately, the linear equations generated from 20 h enrichment of WBCR in 2× BFBB will provide the industry with the necessary tools to easily and more rapidly quantify C. jejuni, C. coli, and C. lari without deviating from current industry or USDA-FSIS testing standards. Additionally, with the ability to differentiate and quantify individual Campylobacter species, further risk assessment studies can be conducted. This could also prove to be particularly useful for further examination of Campylobacter outbreaks occurring in other countries outside the United States [41,42,43]. This method is also aligned with current United States industry standards and can potentially provide the poultry industry with a more rapid and accurate quantitative method for Campylobacter enumeration to ensure that process controls are working adequately to provide safe products to consumers.

Supplementary Materials

The following supporting information can be downloaded at: https://www.mdpi.com/article/10.3390/foods13010056/s1, Table S1. The sensitivity, specificity, efficiency, positive likelihood ratio (PLR), negative likelihood ratio (NLR), prevalence, positive predictive value (PPV), negative predictive value (NPV), accuracy of the detection of Campylobacter species between media, blood-free Bolton broth (2× BFBB), and buffered peptone water (BPW) when using BAX® System Real-Time PCR assay; Table S2. Statistical significance between the sensitivity, accuracy, prevalence, negative likelihood ratio (NLR), negative predictive value (NPV), and specificity between the species in either media, 2× blood-free Bolton broth (2× BFBB) or buffered peptone water (BPW); Table S3. Statistical significance between the sensitivity, accuracy, prevalence, negative likelihood ratio (NLR), negative predictive value (NPV), and specificity between the enrichment media, 2× blood-free Bolton broth (BB), or buffered peptone water (BPW) for Campylobacter jejuni, coli, and lari; Table S4. Plate counts of initial Campylobacter species concentration from growth and dilution in 2× Bolton broth and buffered peptone water on mCCDA; Table S5. Results of sensitivity, specificity positive likelihood ratio (PLR), negative likelihood ratio (NLR), prevalence, positive predictive value (PPV), negative predictive value (NPV), and accuracy of the BAX® System Real-Time PCR assay for the detection of each Campylobacter species between media, enrichment times 16, 18, and 20 h in 2× blood-free Bolton broth (2× BFBB); Table S6. Statistical significance between the sensitivity, accuracy, prevalence, negative likelihood ratio (NLR), negative predictive value (NPV) between the time (16, 18, and 20 h) of Campylobacter jejuni, coli, and lari; Table S7. Statistical significance between the sensitivity, accuracy, prevalence, negative likelihood ratio (NLR), negative predictive value (NPV) between Campylobacter spp., jejuni, coli, and lari, at 16, 18, and 20 h of enrichment; Table S8. Statistical comparison of CampyQuant™ vs. Campy Cefex of each Log concentration (1.00 to 4.00 Log10 CFU/mL) within each species (C. jejuni, coli, and lari); Table S9. Results of quantification metric parameters: sensitivity, specificity, positive likelihood ratio (PLR), negative Likelihood ratio (NLR), prevalence, positive predictive value (PPV), negative predictive Value (NPV), and accuracy of the BAX® System Real-Time PCR assay for the detection of each Campylobacter species; Table S10. Statistical comparison of performance criteria between the species of Campylobacter (C. jejuni, coli, and lari) when using CampyQuant™ or Campy Cefex; Table S11: Statistical comparison of performance criteria between the Campylobacter quantification methods utilized in the current study, CampyQuant™ vs. Campy Cefex, used to detect C. jejuni, coli, and lari.

Author Contributions

All authors were afforded the opportunity to review the current manuscript and agreed to publish the current version of the manuscript. Author specific contributions: conceptualization, S.F.A., T.P.S. and S.C.R.; methodology, A.R.B., D.K.D., S.F.A., T.P.S. and S.C.R.; validation, A.R.B. and D.K.D.; formal analysis, A.R.B. and D.K.D.; investigation, A.R.B. and D.K.D.; resources, S.F.A. and T.P.S.; data curation, A.R.B. and D.K.D.; writing—original draft preparation, A.R.B. and D.K.D.; writing—review and editing, A.R.B., D.K.D., S.F.A., T.P.S. and S.C.R.; visualization, A.R.B. and D.K.D.; supervision, S.C.R.; project administration, D.K.D.; funding acquisition, S.C.R. All authors have read and agreed to the published version of the manuscript.

Funding

This research was funded by Hygiena LLC.

Data Availability Statement

The data presented in this study are available on request from the corresponding author. The data are not publicly available due to the proprietary nature of the research.

Acknowledgments

The authors would like to thank Hygiena for its support, input, and efforts regarding the current research.

Conflicts of Interest

When the research was conducted, S.F. Applegate and T.P. Stephens were employed by Hygiena (2 Boulden Circle, New Castle, DE, USA). Although Hygiena funded the research, all authors except for S.F. Applegate and T.P. Stephens declare that this research was conducted without any commercial relationships that could produce potential conflicts of interest.

Appendix A

The optimal enrichment media and the enumeration range of BAX® System Real-Time Campylobacter PCR assay were determined in the Objective 1 experiment (Figure A1). The experiment compared to industry standard media, 2× BFBB and BPW (media, k = 2), three Campylobacter species, C. jejuni, C. coli, and C. lari, (species, k = 3), three biological replicates (n = 3) with three independent trials (t = 3; N = 54). Created with Biorender.com.
Figure A1. Representative schematic of Objective 1 experimental design and methodology. Created with Biorender.com.
Foods 13 00056 g0a1
Rinsate samples were prepared in Objective 2 to determine the time Campylobacter was detected (Figure A2). The experiment consisted of three time points, 16, 18, and 20 h (i = 3), three treatments (inoculation level, k = 3), three biological replicates, and eight technical replicates (n = 24) with 72 samples per timepoint (N = 216 total samples). The experimental conditions and sample numbers were consistent across Campylobacter species, jejuni, coli, and lari.
Figure A2. Representative schematic of Objective 2 experimental design and methodology. Created with Biorender.com.
Foods 13 00056 g0a2

References

  1. Wagenaar, J.A.; French, N.P.; Havelaar, A.H. Preventing Campylobacter at the Source: Why is it so difficult? Clin. Infect. Dis. 2013, 57, 1600–1606. [Google Scholar] [CrossRef] [PubMed]
  2. Kaakoush, N.O.; Castaño-Rodríguez, N.; Mitchell, H.M.; Man, S.M. Global epidemiology of Campylobacter infection. Clin. Microbiol. Rev. 2015, 3, 687–720. [Google Scholar] [CrossRef] [PubMed]
  3. Fitzgerald, C.  Campylobacter. Clin. Lab. Med. 2015, 35, 289–298. [Google Scholar] [CrossRef] [PubMed]
  4. Hazeleger, W.C.; Janse, J.D.; Koenraad, P.M.; Beumer, R.R.; Rombouts, F.M.; Abee, T. Temperature-dependent membrane fatty acid and cell physiology changes in coccoid forms of Campylobacter jejuni. Appl. Environ. Microbiol. 1995, 61, 2713–2719. [Google Scholar] [CrossRef] [PubMed]
  5. Hazeleger, W.C.; Jacobs-Reitsma, W.F.; Besten, H.M.W.D. Quantification of growth of Campylobacter and extended spectrum β-lactamase producing bacteria sheds light on black box of enrichment procedures. Front. Microbiol. 2016, 7, 1430. [Google Scholar] [CrossRef] [PubMed]
  6. Hill, G.N.; Bratcher, C.L.; Wang, L.; Singh, M.; Tapp, W.N.; McKee, S.R. Optimizing enrichment of Campylobacter on poultry. J. Appl. Poult. Res. 2017, 26, 307–315. [Google Scholar] [CrossRef]
  7. Facciolà, A.; Riso, R.; Avventuroso, E.; Visalli, G.; Delia, S.A.; Laganà, P. Campylobacter: From microbiology to prevention. J. Prev. Med. Hyg. 2017, 58, E79–E92. [Google Scholar]
  8. Mihaljevic, R.R.; Sikic, M.; Klancnik, A.; Brumini, G.; Mozina, S.S.; Abram, M. Environmental stress factors affecting survival and virulence of Campylobacter jejuni. Microb. Pathog. 2007, 43, 120–125. [Google Scholar] [CrossRef]
  9. Di Giannatale, E.; Calistri, P.; Di Donato, G.; Decastelli, L.; Goffredo, E.; Adriano, D.; Mancini, M.E.; Galleggiante, A.; Neri, D.; Antoci, S.; et al. Thermotolerant Campylobacter spp. in chicken and bovine meat in Italy: Prevalence, level of contamination and molecular characterization of isolates. PLoS ONE 2019, 14, e0225957. [Google Scholar] [CrossRef]
  10. Geissler, A.L.; Carrillo, F.B.; Swanson, K.; E Patrick, M.; E Fullerton, K.; Bennett, C.; Barrett, K.; E Mahon, B. Increasing Campylobacter infections, outbreaks, and antimicrobial resistance in the United States, 2004–2012. Clin. Infect. Dis. 2017, 65, 1624–1631. [Google Scholar] [CrossRef]
  11. Brena, M.C.; Mekonnen, Y.; Bettridge, J.M.; Williams, N.J.; Wigley, P.; Tessema, T.S.; Christley, R.M. Changing risk of environmental Campylobacter exposure with emerging poultry production systems in Ethiopia. Epidemiol. Infect. 2016, 144, 567–575. [Google Scholar] [CrossRef]
  12. Vizzini, P.; Braidot, M.; Vidic, J.; Manzano, M. Electrochemical and optical biosensors for the detection of Campylobacter and listeria: An update look. Micromachines 2019, 10, 500. [Google Scholar] [CrossRef] [PubMed]
  13. Tholozan, J.L.; Cappelier, J.M.; Tissier, J.P.; Delattre, G.; Federighi, M. Physiological characterization of viable-but-nonculturable Campylobacter jejuni cells. Appl. Environ. Microbiol. 1999, 65, 1110–1116. [Google Scholar] [CrossRef] [PubMed]
  14. Papić, B.; Pate, M.; Henigman, U.; Zajc, U.; Gruntar, I.; Biasizzo, M.; Ocepek, M.; Kušar, D. New approaches on quantification of Campylobacter jejuni in poultry samples: The use of digital PCR and real-time PCR against the ISO standard plate count method. Front. Microbiol. 2017, 8, 331. [Google Scholar] [CrossRef] [PubMed]
  15. Ricke, S.C.; Feye, K.M.; Chaney, W.E.; Shi, Z.; Pavlidis, H.; Yang, Y. Developments in rapid detection methods for foodborne Campylobacter in the United States. Front. Microbiol. 2019, 9, 3280. [Google Scholar] [CrossRef] [PubMed]
  16. Zhang, W.; Hughes, A.; Wilt, G.; Knabel, S.J. The BAX PCR Assay for screening Listeria monocytogenes targets a partial putative gene lmo 2234. J. Food Prot. 2004, 6, 1507–1511. [Google Scholar] [CrossRef] [PubMed]
  17. Hygiena. 2022. Available online: https://www.hygiena.com/patents/ (accessed on 30 October 2023).
  18. Silbernagel, K.; Jechorek, R.; Carver, C.; Barbour, W.M.; Mrozinski, P.; Albert, A.; Andaloro, B.; Anderson, G.; Beacorn, F.; Brooks, R.; et al. Evaluation of the BAX® system for detection of Salmonella in selected foods: Collaborative study. J. AOAC Int. 2003, 86, 1149–1159. [Google Scholar] [CrossRef] [PubMed]
  19. United States Department of Agriculture – Food Safety and Inspection Service. MLG 4.14. Isolation and Identification of Salmo-nella from Meat, Poultry, Pasteurized Egg, and Siluriformes (Fish) Products and Carcass and Environmental Sponges. 2023. Available online: https://www.fsis.usda.gov/sites/default/files/media_file/documents/MLG-4.14.pdf (accessed on 30 October 2023).
  20. United States Department of Agriculture—Food Safety and Inspection Service. MLG 41.05 Isolation and Identification of Campylobacter jejuni/coli/lari from Poultry Rinse, Sponge and Raw Product Samples. 2021. Available online: https://www.fsis.usda.gov/sites/default/files/media_file/2021-06/MLG-41.pdf (accessed on 30 October 2023).
  21. Wages, J.A.; Dittoe, D.K.; Feye, K.M.; Ricke, S.C. Consequences of implementing neutralizing buffered peptone water in commercial poultry processing on the microbiota of whole bird carcass rinses and the subsequent microbiological analyses. Front. Microbiol. 2022, 13, 813461. [Google Scholar] [CrossRef]
  22. United States Department of Agriculture – Food Safety and Inspection Service MLG 4.13 Isolation and Identification of Campylobacter jejuni/coli/lari from Poultry Rinse, Sponge and Raw Product Samples. 2023. Available online: https://www.fsis.usda.gov/sites/default/files/media_file/documents/MLG-4.13.pdf (accessed on 30 October 2023).
  23. Hygiena. 2021. Available online: https://cms.hygiena.com/sites/default/files/media/BAX-System-Q7-Users-Guide.pdf (accessed on 30 October 2023).
  24. Bodie, A.R.; Rothrock, M.J., Jr.; Ricke, S.C. Comparison of optical density-based growth kinetics for pure culture Campylobacter jejuni, coli and lari grown in blood-free Bolton broth. J. Environ. Sci. Health Part B 2023, 58, 671–678. [Google Scholar] [CrossRef]
  25. United States Department of Agriculture Food Safety and Inspection Service. 2016 FRN Docket No. FSIS-2014-0023. Available online: https://www.federalregister.gov/documents/2016/02/11/2016-02586/new-performance-standards-for-salmonella-and-campylobacter-in-not-ready-to-eat-comminuted-chicken (accessed on 30 October 2023).
  26. ISO/TS 10272-1:2017; Microbiology of Food and Animal Feed- Horizontal Method for the Detection and Enumeration of Campylobacter spp.—Part 1: Detection of Salmonella spp. International Organization for Standardization: Geneva, Switzerland, 2017.
  27. Chaney, W.E.; Englishbey, A.K.; Stephens, T.P.; Applegate, S.F.; Sanchez-Plata, M.X. Application of a commercial Salmonella real-time polymerase chain reaction (PCR) assay for the detection and quantitation of Salmonella enterica in poultry ceca. J. Food Prot. 2021, 85, 527–533. [Google Scholar] [CrossRef]
  28. O’Bryan, C.A.; Ricke, S.C.; Marcy, J.A. Public health impact of Salmonella spp. on raw poultry: Current concepts and future prospects in the United States. Food Control. 2022, 132, 108539. [Google Scholar] [CrossRef]
  29. Solís-Soto, L.Y.; García, S.; Wesley, I.; Heredia, N. A charcoal- and blood-free enrichment broth for isolation and PCR detection of Campylobacter jejuni and Campylobacter coli in chicken. J. Food Prot. 2011, 74, 221–227. [Google Scholar] [CrossRef] [PubMed]
  30. Emanowicz, M.; Meade, J.; Bolton, D.; Golden, O.; Gutierrez, M.; Byrne, W.; Egan, J.; Lynch, H.; O’Connor, L.; Coffey, A.; et al. The impact of key processing stages and flock variables on the prevalence and levels of Campylobacter on broiler carcasses. Food Microbiol. 2021, 95, 103688. [Google Scholar] [CrossRef] [PubMed]
  31. Zhang, M.-J.; Qiao, B.; Xu, X.B.; Zhang, J.Z. Development and application of a real-time polymerase chain reaction method for Campylobacter jejuni detection. World J. Gastroenterol. 2013, 1, 3090–3095. [Google Scholar] [CrossRef]
  32. Keegstra, J.M.; Kamino, K.; Anquez, F.; Lazova, M.D.; Emonet, T.; Shimizu, T.S. Phenotypic diversity and temporal variability in a bacterial signaling network revealed by single cell FRET. eLife 2017, 6, e27455. [Google Scholar] [CrossRef] [PubMed]
  33. Kim, S.-H.; Chelliah, R.; Ramakrishnan, S.R.; Perumal, A.S.; Bang, W.-S.; Rubab, M.; Daliri, E.B.-M.; Barathikannan, K.; Elahi, F.; Park, E.; et al. Review on stress tolerance in Campylobacter jejuni. Front. Cell. Infect. Microbiol. 2021, 10, 596570. [Google Scholar] [CrossRef] [PubMed]
  34. Kim, S.A.; Park, S.H.; Lee, S.I.; Owens, C.M.; Ricke, S.C. Assessment of chicken carcass microbiome responses during processing in the presence of commercial antimicrobials using a next generation sequencing approach. Sci. Rep. 2017, 7, srep43354. [Google Scholar] [CrossRef] [PubMed]
  35. Jung, G.H.; Lim, E.S.; Woo, M.-A.; Lee, J.Y.; Kim, J.-S.; Paik, H.-D. Inverse correlation between extracellular DNase activity and biofilm formation among chicken-derived Campylobacter strains. J. Microbiol. Biotechnol. 2017, 27, 1942–1951. [Google Scholar] [CrossRef]
  36. He, Z.; Gharaibeh, R.Z.; Newsome, R.C.; Pope, J.L.; Dougherty, M.W.; Tomkovich, S.; Pons, B.; Mirey, G.; Vignard, J.; Hendrixson, D.R.; et al. Campylobacter jejuni promotes colorectal tumorigenesis through the action of cytolethal distending toxin. Gut 2019, 68, 289–300. [Google Scholar] [CrossRef]
  37. Yeow, M.; Liu, F.; Ma, R.; Williams, T.J.; Riordan, S.M.; Zhang, L. Analyses of energy metabolism and stress defense provide insights into Campylobacter concisus growth and pathogenicity. Gut Pathog. 2020, 12, 13. [Google Scholar] [CrossRef]
  38. Wagley, S.; Newcombe, J.; Laing, E.; Yusuf, E.; Sambles, C.M.; Studholme, D.J.; La Ragione, R.M.; Titball, R.W.; Champion, O.L. Differences in carbon source utilization distinguish Campylobacter jejuni from Campylobacter coli. BMC Microbiol. 2014, 14, 262. [Google Scholar] [CrossRef] [PubMed]
  39. Axelsson-Olsson, D.; Ellström, P.; Waldenström, J.; Haemig, P.D.; Brudin, L.; Olsen, B. AcanthamoebaCampylobacter coculture as a novel method for enrichment of Campylobacter species. Appl. Environ. Microbiol. 2007, 73, 6864–6869. [Google Scholar] [CrossRef] [PubMed]
  40. Battersby, T.; Walsh, D.; Whyte, P.; Bolton, D.J. Campylobacter growth rates in four different matrices: Broiler caecal material, live birds, Bolton broth, and brain heart infusion broth. Infect. Ecol. Epidemiol. 2016, 6, 31217. [Google Scholar] [CrossRef] [PubMed]
  41. Ghssein, G.; Awada, R.; Salami, A.; Bahmad, H.F.; Awad, A.; Joumaa, W.H.; El Roz, A. Prevalence, laboratory findings and clinical characteristics of campylobacteriosis agents among hospitalized children with acute gastroenteritis in Lebanon. Pediatr. Gastroenterol. Hepatol. Nutr. 2021, 24, 346–356. [Google Scholar] [CrossRef]
  42. Ibrahim, J.N.; Eghnatios, E.; El Roz, A.; Fardoun, T.; Ghssein, G. Prevalence, antimicrobial resistance and risk factors for Campylobacteriosis in Lebanon. J. Infect. Dev. Ctries. 2019, 13, 11–20. [Google Scholar] [CrossRef]
  43. Paintsil, E.K.; Ofori, L.A.; Adobea, S.; Akenten, C.W.; Phillips, R.O.; Maiga-Ascofare, O.; Lamshöft, M.; May, J.; Danso, K.O.; Krumkamp, R.; et al. Prevalence and antibiotic resistance in Campylobacter spp. isolated from humans and food-producing animals in West Africa: A systematic review and meta-analysis. Pathogens 2022, 11, 140. [Google Scholar] [CrossRef]
Figure 1. The linear response of the cycle threshold (CT) to the inoculation of Campylobacter jejuni (a), coli (b), and lari (c) in either 2× blood-free Bolton’s broth (2× BFBB) or Buffered Peptone Water (BPW). The CT values were obtained using the BAX® System Real-Time PCR assay. There was a difference between the detection in 2× BFBB and BPW of all three Campylobacter species (Mann–Whitney U: p < 0.05), as well as a difference between the slopes generated from 2× BFBB and BPW (ANCOVA: F < 0.01).
Foods 13 00056 g001
Figure 2. Development of standard curves of Campylobacter jejuni (a), coli (b), and lari (c) to be used for enrichment-based quantification of these three Campylobacter species with enumerable ranges from 1.00 to 4.00 Log10 CFU/mL. The CT values were obtained using the BAX® System Real-Time PCR assay. There was a difference between the slopes generated from the three species (ANCOVA: F < 0.01).
Foods 13 00056 g002
Table 1. Main effect and interaction of the enrichment media and Campylobacter species between the sensitivity, accuracy, prevalence, negative likelihood ratio (NLR), negative predictive value (NPV), and specificity of CampyQuant™ BAX® System Real-Time PCR assay 1,2.
C. jejuniC. coliC. lariEffects 3
Media2× BFBBBPW2× BFBBBPW2× BFBBBPWInteraction 4MediaSpecies
Sensitivity (%)93.376.096.364.088.080.00.102<0.00010.277
Accuracy (%)93.8 a81.9 bc96.3 a79.0 c89.8 ab84.0 bc0.024<0.00010.855
Prevalence (%)90.073.187.261.584.674.90.2730.00220.366
NLR (%)6.724.04.036.012.020.00.0630.0030.57
NPV (%)38.914.555.611.227.916.70.3120.0090.578
1 Specificity, PLR, and PPV were 100% for all variables; therefore, statistical analyses were not performed. 2 Efficiency is excluded from analyses as it is a metric calculated over the duration of the experiment. 3 Significance was determined using the nonparametric Mann–Whitney U test (p ≤ 0.05). 4 Different letters denote significant pairwise differences (a–c) of means during the interaction of enrichment media and Campylobacter species using χ2 analysis (p ≤ 0.05).
Table 2. Main effect and interaction of the time and Campylobacter species on the sensitivity, accuracy, prevalence, negative likelihood ratio (NLR), and negative predictive value (NPV) of CampyQuant™ BAX® System Real-Time PCR assay 1,2.
C. jejuniC. coliC. lariEffects
Time16 h18 h20 h16 h18 h20 h16 h18 h20 hInteractionTimeSpecies
Sensitivity66.7 cd86.1 ab94.4 a14.6 e25.7 e63.9 cd13.9 e53.0 d72.2 bc0.0040<0.0001<0.0001
Accuracy42.7 bc71.4 a78.1 a3.0 d8.6 d39.2 bc1.2 d27.3 c50.4 b0.0100<0.0001<0.0001
Prevalence64.082.790.717.333.361.321.349.369.30.1610<0.0001<0.0001
NLR33.3 bc13.9 de5.6 e85.1 a74.3 a36.1 bc86.1 a47.0 b27.7 cd0.0004<0.0001<0.0001
NPV10.7 bc17.0 b44.4 a6.8 bc6.0 bc10.4 bc5.1 c6.8 bc12.6 bc<0.0001<0.0001<0.0001
1 Significance was determined using the nonparametric Mann–Whitney U test. 2 Different letters denote pairwise differences (a–e).
Table 3. Log10 CFU/mL estimates from Campy Cefex and CampyQuant™ for each species. Main effect and interactions of the quantification method (CampyQuant™ vs. Campy Cefex) and Campylobacter species on each specific Log10 CFU/mL estimates (1.00 to 4.00 CFU/mL). An ANCOVA test was used to investigate a significantly different linear slope between the species of Campylobacter (F-Value = 0.023).
C. jejuniC. coliC. lariEffects 1
Log10 CFU/mLCampyQuant™Campy-CefexCampyQuant™Campy-CefexCampyQuant™Campy-CefexInteraction 2MethodSpecies
1.001.18 b ± 0.161.64 a ± 0.161.22 ab ± 0.101.260 ab ± 0.121.18 b ± 0.160.70 c ± 0.100.0020.9130.001
2.001.89 bc ± 0.052.18 a ± 0.052.09 ab ± 0.061.74 c ± 0.051.88 bc ± 0.051.50 d ± 0.05<0.001<0.0010.002
3.002.93 ab ± 0.043.05 ab ± 0.102.74 b ± 0.093.23 a ± 0.092.92 b ± 0.092.68 b ± 0.090.0010.1000.639
4.004.08 ab ± 0.084.03 ab ± 0.053.91 b ± 0.074.13 a ± 0.054.09 ab ± 0.073.55 c ± 0.05<0.0010.005<0.001
1 Significance was determined using the nonparametric Mann–Whitney U test (p ≤ 0.05). 2 Means with different connecting letters (a–d) were significantly different in the interaction of method and Campylobacter species.
Table 4. Main effect and interaction of the quantification method (CampyQuant™ vs. Campy Cefex) and Campylobacter species on the sensitivity, accuracy, prevalence, negative likelihood ratio (NLR), and negative predictive value (NPV).
C. jejuniC. coliC. lariEffects 1
MethodCampyQuant™Campy-CefexCampyQuant™Campy-CefexCampyQuant™Campy-CefexInteractionMethodSpecies
Sensitivity (%)88.394.583.380.586.783.30.4111.0000.079
Accuracy (%)74.782.566.560.071.764.50.4150.70460.074
Prevalence (%)84.187.279.474.382.576.90.4330.4050.083
NLR (%)11.75.516.719.515.016.60.4750.8630.073
NPV (%)34.430.520.615.926.127.80.7330.5270.020
1 Significance was determined using the nonparametric Mann–Whitney U test (p ≤ 0.05).
Disclaimer/Publisher’s Note: The statements, opinions and data contained in all publications are solely those of the individual author(s) and contributor(s) and not of MDPI and/or the editor(s). MDPI and/or the editor(s) disclaim responsibility for any injury to people or property resulting from any ideas, methods, instructions or products referred to in the content.

