Abstract
Seaweeds are a sustainable source of protein and lipids that may be used to replace fish by-products in aquaculture feed. This study aimed at using the macroalgae Pelvetia canaliculata as an ingredient in gilthead seabream (Sparus aurata) feed, either as freeze-dried powder or as algae residue (waste) that was obtained after the supplementation of sunflower oil. The formulated diets and the fish muscle were analyzed concerning the proximate composition and the fatty acid profile. The health lipid indices hypocholesterolemic/hypercholesterolemic (h/H), atherogenic (AI), thrombogenic (TI), as well as n-3/n-6 and polyunsaturated fatty acid/saturated fatty acid (PUFA/SFA) ratios were calculated. Additionally, the peroxidizability index (PI) was determined. No differences were observed in the proximate composition of fish muscle regardless of the diet used. Fish fed a diet supplemented with 10% of algae waste (W10) stand out for the highest content in oleic acid (C18:1 n-9), and the lowest in both linoleic (C18:2 n-6) and palmitic (C16:0) fatty acids. All fish samples showed values of health lipid indices within the limits recommend for a nutritional balanced diet. These results highlight that fish fed diets supplemented with P. canaliculata are sources of healthy lipids that might be consumed on a regular basis to prevent cardiovascular diseases.
1. Introduction
Food production, namely of animal origin, has been following the increase in world population. Therefore, the search for available, less expensive, and more sustainable food sources, following a circular economy concept, has been a major concern for the scientific community [1,2,3].
The sustainability of the aquaculture sector requires the implementation of cost-effective strategies to increase production without compromising the nutritional quality of farmed fish, which is highly dependent on diet composition [4,5,6]. A viable approach is to reduce feed costs, which may represent up to 50% of the production budget in an intensive regime, by using less expensive ingredients in diet formulations. In this sense, seaweeds stand out as a promising and sustainable source of nutrients to supplement aquaculture feeds [7,8,9].
Seaweeds are photosynthetic organisms that do not compete for arable land, do not require fresh water, and contribute to reducing the atmospheric CO2 through photosynthesis [10]. Their nutritional composition is highly dependent on species characteristics and environmental conditions [11]. Nevertheless, even though the nutritional properties of these organisms have not been studied as much as those of vascular plants, it is well stated that their chemical composition may have high contents of vitamins, minerals, and non-starch polysaccharides, moderate amounts of protein (10 to 30 g/100 g DW), and low lipid contents (0.3 to 7.2 g/100 g DW). The lipid fraction is usually rich in mono- and polyunsaturated fatty acids (PUFA), such as eicosapentaenoic acid (EPA) and docosahexaenoic acid (DHA) [11]. Seaweeds are also known to be a reliable source of bioactive compounds with interesting properties, such as antioxidant, antimicrobial, antiviral, anti-inflammatory, and antitumoral [12,13]. Among them, species that inhabit the intertidal zone are worth of attention for the synthesis of compounds with bioactive properties that may grant them protection against environmental variations, namely the alternation of emersion/immersion phases and day/night cycles. Brown seaweeds, mainly belonging to the order Fucales, such as Pelvetia canaliculata, may accumulate high amounts of secondary metabolites, namely carotenoids and phenolic compounds that have a protect effect against exposure to UV radiation [14].
Several studies have shown the benefits of using macroalgae as ingredients for aquaculture feed on the growth, stress resistance, immune system, and nutritional quality of fish [15,16,17]. However, depending on the species, high concentrations of seaweeds in diets may have toxic effects on farmed fish [11,18,19,20].
Sparus aurata is one of the most relevant aquaculture species in the Mediterranean and European Union. The large-scale production of this species started in the 1980s and has shown robust growth in recent years [21]. Several studies have reported the effects of using macroalgae (such as Laminaria [7], Gracilaria [19,20,22], Ulva [16,20,22], and Pterocladia [23]) in Sparus aurata feed.
This study proposes a different approach for macroalgae use in Sparus aurata aquaculture feed. A previous work, carried out by our research group, reported the use of the seaweed Pelvetia canaliculata in sunflower oil supplementation aiming to increase its oxidative stability [24]. This procedure led to the production of algal residue that still has interesting nutritional value. In this sense, the present study proposes a strategy to valorize this biomass. Farmed Sparus aurata juveniles were fed with diets supplemented with P. canaliculata, either as freeze-dried powder or as waste, i.e., residue left after sunflower oil enrichment. The diets and fish muscle were characterized based on their proximate compositions and fatty acid profiles to sustain the viability of this approach for aquaculture application.
2. Materials and Methods
2.1. Ethics Statement
The current study was carried out according to the guidelines on the protection of animals used for scientific purposes from the European Directive 2010/63/EU and under the project authorization 0421/000/000/2019.
2.2. Chemicals and Biological Materials
The brown macroalga Pelvetia canaliculata L. was harvested at the beach of Pedras do Corgo, Portugal (41°14′55.52″ N, 8°43′29.89″ W), in April 2021. Gilthead seabream (Sparus aurata) juveniles were acquired from EPPO—Aquaculture Research Station (Portuguese Institute for Sea and Atmosphere). Kjeldahl catalyst tablets were purchased from VWR (Radnor, Pennsylvania, EUA), analytical standards Supelco 37 Component FAME Mix, C17 FAME; PUFA 1 and PUFA 3 were acquired from Sigma-Aldrich (St. Louis, MO, USA). The remaining reagents were of analytical grade and obtained from various sources.
2.3. Experimental Design and Diets Formulation
P. canaliculata was cleaned from extraneous matter, frozen at −80 °C, freeze-dried (Telstar, Lyoquest-85, Telstar Portugal, Lisbon, Portugal), ground to powder, and stored at room temperature, protected from light, until use. The alga was incorporated in diet formulations either as powder or as waste that was obtained after sunflower oil supplementation, as described by Sousa et al. [24]. Briefly, 12.5% (m/v) of freeze-dried P. canaliculata was added to sunflower oil and submitted to ultrasound-assisted extraction for 20 min. After, the mixture was filtered, and the solid residue (remaining algal biomass) was used as an ingredient for aquaculture feeds. A specialized company (SPAROS, Olhão, Portugal) formulated six isoproteic and isolipidic diets, using soybean oil in different proportions to adjust the fat content in the feeds. P. canaliculata was used either as freeze-dried powder, in concentrations of 1% (Pc1), 5% (Pc5), and 10% (Pc10), or as waste, in concentrations of 1% (W1) and 10% (W10). Additionally, a control diet (CT) without P. canaliculata was prepared. The description of all ingredients used in diet formulations was previously reported by Pires et al. [25]. Aiming at showing the overall work process in an integrative perspective, the experimental design is presented in Figure 1.
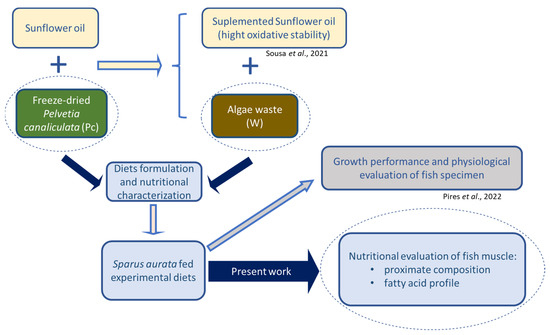
Figure 1.
Integrative perspective of the work developed in the present study [24,25].
2.4. Rearing Conditions
The entire trial lasted for 44 days and was carried out at the Aquaculture Laboratory of MARE—Polytechnic of Leiria (Peniche, Portugal), as described by Pires et al. [25]. After two weeks of quarantine, the juveniles of gilthead seabream (Sparus aurata) were individually weighed (15.41 ± 3.69 g) and randomly distributed through eighteen 60 L aquaria, reaching a stock density of 5.14 ± 0.26 kg m−3, with 20 individuals per aquarium. The experimental setup was acclimated for one week prior to the start of the assay. The aquaria were divided into 6 closed water recirculation systems (RAS), 3 for each diet. During the entire trial, the mortality, water temperature (20.49 ± 1.07 °C), salinity (32.79 ± 0.35), pH (8.07 ± 0.19), and dissolved oxygen (91.87 ± 3.36%) were recorded daily. Fish were hand-fed, ad libitum, three times a day. They were fasted 24 h before sampling and then sacrificed. The nutritional analyses were obtained from two pool samples from each aquarium corresponding to fish fillets from three individuals (n = 6).
2.5. Proximate Composition
Experimental diets were ground to powder and stored at room temperature, protected from light and moisture, until use. Fish muscle samples were weighed, frozen at −80 °C, freeze-dried, ground to powder, and stored at the same conditions as experimental diets.
2.5.1. Moisture Content
Experimental diets were analyzed for moisture content according to AOAC (930.15, 2016) [26], with slight modifications. The samples (1 g) were weighed into a porcelain crucible, previously dried (5 h at 200 °C), and heated at 105 °C in a ventilated oven (Binder, Tuttlingen, Germany), until constant weight was obtained. Fish muscle moisture was determined gravimetrically, by calculating the water loss after freeze-drying. Results were represented as percentage of fresh weight (% FW).
2.5.2. Ash Content
Ash content of either diets or fish samples was determined according to AOAC (942.05, 2016) [26]. Each sample (1 g) was weighed into a porcelain crucible, previously dried (5 h at 200 °C), and incinerated in a muffle (Nabertherm, Liliemthal/Bermen, Germany) at 500 °C for 12 h. Results were expressed as % FW.
2.5.3. Protein Content
The protein contents of the experimental diets and of fish muscle were estimated by the Kjedahl method, following AOAC (940.25, 2016) [26], using a conversion factor of 6.25. Briefly, the samples (250 mg or 150 mg of diets and muscle, respectively) were digested (Digestor 2006; Foss, Denmark) with a catalyst tablet and 25 mL of H2SO4 (97%) at 220 °C for 30 min and 400 °C for 90 min. Deionized water (70 mL) was added to cold digested samples that were distillated (Kjeltec 2100, Foss, Denmark) with 100 mL of NaOH (40% m/v). The distillate was collected in 30 mL of H3BO3 (4% m/v) with methyl red and bromocresol green as pH indicators for further titration with standardized HCl 0.1 M. Blank assay was prepared at the same conditions as samples. The results were calculated according to Equation (1) and expressed as % FW:
where [HCl]—chloride acid concentration (M); Vs and VB—volume of HCl spent for samples and blank titration, respectively (mL); m—sample mass (mg).
2.5.4. Total Lipid Content
Total lipid content was determined according to Folch et al. [27], with some modifications as described by Neves et al. [28]. Diets (1 g) or fish muscle (0.75 g) were mixed with 1 mL of deionized water and 10 mL of Folch reagent, under vortex stirring for 5 min. After the addition of 1.2 mL of NaCl (0.8%), the mixtures were vortexed for a further 2 min and then centrifuged (5 min at 6000 rpm) for phase separation. The lower phase was collected to a round-bottom flask after filtration through an anhydrous sodium sulphate column. The same extraction procedure was repeated with 5 mL of chloroform. Finally, the organic phase was evaporated in a rotary evaporator (Heidolph 2, LAB1ST, Shanghai China) and the lipid residue was dried at 60 °C until constant weight. The lipid content was expressed as % FW.
2.6. Fatty Acid Profile
The fatty acid (FA) profiles of freeze-dried Pelvetia canaliculta, diets, and fish muscle were determined according to Fernández et al. [29]. Samples (50 mg) were mixed with 2 mL of methanolic sulfuric acid (H2SO4) solution 2% (v/v) and heated at 80 °C for 2 h. After cooling, the obtained fatty acid methyl esters (FAME) were extracted with n-hexane (2 mL) and analyzed by gas chromatography (GC) following the conditions described by Neves et al. [28]. Fatty acids were identified by comparison of their retention times with those of Supelco 37, PUFA 1, and PUFA 3 standard mixtures. The results were expressed as percentage of total fatty acids (% total FA).
2.7. Health Lipid Indices Calculation
Hypocholesterolemic/hypercholesterolemic (h/H), atherogenic (AI), thrombogenic (TI), and peroxidizability (PI) indices were calculated based on the fatty acid profile of Sparus aurata muscle, according to the following Equations (2)–(5) [30]:
2.8. Statistical Analyses
Statistical analyses were performed with the SPSS software (v27, IBM, Armonk, New York, NY, USA) and significance level set at p ≤ 0.05. The data were analyzed by analysis of variance (one-way ANOVA) followed by Tukey’s post hoc test. The assumptions of ANOVA were verified through the Kolmogorov–Smirnov normality test and Levenne homogeneity. If the assumptions were not observed, Games–Howell nonparametric test was applied. All the presented values correspond to mean ± standard deviation of three independent samples.
A principal component analysis (PCA) was performed using CANOCO 4.5 software to identify the main variation in the fatty acid profile of muscle of gilthead seabream fed with the different diets. PCA was applied to the log-transformed data set of all analyses.
3. Results and Discussion
The experimental diets supplemented with P. canaliculata, either as powder or as waste, were characterized based on their proximate compositions and fatty acid (FA) profiles. The influence of these diets on the nutritional value of gilthead seabream fillets were evaluated.
3.1. Nutritional Characterization of Algal Biomass
In a previous study carried out by our research group, the proximate composition of algal biomass was studied, regarding both the freeze-dried Pelvetia canaliculata and the waste left after sunflower oil supplementation [25]. Freeze-dried powder was mainly composed of carbohydrates (ca. 76%), ash (about 21%), and lower amounts of protein (ca. 8%) and lipids (ca. 5%). The waste had 45% carbohydrates, 35% lipids, 15% ash, and 5% protein. The higher lipid content in waste results from oil adsorption in the biomass recovered from sunflower oil. Aiming at reaching a complete nutritional characterization of P. canaliculata, its fatty acid profile was analyzed in this study (Table 1). Polyunsaturated fatty acids (PUFA) were the major class, mainly comprising n-6 FA (C20:4 and C18:2), followed by monounsaturated fatty acids (MUFA), mostly C18:1 n-9 and C16:1 n-7, and saturated fatty acids (SFA), C16:0, C14:0, and C18:0. α-Linolenic acid (ALA) and Eicosapentaenoic acid (EPA) were the most abundant n-3 PUFA, accounting for 10% of total FA. These values are in agreement with those reported by Schmid et al. [31] and Maehre et al. [32].

Table 1.
Fatty acid profile (% total fatty acid) of Pelvetia canaliculata.
3.2. Nutritional Characterization of Experimental Diets
The proximate composition of experimental diets was described by Pires et al. [25] and is summarized in Figure 2. Protein stands out as the major nutrient (ca. 48%), followed by carbohydrates (ranging from 17.85 ± 0.30 to 22.1 ± 2.3%), lipids (ca. 17%), moisture (6.12 ± 0.05 to 9.08 ± 0.11%), and ash (6.33 ± 0.07 to 8.22 ± 0.04%). No statistically significant differences in the protein and lipid contents were observed, which confirms the initial request for isolipidic and isoproteic diets. Algal biomass increased the ash content in all supplemented diets in comparison with the control, reflecting seaweed’s richness in minerals, namely Mn, I, Na, K, or Zn [33]. Concerning carbohydrate content, the W1 and Pc10 diets had the highest and the lowest values, respectively. However, none of the supplemented diets showed statistically significant differences in comparison with the control.
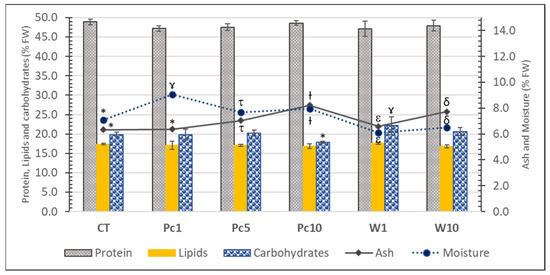
Figure 2.
Proximate composition (% FW) of the experimental diets: CT—control diet; Pc1—diet supplemented with 1% freeze-dried P. canaliculata; Pc5—diet supplemented with 5% freeze-dried P. canaliculata; Pc10—diet supplemented with 10% freeze-dried P. canaliculata; W1—diet supplemented with 1% P. canaliculata waste; W10—diet supplemented with 10% P. canaliculata waste. For each parameter, a distinct symbol (asterisc and gamma symbols) means significative differences (p < 0.05) between samples.
The FA profile of the experimental diets is shown in Table 2. The most abundant FAs in all diets were linoleic (C18:2 n-6), oleic (C18:1 n-9), and palmitic (C16:0). These FAs are also the most abundant in the solid residue (remaining algal biomass) left after sunflower oil supplementation, previously named as waste, and in the soybean oil, used as a fat source in feed formulation [34,35]. The highest content in MUFA (mainly C18:1 n-9) and the lowest content in PUFA (mainly C18:2 n-6) was observed in the W10 diet. These might be due to different proportions of soybean oil/sunflower oil in the experimental diets. In fact, the W10 diet contains only 2.6% of soybean oil, rather below the amounts added to the remaining diets (5.6 to 6.0%) [25]. Additionally, the W10 formulation stands out for the lowest SFA content, especially due to the lower amount of C16:0. The W10 diet also has the highest ratio n-3/n-6, which may be an advantage from a nutritional point of view. Concerning the content of essential FAs, it was observed that the addition of algae waste (W1 and W10) led to a decrease in ALA (C18:3 n-3) in comparison with the remaining diets. Conversely, the amount of docosahexaenoic acid (DHA, C22:6 n-3) and EPA (C20:5 n-3) was always lower in diets containing algal biomass in comparison with the control.
Table 2.
Fatty acid profile (% total fatty acids) of the formulated diets: CT, Pc1, Pc5, Pc10, W1, and W10.
3.3. Nutritional Composition and Fatty Acid Profile of S. aurata Muscle
During the 44-day trial, fish fed different diets showed a similar performance concerning mortality, growth rate, feed uptake, and somatic indices, as reported by Pires et al. [25]. Taking into consideration that the S aurata produced in aquaculture is for human consumption, it is of huge importance to compare its nutritional profile to assess the viability of using the algal biomass in diets. Therefore, the proximate compositions and fatty acid profiles of fish fed experimental diets were analyzed. The proximate compositions of fish muscle (fillets) are shown in Figure 3. No relevant differences were observed in the nutritional composition of fish samples, regardless of the diet tested. As expected, fillets are mainly composed of water (ranging from 70.7 ± 1.1 to 73.5 ± 0.3%), followed by protein (18.4 ± 0.7 to 19.9 ± 0.5%), lipids (7.3 ± 1.1 to 7.9 ± 1.6%), and lower amounts of ash (1.51 ± 0.02 to 1.55 ± 0.03%). These results are in agreement with those attained by Martínez-Llorens et al. [36], that reported no differences in the proximate composition of fish muscle when fish oil was replaced by soybean oil in gilthead seabream fingerling diets. The study carried out by Mechlaoui et al. [37] also showed that diets with selenium, either in organic or inorganic forms, had no influence on the nutritional profile of gilthead seabream muscle. Similar values of protein (ca. 19%) and ash (ca. 1.5%) were obtained in comparison with the present study. However, lower lipid contents (ca. 4–5%) and higher moisture (ca. 73–77%) were reported.
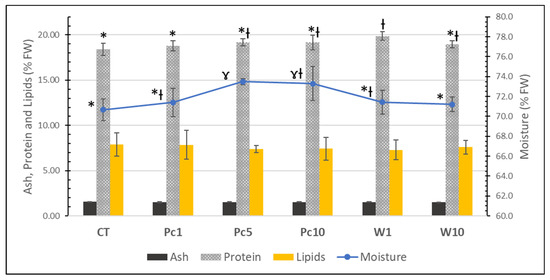
Figure 3.
Proximate compositions of the muscle of S. aurata fed with the formulated diets: CT, Pc1, Pc5, Pc10, W1, and W10. For each parameter, a distinct symbol (asterisc and gamma symbols) means significative differences (p < 0.05) between samples.
Concerning the FA profile of S. aurata (Table 3), the muscle of fish fed W10 stands out for the highest content of C18:1 n-9 and the lowest of both C18:2 n-6 and C16:0, reflecting feed intake. No statistically significant differences were observed for these major FAs in the remaining fish samples, in line with diet composition. Martínez-Llorens et al. [36] also described a correlation between the FA profile of gilthead seabream muscle and the feed intake, observing an increase in C18:2 n-6 with higher proportions of soybean oil in fish diets. Regarding n-3 FA, fish fed Pc5 and Pc10 showed the highest content of DHA (ca. 6.4%), whereas no differences were observed for EPA in all samples, ranging from 5.25 ± 0.21 to 5.52 ± 0.17%. The lowest amount of ALA (1.89 ± 0.10%) was detected in fish fed W10 with no differences in the remaining samples (ca. 2.5%), consistent with diet composition. Vasconi et al. [38] compared the fatty acid composition of the muscle from farmed seabream, collected in 2005 and 2014, reporting similar values to those of our study for C16:0, C18:1 n-9, ALA, and EPA contents. However, they attained lower amounts of C18:2 n-6 (12.47 to 16.7%) and higher contents of DHA (11.95 to 15.57%). They also observed that the replacement of fish oil by plant-based oil in aquaculture feeds led to an increase in C18:1 n-9 and C18:2 n-6 FA. In the study carried out by Pateiro et al. [39], distinct amounts of ALA (4.45%), EPA (2.25%), and DHA (5.20%) in the muscle of commercial seabream were reported.
Table 3.
Fatty acid profile (% total fatty acids) of muscle of S. aurata fed with the formulated diets: CT, Pc1, Pc5, Pc10, W1, and W10.
3.4. Health Lipid Indices Evaluation
The nutritional quality of food lipids is highly dependent on their fatty acid profile. Nowadays, it is well established that the consumption of saturated fatty acids promotes an increase in serum cholesterol, while polyunsaturated fatty acids, namely diets rich in n-3 PUFA, can depress total and low-density lipoprotein cholesterol levels [40]. The impact of diet on cardiovascular health can be assessed by the PUFA/SFA ratio, with values higher than 0.45 recommended to prevent cardiovascular and some chronic diseases [30]. Nevertheless, different SFAs have distinct influences on serum cholesterol. In fact, C12:0 and C14:0 are the most atherogenic agents, C16:0 is both an athero- and thrombogenic agent, whereas C18:0 is considered to be thrombogenic but neutral with respect to atherogenicity [30]. Additionally, the quality of PUFA is a feature to consider in health lipid evaluation. In fact, n-3 and n-6 PUFA compete for the same enzymes (elongases and desaturases) and have distinct effects on human health. Therefore, an appropriate n-3/n-6 ratio between 1:1 and 5:1 is recommended to prevent several chronic diseases [41].
In this study, fish fed W10 had the lowest values of PUFA/SFA (1.43 ± 0.05) and n-3/n-6 (1.22 ± 0.02) ratios, being statistically different from the remaining samples. Nevertheless, attending to these parameters, all the fish samples fulfill the requirements of a healthy lipid source. However, these parameters do not account for MUFA effect, particularly oleic acid which may increase the activity of low-density lipoprotein receptors, leading to a decrease in serum cholesterol [42]. For this reason, further indices are used to evaluate health lipid quality, namely the ratio between hypocholesterolemic and hypercholesterolemic fatty acids (h/H), atherogenicity index (AI), and thrombogenicity index (TI). Aiming to assess the effect of specific fatty acids in cholesterol metabolism, the ratio between hypocholesterolemic (cis-C18:1 and PUFA) and hypercholesterolemic (C14:0 and C16:0) fatty acids (h/H index) is frequently used. A high value of this parameter is recommended from a nutritional point of view. The AI index establishes the relation between the proatherogenic SFAs, promoters of lipid adhesion to cells of the immune and circulatory systems, and the main classes of antiatherogenic unsaturated fatty acids (UFAs), that inhibit the aggregation of plaque and decrease the levels of esterified fatty acids, cholesterol, and phospholipids, thereby preventing coronary diseases. The TI index evaluates the tendency for clot formation in the blood vessels. This is defined as the relation between the prothrombogenic (SFA) and antithrombogenic fatty acids (MUFA, n-6 and n-3 PUFA) [43]. Diets containing lipids with AI and TI lower than 1.0 and 0.5, respectively, are nutritionally recommended [44].
In our study, the h/H index showed a statistically significant difference between fish fed W10 (3.64 ± 0.09) and the remaining samples (ranging from 3.16 ± 0.13 to 3.36 ± 0.14). Moreover, similar values were obtained for AI (from 0.36 ± 0.01 to 0.39 ± 0.01) and for TI (from 0.29 ± 0.01 to 0.31 ± 0.02), regardless of the provided fish diet. These results highlight that fish fed diets supplemented with P. canaliculata, especially those fed W10, are sources of healthy lipids that might be consumed, on a regular basis, to prevent cardiovascular diseases.
The susceptibility of a tissue to oxidation may be evaluated by the peroxidizability index (PI), highly dependent on the unsaturation degree of FA, providing information about the technological quality of the fish fillets; the higher the PI, the higher the susceptibility to oxidation [45]. In this study, PI values ranged from 115.6 ± 2.0 (W10 sample) to 130.5 ± 7.4 (Pc10), being considerably lower than those reported by Testi et al. [45], between 155 and 170, in seabream fillets.
Aiming to provide a comparative perspective of the fatty acid profile of fish fed the diets under study, a principal component analysis (PCA) was performed (Figure 4). The first principal component, PC-1, representing 57.2% of the sample variability, is mainly defined by the values of hypocholesterolemic/hypercholesterolemic index (h/H), MUFA, C18:1 n-9, C18:2 n-6, PUFA, and C16:0. The second principal component, PC-2, explains 17.1% of the sample variability and is more related with EPA and ALA values. In this figure, W10 stands out for its distinct fatty acid profile, particularly concerning the highest C18:1 n-9, MUFA, and h/H values and the lowest C18:2 n-6, PUFA, C16:0, SFA contents, and PI index.

Figure 4.
Principal component analysis (PCA) biplot of muscle samples of seabream fed with the diets under study (CT; Pc1; Pc5; Pc10; W1 and W10). The following parameters were considered: most abundant fatty acids C18:1 n-9, C18:2 n-6, and C16:0; essential fatty acids ALA, EPA, and DHA; total saturated fatty acids (SFA); total monounsaturated fatty acids (MUFA); total polyunsaturated fatty acids (PUFA); n-3 PUFA/n-6 PUFA ratio (n-3/n-6), hypocholesterolemic/hypercholesterolemic index (h/H), atherogenic index (AI), thrombogenic index (TI), and peroxidizability index (PI). PC-1 and PC-2 explain 57.2% and 17.1% of data variability, respectively.
4. Conclusions
This study developed a viable strategy for the use of the brown seaweed Pelvetia canaliculata as an ingredient in S. aurata diets, aiming to valorize this marine resource. In fact, fish fed a diet with 10% of algal residue (W10), that was left after sunflower oil supplementation to increase its oxidative stability, showed slightly improved values of hypocholesterolemic/hypercholesterolemic (h/H) and of peroxidizability index (PI). Nevertheless, in the remaining samples, no significant differences were observed in the proximate composition and the fatty acid profile of fish fed diets supplemented with P. canaliculata, in comparison with the control sample. These results support the nutritional potential of this seaweed as an ingredient in aquaculture feed. In future works, it would be interesting to carry out sensory analyses of fish fed supplemented diets, in comparison with a control sample, to evaluate the acceptance of consumers.
Author Contributions
Conceptualization, M.N., T.B. and C.T.; methodology, M.A., M.N., T.B. and C.T.; software, M.A., M.N. and C.T.; validation, M.N., T.B. and C.T.; formal analysis, M.A., M.N., D.P. and R.P.; investigation, M.A., M.N., D.P., R.P., B.d.C., C.F.T., S.F., M.V., T.B. and C.T.; resources, M.N., T.B. and C.T.; data curation, M.A., M.N., D.P. and R.P.; writing—original draft preparation, M.A., M.N. and C.T.; writing—review and editing, D.P., R.P., B.d.C., C.F.T., S.F., M.V. and T.B.; visualization, M.A. and M.N.; supervision, M.N., T.B. and C.T.; project administration, M.N., T.B. and C.T.; funding acquisition, C.T. All authors have read and agreed to the published version of the manuscript.
Funding
This study was funded by the Research Project Ocean2 Oils “Integrated approach for seaweeds application as sustainable source of functional compounds for edible oils stabilization and food processing” (FA_05_2017_013), co-funded by Fundo Azul program through the Direção-Geral de Política do Mar, Portugal. This study had the support of FCT through the strategic project UIDB/04292/2020 and UIDP/04292/2020 awarded to MARE, of the project MAR-02.05.01-FEAMP-0013, and through project LA/P/0069/2020 granted to the Associate Laboratory ARNET.
Institutional Review Board Statement
The animal study was conducted according to the guidelines on the protection of animals used for scientific purposes from the European Directive 2010/63/EU and under a project authorization 0421/000/000/2019.
Informed Consent Statement
Not applicable.
Data Availability Statement
Data are available on request to the authors.
Conflicts of Interest
The authors declare no conflict of interest.
References
- Corrado, S.; Sala, S. Food Waste Accounting along Global and European Food Supply Chains: State of the Art and Outlook. Waste Manag. 2018, 79, 120–131. [Google Scholar] [CrossRef] [PubMed]
- Girotto, F.; Alibardi, L.; Cossu, R. Food Waste Generation and Industrial Uses: A Review. Waste Manag. 2015, 45, 32–41. [Google Scholar] [CrossRef]
- Naziri, E.; Nenadis, N.; Mantzouridou, F.T.; Tsimidou, M.Z. Valorization of the Major Agrifood Industrial By-Products and Waste from Central Macedonia (Greece) for the Recovery of Compounds for Food Applications. Food Res. Int. 2014, 65, 350–358. [Google Scholar] [CrossRef]
- Kennedy, S.R.; Bickerdike, R.; Berge, R.K.; Dick, J.R.; Tocher, D.R. Influence of Conjugated Linoleic Acid (CLA) or Tetradecylthioacetic Acid (TTA) on Growth, Lipid Composition, Fatty Acid Metabolism and Lipid Gene Expression of Rainbow Trout (Oncorhynchus Mykiss L.). Aquaculture 2007, 272, 489–501. [Google Scholar] [CrossRef]
- Ramos, A.; Bandarra, N.M.; Rema, P.; Vaz-Pires, P.; Nunes, M.L.; Andrade, A.M.; Cordeiro, A.R.; Valente, L.M.P. Time Course Deposition of Conjugated Linoleic Acid in Market Size Rainbow Trout (Oncorhynchus mykiss) Muscle. Aquaculture 2008, 274, 366–374. [Google Scholar] [CrossRef]
- Rosa, R.; Andrade, A.M.; Bandarra, N.M.; Nunes, M.L. Physiological and Biochemical Effects of Conjugated Linoleic Acid and Its Use in Aquaculture. Rev. Aquac. 2010, 2, 59–72. [Google Scholar] [CrossRef]
- Ramalho Ribeiro, A.; Gonçalves, A.; Colen, R.; Nunes, M.L.; Dinis, M.T.; Dias, J. Dietary Macroalgae Is a Natural and Effective Tool to Fortify Gilthead Seabream Fillets with Iodine: Effects on Growth, Sensory Quality and Nutritional Value. Aquaculture 2015, 437, 51–59. [Google Scholar] [CrossRef]
- Rajauria, G. Seaweeds: A sustainable feed source for livestock and aquaculture. In Seaweed Sustainability; Elsevier: Amsterdam, The Netherlands, 2015; pp. 389–420. [Google Scholar]
- Jusadi, D.; Ekasari, J.; Suprayudi, M.A.; Setiawati, M.; Fauzi, I.A. Potential of Underutilized Marine Organisms for Aquaculture Feeds. Front. Mar. Sci. 2021, 7, 609471. [Google Scholar] [CrossRef]
- Roleda, M.Y.; Hurd, C.L. Seaweed Nutrient Physiology: Application of Concepts to Aquaculture and Bioremediation. Phycologia 2019, 58, 552–562. [Google Scholar] [CrossRef]
- Sáez, M.I.; Martínez, T.; Alarcón, J. Effect of Dietary Inclusion of Seaweeds on Intestinal Proteolytic Activity of Juvenile Sea Bream, Sparus aurata. Int. Aquafeed 2013, 16, 38–40. [Google Scholar]
- Lomartire, S.; Gonçalves, A.M.M. An Overview of Potential Seaweed-Derived Bioactive Compounds for Pharmaceutical Applications. Mar. Drugs 2022, 20, 141. [Google Scholar] [CrossRef] [PubMed]
- Choudhary, B.; Chauhan, O.P.; Mishra, A. Edible Seaweeds: A Potential Novel Source of Bioactive Metabolites and Nutraceuticals with Human Health Benefits. Front. Mar. Sci. 2021, 8, 740054. [Google Scholar] [CrossRef]
- Connan, S.; Deslandes, E.; Gall, E.A. Influence of Day–Night and Tidal Cycles on Phenol Content and Antioxidant Capacity in Three Temperate Intertidal Brown Seaweeds. J. Exp. Mar. Biol. Ecol. 2007, 349, 359–369. [Google Scholar] [CrossRef]
- Peixoto, M.J.; Ferraz, R.; Magnoni, L.J.; Pereira, R.; Gonçalves, J.F.; Calduch-Giner, J.; Pérez-Sánchez, J.; Ozório, R.O.A. Protective Effects of Seaweed Supplemented Diet on Antioxidant and Immune Responses in European Seabass (Dicentrarchus labrax) Subjected to Bacterial Infection. Sci. Rep. 2019, 9, 16134. [Google Scholar] [CrossRef] [PubMed]
- Emre, Y.; Ergun, S.; Kurtoglu, A.; Guroy, B.; Guroy, D. Effects of Ulva Meal on Growth Performance of Gilthead Seabream (Sparus aurata) at Different Levels of Dietary Lipid. Turk. J. Fish. Aquat. Sci. 2013, 13, 841–846. [Google Scholar] [CrossRef]
- Araújo, M.; Rema, P.; Sousa-Pinto, I.; Cunha, L.M.; Peixoto, M.J.; Pires, M.A.; Seixas, F.; Brotas, V.; Beltrán, C.; Valente, L.M.P. Dietary Inclusion of IMTA-Cultivated Gracilaria Vermiculophylla in Rainbow Trout (Oncorhynchus mykiss) Diets: Effects on Growth, Intestinal Morphology, Tissue Pigmentation, and Immunological Response. J. Appl. Phycol. 2016, 28, 679–689. [Google Scholar] [CrossRef]
- Valente, L.M.P.; Gouveia, A.; Rema, P.; Matos, J.; Gomes, E.F.; Pinto, I.S. Evaluation of Three Seaweeds Gracilaria Bursa-Pastoris, Ulva Rigida and Gracilaria Cornea as Dietary Ingredients in European Sea Bass (Dicentrarchus labrax) Juveniles. Aquaculture 2006, 252, 85–91. [Google Scholar] [CrossRef]
- Rico, R.M.; Tejedor-Junco, M.T.; Tapia-Paniagua, S.T.; Alarcón, F.J.; Mancera, J.M.; López-Figueroa, F.; Balebona, M.C.; Abdala-Díaz, R.T.; Moriñigo, M.A. Influence of the Dietary Inclusion of Gracilaria Cornea and Ulva Rigida on the Biodiversity of the Intestinal Microbiota of Sparus aurata Juveniles. Aquac. Int. 2016, 24, 965–984. [Google Scholar] [CrossRef]
- Vizcaíno, A.J.; Mendes, S.I.; Varela, J.L.; Ruiz-Jarabo, I.; Rico, R.; Figueroa, F.L.; Abdala, R.; Moriñigo, M.Á.; Mancera, J.M.; Alarcón, F.J. Growth, Tissue Metabolites and Digestive Functionality in Sparus aurata Juveniles Fed Different Levels of Macroalgae, Gracilaria Cornea and Ulva Rigida. Aquac. Res. 2016, 47, 3224–3238. [Google Scholar] [CrossRef]
- Llorente, I.; Fernández-Polanco, J.; Baraibar-Diez, E.; Odriozola, M.D.; Bjørndal, T.; Asche, F.; Guillen, J.; Avdelas, L.; Nielsen, R.; Cozzolino, M.; et al. Assessment of the Economic Performance of the Seabream and Seabass Aquaculture Industry in the European Union. Mar. Policy 2020, 117, 103876. [Google Scholar] [CrossRef]
- Magnoni, L.J.; Martos-Sitcha, J.A.; Queiroz, A.; Calduch-Giner, J.A.; Gonçalves, J.F.M.; Rocha, C.M.R.; Abreu, H.T.; Schrama, J.W.; Ozorio, R.O.A.; Pérez-Sánchez, J. Dietary Supplementation of Heat-Treated Gracilaria and Ulva Seaweeds Enhanced Acute Hypoxia Tolerance in Gilthead Seabream (Sparus Aurata). Biol. Open 2017, 6, 897–908. [Google Scholar] [CrossRef] [PubMed]
- Wassef, E.A.; El-sayed, A.; Kandeel, K.M.; Sakr, E.M. Evaluation of Pterocladia and Ulva Meals as Additives to Gilthead Seabream Sparus aurata Diets. Egypcian J. Aquat. Res. 2005, 31, 321–332. [Google Scholar]
- Sousa, G.; Trifunovska, M.; Antunes, M.; Miranda, I.; Moldão, M.; Alves, V.; Vidrih, R.; Lopes, P.A.; Aparicio, L.; Neves, M.; et al. Optimization of Ultrasound-Assisted Extraction of Bioactive Compounds from Pelvetia Canaliculata to Sunflower Oil. Foods 2021, 10, 1732. [Google Scholar] [CrossRef] [PubMed]
- Pires, D.; Passos, R.; do Carmo, B.; Tchobanov, C.F.; Forte, S.; Vaz, M.; Antunes, M.; Neves, M.; Tecelão, C.; Baptista, T. Pelvetia Canaliculata as an Aquafeed Supplement for Gilthead Seabream Sparus aurata: A Biorefinery Approach for Seaweed Biomass Valorisation. Sustainability 2022, 14, 11469. [Google Scholar] [CrossRef]
- Latimer, G.W., Jr. (Ed.) Official Methods of Analysis of AOAC International, 20th ed.; AOAC International: Rockville, MD, USA, 2016; ISBN 0935584870. [Google Scholar]
- Iverson, S.J.; Lang, S.L.C.; Cooper, M.H. Comparison of the Bligh and Dyer and Folch Methods for Total Lipid Determination in a Broad Range of Marine Tissue. Lipids 2001, 36, 1283–1287. [Google Scholar] [CrossRef]
- Neves, M.; Antunes, M.; Fernandes, W.; Campos, M.J.; Azevedo, Z.M.; Freitas, V.; Rocha, J.M.; Tecelão, C. Physicochemical and Nutritional Profile of Leaves, Flowers, and Fruits of the Edible Halophyte Chorão-Da-Praia (Carpobrotus edulis) on Portuguese West Shores. Food Biosci. 2021, 43, 101288. [Google Scholar] [CrossRef]
- Fernández, A.; Grienke, U.; Soler-vila, A.; Guihéneuf, F.; Stengel, D.B.; Tasdemir, D. Seasonal and Geographical Variations in the Biochemical Composition of the Blue Mussel (Mytilus edulis L.) from Ireland. Food Chem. 2015, 177, 43–52. [Google Scholar] [CrossRef]
- Chen, J.; Liu, H. Nutritional Indices for Assessing Fatty Acids: A Mini-Review. Int. J. Mol. Sci. 2020, 21, 5695. [Google Scholar] [CrossRef]
- Schmid, M.; Guihéneuf, F.; Stengel, D.B. Fatty Acid Contents and Profiles of 16 Macroalgae Collected from the Irish Coast at Two Seasons. J. Appl. Phycol. 2014, 26, 451–463. [Google Scholar] [CrossRef]
- Maehre, H.K.; Malde, M.K.; Eilertsen, K.-E.; Elvevoll, E.O. Characterization of Protein, Lipid and Mineral Contents in Common Norwegian Seaweeds and Evaluation of Their Potential as Food and Feed. J. Sci. Food Agric. 2014, 94, 3281–3290. [Google Scholar] [CrossRef]
- Circuncisão, A.; Catarino, M.; Cardoso, S.; Silva, A. Minerals from Macroalgae Origin: Health Benefits and Risks for Consumers. Mar. Drugs 2018, 16, 400. [Google Scholar] [CrossRef] [PubMed]
- Orsavova, J.; Misurcova, L.; Ambrozova, J.; Vicha, R.; Mlcek, J. Fatty Acids Composition of Vegetable Oils and Its Contribution to Dietary Energy Intake and Dependence of Cardiovascular Mortality on Dietary Intake of Fatty Acids. Int. J. Mol. Sci. 2015, 16, 12871–12890. [Google Scholar] [CrossRef] [PubMed]
- Indiarto, R.; Qonit, M.A.H. A Review of Soybean Oil Lipid Oxidation and Its PreventionTechniques. Int. J. Adv. Sci. Technol. 2020, 29, 5030–5037. [Google Scholar]
- Martínez-Llorens, S.; Vidal, A.T.; Moñino, A.V.; Torres, M.P.; Cerdá, M.J. Effects of Dietary Soybean Oil Concentration on Growth, Nutrient Utilization and Muscle Fatty Acid Composition of Gilthead Sea Bream (Sparus aurata L.). Aquac. Res. 2007, 38, 76–81. [Google Scholar] [CrossRef]
- Mechlaoui, M.; Dominguez, D.; Robaina, L.; Geraert, P.-A.; Kaushik, S.; Saleh, R.; Briens, M.; Montero, D.; Izquierdo, M. Effects of Different Dietary Selenium Sources on Growth Performance, Liver and Muscle Composition, Antioxidant Status, Stress Response and Expression of Related Genes in Gilthead Seabream (Sparus aurata). Aquaculture 2019, 507, 251–259. [Google Scholar] [CrossRef]
- Vasconi, M.; Caprino, F.; Bellagamba, F.; Moretti, V.M. Fatty Acid Composition of Gilthead Sea Bream (Sparus aurata) Fillets as Affected by Current Changes in Aquafeed Formulation. Turk. J. Fish. Aquat. Sci. 2017, 17, 451–459. [Google Scholar] [CrossRef]
- Pateiro, M.; Munekata, P.E.S.; Domínguez, R.; Wang, M.; Barba, F.J.; Bermúdez, R.; Lorenzo, J.M. Nutritional Profiling and the Value of Processing By-Products from Gilthead Sea Bream (Sparus aurata). Mar. Drugs 2020, 18, 101. [Google Scholar] [CrossRef]
- Eshak, E.S.; Yamagishi, K.; Iso, H. Dietary fat and risk of cardiovascular disease. In Encyclopedia of Cardiovascular Research and Medicine; Elsevier: Amsterdam, The Netherlands, 2018; pp. 60–89. [Google Scholar]
- Strobel, C.; Jahreis, G.; Kuhnt, K. Survey of N- 3 and n-6 Polyunsaturated Fatty Acids in Fish and Fish Products. Lipids Health Dis. 2012, 11, 144. [Google Scholar] [CrossRef]
- Kien, C.L.; Bunn, J.Y.; Stevens, R.; Bain, J.; Ikayeva, O.; Crain, K.; Koves, T.R.; Muoio, D.M. Dietary Intake of Palmitate and Oleate Has Broad Impact on Systemic and Tissue Lipid Profiles in Humans. Am. J. Clin. Nutr. 2014, 99, 436–445. [Google Scholar] [CrossRef]
- Ghaeni, M.; Ghahfarokhi, K.N. Fatty Acids Profile, Atherogenic (IA) and Thrombogenic (IT) Health Lipid Indices in Leiognathusbindus and Upeneussulphureus. J. Mar. Sci. Res. Dev. 2013, 3, 3–5. [Google Scholar] [CrossRef]
- Fernandes, C.E.; Vasconcelos, M.A.d.S.; de Almeida Ribeiro, M.; Sarubbo, L.A.; Andrade, S.A.C.; Filho, A.B. de M. Nutritional and Lipid Profiles in Marine Fish Species from Brazil. Food Chem. 2014, 160, 67–71. [Google Scholar] [CrossRef] [PubMed]
- Testi, S.; Bonaldo, A.; Gatta, P.; Badiani, A. Nutritional Traits of Dorsal and Ventral Fillets from Three Farmed Fish Species. Food Chem. 2006, 98, 104–111. [Google Scholar] [CrossRef]
Disclaimer/Publisher’s Note: The statements, opinions and data contained in all publications are solely those of the individual author(s) and contributor(s) and not of MDPI and/or the editor(s). MDPI and/or the editor(s) disclaim responsibility for any injury to people or property resulting from any ideas, methods, instructions or products referred to in the content. |
© 2023 by the authors. Licensee MDPI, Basel, Switzerland. This article is an open access article distributed under the terms and conditions of the Creative Commons Attribution (CC BY) license (https://creativecommons.org/licenses/by/4.0/).