

Cropland: Surplus or Deficit? From the Perspective of Meeting People’s Grain Requirement


Abstract
1. Introduction
2. Methods and Materials
2.1. Method
2.1.1. Scenario Description
2.1.2. Calculation of Grain Demand
- (1)
- Ration
- (2)
- Feed Grain
2.1.3. Calculation of Cropland Requirement
2.1.4. Definition of Guarantee Level of Cropland
2.2. Data Source

| Data | Time | Source |
|---|---|---|
| Population | 1989, 1999,2009 and 2019 | China Statistical Yearbook |
| 2030 | https://dataguru.lu.se/app#worldpop, accessed on 2 September 2022 | |
| Per Capita Grain Requirement | 1989, 1999, 2009 and 2019 | China Statistical Yearbook |
| 2030 | China Dietary Nutrition Guidelines 2016 | |
| Cropland | 1990, 2000, 2010 and 2020 | https://www.resdc.cn/, accessed on 8 October 2022 |
| 2030 | https://www.geosimulation.cn/China_SSP-RCP_1km.html, accessed on 8 October 2022 | |
| Per unit area grain yield | 1989, 1999, 2009 and 2019 | China Statistical Yearbook |
| Sown Areas of Farm Crops | ||
| Sown Areas of Grain Crops |
2.2.1. Population
2.2.2. Per Capita Grain Requirement
2.2.3. Cropland Data
2.2.4. Per Unit Area Grain Yield of Cropland
3. Results
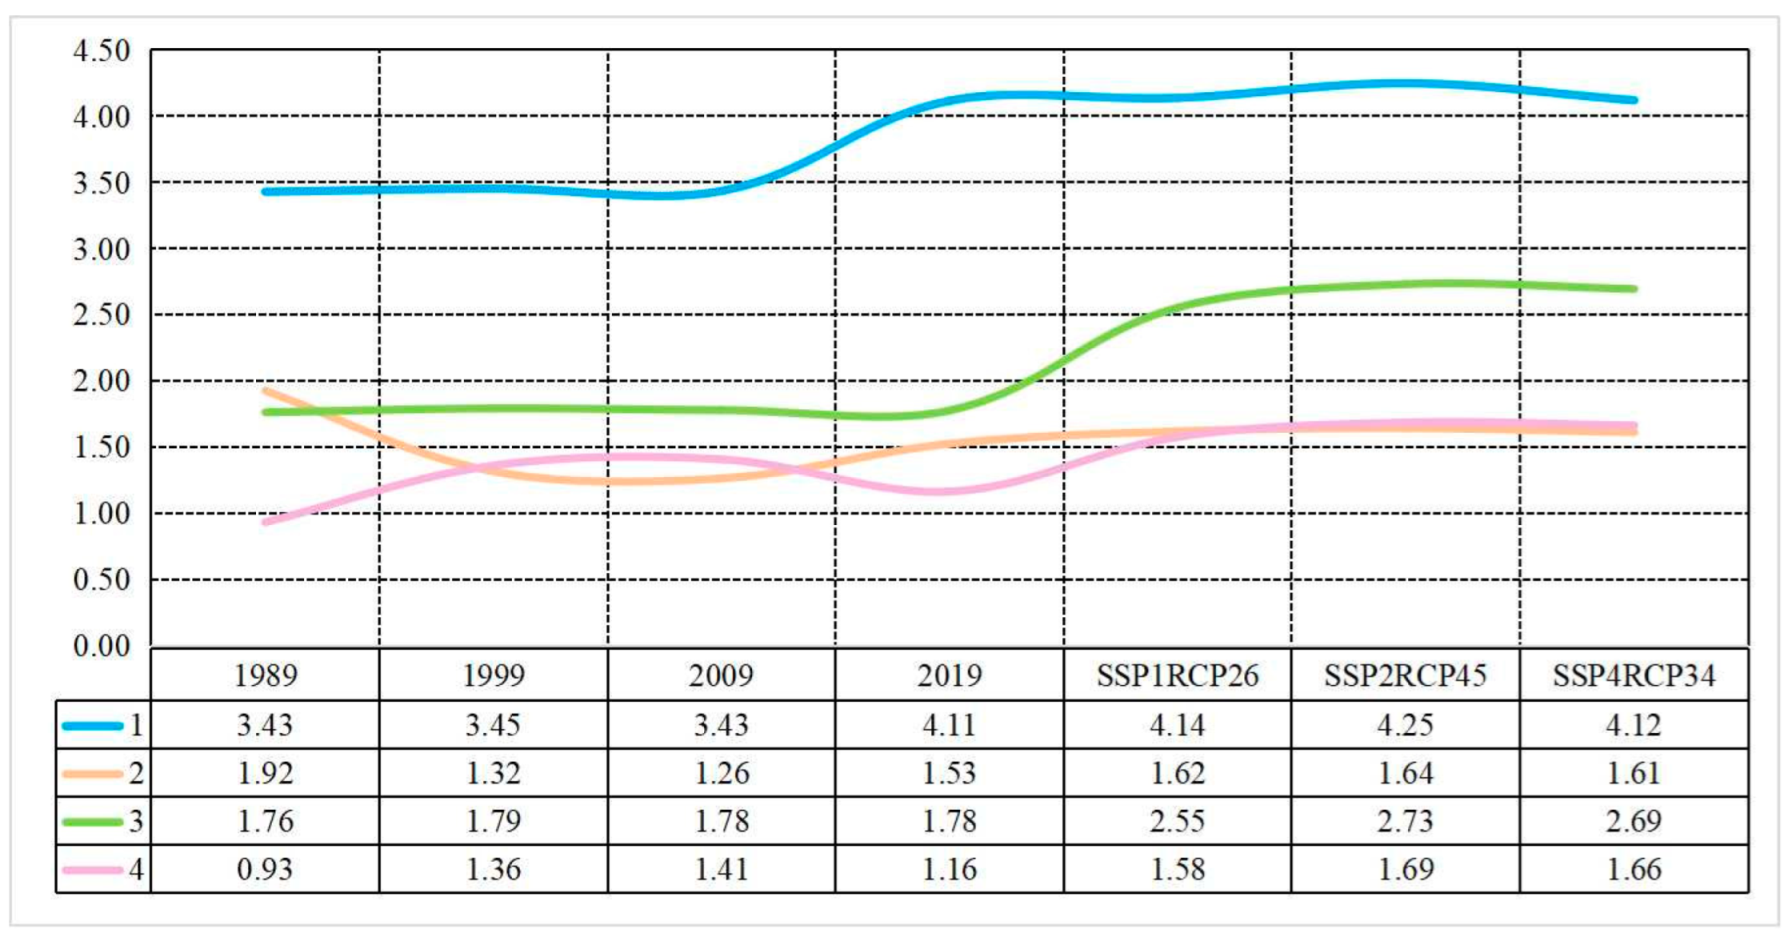
3.1. Nationwide
3.2. Provincial Scale
3.2.1. Amount of Grain Needed by People
3.2.2. Cropland Needed by People
3.2.3. Guarantee Rate of Cropland in the Past Few Years
3.2.4. Guarantee Rate of Cropland in the Future
4. Conclusions
5. Discussion
Author Contributions
Funding
Data Availability Statement
Acknowledgments
Conflicts of Interest
References
- FAO. The State of the World’s Land and Water Resources for Food and Agriculture—Systems at Breaking Point (SOLAW 2021); FAO: Rome, Italy, 2021. [Google Scholar] [CrossRef]
- Zhou, Z.-Y. Population and food demand. In Global Food Security; Taylor & Francis Group: Abingdon, UK, 2019; pp. 51–72. [Google Scholar] [CrossRef]
- National Bureau of Statistics of the People’s Republic of China (NBSC). China Statistical Yearbook; China Statistics Press: Beijing, China, 2021.
- He, P.; Baiocchi, G.; Hubacek, K.; Feng, K.; Yu, Y. The environmental impacts of rapidly changing diets and their nutritional quality in China. Nat. Sustain. 2018, 1, 122–127. [Google Scholar] [CrossRef]
- National Bureau of Statistics of the People’s Republic of China (NBSC). China Statistical Yearbook; China Statistics Press: Beijing, China, 1991.
- Bai, Z.; Ma, W.; Ma, L.; Velthof, G.L.; Wei, Z.; Havlík, P.; Oenema, O.; Lee, M.R.F.; Zhang, F. China’s livestock transition: Driving forces, impacts, and consequences. Sci. Adv. 2018, 4, eaar8534. [Google Scholar] [CrossRef]
- Dong, W.-L.; Wang, X.-B.; Yang, J. Future perspective of China’s feed demand and supply during its fast transition period of food consumption. J. Integr. Agric. 2015, 14, 1092–1100. [Google Scholar] [CrossRef]
- Liu, J.; Kuang, W.; Zhang, Z.; Xu, X.; Qin, Y.; Ning, J.; Zhou, W.; Zhang, S.; Li, R.; Yan, C.; et al. Spatiotemporal characteristics, patterns, and causes of land-use changes in China since the late 1980s. J. Geogr. Sci. 2014, 24, 195–210. [Google Scholar] [CrossRef]
- Niu, Y.; Xie, G.; Xiao, Y.; Liu, J.; Wang, Y.; Luo, Q.; Zou, H.; Gan, S.; Qin, K.; Huang, M. Spatiotemporal Patterns and Determinants of Grain Self-Sufficiency in China. Foods 2021, 10, 747. [Google Scholar] [CrossRef]
- Zhu, K.; Yin, H. Study on the risks and prevention about the utilization of international food resource under the new situation. World Agric. 2022, 7, 48–56, (In Chinese with English Abstract). [Google Scholar] [CrossRef]
- Zhao, P.; Li, S.; Wang, E.; Chen, X.; Deng, J.; Zhao, Y. Tillage erosion and its effect on spatial variations of soil organic carbon in the black soil region of China. Soil Tillage Res. 2018, 178, 72–81. [Google Scholar] [CrossRef]
- Li, T.; Zhao, L.; Duan, H.; Yang, Y.; Wang, Y.; Wu, F. Exploring the interaction of surface roughness and slope gradient in controlling rates of soil loss from sloping farmland on the Loess Plateau of China. Hydrol. Processes 2019, 34, 339–354. [Google Scholar] [CrossRef]
- Feng, W.; Zhong, M.; Lemoine, J.-M.; Biancale, R.; Hsu, H.-T.; Xia, J. Evaluation of groundwater depletion in North China using the Gravity Recovery and Climate Experiment (GRACE) data and ground-based measurements. Water Resour. Res. 2013, 49, 2110–2118. [Google Scholar] [CrossRef]
- Chen, S.; Gong, B. Response and adaptation of agriculture to climate change: Evidence from China. J. Dev. Econ. 2020, 148, 102557. [Google Scholar] [CrossRef]
- Zhang, X.-N.; Guo, Q.-P.; Shen, X.-X.; Yu, S.-W.; Qiu, G.-Y. Water quality, agriculture and food safety in China: Current situation, trends, interdependencies, and management. J. Integr. Agric. 2015, 14, 2365–2379. [Google Scholar] [CrossRef]
- Liu, Y.; Zhou, Y. Reflections on China’s food security and land use policy under rapid urbanization. Land Use Policy 2021, 109, 105699. [Google Scholar] [CrossRef]
- Chen, X.; Cui, Z.; Fan, M.; Vitousek, P.; Zhao, M.; Ma, W.; Wang, Z.; Zhang, W.; Yan, X.; Yang, J.; et al. Producing more grain with lower environmental costs. Nature 2014, 514, 486–489. [Google Scholar] [CrossRef]
- Chu, M.; Anders, S.; Deng, Q.; Contador, C.A.; Cisternas, F.; Caine, C.; Zhu, Y.; Yang, S.; Hu, B.; Liu, Z.; et al. The future of sustainable food consumption in China. Food Energy Secur. 2022, 00, e405. [Google Scholar] [CrossRef]
- Huang, J.; Wei, W.; Cui, Q.; Xie, W. The Prospects for China’s Food Security and Imports: Will China Starve the World Via Imports? J. Integr. Agric. 2017, 16, 2933–2944. [Google Scholar] [CrossRef]
- Niu, Y.; Xie, G.; Xiao, Y.; Liu, J.; Zou, H.; Qin, K.; Wang, Y.; Huang, M. The story of grain self-sufficiency: China’s food security and food for thought. Food Energy Secur. 2022, 11, e344. [Google Scholar] [CrossRef]
- Shi, W.; Lu, C.; Shi, X.; Cui, J. Patterns and trends in grain self-sufficiency on the Tibetan Plateau during 1985–2016. J. Geogr. Sci. 2020, 30, 1590–1602. [Google Scholar] [CrossRef]
- Liu, L.; Zhou, D.; Chang, X.; Lin, Z. A new grading system for evaluating China’s cultivated land quality. Land Degrad. Dev. 2020, 31, 1482–1501. [Google Scholar] [CrossRef]
- Yu, Z.; Deng, X. Assessment of land degradation in the North China Plain driven by food security goals. Ecol. Eng. 2022, 183. [Google Scholar] [CrossRef]
- Nie, Y. Analysis of cultivated land contribution to food security in china. Economist 2015, 1, 83–93. [Google Scholar] [CrossRef]
- Sun, L.; Zhu, X.; Wang, J.; Li, W.; Tang, X.; Zhang, J. Study of spatial-temporal coupling relationship between cultivated land change and grain output increase in twelve provinces of Northern China. Areal Res. Dev. 2022, 41, 139–145. [Google Scholar] [CrossRef]
- Geng, L. Study on the Effect of Cultivated Land Balance on Grain Production Capacity in Jiangxi Province. Master Thesis, Jiangxi Agricultural University, Nanchang, China, 2017. [Google Scholar]
- Gurney, K.R.; Kılkış, S.; Seto, K.C.; Lwasa, S.; Moran, D.; Riahi, K.; Keller, M.; Rayner, P.; Luqman, M. Greenhouse gas emissions from global cities under SSP/RCP scenarios, 1990 to 2100. Glob. Environ. Chang. 2022, 73, 102478. [Google Scholar] [CrossRef]
- Van Vuuren, D.P.; Stehfest, E.; den Elzen, M.G.J.; Kram, T.; Van Vliet, J.; Deetman, S.; Isaac, M.; Goldewijk, K.K.; Hof, A.; Beltran, A.M.; et al. RCP2.6: Exploring the possibility to keep global mean temperature increase below 2 °C. Clim. Chang. 2011, 109, 95–116. [Google Scholar] [CrossRef]
- Masui, T.; Matsumoto, K.; Hijioka, Y.; Kinoshita, T.; Nozawa, T.; Ishiwatari, S.; Kato, E.; Shukla, P.; Yamagata, Y.; Kainuma, M. An emission pathway for stabilization at 6 Wm−2 radiative forcing. Clim. Chang. 2011, 109, 59–76. [Google Scholar] [CrossRef]
- Su, B.; Huang, J.; Mondal, S.K.; Zhai, J.; Wang, Y.; Wen, S.; Gao, M.; Lv, Y.; Jiang, S.; Jiang, T.; et al. Insight from CMIP6 SSP-RCP scenarios for future drought characteristics in China. Atmos. Res. 2021, 250, 105375. [Google Scholar] [CrossRef]
- van Vuuren, D.P.; Kriegler, E.; O’Neill, B.C.; Ebi, K.L.; Riahi, K.; Carter, T.R.; Edmonds, J.; Hallegatte, S.; Kram, T.; Mathur, R.; et al. A new scenario framework for Climate Change Research: Scenario matrix architecture. Clim. Chang. 2014, 122, 373–386. [Google Scholar] [CrossRef]
- O’Neill, B.C.; Kriegler, E.; Ebi, K.L.; Kemp-Benedict, E.; Riahi, K.; Rothman, D.S.; van Ruijven, B.J.; van Vuuren, D.P.; Birkmann, J.; Kok, K.; et al. The roads ahead: Narratives for shared socioeconomic pathways describing world futures in the 21st century. Glob. Environ. Chang. 2017, 42, 169–180. [Google Scholar] [CrossRef]
- Luo, J. Study on Grain Demand Based on the Goal of Nutrition. Ph.D. Thesis, Chinese Academy of Agricultural Sciences, Beijing, China, 2008. [Google Scholar]
- Xie, G.; Cheng, S.K.; Xiao, Y.; Lu, C.; Liu, X.; Xu, J. The balance between grainsupply and demand and the reconstruction of China’s food security strategy in the new period. J. Nat. Resour. 2017, 32, 895–903, (In Chinese with English Abstract). [Google Scholar] [CrossRef]
- Liang, X.Y.; Jin, X.B.; Sun, R.; Han, B.; Ren, J.; Zhou, Y.K. China’s resilience-space for cultivated land protection under the restraint of multi-scenario food security bottom line. Acta Geogr. Sin. 2022, 77, 697–713, (In Chinese with English Abstract). [Google Scholar] [CrossRef]
- National Bureau of Statistics of the People’s Republic of China (NBSC). China Statistical Yearbook; China Statistics Press: Beijing, China, 2001.
- National Bureau of Statistics of the People’s Republic of China (NBSC). China Statistical Yearbook; China Statistics Press: Beijing, China, 2011.
- Olen, N.; Lehsten, V. High-resolution global population projections dataset developed with CMIP6 RCP and SSP scenarios for year 2010–2100. Data Brief 2022, 40, 107804. [Google Scholar] [CrossRef]
- Chinese Nutrition Society (CNS). Dietary Guidelines for Chinese Residents; People’s Medical Publishing House: Beijing, China, 2016. [Google Scholar]
- Yu, Z.; Deng, X.; Cheshmehzangi, A. The Grain for Green Program Enhanced Synergies between Ecosystem Regulating Services in Loess Plateau, China. Remote Sens. 2022, 14, 5940. [Google Scholar] [CrossRef]
- Liu, B.; Zhou, H.; Qi, M.; Pan, M.; Tang, L. Requisition–Compensation Balance Relief for Hydraulic Projects Based on Cultivated Land Quality Improvement. Sustainability 2022, 14, 13576. [Google Scholar] [CrossRef]
- Kang, L.; Zhao, R.; Wu, K.; Huang, Q.; Zhang, S. Impacts of Farming Layer Constructions on Cultivated Land Quality under the Cultivated Land Balance Policy. Agronomy 2021, 11, 2403. [Google Scholar] [CrossRef]
- Shao, W.; Wang, Q.; Guan, Q.; Zhang, J.; Yang, X.; Liu, Z. Environmental sensitivity assessment of land desertification in the Hexi Corridor, China. Catena 2023, 220, 106728. [Google Scholar] [CrossRef]
- Jiang, X.; Duan, H.; Liao, J.; Guo, P.; Huang, C.; Xue, X. Estimation of Soil Salinization by Machine Learning Algorithms in Different Arid Regions of Northwest China. Remote Sens. 2022, 14, 347. [Google Scholar] [CrossRef]
- Bao, H.; Tang, M.; Lan, H.-X.; Peng, J.-B.; Zheng, H.; Guo, G.-M. Soil erosion and its causes in high-filling body: A case study of a valley area on the Loess Plateau, China. J. Mt. Sci. 2022, 20, 182–196. [Google Scholar] [CrossRef]


| Year | Pork | Beef | Mutton | Chicken | Egg | Milk | Aquatic Product |
|---|---|---|---|---|---|---|---|
| 1989 | 2.36 | 0.43 | 0.26 | 2.19 | 2.72 | 0.42 | 1.2 |
| 1999 | 2.09 | 0.49 | 0.54 | 1.62 | 1.69 | 0.39 | 1.2 |
| 2009 | 2.7 | 2.5 | 2.92 | 2.03 | 1.68 | 0.37 | 1.28 |
| 2019 | 2.7 | 2.5 | 2.92 | 2.03 | 1.68 | 0.37 | 1.28 |
| 2030 | 2.7 | 2.5 | 2.92 | 2.03 | 1.68 | 0.37 | 1.28 |
| Pork | Beef | Mutton | Poultry Meat | Egg | Milk | Aquatic Product | |
|---|---|---|---|---|---|---|---|
| Rice | 15.77 | 0 | 0 | 2.32 | 6.2 | 0 | 0 |
| Wheat | 6.70 | 5 | 5 | 2.33 | 2.7 | 0.7 | 7.08 |
| Maize | 43.57 | 26.25 | 26.25 | 50.82 | 40.40 | 31.40 | 23.39 |
| Soybean | 18.75 | 0 | 0 | 25 | 25 | 0 | 12.5 |
| Tuber | 15 | 0 | 0 | 0 | 0 | 0 | 0 |
| Beijing | Tianjin | Hebei | Shanxi | Inner Mongolia | Liaoning | Jilin | Heilongjiang | ||
|---|---|---|---|---|---|---|---|---|---|
| 1989 | Total | 1.04 | 0.86 | 5.88 | 2.79 | 2.12 | 3.88 | 2.40 | 3.51 |
| Rural | 0.23 | 0.27 | 4.76 | 2.02 | 1.36 | 1.90 | 1.38 | 1.85 | |
| Urban | 0.81 | 0.59 | 1.12 | 0.77 | 0.77 | 1.97 | 1.02 | 1.66 | |
| 1999 | Total | 1.26 | 0.96 | 6.61 | 3.20 | 2.36 | 4.17 | 2.66 | 3.79 |
| Rural | 0.28 | 0.27 | 4.89 | 2.09 | 1.35 | 1.91 | 1.34 | 1.84 | |
| Urban | 0.97 | 0.69 | 1.72 | 1.12 | 1.01 | 2.26 | 1.32 | 1.95 | |
| 2009 | Total | 1.76 | 1.23 | 7.03 | 3.43 | 2.42 | 4.32 | 2.74 | 3.83 |
| Rural | 0.26 | 0.27 | 4.01 | 1.85 | 1.13 | 1.71 | 1.28 | 1.70 | |
| Urban | 1.49 | 0.96 | 3.02 | 1.58 | 1.29 | 2.61 | 1.46 | 2.12 | |
| 2019 | Total | 2.15 | 1.56 | 7.59 | 3.73 | 2.54 | 4.35 | 2.69 | 3.75 |
| Rural | 0.29 | 0.26 | 3.22 | 1.51 | 0.93 | 1.39 | 1.12 | 1.47 | |
| Urban | 1.87 | 1.30 | 4.37 | 2.22 | 1.61 | 2.96 | 1.57 | 2.28 | |
| 2030 | SSP1RCP26 | 2.88 | 1.86 | 6.29 | 3.65 | 2.86 | 5.98 | 3.71 | 4.26 |
| SSP2RCP45 | 2.82 | 1.82 | 6.62 | 3.75 | 2.89 | 5.90 | 3.67 | 4.32 | |
| SSP4RCP34 | 2.87 | 1.85 | 6.26 | 3.64 | 2.85 | 5.96 | 3.70 | 4.24 | |
| Shanghai | Jiangsu | Zhejiang | Anhui | Fujian | Jiangxi | Shandong | Henan | ||
| 1989 | Total | 1.28 | 6.54 | 4.21 | 5.47 | 2.90 | 3.70 | 8.16 | 8.23 |
| Rural | 0.47 | 5.15 | 2.83 | 4.49 | 2.28 | 2.94 | 5.93 | 6.95 | |
| Urban | 0.80 | 1.39 | 1.38 | 0.98 | 0.62 | 0.75 | 2.23 | 1.28 | |
| 1999 | Total | 1.47 | 7.21 | 4.48 | 6.24 | 3.32 | 4.23 | 8.88 | 9.39 |
| Rural | 0.17 | 4.22 | 2.30 | 4.50 | 1.94 | 3.06 | 5.51 | 7.21 | |
| Urban | 1.30 | 2.99 | 2.18 | 1.73 | 1.38 | 1.17 | 3.38 | 2.18 | |
| 2009 | Total | 1.92 | 7.73 | 5.18 | 6.13 | 3.63 | 4.43 | 9.47 | 9.49 |
| Rural | 0.22 | 3.43 | 2.18 | 3.55 | 1.76 | 2.52 | 4.89 | 5.91 | |
| Urban | 1.70 | 4.30 | 3.00 | 2.58 | 1.86 | 1.91 | 4.58 | 3.58 | |
| 2019 | Total | 2.43 | 8.07 | 5.85 | 6.37 | 3.97 | 4.67 | 10.07 | 9.64 |
| Rural | 0.28 | 2.37 | 1.76 | 2.81 | 1.33 | 1.99 | 3.88 | 4.51 | |
| Urban | 2.14 | 5.70 | 4.10 | 3.55 | 2.64 | 2.68 | 6.19 | 5.13 | |
| 2030 | SSP1RCP26 | 3.03 | 8.71 | 5.45 | 5.76 | 3.72 | 4.30 | 8.92 | 8.36 |
| SSP2RCP45 | 2.99 | 8.81 | 5.55 | 5.96 | 3.76 | 4.46 | 9.28 | 8.77 | |
| SSP4RCP34 | 3.01 | 8.67 | 5.42 | 5.73 | 3.71 | 4.29 | 8.88 | 8.32 | |
| Hubei | Hunan | Guangdong | Guangxi | Hainan | Chongqing | Sichuan | Guizhou | ||
| 1989 | Total | 5.26 | 6.01 | 6.03 | 4.15 | 0.64 | 1.47 | 9.23 | 3.17 |
| Rural | 3.74 | 4.91 | 4.53 | 3.52 | 0.49 | 1.17 | 7.36 | 2.57 | |
| Urban | 1.52 | 1.10 | 1.50 | 0.63 | 0.15 | 0.30 | 1.87 | 0.60 | |
| 1999 | Total | 5.94 | 6.53 | 7.27 | 4.71 | 0.76 | 3.08 | 8.55 | 3.71 |
| Rural | 3.55 | 4.59 | 3.27 | 3.39 | 0.46 | 2.06 | 6.27 | 2.82 | |
| Urban | 2.39 | 1.94 | 4.00 | 1.33 | 0.31 | 1.02 | 2.28 | 0.89 | |
| 2009 | Total | 5.72 | 6.41 | 9.64 | 4.86 | 0.86 | 2.86 | 8.19 | 3.80 |
| Rural | 3.09 | 3.64 | 3.53 | 2.95 | 0.44 | 1.38 | 5.02 | 2.66 | |
| Urban | 2.63 | 2.77 | 6.11 | 1.90 | 0.42 | 1.47 | 3.17 | 1.14 | |
| 2019 | Total | 5.93 | 6.92 | 11.52 | 4.96 | 0.95 | 3.12 | 8.38 | 3.62 |
| Rural | 2.31 | 2.96 | 3.30 | 2.43 | 0.39 | 1.04 | 3.87 | 1.85 | |
| Urban | 3.62 | 3.96 | 8.23 | 2.53 | 0.56 | 2.09 | 4.51 | 1.78 | |
| 2030 | SSP1RCP26 | 6.30 | 6.17 | 11.00 | 4.10 | 0.76 | 2.68 | 7.42 | 3.02 |
| SSP2RCP45 | 6.39 | 6.42 | 11.18 | 4.30 | 0.79 | 2.79 | 7.75 | 3.18 | |
| SSP4RCP34 | 6.27 | 6.15 | 10.95 | 4.08 | 0.75 | 2.67 | 7.39 | 3.00 | |
| Yunnan | Tibet | Shaanxi | Gansu | Qinghai | Ningxia | Xinjiang | |||
| 1989 | Total | 3.65 | 0.22 | 3.19 | 2.17 | 0.44 | 0.46 | 1.45 | |
| Rural | 3.11 | 0.19 | 2.51 | 1.69 | 0.32 | 0.34 | 0.99 | ||
| Urban | 0.54 | 0.03 | 0.69 | 0.48 | 0.12 | 0.12 | 0.46 | ||
| 1999 | Total | 4.19 | 0.26 | 3.62 | 2.54 | 0.51 | 0.54 | 1.77 | |
| Rural | 3.21 | 0.21 | 2.45 | 1.93 | 0.33 | 0.37 | 1.17 | ||
| Urban | 0.98 | 0.05 | 1.17 | 0.61 | 0.18 | 0.18 | 0.60 | ||
| 2009 | Total | 4.57 | 0.29 | 3.77 | 2.64 | 0.56 | 0.63 | 2.16 | |
| Rural | 3.02 | 0.22 | 2.13 | 1.77 | 0.32 | 0.34 | 1.30 | ||
| Urban | 1.55 | 0.07 | 1.64 | 0.86 | 0.23 | 0.29 | 0.86 | ||
| 2019 | Total | 4.86 | 0.35 | 3.88 | 2.65 | 0.61 | 0.70 | 2.52 | |
| Rural | 2.48 | 0.24 | 1.57 | 1.36 | 0.27 | 0.28 | 1.21 | ||
| Urban | 2.38 | 0.11 | 2.30 | 1.28 | 0.34 | 0.42 | 1.31 | ||
| 2030 | SSP1RCP26 | 3.64 | 0.26 | 3.51 | 2.42 | 0.54 | 0.62 | 2.45 | |
| SSP2RCP45 | 3.90 | 0.30 | 3.65 | 2.51 | 0.56 | 0.64 | 2.48 | ||
| SSP4RCP34 | 3.62 | 0.26 | 3.50 | 2.41 | 0.54 | 0.62 | 2.44 |
| 2030 | |||||||
|---|---|---|---|---|---|---|---|
| 1990 | 2000 | 2010 | 2020 | SSP1RCP26 | SSP2RCP45 | SSP4RCP34 | |
| Beijing | 5857 | 5048 | 4566 | 3670 | 5553 | 5703 | 5678 |
| Tianjin | 7280 | 6955 | 6729 | 5856 | 6827 | 6853 | 6756 |
| Hebei | 99,093 | 97,781 | 97,017 | 90,385 | 99,842 | 105,396 | 104,159 |
| Shanxi | 61,356 | 61,245 | 60,239 | 57715 | 72,065 | 79,091 | 78,135 |
| Inner Mongolia | 103,139 | 114,193 | 114,570 | 113,784 | 159,076 | 180,925 | 177,826 |
| Liaoning | 62,903 | 64,944 | 64,630 | 60,915 | 85,058 | 89,430 | 87,459 |
| Jilin | 71,115 | 75,279 | 75,543 | 76,470 | 100,566 | 104,619 | 102,457 |
| Heilongjiang | 141,886 | 160,293 | 161,880 | 173,578 | 192,124 | 216,636 | 208,699 |
| Shanghai | 4982 | 4556 | 3965 | 3326 | 4057 | 4450 | 4190 |
| Jiangsu | 72,336 | 69,947 | 67,256 | 62,485 | 79,789 | 81,969 | 80,678 |
| Zhejiang | 28,740 | 27,840 | 25,492 | 23,953 | 37,770 | 40,982 | 40,475 |
| Anhui | 81,515 | 80,883 | 79,858 | 77,586 | 102,471 | 104,234 | 103,691 |
| Fujian | 22,328 | 21,893 | 20,748 | 20,627 | 31,033 | 36,715 | 37,251 |
| Jiangxi | 45,477 | 45,389 | 45,071 | 44,199 | 91,506 | 94,368 | 93,310 |
| Shandong | 104,954 | 103,700 | 101,916 | 101,162 | 128,356 | 130,806 | 129,386 |
| Henan | 108,487 | 108,734 | 107,394 | 103,356 | 132,601 | 132,360 | 132,397 |
| Hubei | 70,215 | 69,651 | 68,460 | 66,951 | 102,260 | 105,645 | 104,571 |
| Hunan | 61,944 | 61,381 | 60,850 | 59,161 | 123,942 | 127,908 | 126,890 |
| Guangdong | 46,811 | 45,039 | 42,598 | 41,048 | 81,389 | 84,054 | 84,884 |
| Guangxi | 51,626 | 51,789 | 51,464 | 56,672 | 114,188 | 117,901 | 115,518 |
| Hainan | 9114 | 8907 | 8820 | 8680 | 15,948 | 16,916 | 16,776 |
| Chongqing | 38,687 | 38,507 | 37,732 | 37,411 | 52,830 | 54,446 | 53,645 |
| Sichuan | 121,932 | 121,447 | 120,198 | 117,841 | 144,255 | 163,013 | 158,982 |
| Guizhou | 49,794 | 49,444 | 49,326 | 48,279 | 98,097 | 98,848 | 106,962 |
| Yunnan | 69,128 | 69,070 | 68,436 | 67,459 | 129,368 | 141,898 | 144,170 |
| Tibet | 4638 | 4628 | 4620 | 7595 | 32,174 | 39,462 | 35,906 |
| Shaanxi | 71,760 | 71,748 | 69,900 | 66,843 | 75,442 | 83,093 | 78,901 |
| Gansu | 64,971 | 65,433 | 65,399 | 63,924 | 78,420 | 91,203 | 87,365 |
| Qinghai | 8002 | 8250 | 8286 | 8603 | 29,850 | 41,540 | 40,095 |
| Ningxia | 16,299 | 18,622 | 17,817 | 17,529 | 13,743 | 14,476 | 14,128 |
| Xinjiang | 56,629 | 59,396 | 68,736 | 89,931 | 132,624 | 135,156 | 132,484 |
Disclaimer/Publisher’s Note: The statements, opinions and data contained in all publications are solely those of the individual author(s) and contributor(s) and not of MDPI and/or the editor(s). MDPI and/or the editor(s) disclaim responsibility for any injury to people or property resulting from any ideas, methods, instructions or products referred to in the content. |
© 2023 by the authors. Licensee MDPI, Basel, Switzerland. This article is an open access article distributed under the terms and conditions of the Creative Commons Attribution (CC BY) license (https://creativecommons.org/licenses/by/4.0/).
Share and Cite
Niu, Y.; Zhang, C.; Xie, G.; Niu, H. Cropland: Surplus or Deficit? From the Perspective of Meeting People’s Grain Requirement. Foods 2023, 12, 964. https://doi.org/10.3390/foods12050964
Niu Y, Zhang C, Xie G, Niu H. Cropland: Surplus or Deficit? From the Perspective of Meeting People’s Grain Requirement. Foods. 2023; 12(5):964. https://doi.org/10.3390/foods12050964
Chicago/Turabian StyleNiu, Yingnan, Caixia Zhang, Gaodi Xie, and Huan Niu. 2023. "Cropland: Surplus or Deficit? From the Perspective of Meeting People’s Grain Requirement" Foods 12, no. 5: 964. https://doi.org/10.3390/foods12050964
APA StyleNiu, Y., Zhang, C., Xie, G., & Niu, H. (2023). Cropland: Surplus or Deficit? From the Perspective of Meeting People’s Grain Requirement. Foods, 12(5), 964. https://doi.org/10.3390/foods12050964