
Response Surface Methodology Approach for Predicting Convective/Infrared Drying, Quality, Bioactive and Vitamin C Characteristics of Pumpkin Slices

 ,
,  , and
, and
Abstract
1. Introduction
2. Materials and Methods
2.1. Sample Preparation
2.2. Drying
2.3. Moisture Content
2.4. Specific Energy Consumption
2.5. Quality Features
2.5.1. Color
2.5.2. Shrinkage
2.5.3. Rehydration Ratio
2.6. Bioactive Properties
2.6.1. Antioxidant Activities
2.6.2. Total Phenol Content (TPC)
2.7. Vitamin C
2.8. Response Surface Method (RSM)
3. Results and Discussion
3.1. Drying Time
3.2. Specific Energy Consumption
3.3. Quality Features
3.3.1. Color
3.3.2. Shrinkage
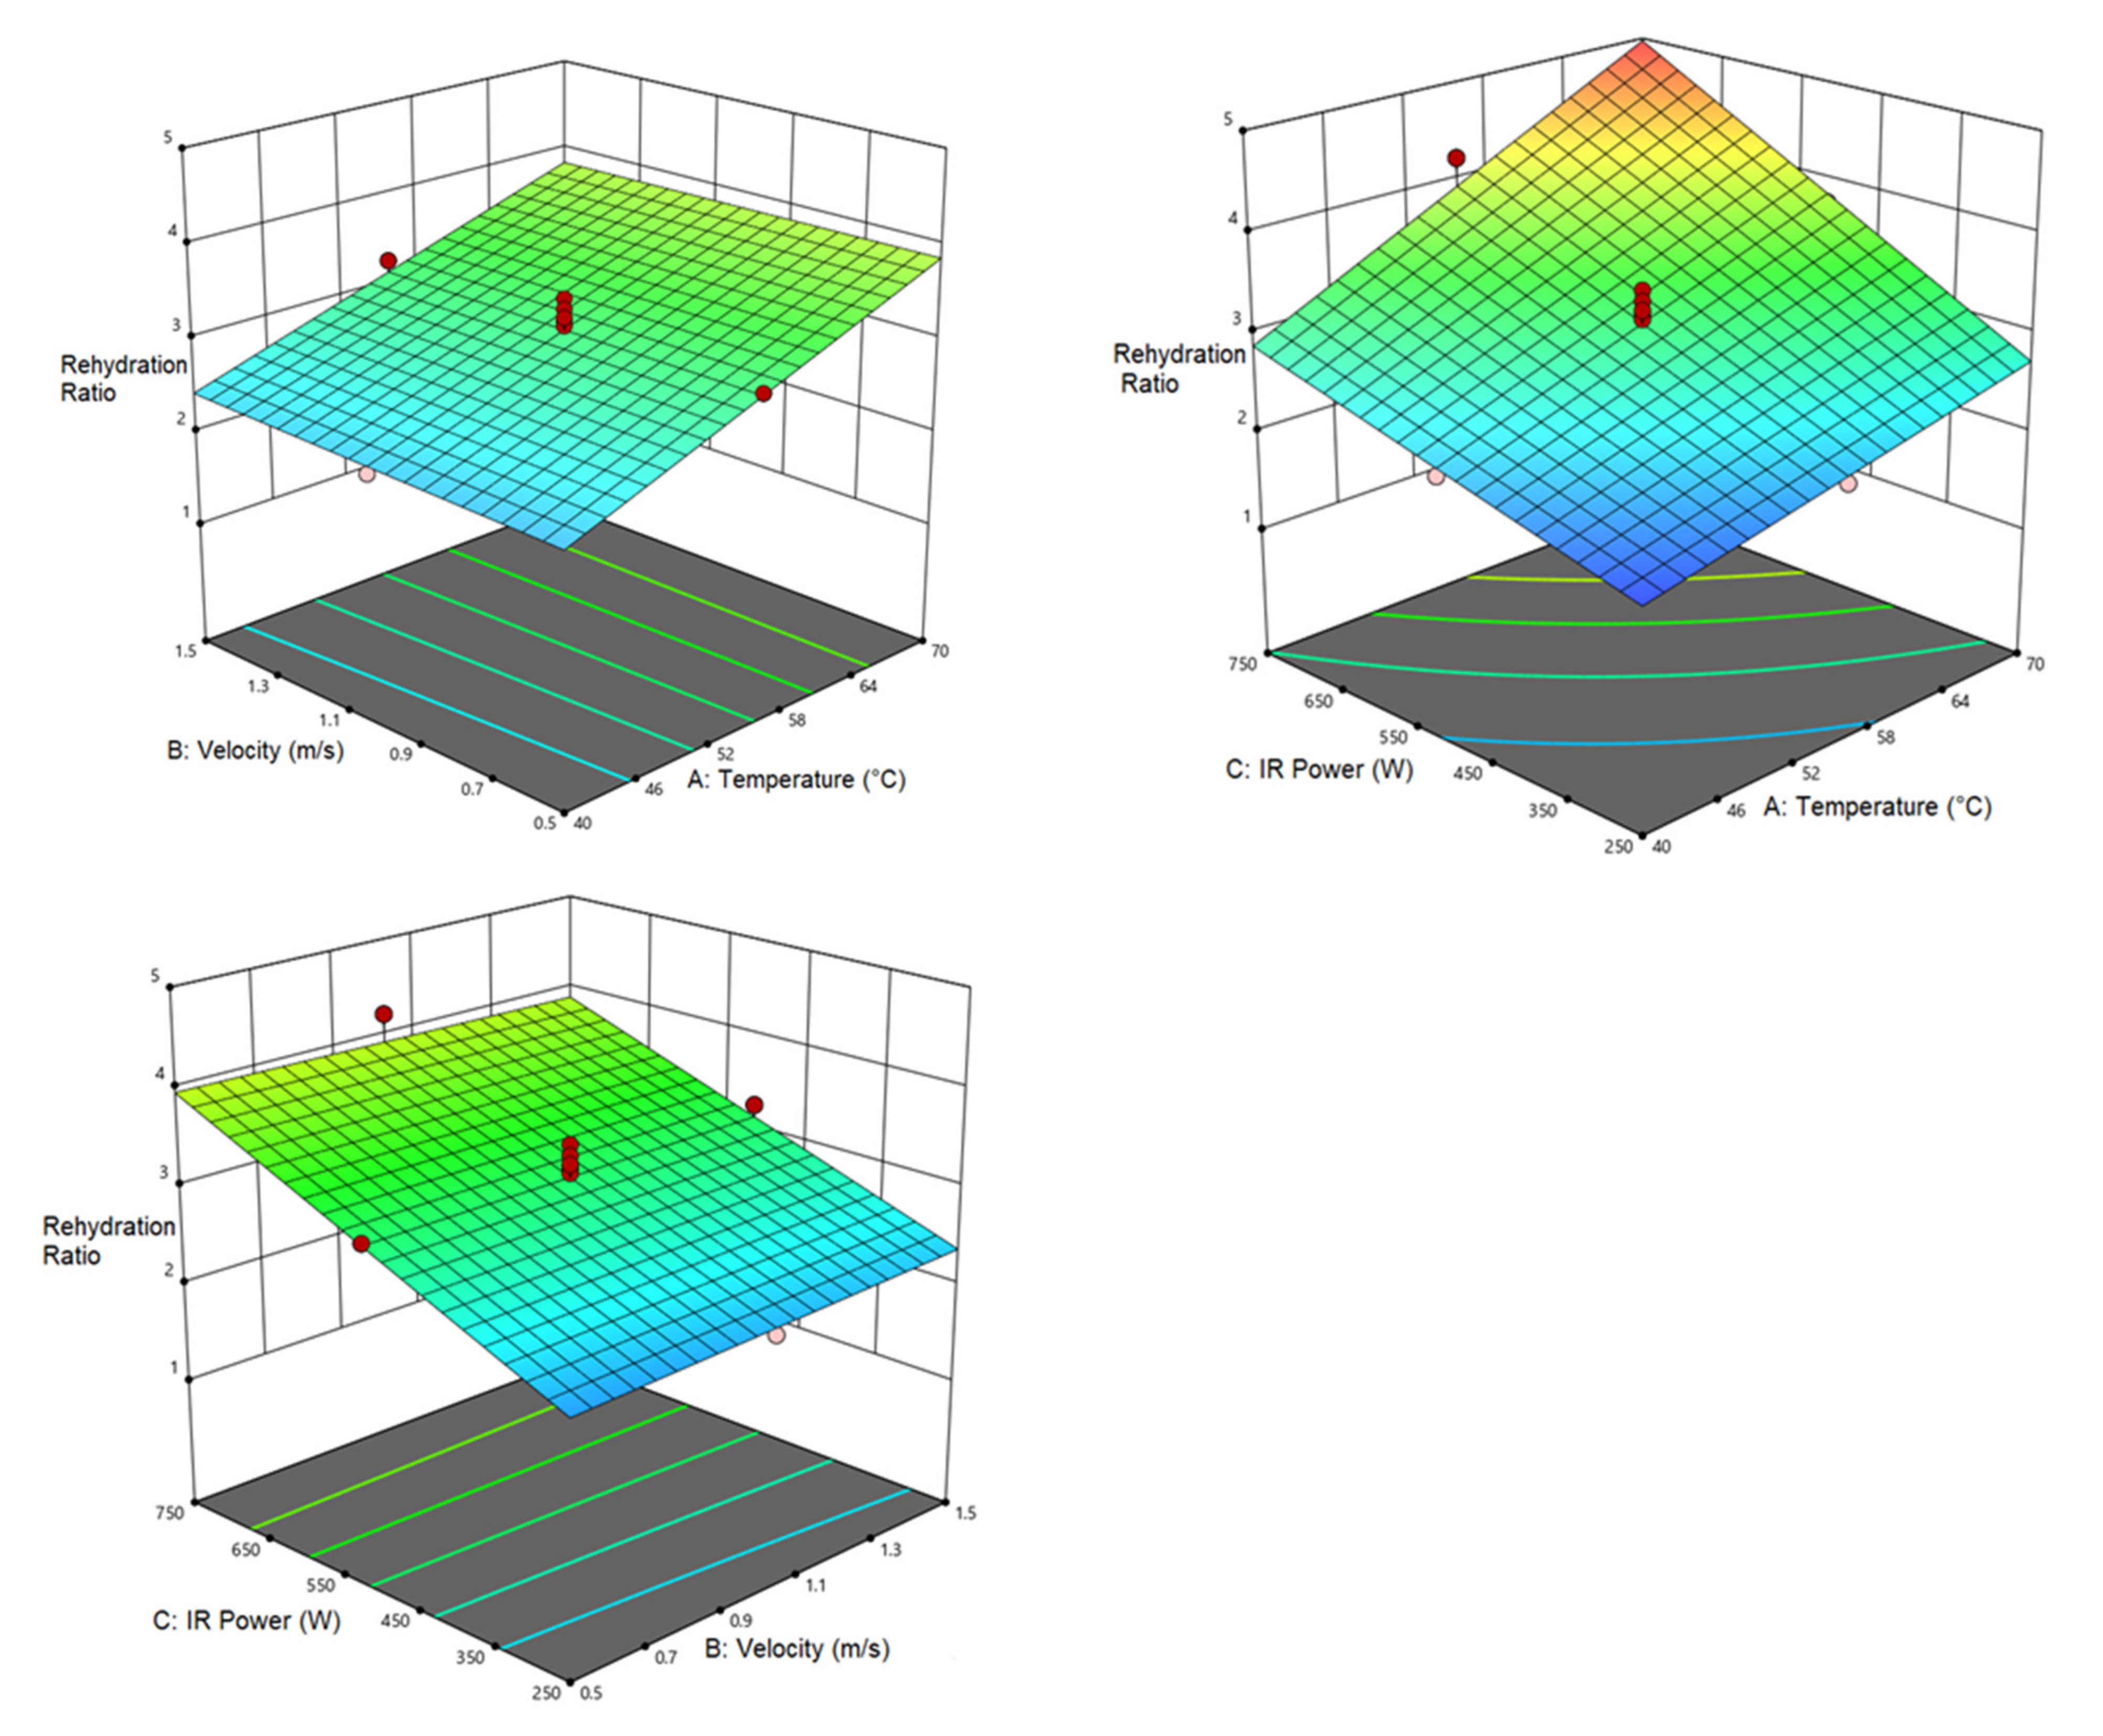
3.3.3. Rehydration Ratio (RR)
3.4. Bioactive Properties
3.4.1. Total Phenol Content (TPC)
3.4.2. Antioxidant Activity (AA)
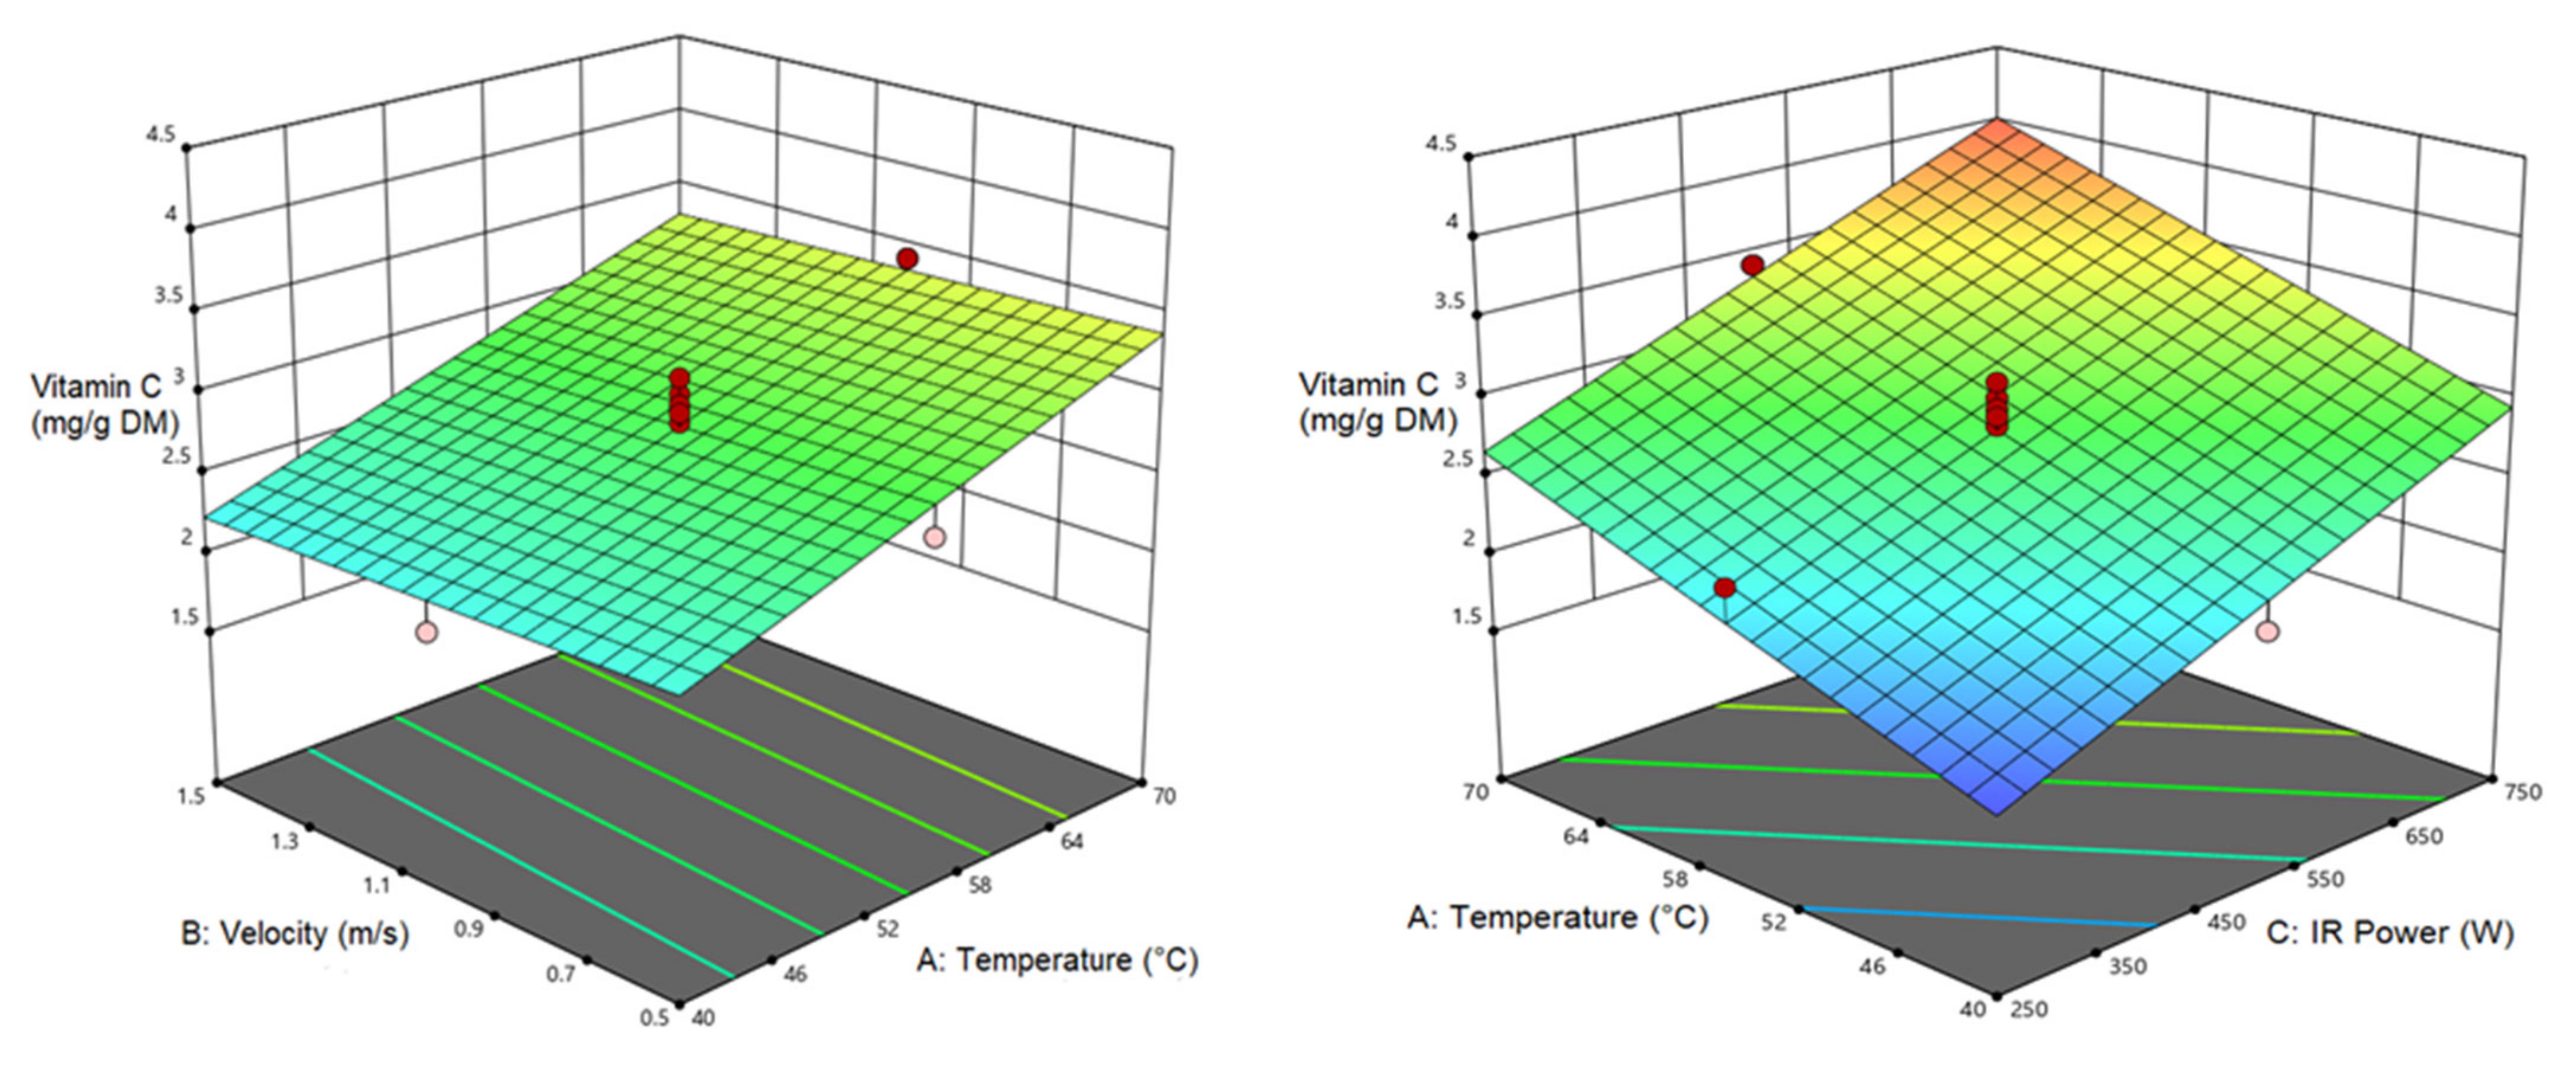
3.5. Vitamin C (VC)
3.6. Optimization
4. Conclusions
Author Contributions
Funding
Data Availability Statement
Conflicts of Interest
Nomenclature
| AA | % | Antioxidant activity |
| A | m2 | Tray area |
| AS | - | Absorbance values of the blank |
| At | - | Absorbance values of the sample |
| kJ/kg °C | Specific heat | |
| kJ | Energy consumption | |
| kJ | Mechanical energy | |
| kJ | Energy consumption in infrared dryer | |
| kJ | Energy consumption in convective dryer | |
| kJ | Thermal energy consumption | |
| K | W | IR power (W) |
| MCd.b | % d.b | Moisture content dry basis |
| kg | Weight loss | |
| % | Shrinkage | |
| kJ/kg | Energy consumption in CV/IR dryer | |
| V0 | cm3 | Initial volume |
| Vt | cm3 | Final volume |
| υ | m/s | Inlet air velocity |
| t | s | Drying time |
| kg | Weight of the sample before rehydration | |
| kg | Weight of the sample after rehydration | |
| Wi | kg | Initial weight of the samples |
| Wd | kg | Dry matter |
| kg/m3 | Air density | |
| ΔT | °C | Temperature difference |
| ΔP | mbar | Pressure difference |
| ΔL*, Δb*, Δa* | The difference between the color of fresh and dried samples |
References
- Monteiro, R.L.; Link, J.V.; Tribuzi, G.; Carciofi, B.A.; Laurindo, J.B. Microwave vacuum drying and multi-flash drying of pumpkin slices. J. Food Eng. 2018, 232, 1–10. [Google Scholar] [CrossRef]
- Seremet, L.; Botez, E.; Nistor, O.V.; Andronoiu, D.G.; Mocanu, G.D. Effect of different drying methods on moisture ratio and rehydration of pumpkin slices. Food Chem. 2016, 195, 104–109. [Google Scholar] [CrossRef]
- Chikpah, S.K.; Korese, J.K.; Sturm, B.; Hensel, O. Colour change kinetics of pumpkin (Cucurbita moschata) slices during convective air drying and bioactive compounds of the dried products. J. Agric. Food Res. 2022, 10, 100409. [Google Scholar] [CrossRef]
- Karlović, S.; Dujmić, F.; Rimac Brnčić, S.; Badanjak Sabolović, M.; Ninčević Grassino, A.; Škegro, M.; Šimić, M.A.; Brnčić, M. Mathematical modeling and optimization of ultrasonic pre-treatment for drying of pumpkin (Cucurbita moschata). Processes 2023, 11, 469. [Google Scholar] [CrossRef]
- Ahmad, G.; Khan, A.A. Pumpkin: Horticultural Importance and Its Roles in Various Forms: A Review. Int. J. Hortic. Agric. 2019, 4, 1–6. [Google Scholar] [CrossRef]
- Sharma, M.; Bhat, R. Extraction of carotenoids from pumpkin peel and pulp: Comparison between innovative green extraction technologies (ultrasonic and microwave-assisted extractions using corn oil). Foods 2021, 10, 787. [Google Scholar] [CrossRef]
- Ando, Y.; Okunishi, T.; Okadome, H. Influences of blanching and freezing pretreatments on moisture diffusivity and quality attributes of pumpkin slices during convective air-drying. Food Bioprocess Technol. 2019, 12, 1821–1831. [Google Scholar] [CrossRef]
- Igbozulike, A.O.; Amamgbo, N.; Oyinloye, G. Mathematical modelling of fluted pumpkin seed drying kinetics. Agric. Eng. Int. CIGR J. 2020, 22, 272–278. [Google Scholar]
- Carvalho, G.R.; Rojas, M.L.; Silveira, I.; Augusto, P.E.D. Drying accelerators to enhance processing and properties: Ethanol, isopropanol, acetone and acetic acid as pre-treatments to convective drying of pumpkin. Food Bioprocess Technol. 2020, 13, 1984–1996. [Google Scholar] [CrossRef]
- Bochnak, J.; Świeca, M. Potentially bioaccessible phenolics, antioxidant capacities and the colour of carrot, pumpkin and apple powders–effect of drying temperature and sample structure. Int. J. Food Sci. Technol. 2020, 15, 136–145. [Google Scholar] [CrossRef]
- Omari, A.; Behroozi-Khazaei, N.; Sharifian, F. Drying kinetic and artificial neural network modeling of mushroom drying process in microwave-hot air dryer. J. Food Process Eng. 2018, 41, e12849. [Google Scholar] [CrossRef]
- Qiu, L.; Zhang, M.; Ju, R.; Wang, Y.; Chitrakar, B.; Wang, B. Effect of different drying methods on the quality of restructured rose flower (Rosa rugosa) chips. Dry. Technol. 2020, 38, 1632–1643. [Google Scholar] [CrossRef]
- Choo, C.O.; Chua, B.L.; Figiel, A.; Jałoszyński, K.; Wojdyło, A.; Szumny, A.; Łyczko, J.; Chong, C.H. Hybrid drying of murraya koenigii leaves: Energy consumption, antioxidant capacity, profiling of volatile compounds and quality studies. Processes 2020, 8, 240. [Google Scholar] [CrossRef]
- Osae, R.; Zhou, C.; Xu, B.; Tchabo, W.; Tahir, H.E.; Mustapha, A.T.; Ma, H. Effects of ultrasound, osmotic dehydration, and osmosonication pretreatments on bioactive compounds, chemical characterization, enzyme inactivation, color, and antioxidant activity of dried ginger slices. J. Food Biochem. 2019, 43, e12832. [Google Scholar] [CrossRef]
- Sun, Y.; Zhang, M.; Mujumdar, A. Berry drying: Mechanism, pretreatment, drying technology, nutrient preservation, and mathematical models. Food Eng. Rev. 2019, 11, 61–77. [Google Scholar] [CrossRef]
- Khan, M.I.H.; Kumar, C.; Joardder, M.U.H.; Karim, M.A. Determination of appropriate effective diffusivity for different food materials. Dry. Technol. 2017, 35, 335–346. [Google Scholar] [CrossRef]
- Abraham-Juarez, M.; Olalde-Portugal, V.; Ceron-Garcia, A.; Sosa-Morales, M. Hot air drying kinetics of thin layers of prickly pear fruit paste. Sains Malays. 2019, 48, 361–367. [Google Scholar] [CrossRef]
- Katsoufi, S.; Lazou, A.E.; Giannakourou, M.C.; Krokida, M.K. Air drying kinetics and quality characteristics of osmodehydrated-candied pumpkins using alternative sweeteners. Dry. Technol. 2021, 39, 2194–2205. [Google Scholar] [CrossRef]
- Sharifian, F.; Nikbakht, A.M.; Arefi, A.; Modarres Motlagh, A. Experimental assessment of energy and mass transfer in microwave drying of fig fruit. J. Agr. Sci. Tech. 2015, 17, 1695–1705. [Google Scholar]
- Onwude, D.I.; Hashim, N.; Abdan, K.; Janius, R.; Chen, G. Experimental studies and mathematical simulation of intermittent infrared and convective drying of sweet potato (Ipomoea batatas L.). Food Bioprod. Process. 2019, 114, 163–174. [Google Scholar] [CrossRef]
- Obajemihi, O.I.; Cheng, J.-H.; Sun, D.-W. Novel sequential and simultaneous infrared accelerated drying technologies for the food industry: Principles, applications and challenges. Crit. Rev. Food Sci. Nutr. 2022, in press. [Google Scholar] [CrossRef] [PubMed]
- Kaveh, M.; Abbaspour-Gilandeh, Y. Impacts of hybrid (convective-infrared-rotary drum) drying on the quality attributes of green pea. J. Food Process Eng. 2020, 43, e13424. [Google Scholar] [CrossRef]
- Nanvakenari, S.; Movagharnejad, K.; Latifi, A. Modelling and experimental analysis of rice drying in new fluidized bed assisted hybrid infrared-microwave dryer. Food Res. Int. 2022, 159, 111617. [Google Scholar] [CrossRef] [PubMed]
- Nowacka, M.; Sledz, M.; Wiktor, A.; Witrowa-Rajchert, D. Changes of radical scavenging activity and polyphenols content during storage of dried apples. Int. J. Food Prop. 2014, 17, 1317–1331. [Google Scholar] [CrossRef]
- Xu, H.; Wu, M.; Wang, Y.; Wei, W.; Sun, D.; Li, D.; Zheng, Z.; Gao, F. Effect of combined infrared and hot air drying strategies on the quality of chrysanthemum (Chrysanthemum morifolium ramat.) cakes: Drying behavior, aroma profiles and phenolic compounds. Foods 2022, 11, 2240. [Google Scholar] [CrossRef] [PubMed]
- Jafarifar, M.; Chayjan, R.A.; Dibagar, N.; Alaei, B. Modelling some engineering properties of walnut kernel undergoing different drying methods with microwave pre-treatment. Qual. Assur. Saf. Crops Foods 2017, 9, 463–478. [Google Scholar] [CrossRef]
- EL-Mesery, H.S.; El-khawaga, S.E. Drying process on biomass: Evaluation of the drying performance and energy analysis of different dryers. Case Stud. Therm. Eng. 2022, 33, 101953. [Google Scholar] [CrossRef]
- Shi, H.; Zhang, M.; Mujumdar, A.S.; Xu, J.; Wang, W. Influence of drying methods on the drying kinetics, bioactive compounds and flavor of solidstate fermented okara. Dry. Technol. 2021, 39, 644–654. [Google Scholar] [CrossRef]
- Dibagar, N.; Kowalski, S.J.; Chayjan, R.A.; Figiel, A. Accelerated convective drying of sunflower seeds by high-power ultrasound: Experimental assessment and optimization approach. Food Bioprod. Process. 2020, 13, 42–59. [Google Scholar] [CrossRef]
- Majdi, H.; Esfahani, J.A. Energy consumption and drying time optimization of convective drying for performance improvement: Response surface methodology and lattice boltzmann method. J. Heat Transf. 2018, 140, 1020091. [Google Scholar] [CrossRef]
- Dibagar, N.; Chayjan, R.A. Rough rice convective drying enhancement by intervention of airborne ultrasound—A response surface strategy for experimental design and optimization. Dry. Technol. 2019, 37, 1097–1112. [Google Scholar] [CrossRef]
- Gharkhloo, Z.R.; Sharifian, F.; Rahimi, A.; Yamchi, A.A. Influence of high wave sound pretreatment on drying quality parameters of Echinacea root with infrared drying. J. Sci. Food Agric. 2022, 102, 2153–2164. [Google Scholar] [CrossRef] [PubMed]
- Aboud, S.A.; Altemimi, A.B.; Al-Hilphy, A.R.S.; Watson, D.G. Effect of batch infrared extraction pasteurizer (BIREP)-based processing on the quality preservation of dried lime juice. J. Food Process. Preserv. 2020, 44, e14759. [Google Scholar] [CrossRef]
- Namjoo, M.; Moradi, M.; Niakousari, M.; Karparvarfard, S.H. Ultrasound-assisted air drying of cumin seeds: Modeling and optimization by response surface method. Heat Mass Transf. 2022, in press. [Google Scholar] [CrossRef]
- Matys, A.; Dadan, M.; Witrowa-Rajchert, D.; Parniakov, O.; Wiktor, A. Response surface methodology as a tool for optimization of pulsed electric field pretreatment and microwave-convective drying of apple. Appl. Sci. 2022, 12, 3392. [Google Scholar] [CrossRef]
- Prashob, K.; Aniesrani Delfiya, D.S.; Murali, S.; Alfiya, P.V.; Samuel, M.P. Drying of shrimp using hot air-assisted continuous infrared drying system. J. Food Process. Preserv. 2022, 46, e16364. [Google Scholar] [CrossRef]
- Zahoor, I.; Khan, M.A. Microwave assisted fluidized bed drying of red bell pepper: Drying kinetics and optimization of process conditions using statistical models and response surface methodology. Sci. Hortic. 2021, 286, 110209. [Google Scholar] [CrossRef]
- Kukadiya, V.D.; Gojiya, D.K.; Sharma, G.P. Optimization of process parameters for infrared convective drying of ginger slices. Adv. Life Sci. 2016, 5, 6828–6833. [Google Scholar]
- Dhurve, P.; Suri, S.; Malakar, S.; Arora, V.K. Multi-objective optimization of process parameters of a hybrid IR-vibro fluidized bed dryer using RSM-DF and RSM-GA for recovery of bioactive compounds from pumpkin seeds. Biomass Convers. Biorefinery 2022, 1–17. [Google Scholar] [CrossRef]
- Wiktor, A.; Landfeld, A.; Matys, A.; Novotná, P.; Dadan, M.; Kováříková, E.; Nowacka, M.; Mulenko, M.; Witrowa-Rajchert, D.; Strohalm, J.; et al. Selected quality parameters of air-dried apples pretreated by high pressure, ultrasounds and pulsed electric field—A comparison study. Foods 2021, 10, 1943. [Google Scholar] [CrossRef]
- Rojas, M.L.; Silveira, I.; Augusto, P.E.D. Ultrasound and ethanol pre-treatments to improve convective drying: Drying, rehydration and carotenoid content of pumpkin. Food Bioprod. Process. 2020, 119, 20–30. [Google Scholar] [CrossRef]
- Abbaspour-Gilandeh, Y.; Kaveh, M.; Fatemi, H.; Hernández-Hernández, J.L.; Fuentes-Penna, A.; Hernández-Hernández, M. Evaluation of the changes in thermal, qualitative, and antioxidant properties of terebinth (Pistacia atlantica) fruit under different drying methods. Agronomy 2020, 10, 1378. [Google Scholar] [CrossRef]
- Motevali, A.; Jafari, H.; Molkabadi, E.Z. Comparison of environmental pollution and social cost analyses in different drying technologies. Int. J. Glob. Warm. 2020, 22, 1–29. [Google Scholar] [CrossRef]
- Ye, L.; EL-Mesery, H.S.; Ashfaq, M.M.; Shi, Y.; Zicheng, H.; Alshaer, W.G. Analysis of energy and specific energy requirements in various drying process of mint leaves. Case Stud. Therm. Eng. 2021, 26, 101113. [Google Scholar] [CrossRef]
- Rekik, C.; Besombes, C.; Hajji, W.; Gliguem, H.; Bellagha, S.; Mujumdar, A.C.; Allaf, K. Study of interval infrared airflow drying: A case study of butternut (Cucurbita moschata). LWT 2021, 147, 111486. [Google Scholar] [CrossRef]
- Oduola, A.A.; Bruce, R.M.; Shafiekhani, S.; Atungulu, G.G. Impacts of industrial microwave and infrared drying approaches on hemp (Cannabis sativa L.) quality and chemical components. Food Bioprod. Process. 2023, 137, 20–27. [Google Scholar] [CrossRef]
- Dehghannya, J.; Kadkhodaei, S.; Heshmati, M.K.; Ghanbarzadeh, B. Ultrasound-assisted intensification of a hybrid intermittent microwave—Hot air drying process of potato: Quality aspects and energy consumption. Ultrasonics 2019, 96, 104–122. [Google Scholar] [CrossRef] [PubMed]
- Geng, Z.; Torki, M.; Kaveh, M.; Beigi, M.; Yang, X. Characteristics and multi-objective optimization of carrot dehydration in a hybrid infrared/hot air dryer. LWT 2022, 172, 114229. [Google Scholar] [CrossRef]
- Xu, W.; Song, C.; Li, Z.; Song, F.; Hu, S.; Li, J.; Zhu, G.; Vijaya Raghavan, G.S. Temperature gradient control during microwave combined with hot air drying. Biosyst. Eng. 2018, 169, 175–187. [Google Scholar] [CrossRef]
- Bao, X.; Min, R.; Zhou, K.; Traffano-Schiffo, M.V.; Dong, Q.; Luo, W. Effects of vacuum drying assisted with condensation on drying characteristics and quality of apple slices. J. Food Eng. 2023, 340, 111286. [Google Scholar] [CrossRef]
- Rahmati, E.; Sharifian, F.; Fattahi, M. Process optimization of spray-dried Moldavian balm (Dracocephalum moldavica L.) extract powder. Food Sci. Nutr. 2020, 8, 6580–6591. [Google Scholar] [CrossRef]
- Bassey, E.J.; Cheng, J.-H.; Sun, D.-W. Thermoultrasound and microwave-assisted freeze-thaw pretreatments for improving infrared drying and quality characteristics of red dragon fruit slices. Ultrason. Sonochem. 2022, 91, 106225. [Google Scholar] [CrossRef] [PubMed]
- Onwude, D.I.; Hashim, N.; Abdan, K.; Janius, R.; Chen, G. Investigating the influence of novel drying methods on sweet potato (Ipomoea batatas L.): Kinetics, energy consumption, color, and microstructure. J. Food Process Eng. 2018, 41, e12686. [Google Scholar] [CrossRef]
- Rashid, M.T.; Jatoi, M.A.; Safdar, B.; Wali, A.; Aadil, R.M.; Sarpong, F.; Ma, H. Modeling the drying of ultrasound and glucose pretreated sweet potatoes: The impact on phytochemical and functional groups. Ultrason. Sonochem. 2020, 68, 105226. [Google Scholar] [CrossRef] [PubMed]
- Jafari, F.; Movagharnejad, K.; Sadeghi, E. Infrared drying effects on the quality of eggplant slices and process optimization using response surface methodology. Food Chem. 2020, 333, 127423. [Google Scholar] [CrossRef]
- Liu, Y.; Zeng, Y.; Wang, Q.; Sun, C.; Xi, H. Drying characteristics, microstructure, glass transition temperature, and quality of ultrasound-strengthened hot air drying on pear slices. J. Food Process. Preserv. 2019, 43, e13899. [Google Scholar] [CrossRef]
- Ghanem, N.; Mihoubi, D.; Bonazzi, C.; Kechaou, N.; Boudhrioua, N. Drying characteristics of lemon by-product (Citrus limon. v. lunari): Effects of drying modes on quality attributes kinetics. Waste Biomass Valoriz. 2020, 11, 303–322. [Google Scholar] [CrossRef]
- Adak, N.; Heybeli, N.; Ertekin, C. Infrared drying of strawberry. Food Chem. 2017, 219, 109–116. [Google Scholar] [CrossRef] [PubMed]
- Salehi, F.; Kashaninejad, M.; Jafarianlari, A. Drying kinetics and characteristics of combined infrared-vacuum drying of button mushroom slices. Heat Mass Transf. 2017, 53, 1751–1759. [Google Scholar] [CrossRef]
- Riadh, M.H.; Ahmad, S.A.B.; Marhaban, M.H.; Soh, A.C. Infrared heating in food drying: An overview. Dry. Technol. 2015, 33, 322–335. [Google Scholar] [CrossRef]
- Zhang, W.; Chen, C.; Pan, Z.; Zheng, Z. Vacuum and infrared-assisted hot air impingement drying for improving the processing performance and quality of Poria cocos (schw.) wolf cubes. Foods 2021, 10, 992. [Google Scholar] [CrossRef]
- Chen, J.; Venkitasamy, C.; Shen, Q.; McHugh, T.H.; Zhang, R.; Pan, Z. Development of healthy crispy carrot snacks using sequential infrared blanching and hot air drying method. LWT 2018, 97, 469–475. [Google Scholar] [CrossRef]
- Xu, Y.; Xiao, Y.; Lagnika, C.; Li, D.; Liu, C.; Jiang, N.; Song, J.; Zhang, M. A comparative evaluation of nutritional properties, antioxidant capacity and physical characteristics of cabbage (Brassica oleracea var. Capitate var L.) subjected to different drying methods. Food Chem. 2020, 39, 124935. [Google Scholar]
- EL-Mesery, H.S.; Kamel, R.M.; Alshaer, W.G. Thin-layer drying characteristics, modeling and quality attributes of tomato slices dried with infrared radiation heating. Biosci. J. 2022, 38, e38049. [Google Scholar] [CrossRef]
- Jia, Y.; Khalifa, I.; Hu, L.; Zhu, W.; Li, J.; Li, K.; Li, C. Influence of three different drying techniques on persimmon chips’ characteristics: A comparison study among hot-air, combined hot-air-microwave, and vacuum-freeze drying techniques. Food Bioprod. Process. 2019, 118, 67–76. [Google Scholar] [CrossRef]
- Ismail, O.; Kipcak, A.S.; Doymaz, I. Drying of okra by different drying methods: Comparison of drying time, product color quality, energy consumption and rehydration. Athens J. Sci. 2019, 6, 155–168. [Google Scholar] [CrossRef]
- Briki, S.; Zitouni, B.; Bechaa, B.; Amiali, M. Comparison of convective and infrared heating as means of drying pomegranate arils (Punica granatum L.). Heat Mass Transf. 2019, 55, 3189–3199. [Google Scholar] [CrossRef]
- EL-Mesery, H.S.; Sarpong, F.; Xu, W.; Elabd, M.A. Design of low-energy consumption hybrid dryer: A case study of garlic (Allium sativum) drying process. Case Stud. Therm. Eng. 2022, 33, 101929. [Google Scholar] [CrossRef]
- Wojdyło, A.; Figiel, A.; Lech, K.; Nowicka, P.; Oszmiański, J. Effect of convective and vacuum–microwave drying on the bioactive compounds, color, and antioxidant capacity of sour cherries. Food Bioprocess Technol. 2014, 7, 829–841. [Google Scholar] [CrossRef]
- Vega-Gálvez, A.; Poblete, J.; Quispe-Fuentes, I.; Uribe, E.; Bilbao-Sainz, C.; Pastén, A. Chemical and bioactive characterization of papaya (Vasconcellea pubescens) under different drying technologies: Evaluation of antioxidant and antidiabetic potential. J. Food Meas. Charact. 2019, 13, 1980–1990. [Google Scholar] [CrossRef]
- López, J.; Uribe, E.; Vega-Galvez, A.; Miranda, M.; Vergara, J.; Gonzalez, E.; Di Scala, K. Effect of air temperature on drying kinetics, vitamin c, antioxidant activity, total phenolic content, non-enzymatic browning and firmness of blueberries variety o’neil. Food Bioprocess Technol. 2010, 3, 772–777. [Google Scholar] [CrossRef]
- Rashidi, M.; Amiri Chaijan, R.; Ershadi, A.; Ghasemi, A. Modeling and optimization of vacuum-infrared dryer performance in production process of tomato compressed tablet: Chemical properties. Iran. J. Biosyst. Eng. 2020, 51, 571–584. [Google Scholar]
- Rashid, M.T.; Ma, H.; Jatoi, M.A.; Wali, A.; El-Mesery, H.S.; Ali, Z.; Sarpong, F. Effect of infrared drying with multifrequency ultrasound pretreatments on the stability of phytochemical properties, antioxidant potential, and textural quality of dried sweet potatoes. J. Food Biochem. 2019, 43, e12809. [Google Scholar] [CrossRef] [PubMed]
- Liu, Z.L.; Bai, J.W.; Yang, W.X.; Wang, J.; Deng, L.Z.; Yu, X.L.; Zheng, Z.A.; Gao, Z.J.; Xiao, H.W. Effect of high-humidity hot air impingement blanching (HHAIB) and drying parameters on drying characteristics and quality of broccoli florets. Dry. Technol. 2019, 37, 1251–1264. [Google Scholar] [CrossRef]
- Zeng, Y.; Liu, Y.; Zhang, J.; Xi, H.; Duan, X. Effects of far-infrared radiation temperature on drying characteristics, water status, microstructure and quality of kiwifruit slices. J. Food Meas. Charact. 2019, 13, 3086–3096. [Google Scholar] [CrossRef]
- Xi, C.; Hang, L.; Wei, P.; Zhongjie, Z.; Guangyue, R. Experiment and simulation research of storage for small grain steel silo. Int. J. Agric. Biol. Eng. 2016, 9, 170–178. [Google Scholar]


| Equation | Equation Number | References |
|---|---|---|
| (2) | [41] | |
| (3) | [42] | |
| (4) | [43] | |
| (5) | [44] | |
| (6) | [45] | |
| (7) | [46] |
| Independent Variables | Coded Variables | Levels | ||
|---|---|---|---|---|
| −1 | 0 | +1 | ||
| Air temperature (°C) | X1 | 40 | 55 | 70 |
| Air velocity (m/s) | X2 | 0.5 | 1 | 1.5 |
| IR power | X3 | 250 | 500 | 750 |
| Number | Air Temperature (°C) | Air Velocity (m/s) | IR Power (W) | SEC (MJ/kg) | Drying Time (Min) | Shrinkage (%) | RR | Color | TPC (mg GA/100 g dw) | AA (%) | VC (mg/g dw) |
|---|---|---|---|---|---|---|---|---|---|---|---|
| 1 | 40 | 1.5 | 750 | 64.74 | 130 | 31.29 | 2.79 | 20.29 | 540.35 | 63.69 | 3.11 |
| 2 | 55 | 1 | 500 | 45.54 | 130 | 33.34 | 3.24 | 22.11 | 488.88 | 66.89 | 2.89 |
| 3 | 55 | 1 | 250 | 51.71 | 170 | 40.40 | 2.22 | 26.65 | 420.24 | 54.56 | 2.35 |
| 4 | 55 | 1 | 500 | 44.32 | 120 | 31.25 | 3.2 | 20.25 | 468.65 | 70.11 | 2.64 |
| 5 | 40 | 0.5 | 750 | 29.92 | 170 | 34.49 | 2.66 | 22.22 | 539.19 | 60.68 | 2.96 |
| 6 | 55 | 1.5 | 500 | 58.8 | 120 | 35.59 | 3.26 | 23.35 | 466.69 | 62.69 | 2.45 |
| 7 | 55 | 1 | 500 | 42.11 | 125 | 32.23 | 3.44 | 21.29 | 501.21 | 67.25 | 2.83 |
| 8 | 70 | 0.5 | 750 | 24.52 | 75 | 22.54 | 4.98 | 14.25 | 611.29 | 83.24 | 4.11 |
| 9 | 55 | 0.5 | 500 | 29.26 | 140 | 34.57 | 3.11 | 24.23 | 486.34 | 64.57 | 2.65 |
| 10 | 40 | 1 | 500 | 54.04 | 180 | 42.24 | 2.29 | 25.22 | 444.35 | 55.11 | 2.08 |
| 11 | 55 | 1 | 750 | 41.91 | 95 | 29.29 | 4.22 | 18.23 | 545.55 | 73.80 | 3.19 |
| 12 | 55 | 1 | 500 | 46.54 | 130 | 35.56 | 2.95 | 23.05 | 455.88 | 66.52 | 2.94 |
| 13 | 70 | 0.5 | 250 | 32.31 | 120 | 29.45 | 2.56 | 25.2 | 485.65 | 60.61 | 2.67 |
| 14 | 55 | 1 | 500 | 48.25 | 135 | 38.87 | 3.15 | 22.04 | 482.50 | 62.50 | 3.01 |
| 15 | 55 | 1 | 500 | 50.50 | 140 | 33.14 | 3.33 | 21.9 | 497.25 | 60.99 | 3.11 |
| 16 | 70 | 1.5 | 250 | 57.83 | 100 | 34.59 | 2.77 | 26.01 | 480.57 | 64.59 | 2.44 |
| 17 | 70 | 1 | 500 | 39.53 | 80 | 28.87 | 3.76 | 20.21 | 570.30 | 75.25 | 3.42 |
| 18 | 70 | 1.5 | 750 | 39.32 | 60 | 25.11 | 4.66 | 15.01 | 605.59 | 82.25 | 4.08 |
| 19 | 40 | 0.5 | 250 | 49.19 | 250 | 49.95 | 1.75 | 32.07 | 388.96 | 49.92 | 1.64 |
| 20 | 40 | 1.5 | 250 | 80.36 | 230 | 47.89 | 1.82 | 30.22 | 393.34 | 51.59 | 1.57 |
| Source | Drying Time | SEC | Shrinkage | Color | RR | TPC | AA | VC |
|---|---|---|---|---|---|---|---|---|
| Model (p-value) | 0.0001 a | 0.0001 a | 0.0001 a | 0.0001 a | 0.0001 a | 0.0001 a | 0.0001 a | 0.0001 a |
| Lack of Fit (p-value) | 0.6159 ns | 0.5868 ns | 0.9985 ns | 0.3221 ns | 0.4103 ns | 0.8821 ns | 0.8137 ns | 0.3368 ns |
| R2 | 0.9853 | 0.9628 | 0.9476 | 0.9415 | 0.9603 | 0.9585 | 0.9147 | 0.9248 |
| Adj. R2 | 0.9801 | 0.9528 | 0.9337 | 0.9346 | 0.9528 | 0.9507 | 0.9047 | 0.916 |
| Predicted R2 | 0.964 | 0.9183 | 0.9315 | 0.9208 | 0.9327 | 0.9399 | 0.8796 | 0.9031 |
| C.V. | 4.96 | 6.12 | 5.07 | 4.9 | 5.89 | 2.76 | 4.27 | 6.73 |
| Std. Dev. | 6.69 | 2.85 | 1.75 | 1.11 | 0.18 | 13.61 | 2.77 | 0.19 |
| Source | Sum of Squares | df | Mean Square | F Value | p-Value Prob > F | |
|---|---|---|---|---|---|---|
| Model | 42,073.13 | 5 | 8414.63 | 187.92 | <0.0001 | significant |
| A-Air temperature | 27,562.50 | 1 | 27,562.50 | 615.55 | <0.0001 | |
| B-Velocity | 1322.50 | 1 | 1322.50 | 29.54 | <0.0001 | |
| C-IR power | 11,560.00 | 1 | 11,560.00 | 258.17 | <0.0001 | |
| AC | 1128.13 | 1 | 1128.13 | 25.19 | 0.0002 | |
| C2 | 500.00 | 1 | 500.00 | 11.17 | 0.0048 | |
| Residual | 626.87 | 14 | 44.78 | |||
| Lack of Fit | 376.87 | 9 | 41.87 | 0.84 | 0.6159 | not significant |
| Pure Error | 250.00 | 5 | 50.00 | |||
| Cor Total | 42,700.00 | 19 |
| Source | Sum of Squares | df | Mean Square | F Value | p-Value Prob > F | |
|---|---|---|---|---|---|---|
| Model | 3150.12 | 4 | 787.53 | 96.97 | <0.0001 | significant |
| A-Air Temperature | 717.82 | 1 | 717.82 | 88.38 | <0.0001 | |
| B-Velocity | 1845.92 | 1 | 1845.92 | 227.29 | <0.0001 | |
| C-IR power | 503.96 | 1 | 503.96 | 62.05 | <0.0001 | |
| AB | 82.43 | 1 | 82.43 | 10.15 | 0.0061 | |
| Residual | 121.82 | 15 | 8.12 | |||
| Lack of Fit | 78.32 | 10 | 7.83 | 0.90 | 0.5868 | not significant |
| Pure Error | 43.50 | 5 | 8.70 | |||
| Cor Total | 3271.95 | 19 |
| Source | Sum of Squares | df | Mean Square | F Value | p-Value Prob > F | |
|---|---|---|---|---|---|---|
| Model | 337.59 | 2 | 168.79 | 136.79 | <0.0001 | significant |
| A-Air Temperature | 86.08 | 1 | 86.08 | 69.76 | <0.0001 | |
| C-IR power | 251.50 | 1 | 251.50 | 203.82 | <0.0001 | |
| Residual | 20.98 | 17 | 1.23 | |||
| Lack of Fit | 16.59 | 12 | 1.38 | 1.58 | 0.3221 | not significant |
| Pure Error | 4.38 | 5 | 0.88 | |||
| Cor Total | 358.56 | 19 |
| Source | Sum of Squares | df | Mean Square | F Value | p-Value Prob > F | |
|---|---|---|---|---|---|---|
| Model | 832.87 | 4 | 208.22 | 67.88 | <0.0001 | significant |
| A-Air Temperature | 426.41 | 1 | 426.41 | 139.00 | <0.0001 | |
| C-IR power | 354.74 | 1 | 354.74 | 115.64 | <0.0001 | |
| AB | 21.03 | 1 | 21.03 | 6.85 | 0.0194 | |
| AC | 30.69 | 1 | 30.69 | 10.01 | 0.0064 | |
| Residual | 46.01 | 15 | 3.07 | |||
| Lack of Fit | 8.02 | 10 | 0.80 | 0.11 | 0.9985 | not significant |
| Pure Error | 38.00 | 5 | 7.60 | |||
| Cor Total | 878.88 | 19 |
| Source | Sum of Squares | df | Mean Square | F Value | p-Value Prob > F | |
|---|---|---|---|---|---|---|
| Model | 12.95 | 3 | 4.32 | 128.93 | <0.0001 | significant |
| A-Air temperature | 5.51 | 1 | 5.51 | 164.42 | <0.0001 | |
| C-IR power | 6.71 | 1 | 6.71 | 200.32 | <0.0001 | |
| AC | 0.74 | 1 | 0.74 | 22.04 | 0.0002 | |
| Residual | 0.54 | 16 | 0.033 | |||
| Lack of Fit | 0.40 | 11 | 0.036 | 1.30 | 0.4103 | not significant |
| Pure Error | 0.14 | 5 | 0.028 | |||
| Cor Total | 13.49 | 19 |
| Source | Sum of Squares | df | Mean Square | F Value | p-Value Prob > F | |
|---|---|---|---|---|---|---|
| Model | 68,356.50 | 3 | 22,785.50 | 123.06 | <0.0001 | significant |
| A-Air temperature | 19,999.68 | 1 | 19,999.68 | 108.01 | <0.0001 | |
| C-IR power | 45,321.17 | 1 | 45,321.17 | 244.77 | <0.0001 | |
| A2 | 3035.65 | 1 | 3035.65 | 16.39 | 0.0009 | |
| Residual | 2962.58 | 16 | 185.16 | |||
| Lack of Fit | 1453.87 | 11 | 132.17 | 0.44 | 0.8821 | not significant |
| Pure Error | 1508.71 | 5 | 301.74 | |||
| Cor Total | 71,319.08 | 19 |
| Source | Sum of Squares | df | Mean Square | F Value | p-Value Prob > F | |
|---|---|---|---|---|---|---|
| Model | 1400.46 | 2 | 700.23 | 91.18 | <0.0001 | significant |
| A-Air temperature | 721.65 | 1 | 721.65 | 93.97 | <0.0001 | |
| C-IR power | 678.81 | 1 | 678.81 | 88.39 | <0.0001 | |
| Residual | 130.56 | 17 | 7.68 | |||
| Lack of Fit | 74.20 | 12 | 6.18 | 0.55 | 0.8173 | not significant |
| Pure Error | 56.36 | 5 | 11.27 | |||
| Cor Total | 1531.02 | 19 |
| Source | Sum of Squares | df | Mean Square | F Value | p-Value Prob > F | |
|---|---|---|---|---|---|---|
| Model | 7.47 | 2 | 3.73 | 104.56 | <0.0001 | significant |
| A-Air Temperature | 2.87 | 1 | 2.87 | 80.43 | <0.0001 | |
| C-IR power | 4.60 | 1 | 4.60 | 128.70 | <0.0001 | |
| Residual | 0.61 | 17 | 0.036 | |||
| Lack of Fit | 0.48 | 12 | 0.040 | 1.52 | 0.3368 | not significant |
| Pure Error | 0.13 | 5 | 0.026 | |||
| Cor Total | 8.08 | 19 |
| IR Power (W) | Air Velocity (m/s) | Air Temperature (°C) | Drying Time (Min) | SEC (MJ/kg) | Color | Shrinkage (%) | RR | TPC (mg GA/100 g dw) | AA (%) | VC (mg/g dw) |
|---|---|---|---|---|---|---|---|---|---|---|
| 750 | 0.69 | 70 | 72.53 | 24.52 | 14.74 | 23 | 4.97 | 617.97 | 81.57 | 4.02 |
| Response | Intercept | A | B | C | AB | AC | BC | A2 | C2 |
|---|---|---|---|---|---|---|---|---|---|
| SEC | 46.53 | −8.472 a | 13.586 a | −7.099 a | −3.209 a | ||||
| Drying time | 130 | −52.5 a | −11.5 a | −34 a | 11.875 a | 10 a | |||
| Shrinkage | 34.53 | −6.53 a | −5.956 a | 1.621 b | 1.958 a | ||||
| Rehydration ratio | 3.108 | 0.742 a | 0.819 a | 0.303 a | |||||
| Color | 22.69 | −2.934 a | −5.015 a | ||||||
| TPC | 481.319 | 44.721 a | 67.321 a | 24.64 a | |||||
| Antioxidant capacity | 64.840 | 8.495 a | 8.239 a | ||||||
| Vitamin C | 2.807 | 0.536 a | 0.678 a |
Disclaimer/Publisher’s Note: The statements, opinions and data contained in all publications are solely those of the individual author(s) and contributor(s) and not of MDPI and/or the editor(s). MDPI and/or the editor(s) disclaim responsibility for any injury to people or property resulting from any ideas, methods, instructions or products referred to in the content. |
© 2023 by the authors. Licensee MDPI, Basel, Switzerland. This article is an open access article distributed under the terms and conditions of the Creative Commons Attribution (CC BY) license (https://creativecommons.org/licenses/by/4.0/).
Share and Cite
Joudi-Sarighayeh, F.; Abbaspour-Gilandeh, Y.; Kaveh, M.; Szymanek, M.; Kulig, R. Response Surface Methodology Approach for Predicting Convective/Infrared Drying, Quality, Bioactive and Vitamin C Characteristics of Pumpkin Slices. Foods 2023, 12, 1114. https://doi.org/10.3390/foods12051114
Joudi-Sarighayeh F, Abbaspour-Gilandeh Y, Kaveh M, Szymanek M, Kulig R. Response Surface Methodology Approach for Predicting Convective/Infrared Drying, Quality, Bioactive and Vitamin C Characteristics of Pumpkin Slices. Foods. 2023; 12(5):1114. https://doi.org/10.3390/foods12051114
Chicago/Turabian StyleJoudi-Sarighayeh, Fatemeh, Yousef Abbaspour-Gilandeh, Mohammad Kaveh, Mariusz Szymanek, and Ryszard Kulig. 2023. "Response Surface Methodology Approach for Predicting Convective/Infrared Drying, Quality, Bioactive and Vitamin C Characteristics of Pumpkin Slices" Foods 12, no. 5: 1114. https://doi.org/10.3390/foods12051114
APA StyleJoudi-Sarighayeh, F., Abbaspour-Gilandeh, Y., Kaveh, M., Szymanek, M., & Kulig, R. (2023). Response Surface Methodology Approach for Predicting Convective/Infrared Drying, Quality, Bioactive and Vitamin C Characteristics of Pumpkin Slices. Foods, 12(5), 1114. https://doi.org/10.3390/foods12051114