
Effect of Marjoram Leaf Powder Addition on Nutritional, Rheological, Textural, Structural, and Sensorial Properties of Extruded Rice Noodles
 , , ,
, , , 
Abstract
1. Introduction
2. Materials and Methods
2.1. Materials
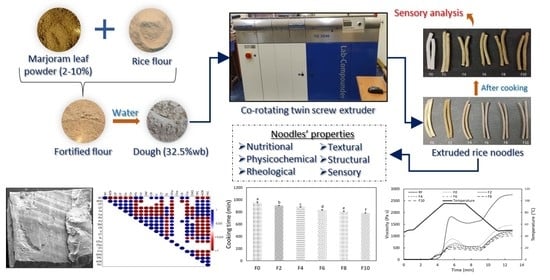
2.2. Preparation of Fortified Rice Noodles
2.3. Physicochemical Properties
2.3.1. Proximate Analysis
2.3.2. Color Characteristics
2.3.3. Water Absorption Index (WAI) and Water Solubility Index (WSI)
2.4. Rheological Properties
2.4.1. Pasting Properties
2.4.2. Dynamic Oscillatory Test
2.4.3. Steady Shear Analysis (SSA)
2.4.4. Creep Recovery Test
2.5. Microstructure
2.6. Cooking Characteristics
2.6.1. Cooking Time
2.6.2. Solid Loss and Water Absorption Ratio
2.7. Textural Analysis
2.8. Total Phenolic Content (TPC), Antioxidant (AOX) Capacity, and Total Flavonoid Content (TFC)
2.9. Fourier Transform Infrared (FTIR) Spectroscopy
2.10. X-ray Diffraction Analysis
2.11. Sensory Analysis
2.12. Statistical Analysis
3. Results and Discussion
3.1. Physicochemical Properties
3.1.1. Proximate Composition and Mineral Analysis
3.1.2. Color
3.1.3. Water Absorption Index (WAI) and Water Solubility Index (WSI)
3.2. Rheological Properties
3.2.1. Pasting Properties
3.2.2. Dynamic Rheological Properties
3.2.3. Creep and Steady Shear Analyses
3.3. Microstructure
3.4. Cooking Characteristics
3.5. Textural Properties
3.6. Total Phenolic Content (TPC), Antioxidant Capacity, and Total Flavonoid Content (TFC)
3.7. FTIR Analysis
3.8. XRD Analysis
3.9. Sensory Properties
3.10. Principal Component Analysis
4. Conclusions
Author Contributions
Funding
Data Availability Statement
Acknowledgments
Conflicts of Interest
References
- Cafasso, J.; Zimlich, R. What Is Iron-Deficiency Anemia? Available online: https://www.healthline.com/health/iron-deficiency-anemia (accessed on 1 September 2022).
- World Health Organization. Anaemia in Women and Children: WHO Global Anaemia Estimates, 2021 Edition. Available online: https://www.who.int/data/gho/data/themes/topics/anaemia_in_women_and_children (accessed on 10 September 2022).
- Sciences, I.I. For P. National Family Health Survey (NFHS-5) 2019–20: India. Available online: http://rchiips.org/nfhs/NFHS-5Reports/NFHS-5_INDIA_REPORT.pdf (accessed on 7 September 2022).
- Priya, S.R.N.; Sakthipriyadarshni, A.; Varghese, J.J.; Sanjana, R.; Mary, M.J.; Suvalakshmi, K.; Aarthy, S.; Jaynub, J. Optimization of Nutrient-Rich Herbal Noodles. In Sustainable Development in Energy and Environment; Sivasubramanian, V., Pugazhendhi, A., Moorthy, I.G., Eds.; Springer: Singapore, 2020; pp. 121–130. [Google Scholar]
- Kruger, J.; Taylor, J.R.N.; Ferruzzi, M.G.; Debelo, H. What Is Food-to-food Fortification? A Working Definition and Framework for Evaluation of Efficiency and Implementation of Best Practices. Compr. Rev. Food Sci. Food Saf. 2020, 19, 3618–3658. [Google Scholar] [CrossRef] [PubMed]
- Vishwakarma, S.; Dalbhagat, C.G.; Mandliya, S.; Mishra, H.N. Investigation of Natural Food Fortificants for Improving Various Properties of Fortified Foods: A Review. Food Res. Int. 2022, 156, 111186. [Google Scholar] [CrossRef] [PubMed]
- Vishwakarma, S.; Dalbhagat, C.G.; Mishra, H.N. Food-to-Food Fortification of Rice Flour (Swarna Cv.) Using Dried Basil, Marjoram, and Spearmint Leaves Powders: A Physicochemical and Nutritional Study. Biol. Life Sci. Forum 2021, 6, 15. [Google Scholar]
- Dalbhagat, C.G.; Mahato, D.K.; Mishra, H.N. Effect of Extrusion Processing on Physicochemical, Functional and Nutritional Characteristics of Rice and Rice-Based Products: A Review. Trends Food Sci. Technol. 2019, 85, 226–240. [Google Scholar] [CrossRef]
- Sakre, N.; Das, A.B.; Srivastav, P.P. Fuzzy Logic Approach for Process Optimization of Gluten-Free Pasta. J. Food Process. Preserv. 2016, 40, 840–849. [Google Scholar] [CrossRef]
- Namthongthai, P.; Ratphitagsanti, W.; Charunuch, C.; Kamonpatana, P. Development of Rice Spaghetti Using Propylene Glycol Alginate and Soy Flour by Twin- Screw Extrusion. KMUTNB Int. J. Appl. Sci. Technol. 2018, 11, 167–172. [Google Scholar] [CrossRef]
- Dalbhagat, C.G.; Mishra, H.N. Effects of Extrusion Process Conditions on System Parameters; Physicochemical Properties and Cooking Characteristics of Extruded Fortified Rice Kernels. J. Cereal Sci. 2019, 89, 102782. [Google Scholar] [CrossRef]
- Bouasla, A.; Wójtowicz, A.; Zidoune, M.N. Gluten-Free Precooked Rice Pasta Enriched with Legumes Flours: Physical Properties, Texture, Sensory Attributes and Microstructure. LWT 2017, 75, 569–577. [Google Scholar] [CrossRef]
- Liu, R.; Yang, G.; Guo, J.; Wu, T.; Sui, W.; Zhang, M. Effects of Incorporation of Black Garlic on Rheological, Textural and Sensory Properties of Rye (Secale cereale L.) Flour Noodles. CyTA-J. Food 2018, 16, 1102–1108. [Google Scholar] [CrossRef]
- Szydłowska-Tutaj, M.; Złotek, U.; Wójtowicz, A.; Combrzyński, M. The Effect of the Addition of Various Species of Mushrooms on the Physicochemical and Sensory Properties of Semolina Pasta. Food Funct. 2022, 13, 8425–8435. [Google Scholar] [CrossRef]
- Bhandari, M.; Sharma, R.; Sharma, S. Macromolecular–Structural Interactions and Phytochemical Constituents of Therapeutic Herbs in Pasta Altered the Functional Properties, Cooking Profile and in Vitro Starch and Protein Digestibility. Int. J. Food Sci. Technol. 2023, 58, 367–377. [Google Scholar] [CrossRef]
- AOAC International. Official Methods of Analysis of AOAC International, 18th ed.; AOAC International: Gaithersburg, MD, USA, 2005. [Google Scholar]
- Yadav, G.P.; Dalbhagat, C.G.; Mishra, H.N. Preparation of Low Glycemic Rice and Comparison of Its Physicochemical Properties, Cooking Characteristics, Starch Digestibility and Microstructure with Raw Rice (Swarna Cv). Food Sci. Eng. 2022, 4, 30–43. [Google Scholar] [CrossRef]
- Dalbhagat, C.G.; Mishra, H.N. Effect of the Drying Process on the Color Change, Fissure Development, and Morphology of Fortified Rice Kernels. J. Food Process. Eng. 2021, 44, e13719. [Google Scholar] [CrossRef]
- Mandliya, S.; Pratap-Singh, A.; Vishwakarma, S.; Dalbhagat, C.G.; Mishra, H.N. Incorporation of Mycelium (Pleurotus eryngii) in Pea Protein Based Low Moisture Meat Analogue: Effect on Its Physicochemical, Rehydration and Structural Properties. Foods 2022, 11, 2476. [Google Scholar] [CrossRef] [PubMed]
- Dalbhagat, C.G.; Mishra, H.N. Drying Modeling, Cooking Characteristics, Pasting Properties, and Crystallinity of Fortified Rice Kernels. J. Food Process. Preserv. 2021, 45, e15579. [Google Scholar] [CrossRef]
- Mariotti, M.; Sinelli, N.; Catenacci, F.; Pagani, M.A.; Lucisano, M. Retrogradation Behaviour of Milled and Brown Rice Pastes during Ageing. J. Cereal Sci. 2009, 49, 171–177. [Google Scholar] [CrossRef]
- Ma, M.; Xie, Y.; Wang, C. Effect of Anthocyanin-rich Extract from Black Soybean Coat on Wheat Dough Rheology and Noodle Texture. J. Food Process. Preserv. 2021, 45, e15007. [Google Scholar] [CrossRef]
- Mandliya, S.; Vishwakarma, S.; Mishra, H.N. Modeling of Vacuum Drying of Pressed Mycelium (Pleurotus eryngii) and Its Microstructure and Physicochemical Properties. J. Food Process. Eng. 2022, 45, e14124. [Google Scholar] [CrossRef]
- Vishwakarma, S.; Dalbhagat, C.G.; Mishra, H.N. Preparation of Skim Milk Powder Tablet and Finite Element Analysis of Its Pressing Die. J. Food Process. Eng. 2022, 45, e14016. [Google Scholar] [CrossRef]
- Nithya, A.; Dalbhagat, C.G.; Mishra, H.N. A Comparative Study on the Physicochemical, Cooking and Textural Properties of Fortified Rice Kernels Prepared from Raw and Parboiled Rice. Int. J. Food Sci. Technol. 2022, 57, 1325–1332. [Google Scholar] [CrossRef]
- Mandliya, S.; Majumdar, J.; Misra, S.; Pattnaik, M.; Niwas, H. Evaluation of Dry Microwave and Hot Water Blanching on Physicochemical, Textural, Functional and Organoleptic Properties of Indian Gooseberry (Phyllanthus emblica). J. Food Meas. Charact. 2023. [Google Scholar] [CrossRef]
- Dubey, A.; Kumar, A.; Rao, P.S. Development and Storage Study of Reduced Calorie Aloe Vera (Aloe barbadensis Miller) Based Pineapple Fruit Jam. J. Food Meas. Charact. 2021, 15, 961–975. [Google Scholar] [CrossRef]
- Bouajila, A.; Lamine, M.; Rahali, F.; Melki, I.; Prakash, G.; Ghorbel, A. Pearl Millet Populations Characterized by Fusarium Prevalence, Morphological Traits, Phenolic Content, and Antioxidant Potential. J. Sci. Food Agric. 2020, 100, 4172–4181. [Google Scholar] [CrossRef] [PubMed]
- Yadav, G.P.; Dalbhagat, C.G.; Mishra, H.N. Development of Instant Low Glycemic Rice Using Extrusion Technology and Its Characterization. J. Food Process. Preserv. 2021, 45, e16077. [Google Scholar] [CrossRef]
- Lisiecka, K.; Wójtowicz, A.; Dziki, D.; Gawlik-Dziki, U. The Influence of Cistus incanus L. Leaves on Wheat Pasta Quality. J. Food Sci. Technol. 2019, 56, 4311–4322. [Google Scholar] [CrossRef]
- Sun, X.; Koksel, F.; Nickerson, M.T.; Scanlon, M.G. Modeling the Viscoelastic Behavior of Wheat Flour Dough Prepared from a Wide Range of Formulations. Food Hydrocoll. 2020, 98, 105129. [Google Scholar] [CrossRef]
- Hajipour, A.; Salehi, M.B.; Sefti, M.V.; Heidari, A. Experimental Study of Polyacrylamide Gel in Close-in Well Operation. Polym. Adv. Technol. 2018, 29, 1278–1286. [Google Scholar] [CrossRef]
- Feng, T.; Gu, Z.; Jin, Z.; Zhuang, H. Rheological Properties of Cereal Starch Gels and Mesona Blumes Gum Mixtures. Starch-Stärke 2010, 62, 480–488. [Google Scholar] [CrossRef]
- Rathod, R.P.; Annapure, U.S. Physicochemical Properties, Protein and Starch Digestibility of Lentil Based Noodle Prepared by Using Extrusion Processing. LWT 2017, 80, 121–130. [Google Scholar] [CrossRef]
- Derbie, A.; Young, A.; Keum, S.; Kumar, R. A Comprehensive Study of Polyphenols Contents and Antioxidant Potential of 39 Widely Used Spices and Food Condiments. J. Food Meas. Charact. 2018, 12, 1548–1555. [Google Scholar] [CrossRef]
- Zhang, R.; Khan, S.A.; Chi, J.; Wei, Z.; Zhang, Y.; Deng, Y.; Liu, L.; Zhang, M. Different Effects of Extrusion on the Phenolic Profiles and Antioxidant Activity in Milled Fractions of Brown Rice. LWT 2018, 88, 64–70. [Google Scholar] [CrossRef]
- Lu, X.; Ma, R.; Zhan, J.; Jin, Z.; Tian, Y. Mechanism of Peptides from Rice Hydrolyzed Proteins Hindering Starch Digestion Subjected to Hydrothermal Treatment. npj Sci. Food 2022, 6, 37. [Google Scholar] [CrossRef] [PubMed]
- Geng, D.-H.; Zhang, X.; Gan, J.; Wang, C.; Jia, X.; Tang, N.; Cheng, Y. Understanding the Texture and Digestibility Attributes of Rice Noodles Supplemented with Common Vetch Starch. Int. J. Biol. Macromol. 2022, 222, 772–782. [Google Scholar] [CrossRef] [PubMed]
- Govender, L.; Siwela, M. The Effect of Moringa Oleifera Leaf Powder on the Physical Quality, Nutritional Composition and Consumer Acceptability of White and Brown Breads. Foods 2020, 9, 1910. [Google Scholar] [CrossRef] [PubMed]


| Property | Moisture (g/100 g) | Crude Protein (g/100 g) | Crude Fiber (g/100 g) | Crude Fat (g/100 g) | Ash (g/100 g) | Carbohydrate (g/100 g) | Fe (mg/100 g) | Zn (mg/100 g) | Ca (mg/100 g) |
|---|---|---|---|---|---|---|---|---|---|
| RF | 12.08 A ± 0.13 | 7.00 C ± 0.07 | 0.45 G ± 0.06 | 0.06 F ± 0.01 | 0.34 G ± 0.06 | 80.08 C ± 0.08 | 0.22 G ± 0.03 | 1.19 B ± 0.12 | 6.00 G ± 0.10 |
| MLP | 10.52 D ± 0.17 | 9.72 A ± 0.03 | 16.15 A ± 0.03 | 2.92 A ± 0.03 | 12.05 A ± 0.03 | 48.63 G ± 0.07 | 53.32 A ± 0.13 | 3.49 A ± 0.30 | 200.00 A ± 0.50 |
| F0 | 11.08 cC ± 0.23 | 6.37 bD ± 0.11 | 0.41 fG ± 0.05 | 0.05 eF ± 0.03 | 0.31 fG ± 0.05 | 81.78 aA ± 0.06 | 0.21 fG ± 0.02 | 1.13 dB ± 0.05 | 5.70 fG ± 0.05 |
| F2 | 11.61 abAB ± 0.06 | 6.44 bD ± 0.07 | 0.72 eF ± 0.06 | 0.11 deEF ± 0.03 | 0.54 eF ± 0.06 | 80.58 bB ± 0.17 | 1.27 eF ± 0.01 | 1.18 cdB ± 0.06 | 9.59 eF ± 0.06 |
| F4 | 11.37 bcBC ± 0.17 | 7.11 aBC ± 0.03 | 1.08 dE ± 0.06 | 0.17 cdDE ± 0.02 | 0.81 dE ± 0.06 | 79.47 cD ± 0.03 | 2.34 dE ± 0.01 | 1.28 bcB ± 0.06 | 13.76 dE ± 0.06 |
| F6 | 11.37 bcBC ± 0.26 | 7.16 aBC ± 0.05 | 1.39 cD ± 0.03 | 0.23 bcCD ± 0.03 | 1.04 cD ± 0.03 | 78.81 dE ± 0.15 | 3.41 cD ± 0.03 | 1.33 abB ± 0.03 | 17.64 cD ± 0.03 |
| F8 | 11.95 aA ± 0.08 | 7.22 aB ± 0.02 | 1.71 bC ± 0.02 | 0.28 abBC ± 0.03 | 1.27 bC ± 0.02 | 77.57 eF ± 0.01 | 4.47 bC ± 0.01 | 1.37 abB ± 0.02 | 21.52 bC ± 0.02 |
| F10 | 11.26 bcBC ± 0.18 | 7.27 aB ± 0.03 | 2.02 aB ± 0.03 | 0.34 aB ± 0.03 | 1.51 aB ± 0.03 | 77.60 eF ± 0.06 | 5.53 aB ± 0.01 | 1.42 aB ± 0.03 | 25.40 aB ± 0.03 |
| Sample | L | a | b | ΔE | WI |
|---|---|---|---|---|---|
| RF | 96.69 A ± 0.08 | −0.22 F ± 0.04 | 5.55 E ± 0.10 | - | 93.53 A ± 0.11 |
| MLP | 49.00 F ± 0.61 | 2.00 D ± 0.07 | 25.65 A ± 0.54 | - | 42.88 F ± 0.31 |
| F0 | 80.16 aB ± 0.82 | 0.22 dE ± 0.07 | 14.16 cD ± 0.52 | - | 75.63 aB ± 1.15 |
| F2 | 64.93 bC ± 0.31 | 3.01 cC ± 0.07 | 22.91 aB ± 0.29 | 17.79 d ± 0.51 | 58.00 bC ± 0.52 |
| F4 | 57.26 cD ± 0.04 | 3.91 bB ± 0.01 | 23.67 aB ± 0.10 | 25.07 c ± 0.07 | 50.99 cD ± 0.08 |
| F6 | 51.52 dE ± 0.46 | 3.91 bB ± 0.01 | 22.99 aB ± 0.22 | 30.21 b ± 0.48 | 46.20 dE ± 0.42 |
| F8 | 48.52 eF ± 0.36 | 4.87 aA ± 0.07 | 21.71 bC ± 0.08 | 33.40 a ± 0.42 | 43.40 eF ± 0.39 |
| F10 | 48.48 eF ± 0.06 | 4.71 aA ± 0.02 | 21.67 bC ± 0.03 | 32.87 a ± 0.08 | 43.91 eF ± 0.09 |
| Sample | WAI (g/g) | WSI (%) |
|---|---|---|
| RF | 2.43 C ± 0.01 | 2.02 CD ± 0.49 |
| MLP | 4.55 A ± 0.02 | 25.51 A ± 0.94 |
| F0 | 3.11 aB ± 0.22 | 1.25 dB ± 0.11 |
| F2 | 2.97 aB ± 0.24 | 3.02 cBC ± 0.08 |
| F4 | 3.01 aB ± 0.08 | 3.40 bB ± 0.11 |
| F6 | 2.92 aB ± 0.26 | 3.51 bB ± 0.15 |
| F8 | 2.93 aB ± 0.05 | 3.95 aB ± 0.01 |
| F10 | 2.89 aB ± 0.34 | 4.00 aB ± 0.13 |
| Sample | Peak Temp (°C) | Peak Viscosity (Pas) | Holding Strength (Pas) | Breakdown (Pas) | Final Viscosity (Pas) | Setback from Peak (Pas) | Setback from Trough (Pas) |
|---|---|---|---|---|---|---|---|
| RF | 95.30 A ± 0 | 2187.00 A ± 41.01 | 1453.00 A ± 18.38 | 734.00 A ± 22.34 | 3164.00 A ± 80.61 | 976.40 C ± 39.03 | 2430.00 A ± 57.98 |
| F0 | 95.15 aB ± 0.07 | 831.75 aB ± 70.22 | 555.95 aB ± 21.14 | 275.85 aB ± 91.29 | 1415.50 aB ± 74.25 | 583.25 bB ± 4.03 | 1139.00 aB ± 16.97 |
| F2 | 95.10 aB ± 0 | 705.90 abBC ± 4.81 | 516.75 abBC ± 4.60 | 189.15 abBC ± 0.21 | 1194.00 bcCD ± 5.66 | 488.40 aA ± 0.99 | 1005.00 bcBC ± 5.66 |
| F4 | 95.10 aB ± 0 | 642.90 bcCD ± 24.75 | 515.75 abBC ± 10.54 | 127.15 abC ± 14.35 | 1220.00 bC ± 5.66 | 577.25 bAB ± 18.88 | 1093.00 abBC ± 8.49 |
| F6 | 95.10 aB ± 0 | 563.45 cdDE ± 4.17 | 470.15 bcCD ± 1.77 | 93.35 bC ± 5.9 | 1147.00 bcdCD ± 8.49 | 583.70 bB ± 12.73 | 1054.00 abcBC ± 14.14 |
| F8 | 95.20 aAB ± 0 | 509.95 cdDE ± 12.37 | 422.50 cD ± 20.51 | 87.41 bC ± 8.19 | 1055.00 cdCD ± 55.15 | 545.15 abAB ± 42.36 | 967.60 cC ± 62.79 |
| F10 | 95.10 aB ± 0 | 477.50 dE ± 33.66 | 408.00 cD ± 23.48 | 69.50 bC ± 10.25 | 1030.00 dD ± 22.63 | 552.85 abAB ± 10.96 | 960.80 cC ± 12.45 |
| Sample | Uncooked | Cooked | ||||
|---|---|---|---|---|---|---|
| Hardness (N) | Hardness (N) | Adhesiveness (J × 10−3) | Gumminess (N) | Chewiness (J × 10−3) | Cohesiveness | |
| F0 | 117.04 a ± 9.86 | 17.41 ab ± 0.47 | 0.43 a ± 0.15 | 10.65 ab ± 1.94 | 204.93 a ± 55.01 | 0.61 ab ± 0.10 |
| F2 | 111.26 ab ± 16.17 | 16.80 b ± 0.39 | 0.27 a ± 0.12 | 12.40 a ± 1.12 | 10.63 b ± 1.19 | 0.74 a ± 0.06 |
| F4 | 94.31 b ± 12.54 | 15.87 b ± 0.22 | 0.13 a ± 0.06 | 10.54 ab ± 0.11 | 8.63 b ± 0.55 | 0.66 ab ± 0.01 |
| F6 | 66.96 c ± 15.58 | 16.31 b ± 0.58 | 0.27 a ± 0.06 | 9.89 ab ± 0.42 | 8.10 b ± 0.30 | 0.60 ab ± 0.04 |
| F8 | 68.13 c ± 6.51 | 17.03 b ± 0.68 | 0.43 a ± 0.21 | 8.63 b ± 0.62 | 6.43 b ± 0.49 | 0.51 b ± 0.06 |
| F10 | 70.58 c ± 12.59 | 19.30 a ± 1.34 | 0.20 a ± 0.17 | 9.97 ab ± 0.75 | 7.53 b ± 0.46 | 0.52 b ± 0.03 |
| Sample | TPC (mg GAE/g DW) | AOX (mg GAE/g DW) | TFC (mg QE/g DW) |
|---|---|---|---|
| RF | 2.1242 B ± 0.1717 | 0.02010 B ± 0.0006 | 0.0949 B ± 0.0712 |
| MLP | 350.8222 A ± 39.6955 | 113.0690 A ± 0.9616 | 10.0362 A ± 0.6436 |
| F0 | 2.2340 fB ± 0.0174 | 0.0484 eB ± 0.0044 | 0.1068 fB ± 0.0119 |
| F2 | 5.4715 eB ± 0.1502 | 0.0570 dB ± 0.0013 | 0.1632 eB ± 0.003 |
| F4 | 9.1300 dB ± 0.0322 | 0.0630 cdB ± 0.0027 | 0.2492 dB ± 0.0059 |
| F6 | 12.6489 cB ± 0.0107 | 0.0689 bcB ± 0.0013 | 0.3842 cB ± 0.0034 |
| F8 | 16.4146 bB ± 0.2789 | 0.0727 bB ± 0.0015 | 0.4606 bB ± 0.0066 |
| F10 | 19.1511 aB ± 0.0561 | 0.0823 aB ± 0.0024 | 0.5100 aB ± 0.0017 |
| Sample | Absorbance | Absorbance Ratio | |||
|---|---|---|---|---|---|
| A995 | A1022 | A1047 | R1047/1022 | R1022/995 | |
| RF | 0.411 | 0.435 | 0.385 | 0.88 | 1.058 |
| MLP | 0.123 | 0.157 | 0.158 | 1.01 | 1.276 |
| F0 | 0.098 | 0.103 | 0.097 | 0.94 | 1.050 |
| F2 | 0.106 | 0.108 | 0.103 | 0.96 | 1.022 |
| F4 | 0.070 | 0.071 | 0.065 | 0.92 | 1.013 |
| F6 | 0.089 | 0.090 | 0.088 | 0.98 | 1.016 |
| F8 | 0.148 | 0.152 | 0.144 | 0.95 | 1.029 |
| F10 | 0.410 | 0.431 | 0.401 | 0.93 | 1.050 |
| Sample | Color | Appearance | Stickiness | Aroma | Taste | Texture | Overall Acceptability |
|---|---|---|---|---|---|---|---|
| F0 | 8.00 a ± 0.89 | 6.18 abc ± 1.33 | 6.18 ab ± 1.54 | 5.36 c ± 0.81 | 7.09 a ± 0.83 | 6.64 a ± 1.69 | 7.00 ab ± 1.25 |
| F2 | 7.64 a ± 1.03 | 7.82 a ± 1.47 | 7.36 a ± 1.43 | 6.73 ab ± 0.90 | 6.64 ab ± 0.81 | 7.45 a ± 0.82 | 7.82 a ± 0.75 |
| F4 | 7.64 a ± 0.81 | 7.00 ab ± 1.84 | 7.27 a ± 0.79 | 7.27 a ± 0.79 | 6.00 ab ± 0.63 | 6.36 ab ± 0.81 | 6.45 b ± 0.52 |
| F6 | 5.45 b ± 1.86 | 5.27 bcd ± 2.05 | 6.09 ab ± 1.14 | 6.91 ab ± 0.83 | 5.82 b ± 0.75 | 6.00 ab ± 1.41 | 5.82 b ± 0.40 |
| F8 | 4.73 bc ± 2.10 | 4.45 cd ± 2.58 | 5.45 b ± 1.37 | 6.00 bc ± 0.63 | 5.45 bc ± 1.13 | 5.09 b ± 1.22 | 4.55 c ± 0.82 |
| F10 | 3.36 c ± 2.06 | 3.73 d ± 2.05 | 4.82 b ± 1.17 | 5.82 bc ± 1.40 | 4.45 c ± 1.44 | 5.00 b ± 0.80 | 3.09 d ± 1.45 |
Disclaimer/Publisher’s Note: The statements, opinions and data contained in all publications are solely those of the individual author(s) and contributor(s) and not of MDPI and/or the editor(s). MDPI and/or the editor(s) disclaim responsibility for any injury to people or property resulting from any ideas, methods, instructions or products referred to in the content. |
© 2023 by the authors. Licensee MDPI, Basel, Switzerland. This article is an open access article distributed under the terms and conditions of the Creative Commons Attribution (CC BY) license (https://creativecommons.org/licenses/by/4.0/).
Share and Cite
Vishwakarma, S.; Mandliya, S.; Dalbhagat, C.G.; Majumdar, J.; Mishra, H.N. Effect of Marjoram Leaf Powder Addition on Nutritional, Rheological, Textural, Structural, and Sensorial Properties of Extruded Rice Noodles. Foods 2023, 12, 1099. https://doi.org/10.3390/foods12051099
Vishwakarma S, Mandliya S, Dalbhagat CG, Majumdar J, Mishra HN. Effect of Marjoram Leaf Powder Addition on Nutritional, Rheological, Textural, Structural, and Sensorial Properties of Extruded Rice Noodles. Foods. 2023; 12(5):1099. https://doi.org/10.3390/foods12051099
Chicago/Turabian StyleVishwakarma, Siddharth, Shubham Mandliya, Chandrakant Genu Dalbhagat, Jayshree Majumdar, and Hari Niwas Mishra. 2023. "Effect of Marjoram Leaf Powder Addition on Nutritional, Rheological, Textural, Structural, and Sensorial Properties of Extruded Rice Noodles" Foods 12, no. 5: 1099. https://doi.org/10.3390/foods12051099
APA StyleVishwakarma, S., Mandliya, S., Dalbhagat, C. G., Majumdar, J., & Mishra, H. N. (2023). Effect of Marjoram Leaf Powder Addition on Nutritional, Rheological, Textural, Structural, and Sensorial Properties of Extruded Rice Noodles. Foods, 12(5), 1099. https://doi.org/10.3390/foods12051099