1. Introduction
The roasting of beans of the
Theobroma cacao [
1] variety is an essential processing step in the production of chocolate. Traditionally, cocoa beans, or cocoa nibs, are roasted by means of convection and/or conduction. This heat treatment, which is typically applied at a temperature range from 110 to 160 °C for approximately half an hour, is responsible for the moisture content reduction and the development of the typical cocoa flavor due to the Maillard reaction taking place during roasting, leading to the formation of compounds such as methylpyrazines and Strecker aldehydes [
2,
3,
4]. However, research has shown that this easily applicable process is accompanied by several drawbacks. Specifically, the heat transfer from outside towards the inside of the beans can result in a burnt surface, whereas the center might be less affected. Hence, a non-homogenous bean heating occurs, which could result in potentially enhanced bitterness. In addition, the heating efficiency within the beans is rather low. This phenomenon is typically observed in high fat products, such as cocoa beans, because of their poor rate of heat transfer [
5,
6]. Furthermore, this roasting process leads to the transfer of a respectable amount of cocoa butter to the outer shell, which is economically disadvantageous [
7].
To overcome these disadvantages, several alternatives were proposed. One of the promising substitutes for the conventional roasting methods is microwave roasting, as it is believed to be more energy-efficient [
5]. By applying electromagnetic radiation in the form of microwaves, which have frequencies between 300 MHz and 300 GHz, heat is created in the entire bean via ionic polarization and dipole rotation [
8]. The suitability of this technique to roast cocoa beans mainly relies on the high fat content of this product. The low specific heat of fats results in a relatively low heat requirement to increase the temperature of the product [
9,
10]. Despite the auspicious character of microwave roasting, the available literature regarding this topic is rather scarce. Specifically, no research was found to investigate the effect on the sensory perception of chocolate produced from cocoa beans roasted via this alternative technique.
The goal of this explorative research is to study the flavor perception of chocolate produced from microwave roasted cocoa beans. A trained panel and chocolate consumers were both used to perform a sensory analysis of the chocolates in order to obtain insights regarding the perceived flavor profile by means of analytical and affective tests. In addition, physical properties, such as dry matter, color, hardness, melting, and viscosity, were measured to investigate if chocolate produced from microwave roasted cocoa beans could be of comparable quality to chocolate made from convectively roasted beans.
2. Materials and Methods
2.1. Coco Bean Roasting
Two promising treatments were selected based upon results from an earlier study which compared multiple treatments varying in time/power/temperature [
7]. Both chocolates were produced from fermented and dried cocoa beans (origin: Ecuador, variety: mixed) provided by Cargill (Schiphol, The Netherlands). The first type of chocolate was produced from cocoa beans that were convectively roasted in batches of 2 kg for 30 min at 130 °C in a drum roaster (Roaster 102, Selmi Group, Santa Vittoria d’Alba, Italy) and reached a dry matter content of 98%
w/
w. The second type of chocolate was produced from cocoa beans that were roasted in batches of 900 g in a domestic microwave (MC32K7085KT, Samsung, Seoul, Republic of Korea) for 35 min at 600 W, and in this way, a similar, non-significant (
p > 0.05) dry matter content (98 %
w/
w) was obtained.
2.2. Chocolate Production
Roasted cocoa beans were winnowed (Winn-15 Mini Winnower, Cacao Cucina®, Bottom Line Process Technologies, Inc., Clearwater, FL, USA) and, subsequently, the cocoa nibs were subjected to a coarse grinding (UMC5 Stephan mixer, Stephan bvba, Nazareth, Belgium) and a fine grinding step (W-1-S ball mill, Royal Duyvis Wiener, Koog aan de Zaan, The Netherlands) to produce cocoa liquor. The cocoa liquors were then used to produce 70% cocoa dark chocolate on a 5 kg scale, with the following composition: 30% sugar, 64.65% cocoa liquor, 5% cocoa butter (CB), and 0.35% soy lecithin. The chocolate production process consisted of mixing, refining, conching, tempering, and molding steps.
2.2.1. Mixing
In the mixing step, pre-broken sugar (Barry Callebaut, Wieze, Belgium) and cocoa liquor were blended in a VEMA BM 30/20 planetary mixer (Machinery Verhoest NV/Vema Construct, Izegem, Belgium) at 45 °C for 20 min, with a fat content of up to 22% w/w.
2.2.2. Refining
The resulting dough-like paste was fed onto the Exakt 80S three-roll refiner (Exakt Apparatebau GmbH & Co., KG, Norderstedt, Germany) with a roll distance setting of 2-1. Refining was performed at 35 °C and 400 rpm.
2.2.3. Conching
A Buhler Elk’Olino conche (Richard Frisse GmbH, Bad Salzuen, Germany) device was used to carry out the conching process. During the dry conching step, the refined flakes were conched at 55 °C and 1200 rpm in the clockwise direction (mixing phase) for 2 h and then at 80 °C and 1200 rpm in the counterclockwise direction (shearing phase) for 4 h, and both steps were performed with an open lid. During this process, the consistency of the mass was periodically observed. If it was perceived as too dry by a skilled operator, extra cocoa butter (Belcolade, Erembodegem, Belgium) was added to improve mixing. Indicators of a too dry mass are a powdery consistency, persisting distinct balls, or the attachment of lumps on the mixing element [
11]. If necessary, the addition was performed in small increments to prevent it from becoming too fluid, as this may hinder the evaporation of moisture and undesired volatile acids. The added cocoa butter was considered in the following wet conching phase to assure that the amount of total fat in the system was consistent in all four productions. As for the wet conching stage, the rest of the ingredients were added as follows: pre-conched cocoa liquor (i.e., cocoa liquor not added during mixing but separately conched at 80 °C for 4 h and 1200 rpm in the counterclockwise direction), the remaining cocoa butter, and 0.35% lecithin (Soya International Ltd., Cheshire, UK). The liquefaction of the chocolate samples was performed with a closed lid twice for 15 min at 45 °C and 2400 rpm, whereby a mixing step was followed by a shearing step.
2.2.4. Tempering and (De)Molding
The resulting chocolate samples were tempered manually on a marble table. The tempered chocolates were molded into square-shaped tablets (33 mm × 33 mm × 3 mm) and were cooled in a thermostatic cabinet for at least 1 h at 12 °C. This cooling process was necessary to promote further crystallization of the βV crystals in order to facilitate demolding. The next day, aluminum foil was used to wrap the chocolates to prevent quality changes during storage. The chocolates were matured for at least 2 weeks in a thermostatic cabinet at 15 °C before further analyses.
2.3. Sensory Evaluation
2.3.1. Trained Panel
The trained panel used in this study was established in 2017. Recruitment and intensive trainings were carried out, as described in the manuscript of Rottiers [
12]. Participants provided informed consent and the study complied with the principles established by the Declaration of Helsinki and in respect of the EU General Data Protection Regulation (GDPR). The study was approved by the Ethics Committee of Ghent University Hospital (B670201835745). A discriminative triangle test [
13] was conducted using the EyeQuestion software (Logic8 B.V., Elst, The Netherlands) by the trained panel to investigate whether the chocolates were distinguishable. This test was performed in triplicate and performed once by 18, once by 17, and once by 16 panel members. The varying number of total panel members performing these sensory tests is related to certain assessors experiencing health-related issues at the time of tasting (due to the COVID-19 pandemic). All samples of the triangle tests were delivered to the testers’ homes, and at-home tests were conducted, when an undisturbed environment could be guaranteed. The samples were coded using random 3-digit numbers and presented following a Williams Latin square design [
14].
2.3.2. Consumer Panel
Recruitment
Potential tasters were recruited via e-mail and selected when they fulfilled the selection criteria (e.g., absence of nut allergy). In total, 130 persons participated the consumer test, with a gender distribution of 60/40 (women/men). All participants were dark chocolate consumers, living in Belgium, and older than the age of 18, with an overall mean age of 33 years old. Participants provided informed consent, and the study complied with the principles established by the Declaration of Helsinki and the EU General Data Protection Regulation (GDPR) [
15]. The chocolates were home-delivered, and data were collected with EyeQuestion software (Logic8 B.V., Elst, The Netherlands). The samples, identified with a 3-digit random number, were presented following a Williams Latin square design [
16]. Anonymous collection of the data was guaranteed, and it involved no sensitive data. Participants were not reimbursed for their participation.
Consumer Test
Check-all-that-apply tests (CATA) were used to gain information about the characteristics of the chocolate aroma and flavor [
17]. This easy technique avoids scaling problems often encountered by untrained people, as there is no demand to rate the intensity [
18,
19]. Moreover, previous studies showed that there was a high correlation between the citation frequency and intensity of a certain descriptor [
20]. Consumers had to check off the boxes that were applicable to the aroma and flavor profile of the specific chocolate. Both aroma and flavor attributes were selected based on results of a roundtable discussion including six experts with an extensive knowledge of describing aromas and flavors present in chocolate products. The selected terms to describe the aroma were: roasted, spicy, fruity, cocoa, floral, smoky, and burnt. The selected terms for describing flavor were: roasted, spicy, fruity, cocoa, floral, bitter, buttery, acid, sweet, dry, caramel, and orange. In addition to the CATA test, consumers were asked to indicate their preference and willingness to buy.
2.4. Physical Properties
2.4.1. Dry Matter
The dry matter content (%
w/
w) of the roasted cocoa beans and the produced chocolates was determined via oven-drying, according the official method AOAC 931.04 [
21]. The dry matter content of the chocolates was measured in triplicate.
2.4.2. Color
The color of the two chocolate samples is expressed according to the CIELAB color space.
L*,
a*, and
b* values were measured by a Minolta CM-2500d spectrophotometer (Konica Minolta Sensing Osaka, Tokyo, Japan) in triplicate. The applied settings were as follows: 10° observation angle, D65 light source, with the specular component excluded. In addition, the browning index (BI), an indicator for the brown color of the chocolates, was calculated from the obtained
L*,
a*, and
b* values, according the equation reported in ZZaMan and Yang [
22]:
In addition, the Δ
E value, representing the difference in color between the two samples, was measured according to the following equation, found in Żyżelewicz, et al. [
23]:
2.4.3. Hardness
The hardness (N) of the chocolate tablets was analyzed in triplicate via a needle penetration test performed on a 5942 Instron Texture Analyzer (Norwood, MA, USA) equipped with a 500 N load cell and Bluehill® software (v4.03). The penetration test was initiated when the needle felt a threshold of 0.2 N upon touching the chocolate tablets and continued until a penetration depth of 5 mm at a rate of 2 mm/s.
2.4.4. Melting Profile
The melting profile of the chocolates was monitored via differential scanning calorimetry (Q1000 DSC, TA instruments, New Castle, DE, USA), as mentioned in the work of Tran et al. [
24]. Each measurement was performed in triplicate, and the measured melting peaks were described by their onset, maximum, offset temperature (°C), and melting enthalpy (J/g).
2.4.5. Apparent Viscosity
The AR2000ex rheometer (TA Instruments, New Castle, DE, USA) was used to assess the flow behavior of the chocolates in triplicate, using the concentric cylinder system (conical bob; stator inner radius of 15 mm and rotor outer diameter of 14 mm; gap of 5920 µm). The applied method was based on the International Confectionery Association (ICA) 46 method, as described in the work of Saputro et al. [
25]. The apparent viscosity (Pa.s) of both chocolates was reported for increasing shear rates ranging from 2 s
−1 to 50 s
−1.
2.5. Estimated Energy Consumption
The estimated energy consumption (kJ/kg) of both roasting treatments was calculated based on the electrical power requirement (J/s) of both devices, the roasting time, and the batch size, as presented in following equation:
2.6. Statistical Analysis
All tests were performed at a significance level of 5%. Results of the triangle tests were statistically analyzed via both binomial tests and Thurstonian modeling, resulting in
p-values and d’-values, respectively. Whereas XLSTAT 2020 (Microsoft
®, Redmond, DC, USA) was used to calculate the d’-values, EyeOpenR 5.0.6.5. software (Logic8 B.V., Elst, The Netherlands) was used to calculate the binomial
p-values. Other outcomes of the consumer tests were statistically compared in SPSS 27 (IBM, New York, NY, USA) using different types of tests. Whereas check-all-that-apply and willingness to buy tests were statistically evaluated via Mc-Nemar tests, preference was analyzed via as a simple paired preference test following the methods of Lawless and Heymann [
13]. The physical properties of the chocolates were also statistically compared in SPSS 27 (IBM, New York, NY, USA). Prior analysis via a paired sample t-test, the normality of these data and the equality of variances were checked via QQ-plots and Levene’s tests, respectively.
3. Results and Discussion
3.1. Trained Panel
Triangle Tests
In total, 51 triangle tests were performed during three different sessions (T1:
n = 18, T2:
n = 17, T3:
n = 16). As shown in
Table 1, both the binominal
p-value, as well as the d’-value derived from Thurstonian modeling, are displayed for the individual sessions, as well as for the total number of assessments. A
p-value below 0.05 and a d’-value above 1.5 are both indicators of significant differences between the products [
26]. According to Kunert and Meyners [
27], the results of the three triangle test sessions could be combined, even if these are replicates. In this way, a higher power to detect differences between products is obtained. The results showed that for two out of three triangle tests, both chocolates could be distinguished by the panel members. Only triangle test T2 resulted in a
p-value above 0.05 and a d’-value below 1.5. Moreover, by combining all data (T1 + T2 + T3), an additional confirmation was given that chocolate produced from microwave and convectively roasted cocoa beans could be distinguished at a 5% significance level.
3.2. Consumer Test
3.2.1. Check-All-That-Apply Aroma and Flavor Attributes
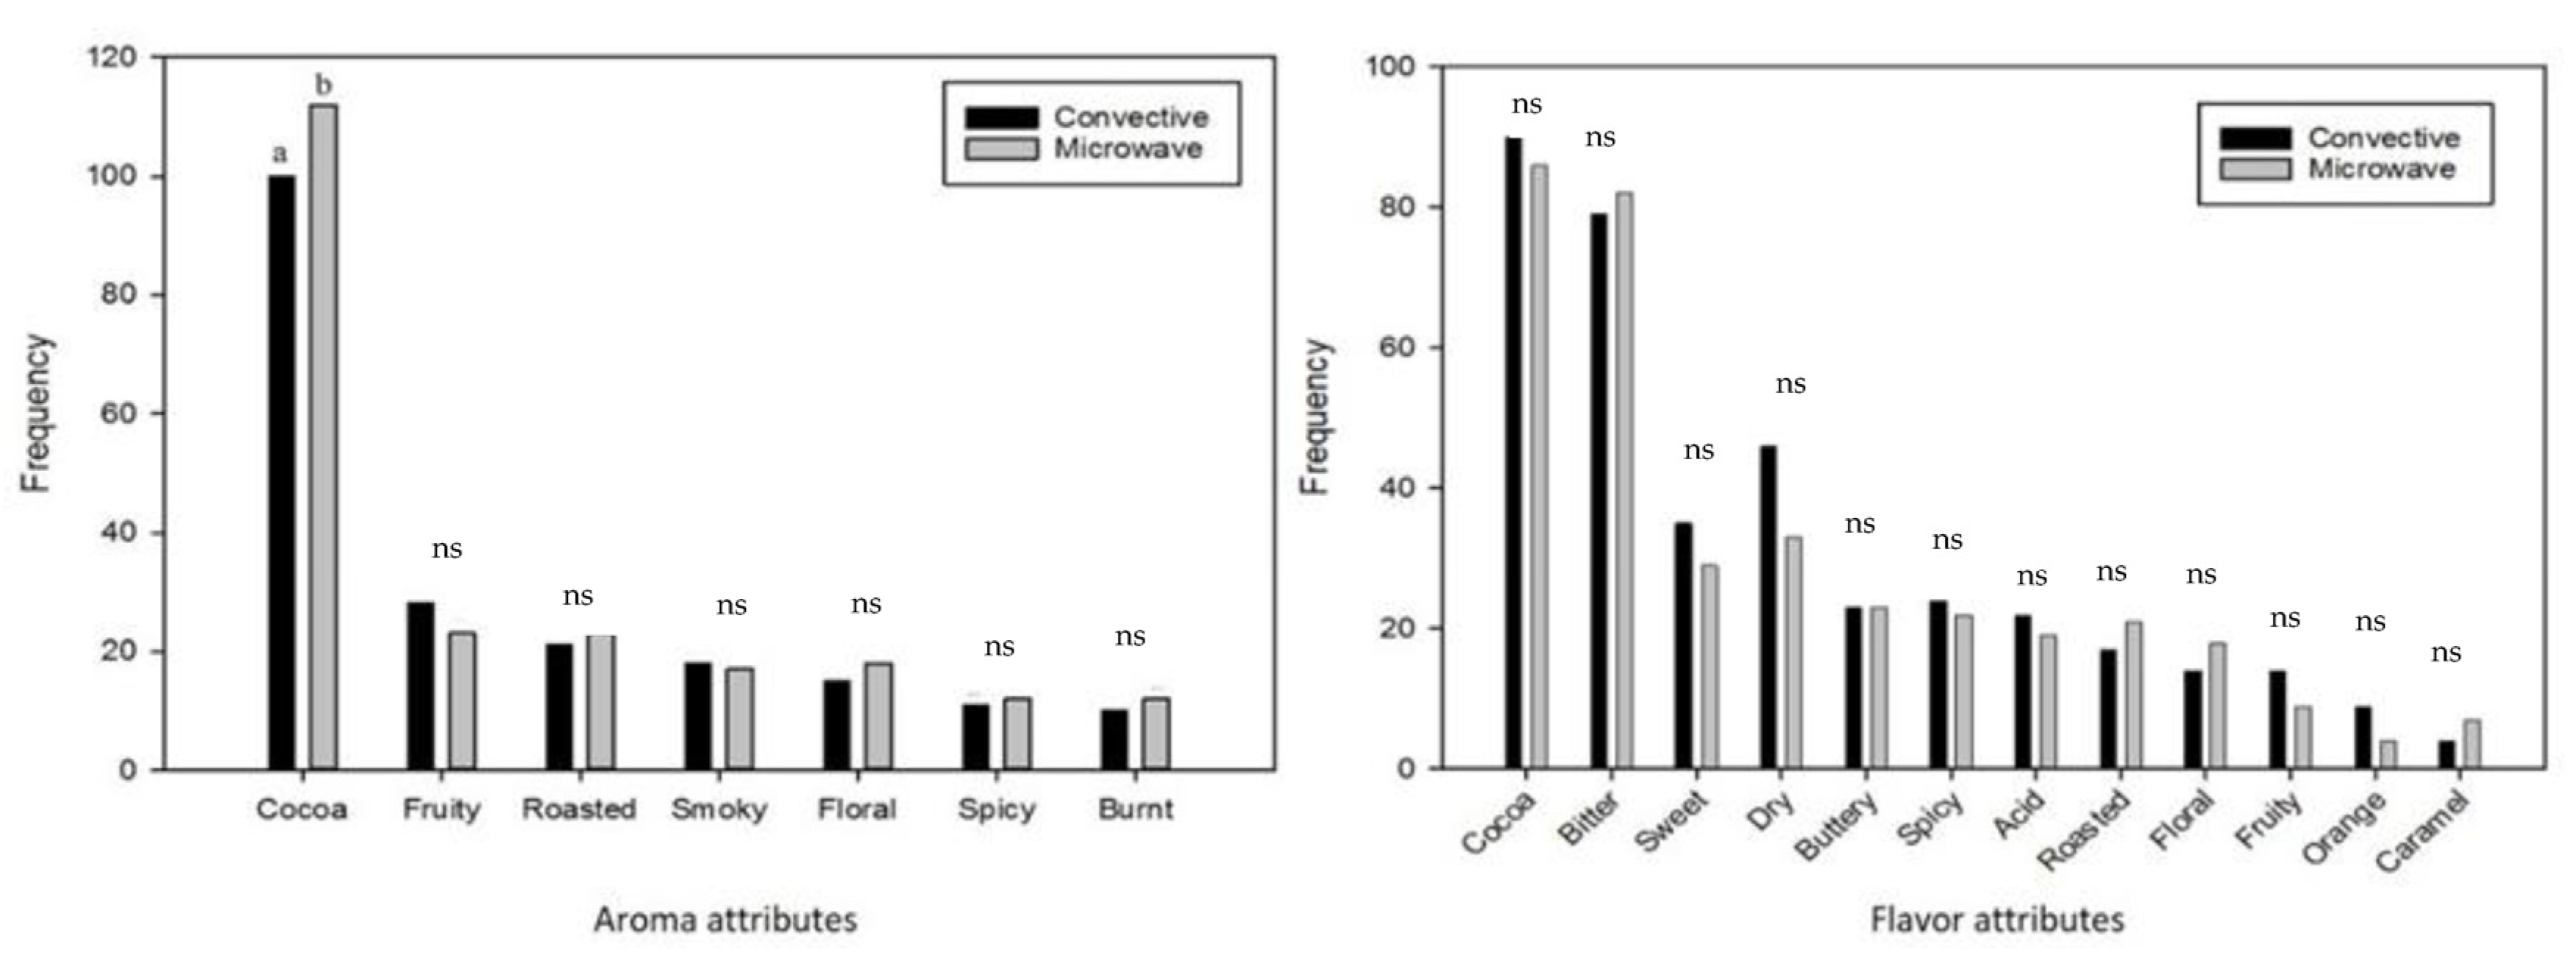
The citation frequency of the aroma attributes, as presented by the left bar chart in
Figure 1, shows that a comparable aroma profile could be expected from both chocolates. An exception was observed for the predominant aroma, cocoa, which was cited as significantly higher for the chocolate produced from microwave roasted cocoa beans (
n = 112) compared to the convectively roasted cocoa beans (
n = 100). Research of Lemarcq, Monterde, Tuenter, Van de Walle, Pieters, Sioriki, and Dewettinck [
7] found higher concentrations of 2-methylbutanal, which are associated with a more intense cocoa aroma [
28], when chocolates were produced from microwave roasted beans compared to convectively roasted beans.
Regarding flavor perception by mouth, no significant differences (
p > 0.05) were detected between the CATA results of the chocolates (
Figure 1). For both chocolates, cocoa and bitterness flavors were the most cited, suggesting that these were the dominant flavor attributes. This might not come as a surprise when serving consumers a 70% dark chocolate sample. The bitter flavor might have been especially overwhelming, thus masking the more subtle differences in the delicate fruity and floral flavor notes.
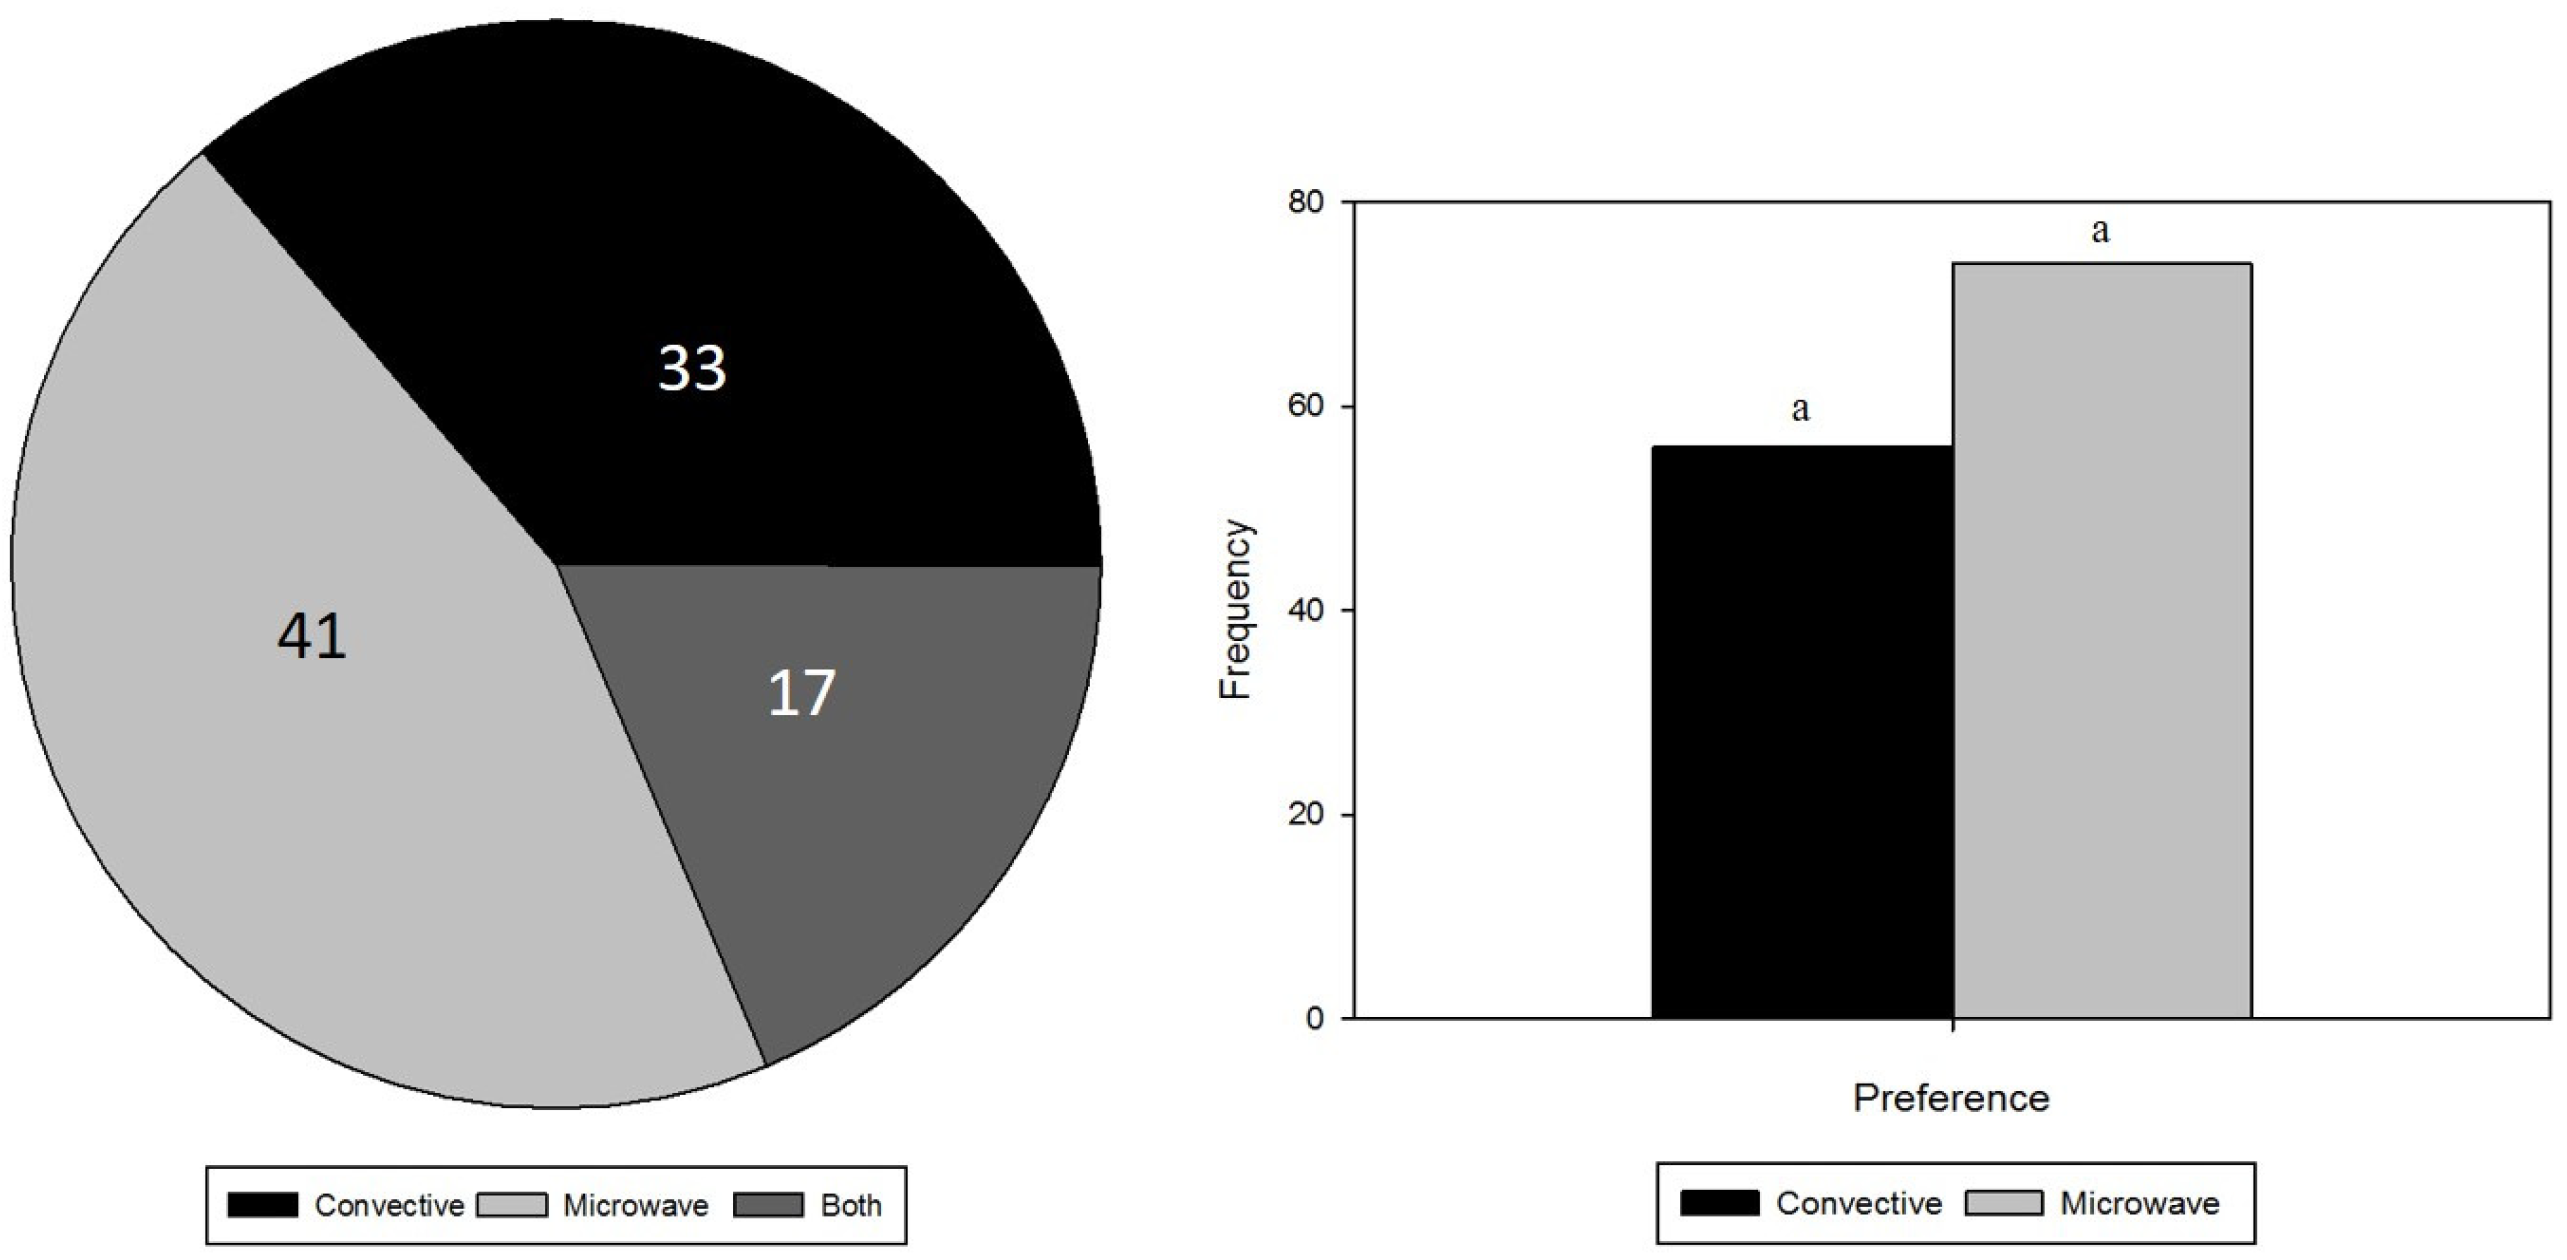
3.2.2. Willingness to Buy and Preference
Figure 2 visualizes a similar tendency for the results of the two tests used to the check the affectivity of consumers towards the two products. Both willingness to buy and preference suggest that the chocolate produced from microwave roasted cocoa beans was more appreciated by the consumers. Nevertheless, neither parameter was significantly different using a 95% confidence interval. Although, a significant difference (
p < 0.05) in preference would be obtained if only 3 persons (
n = 77) switched their preferences to chocolate made from microwave roasted cocoa beans.
3.3. Physical Properties
The physical properties of the produced chocolates were examined through the analyses of the dry matter content, color, hardness, melting behavior, and apparent viscosity. The results of these experiments, with the exception of apparent viscosity, can be found in
Table 2.
No significant differences (
p > 0.05) were detected between the dry matter (DM) of the chocolates. The DM levels were above 99.5%
w/
w, indicating that after the roasting process, supplementary evaporation occurred, especially during the dry conching step. These high DM levels should ensure the avoidance of aggregation and lump formation [
29]. With regard to color, no difference between the chocolate samples was observed, as no significant differences (
p > 0.05) were detected for L*, a*, and b* values. The calculated browning index representing the intensity of brown color for each chocolate, was also judged as similar. These results were confirmed by the calculated ∆E value of below 1, indicating that the color difference is not obvious when observed by the human eye [
23]. In terms of hardness, no significant differences (
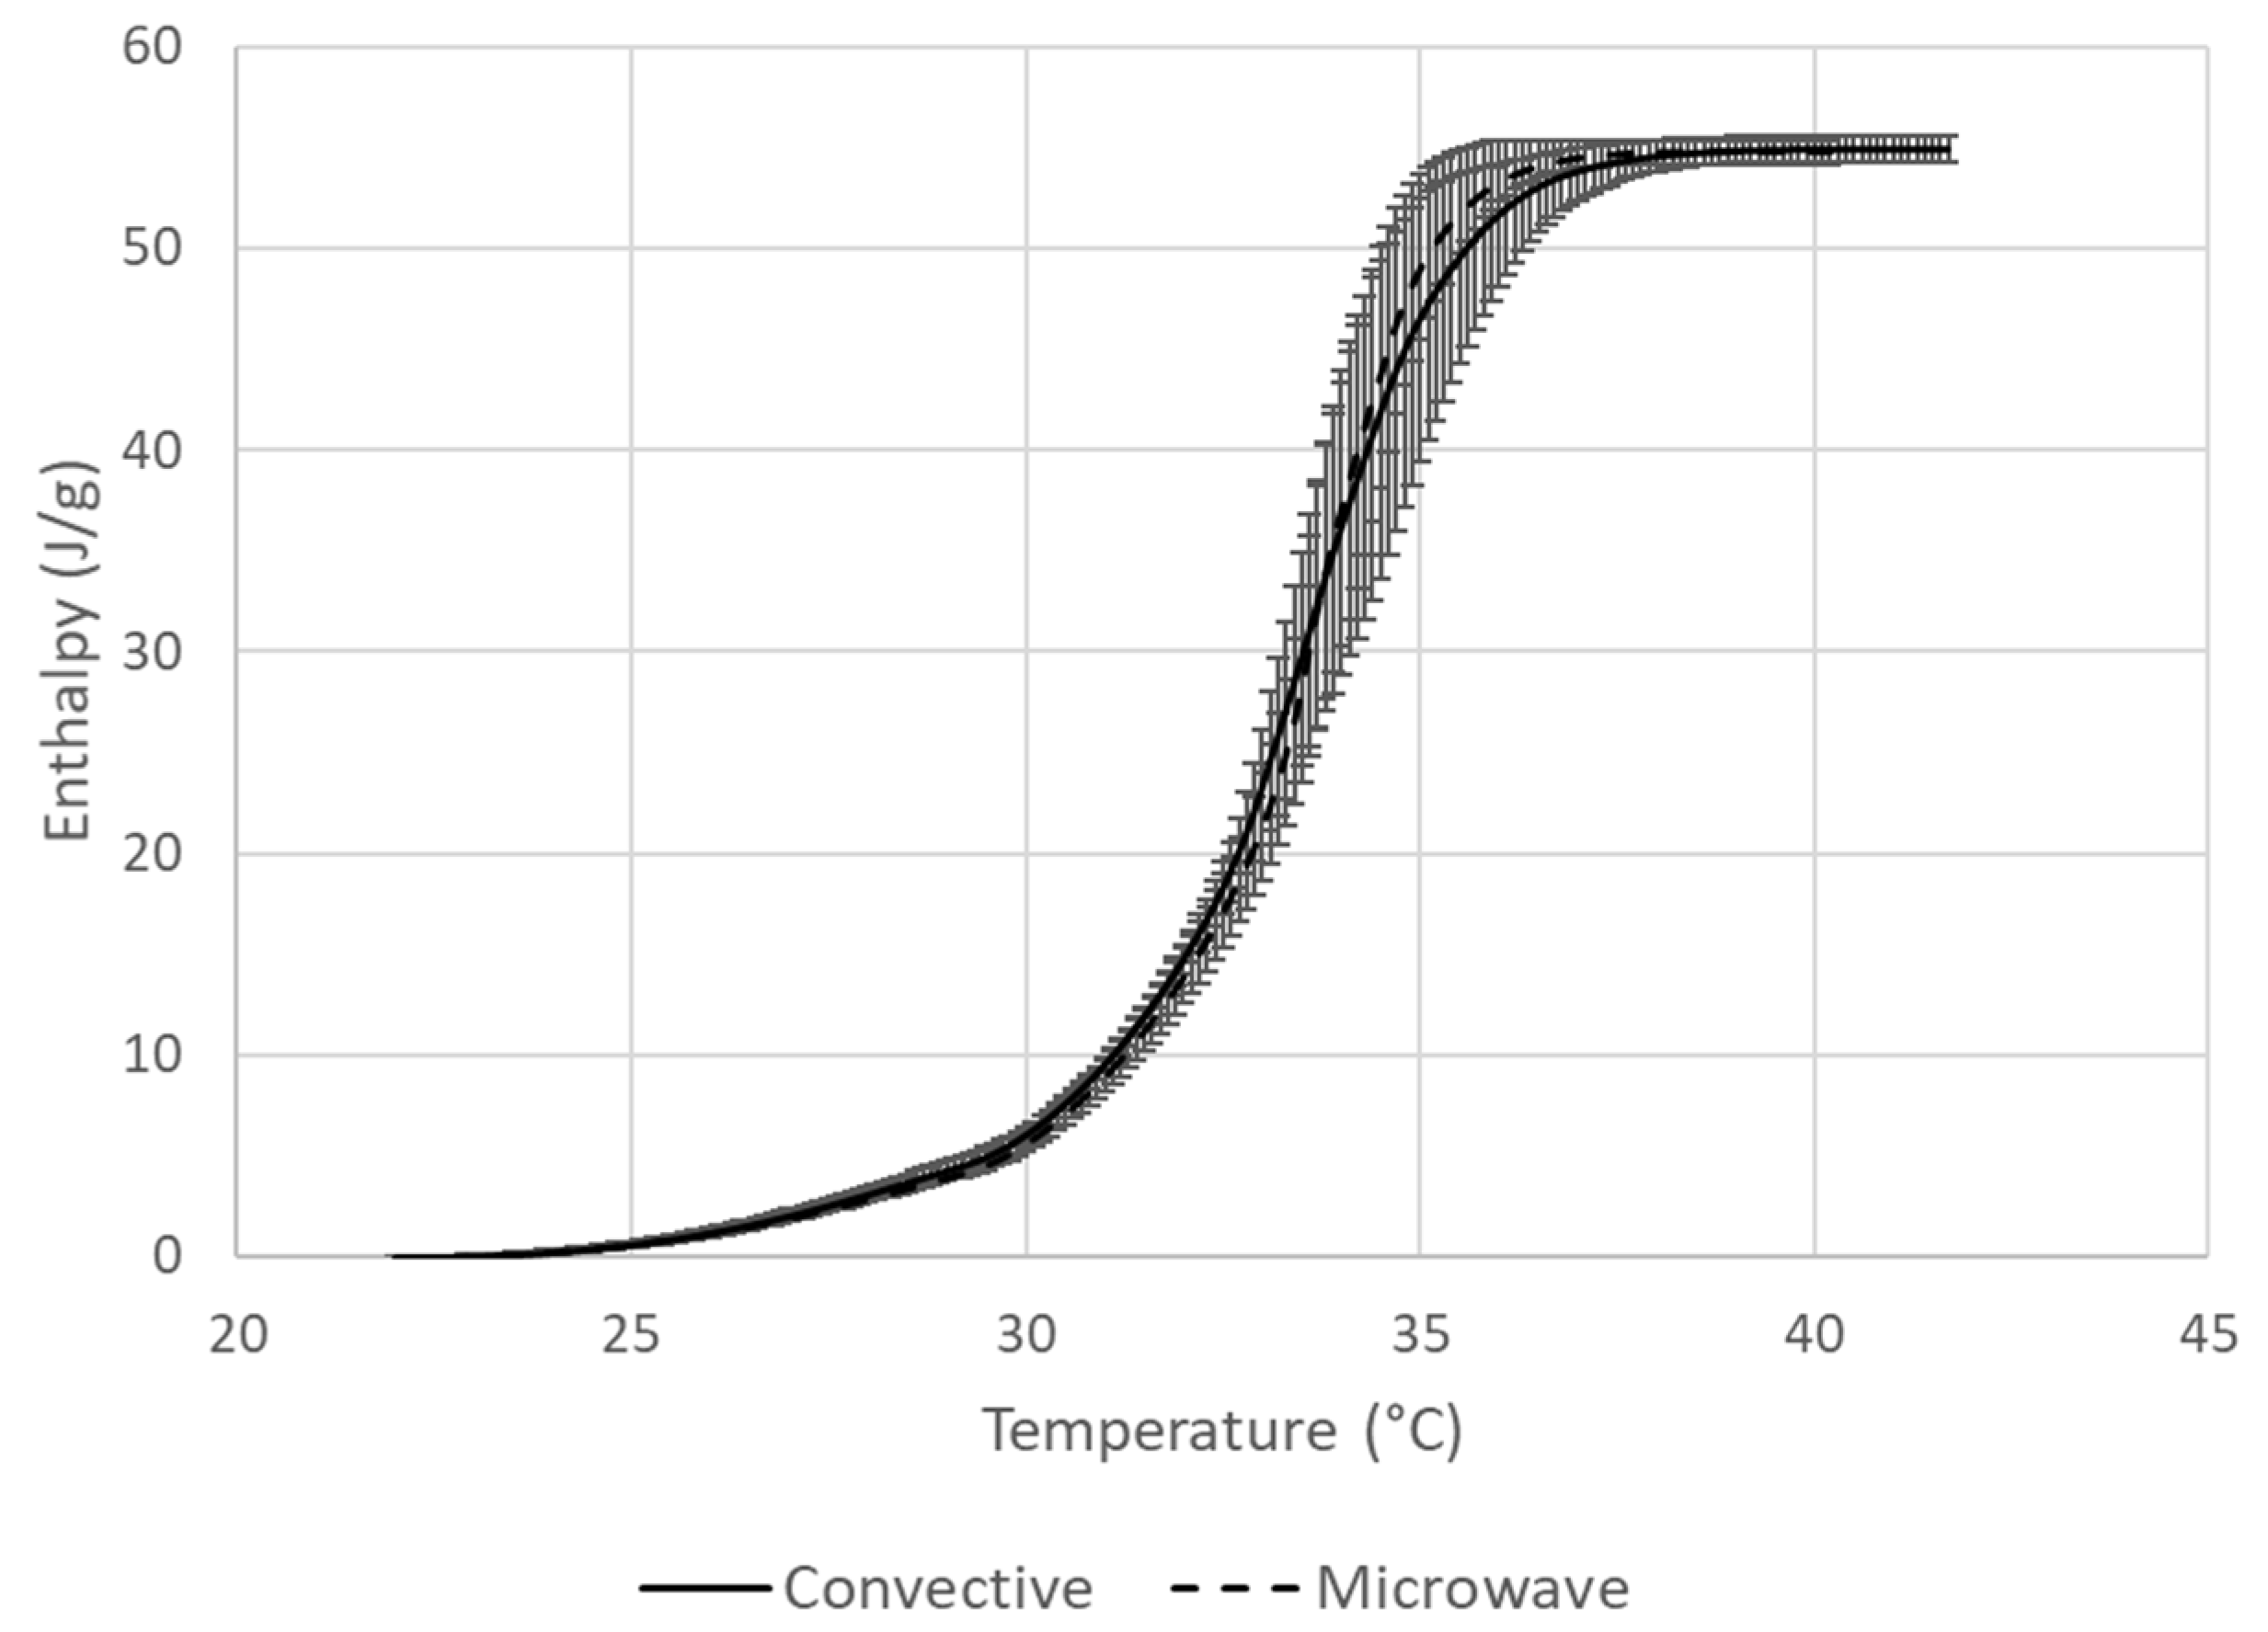
p > 0.05) were detected between the hardness of the two chocolate samples. With respect to melting behavior, comparable onset, offset, and maximum temperatures (°C) of the melting peaks were found for both chocolates. Moreover, the heat required to melt each chocolate, as measured by the melting enthalpy (J/g), was not significantly higher (
p > 0.05) for either of the samples, implying that both chocolates exhibited a similar melting behavior and induced a similar cooling sensation. The melting enthalpy profile of the cholates can be found in
Figure 3.
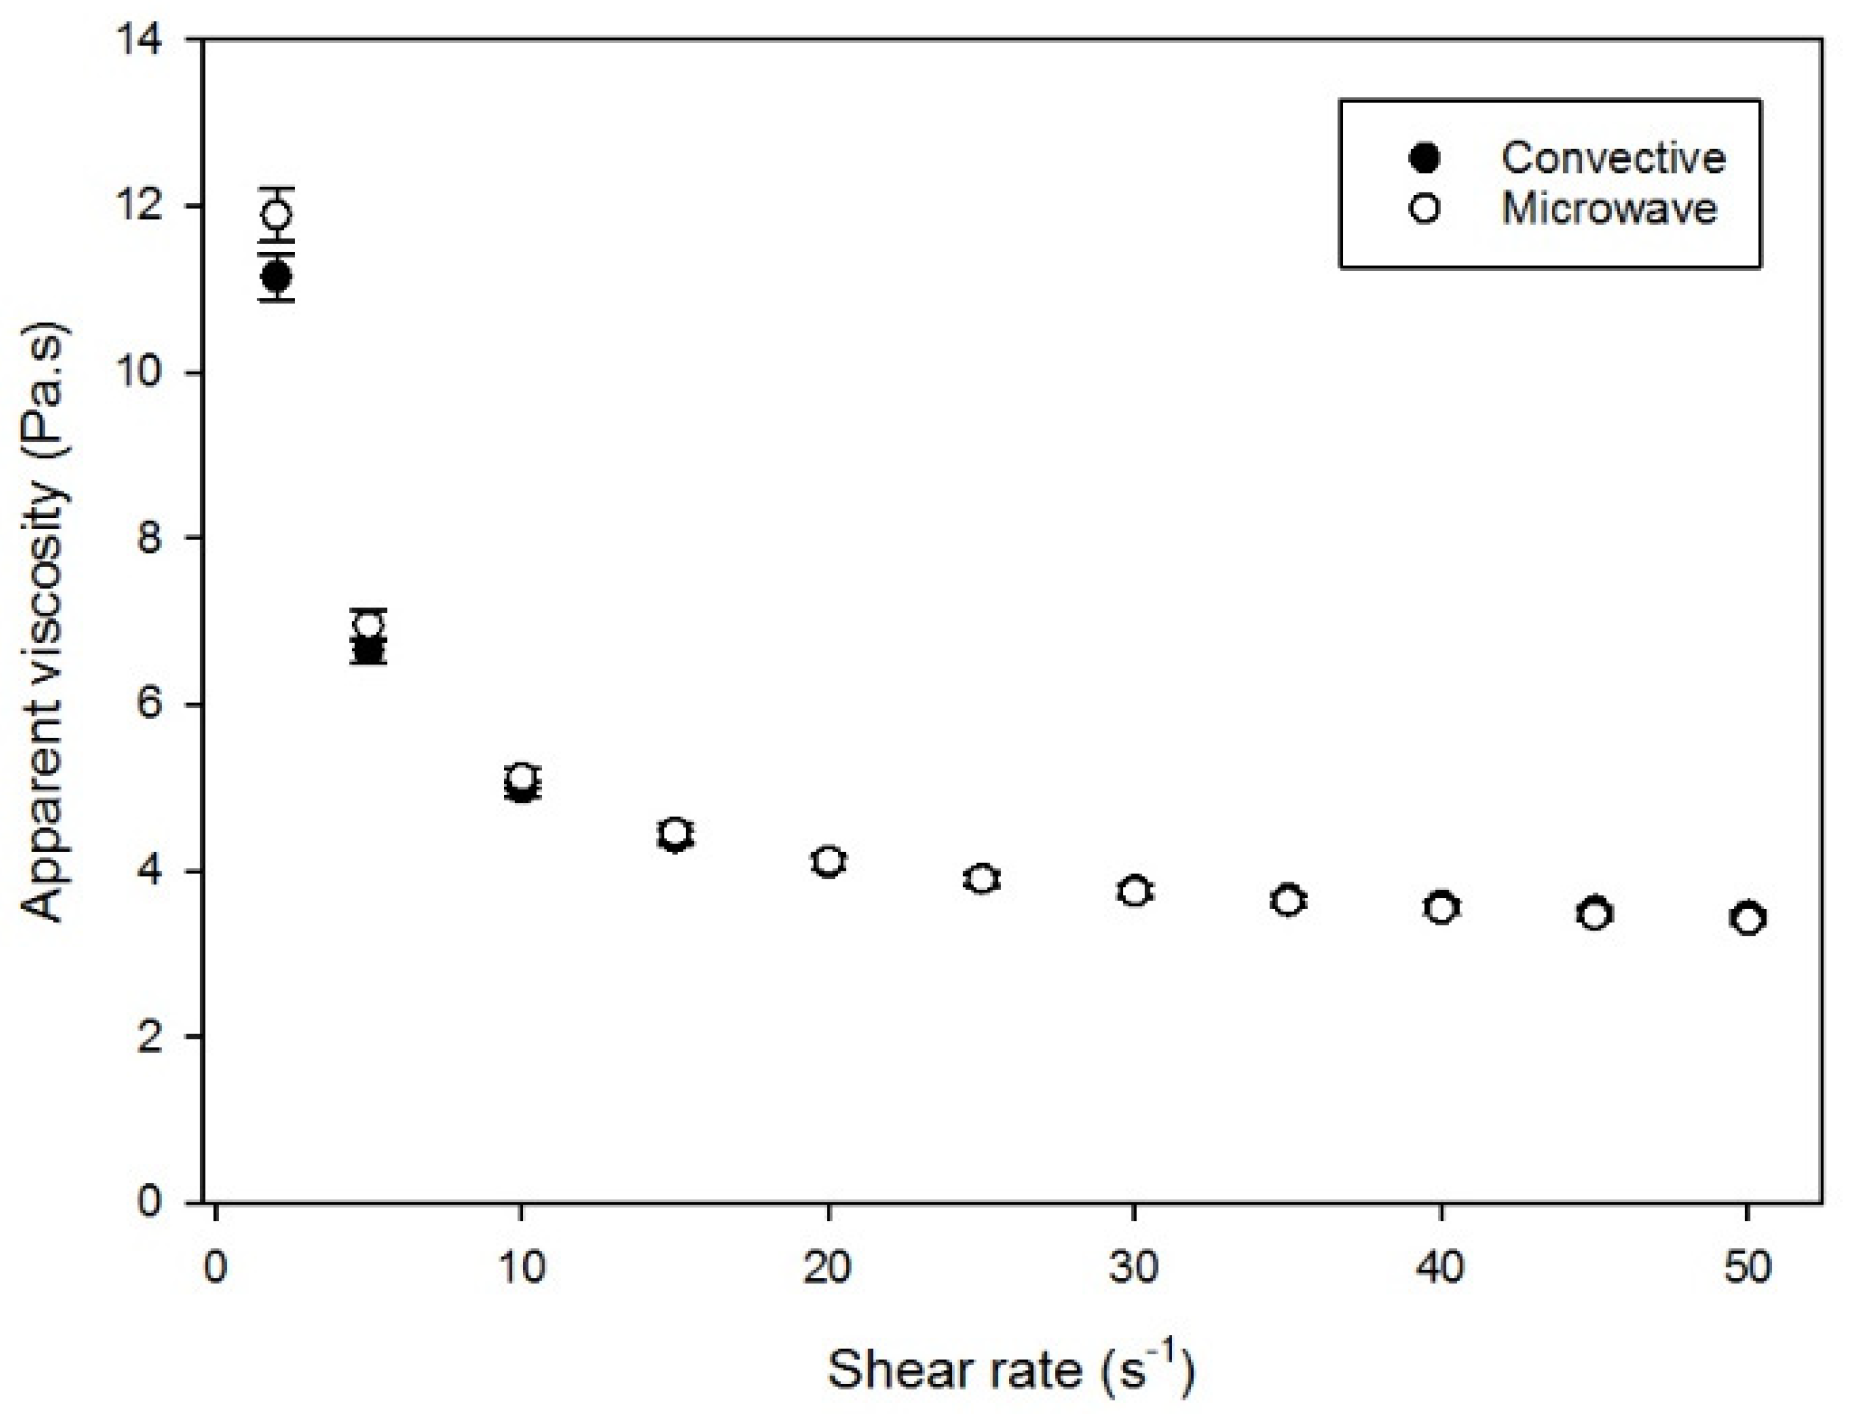
The flow properties were also studied, as it is known that flavor perception depends on the order and rate of contact, which is related to the viscosity of chocolate melted in the mouth [
30]. As can be seen from the graph presented in
Figure 4, comparable apparent viscosities were measured at varying shear rates for both chocolates. Only for a very low shear rate of 2s
−1 was a significant difference (
p < 0.05) in apparent viscosity measured. However, as can be seen from the table reported in the work of Mezger [
31], processes such as the chewing and swallowing of a food product are represented by shear rates between 10 to 100s
−1; therefore, the relevance of this measuring point is relatively limited. The flow behavior data has been can be found in
Figure S1 and the flow parameters (fitted with the appropriate rheological model) is depicted in
Table S1. Additional rheological measurement with a thinner film in the range of μm and nm, as suggested by Stokes et al. [
32], would provide
supplementary information to study tribology components such as lubrication, in addition to the typical astringent mouthfeel when consuming dark chocolate.
3.4. Estimated Energy Consumption
All parameter values used to estimate energy consumption are displayed in
Table 3. For this small scale roasting experiment, it could be concluded that the microwave roasting treatment was more energy efficient. This increased energy efficiency does not result from a shorter roasting time, nor a higher bean capacity of the equipment, but because of the lower energy consuming equipment that was used in this study.
4. Conclusions
This study confirms the hypothesis that microwave roasting could be a suitable alternative to the convection roasting of cocoa beans. In addition to the lower energy consumption detected on a small scale, chocolate with desirable sensory properties could be produced from microwave roasted cocoa beans. Moreover, a significantly higher number of consumers associated the chocolate produced from microwave roasted cocoa beans with displaying a stronger cocoa aroma. The larger number of consumers willing to buy, and their higher preference for, this type of chocolate, although both insignificant (p > 0.05), illustrates the more than acceptable sensory and physical properties of chocolate produced from microwave roasted cocoa beans. The acceptable sensory quality was also confirmed by the very similar physical properties measured for both types of chocolates.
On a small scale, the applicability of using microwaves to roast cocoa beans is proven. This technique can be used, for example, by local cocoa farmers to explore the flavor profile of their cocoa beans by producing chocolate at a lower investment and operational cost.
Notwithstanding these promising results, further investigations are necessary. With respect to the applicability of microwave roasting cocoa beans on an industrial scale, further research is required. When upscaling, other types of equipment will be necessary, as well as the selection of a different set of parameter values. By varying the time-power input combinations, the varying roasting degrees will affect the final flavor profile of the produced chocolate. To fully understand the impact of time and power input on the flavor profile of chocolate produced from microwave roasted cocoa beans, it is highly recommended to perform kinetic modeling studies. Further research should also examine the impact of the roasting technique on the nutritional and chemical composition of chocolate, e.g., polyphenols and antioxidants. In addition, a sensory evaluation of chocolates produced from cocoa beans roasted at different time-power combinations is highly supported in order to further map their corresponding flavor profiles.
Finally, the economic aspect, partly determined by energy efficiency, will also be an important decisive factor in determining whether this technique is a worthy alternative for the chocolate industry.
Supplementary Materials
The following supporting information can be downloaded at:
https://www.mdpi.com/article/10.3390/foods12040887/s1, Figure S1: Shear stress as a function of increasing shear rates for chocolates produced from convective and microwave roasted cocoa beans (
n = 3).; Table S1: Flow parameters (mean ± S.D.) of the chocolates produced from convectively and microwave roasted cocoa beans (
n = 3).
Author Contributions
Conceptualization, J.J.S., V.L. and D.V.d.W.; methodology, J.J.S. and V.L.; software, V.L.; validation, J.J.S., V.L., D.V.d.W., E.S. and K.D.; formal analysis, V.L.; investigation, V.L.; resources, K.D.; data curation, J.J.S. and V.L.; writing—original draft preparation, J.J.S. and V.L.; writing—review and editing, J.J.S., V.L., D.V.d.W., E.S. and K.D.; visualization, V.L.; supervision, E.S. and K.D.; project administration, K.D.; funding acquisition, K.D. All authors have read and agreed to the published version of the manuscript.
Funding
This study was funded by the Fund for Scientific Research (Flanders) (Grant number S004617N) in the framework of the REVICO project (“Revisiting Cocoa: Exploiting the Full Potential of Cocoa Raw Materials Through Novel Processing”).
Data Availability Statement
The data are not publicly available, as participants did not provide consent to share their data.
Conflicts of Interest
The authors declare no conflict of interest.
References
- Jean-Marie, E.; Jiang, W.; Bereau, D.; Robinson, J.-C. Theobroma cacao and Theobroma grandiflorum: Botany, Composition and Pharmacological Activities of Pods and Seeds. Foods 2022, 11, 3966. [Google Scholar] [CrossRef] [PubMed]
- Aprotosoaie, A.C.; Luca, S.V.; Miron, A. Flavor chemistry of cocoa and cocoa products—An overview. Compr. Rev. Food Sci. Food Saf. 2016, 15, 73–91. [Google Scholar] [CrossRef] [PubMed]
- Noor, A.F.; Budi, T.S.A. Roasting Equipment for Cocoa Processing. In Drying and Roasting of Cocoa and Coffee; CRC Press: Boca Raton, FL, USA, 2019; pp. 47–62. [Google Scholar]
- Kruszewski, B.; Obiedziński, M.W. Impact of raw materials and production processes on furan and acrylamide contents in dark chocolate. J. Agric. Food Chem. 2020, 68, 2562–2569. [Google Scholar] [CrossRef] [PubMed]
- Krysiak, W. Effects of convective and microwave roasting on the physicochemical properties of cocoa beans and cocoa butter extracted from this material. Grasas Y Aceites 2011, 62, 467–478. [Google Scholar] [CrossRef]
- Ryynänen, S. Microwave Heating Uniformity of Multicomponent Prepared Foods. Ph.D. Thesis, University of Helsinki, Helsinki, Finland, 2002. Available online: https://helda.helsinki.fi/bitstream/handle/10138/20816/microwav.pdf?se (accessed on 7 February 2023).
- Lemarcq, V.; Monterde, V.; Tuenter, E.; Van de Walle, D.; Pieters, L.; Sioriki, E.; Dewettinck, K. Flavor diversification of dark chocolate produced through microwave roasting of cocoa beans. LWT 2022, 159, 113198. [Google Scholar] [CrossRef]
- Singh, R.P.; Heldman, D.R. Introduction to Food Engineering, 5th ed.; Singh, R.P., Heldman, D.R., Eds.; Academic Press: San Diego, CA, USA, 2014. [Google Scholar]
- Teferra, T.F. Engineering properties of food materials. In Handbook of Farm, Dairy and Food Machinery Engineering; Elsevier: Amsterdam, The Netherlands, 2019; pp. 45–89. [Google Scholar]
- Hebbar, H.U.; Rastogi, N.K. Microwave heating of fluid foods. In Novel Thermal and Non-Thermal Technologies for Fluid Foods; Elsevier: Amsterdam, The Netherlands, 2012; pp. 369–409. [Google Scholar]
- Beckett, S.T.; Fowler, M.S.; Ziegler, G.R. Beckett’s Industrial Chocolate Manufacture and Use; John Wiley & Sons: Hoboken, NJ, USA, 2017. [Google Scholar]
- Rottiers, H. From Genetics to Flavor Dynamics and Sensory Profiling of Fine and Bulk Ecuadorian Cocoa. Ph.D. Thesis, Ghent University, Ghent, Belgium, 2019. Available online: https://biblio.ugent.be/publication/8635382 (accessed on 7 February 2023).
- Lawless, H.T.; Heymann, H. Sensory Evaluation of Food: Principles and Practices, 2nd ed.; Springer: New York, NY, USA, 2010. [Google Scholar]
- Wakeling, I.N.; MacFie, H.J.H. Designing consumer trials balanced for first and higher orders of carry-over effect when only a subset of k samples from t may be tested. Food Qual. Prefer. 1995, 6, 299–308. [Google Scholar] [CrossRef]
- EU General Data Protection Regulation (GDPR). Regulation (EU) 2016/679 of the European Parliament and of the Council of 27 April 2016 on the Protection of Natural Persons with Regard to the Processing of Personal Data and on the Free Movement of Such Data, and Repealing Directive 95/46/EC (General Data Protection Regulation). In OJ 2016 L 119/1; 2016. Available online: https://eur-lex.europa.eu/eli/reg/2016/679/oj (accessed on 7 February 2023).
- MacFie, H.J.; Bratchell, N.; Greenhoff, K.; Vallis, L.V. Designs to balance the effect of order of presentation and first-order carry-over effects in hall tests. J. Sens. Stud. 1989, 4, 129–148. [Google Scholar] [CrossRef]
- Wang, B.; Shen, C.; Zhao, T.; Zhai, X.; Ding, M.; Dai, L.; Gai, S.; Liu, D. Development of a Check-All-That-Apply (CATA) Ballot and Machine Learning for Generation Z Consumers for Innovative Traditional Food. Foods 2022, 11, 2409. [Google Scholar] [CrossRef]
- Varela, P.; Ares, G. Sensory profiling, the blurred line between sensory and consumer science. A review of novel methods for product characterization. Food Res. Int. 2012, 48, 893–908. [Google Scholar] [CrossRef]
- Marques, C.; Correia, E.; Dinis, L.-T.; Vilela, A. An overview of sensory characterization techniques: From classical descriptive analysis to the emergence of novel profiling methods. Foods 2022, 11, 255. [Google Scholar] [CrossRef]
- Jaeger, S.R.; Chheang, S.L.; Jin, D.; Roigard, C.M.; Ares, G. Check-all-that-apply (CATA) questions: Sensory term citation frequency reflects rated term intensity and applicability. Food Qual. Prefer. 2020, 86, 103986. [Google Scholar] [CrossRef]
- Flanyak, J. Cacao bean and its products. AOAC Off. Methods Anal. 1995, 1–17. [Google Scholar]
- ZZaMan, W.; Yang, T.A. Effect of superheated steam and convection roasting on changes in physical properties of cocoa bean (Theobroma cacao). Food Sci. Technol. Res. 2013, 19, 181–186. [Google Scholar] [CrossRef]
- Żyżelewicz, D.; Krysiak, W.; Nebesny, E.; Budryn, G. Application of various methods for determination of the color of cocoa beans roasted under variable process parameters. Eur. Food Res. Technol. 2014, 238, 549–563. [Google Scholar] [CrossRef]
- Tran, P.D.; Van Durme, J.; Van de Walle, D.; De Winne, A.; Delbaere, C.; De Clercq, N.; Phan, T.T.Q.; Phuc Nguyen, C.H.; Tran, D.N.; Dewettinck, K. Quality attributes of dark chocolate produced from Vietnamese cocoa liquors. J. Food Qual. 2016, 39, 311–322. [Google Scholar] [CrossRef]
- Saputro, A.D.; Van de Walle, D.; Caiquo, B.A.; Hinneh, M.; Kluczykoff, M.; Dewettinck, K. Rheological behaviour and microstructural properties of dark chocolate produced by combination of a ball mill and a liquefier device as small scale chocolate production system. LWT 2019, 100, 10–19. [Google Scholar] [CrossRef]
- Nishida, M.; Lestringant, P.; Cantu, A.; Heymann, H. Comparing classical descriptive analysis with modified descriptive analysis, modified rate-all-that-apply, and modified check-all-that-apply. J. Sens. Stud. 2021, 36, e12684. [Google Scholar] [CrossRef]
- Kunert, J.; Meyners, M. On the triangle test with replications. Food Qual. Prefer. 1999, 10, 477–482. [Google Scholar] [CrossRef]
- Afoakwa, E.O.; Paterson, A.; Fowler, M.; Ryan, A. Flavor formation and character in cocoa and chocolate: A critical review. Crit. Rev. Food Sci. Nutr. 2008, 48, 840–857. [Google Scholar] [CrossRef]
- Afoakwa, E.O.; Paterson, A.; Fowler, M. Factors influencing rheological and textural qualities in chocolate—A review. Trends Food Sci. Technol. 2007, 18, 290–298. [Google Scholar] [CrossRef]
- Beckett, S.T. The Science of Chocolate; Royal Society of Chemistry: London, UK, 2019. [Google Scholar]
- Mezger, T. The Rheology Handbook: For Users of Rotational and Oscillatory Rheometers; European Coatings: Nuremberg, Germany, 2020. [Google Scholar]
- Stokes, J.R.; Boehm, M.W.; Baier, S.K. Oral processing, texture and mouthfeel: From rheology to tribology and beyond. Curr. Opin. Colloid Interface Sci. 2013, 18, 349–359. [Google Scholar] [CrossRef]
| Disclaimer/Publisher’s Note: The statements, opinions and data contained in all publications are solely those of the individual author(s) and contributor(s) and not of MDPI and/or the editor(s). MDPI and/or the editor(s) disclaim responsibility for any injury to people or property resulting from any ideas, methods, instructions or products referred to in the content. |
© 2023 by the authors. Licensee MDPI, Basel, Switzerland. This article is an open access article distributed under the terms and conditions of the Creative Commons Attribution (CC BY) license (https://creativecommons.org/licenses/by/4.0/).

 ,
, 


