

A Pulsed Electric Field Accelerates the Mass Transfer during the Convective Drying of Carrots: Drying and Rehydration Kinetics, Texture, and Carotenoid Content


Abstract
1. Introduction
2. Materials and Methods
2.1. Sample Preparation and PEF Treatment
2.2. Electrical Conductivity and Cell Disintegration Index (Z-Index)
2.3. Drying Kinetics Modelling
2.4. Rehydration Kinetics Modelling
2.5. Texture
2.6. Microstructure
2.7. Total Carotenoid Content
2.8. Statistical Analysis
3. Results and Discussion
3.1. Electric Conductivity and Z-Index
3.2. Drying Kinetics Discrimination
3.3. Rehydration Kinetics Discrimination
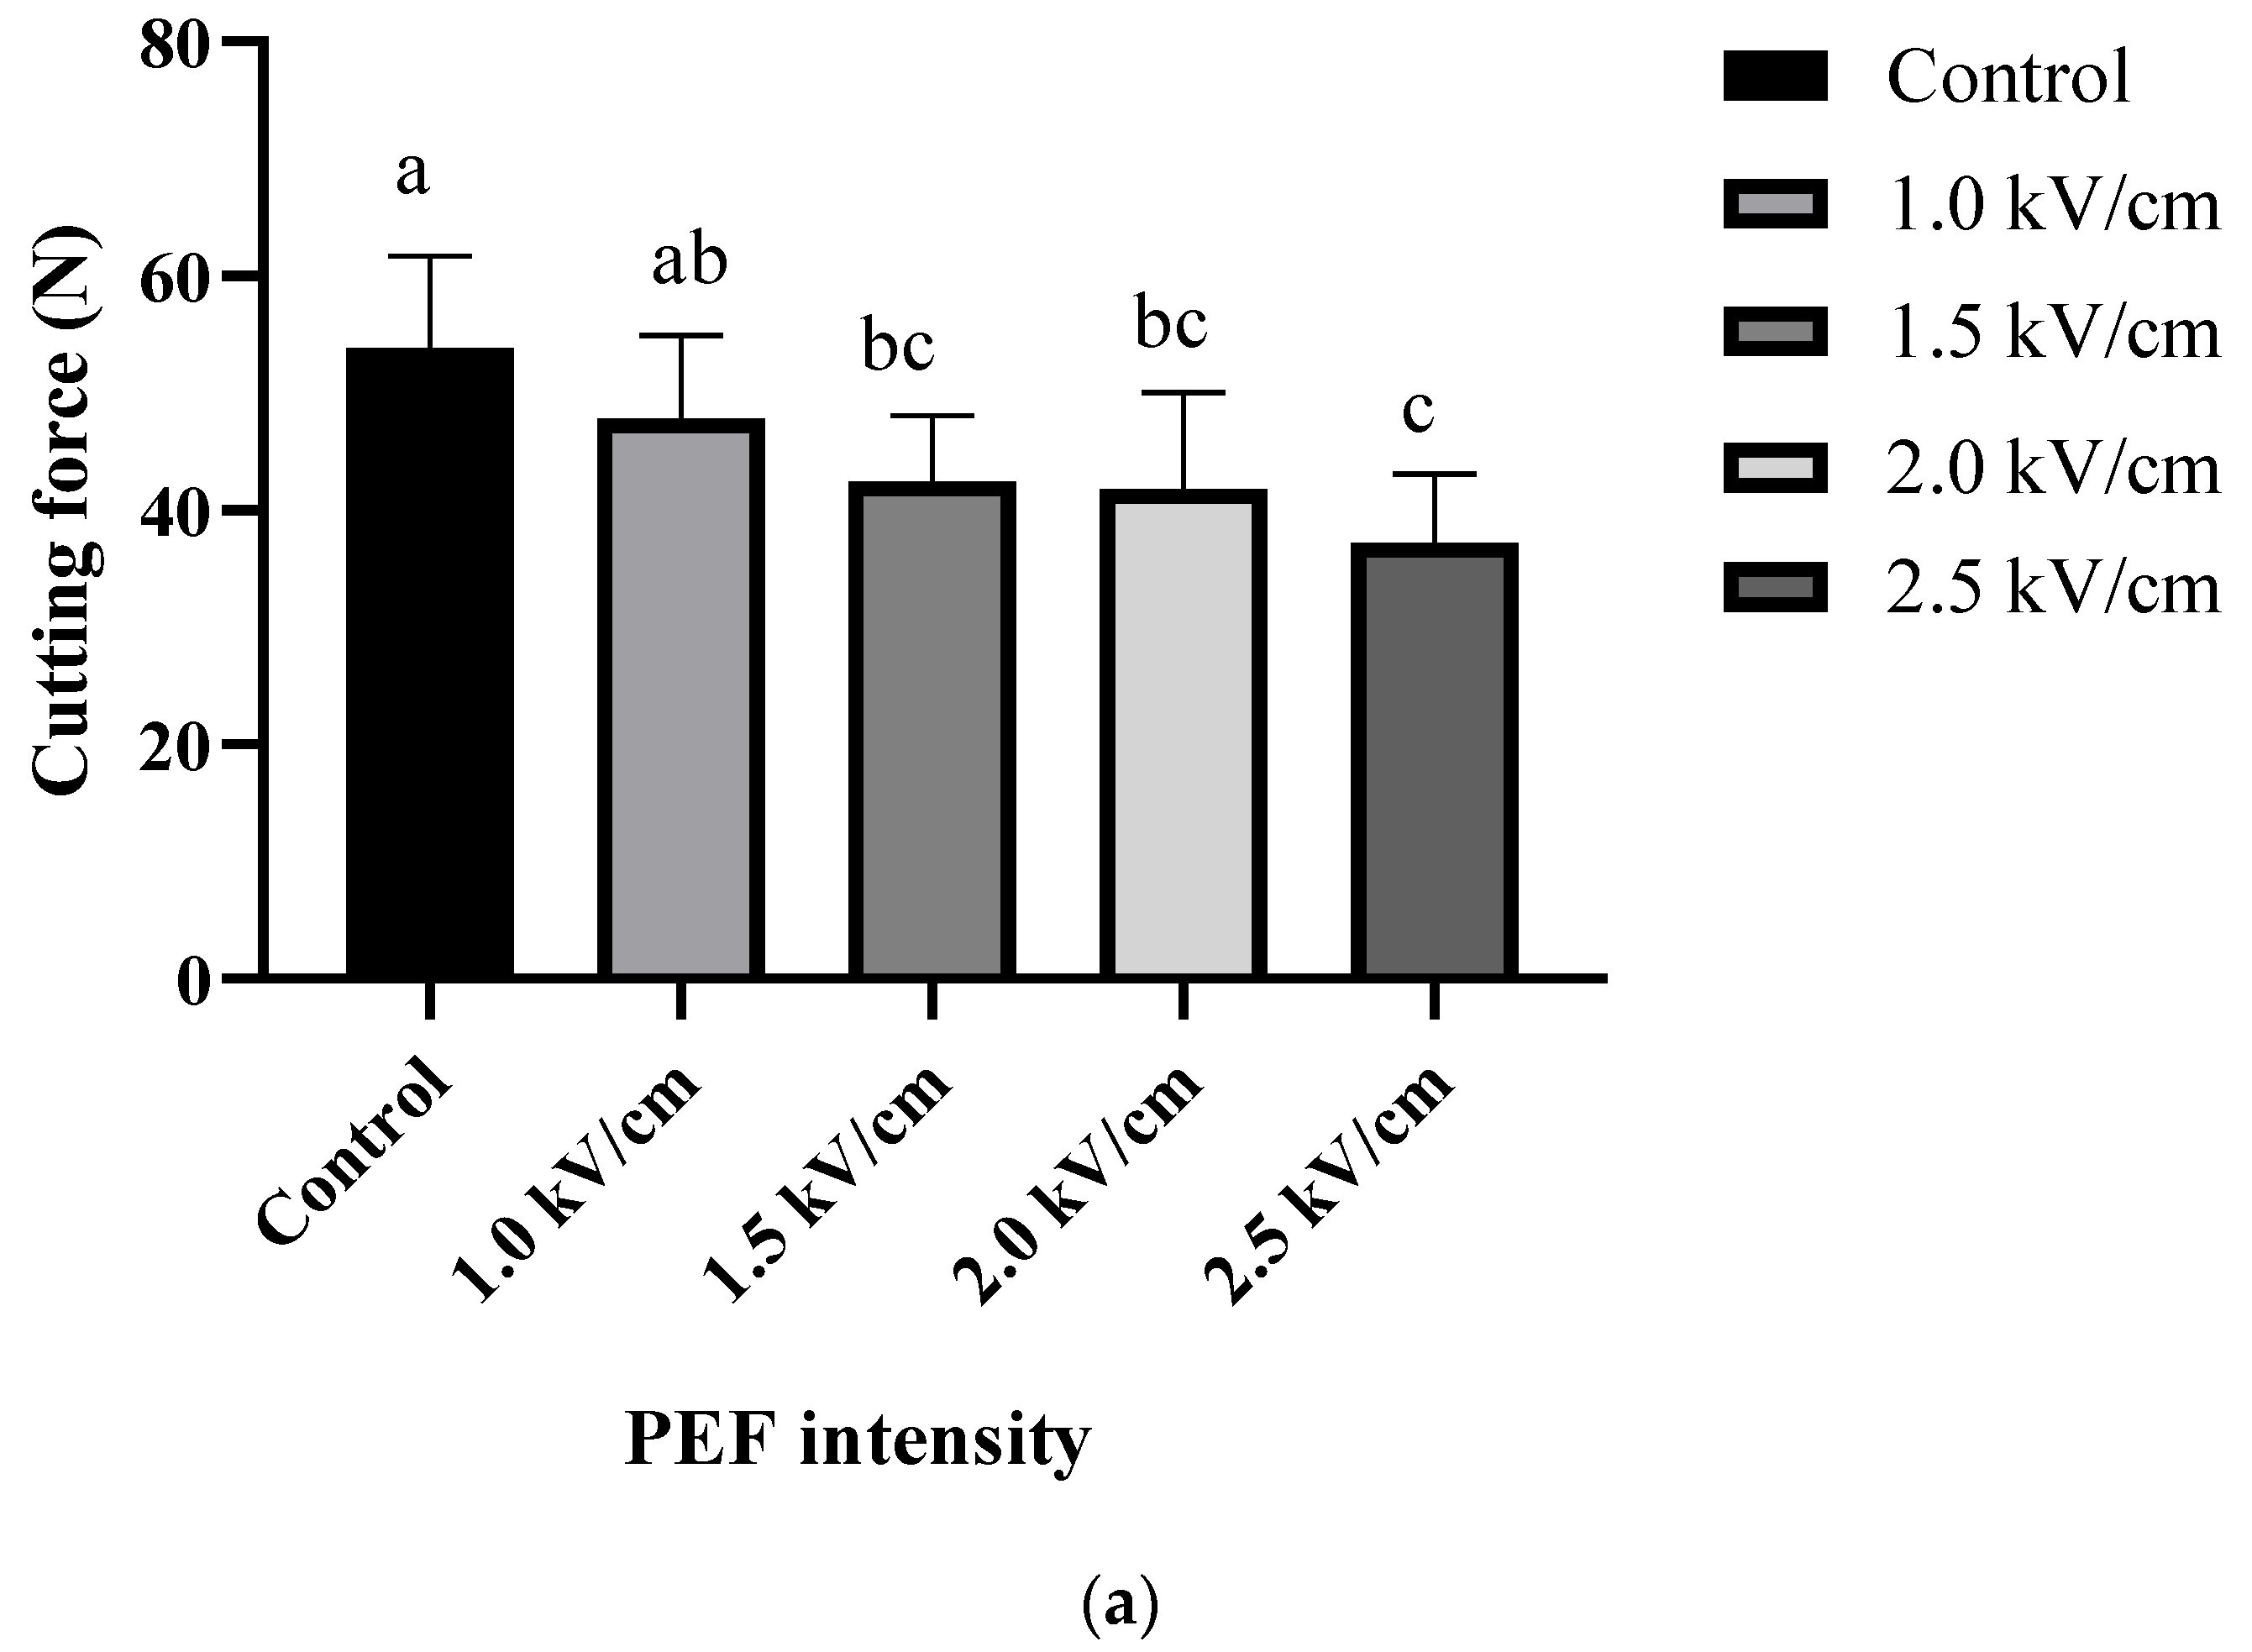
3.4. Cutting Force
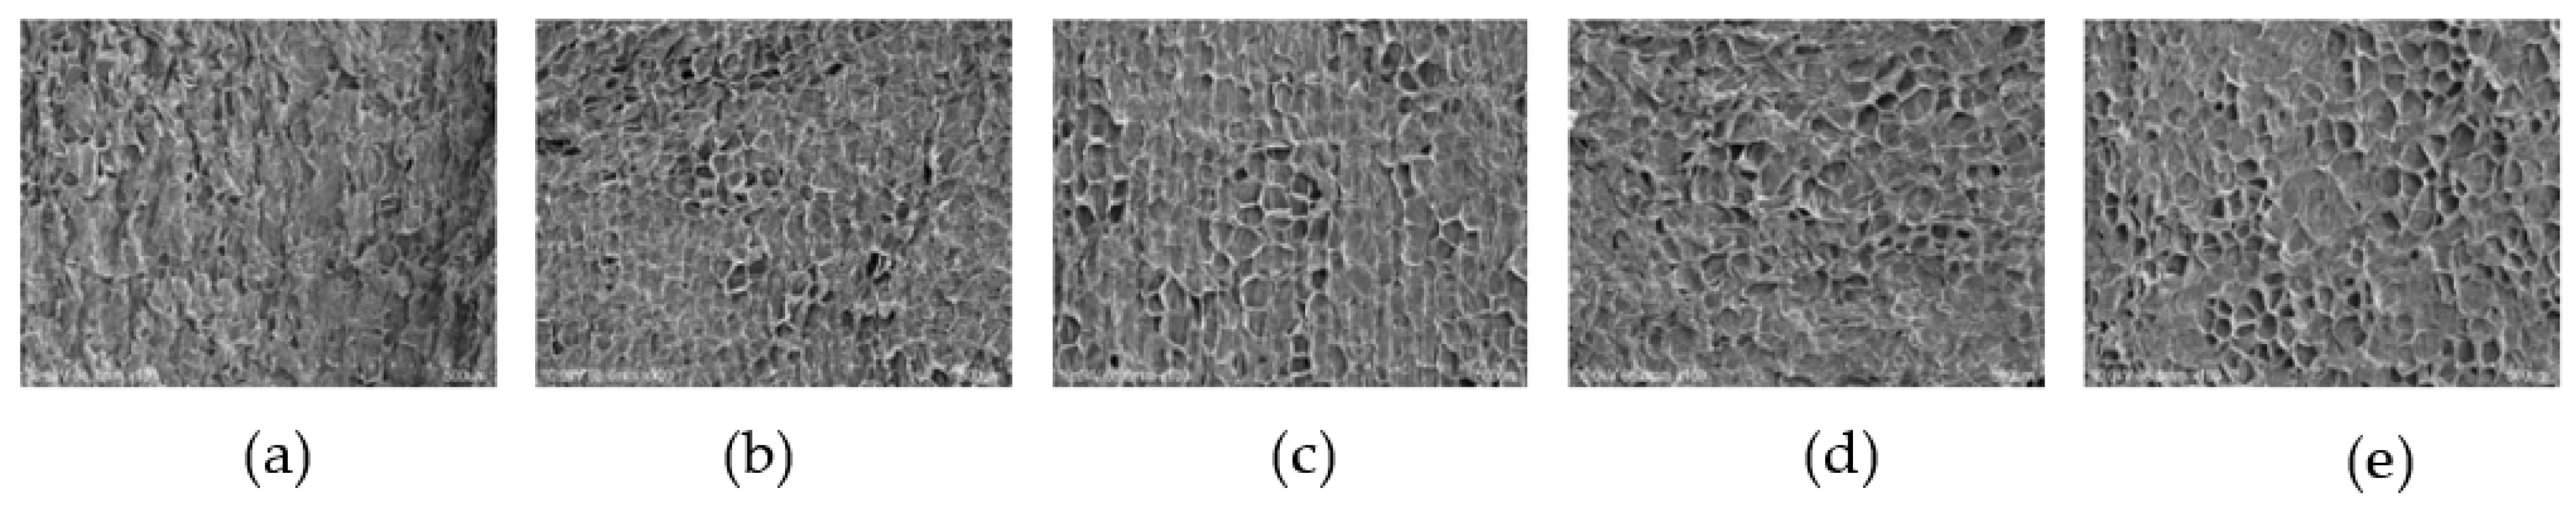
3.5. Microstructure
3.6. Total Carotenoid Content
4. Conclusions
Author Contributions
Funding
Data Availability Statement
Acknowledgments
Conflicts of Interest
References
- Santos, K.C.; Guedes, J.S.; Rojas, M.L.; Carvalho, G.R.; Augusto, P.E.D. Enhancing carrot convective drying by combining ethanol and ultrasound as pre-treatments: Effect on product structure, quality, energy consumption, drying and rehydration kinetics. Ultrason. Sonochem. 2021, 70, 105304. [Google Scholar] [CrossRef] [PubMed]
- Food and Agriculture Organization of United States Statistics. Crops and Livestock Products. 2022. Available online: https://www.fao.org/faostat/en/#homes (accessed on 11 October 2022).
- Sharma, K.D.; Karki, S.; Thakur, N.S.; Attri, S. Chemical composition, functional properties and processing of carrot—A review. J. Food Sci. Technol. 2012, 49, 22–32. [Google Scholar] [CrossRef] [PubMed]
- Alklint, C.; Wadsö, L.; Sjöholm, I. Effects of modified atmosphere on shelf-life of carrot juice. Food Control 2004, 15, 131–137. [Google Scholar] [CrossRef]
- Peng, J.; Bi, J.; Yi, J.; Wu, X.; Zhou, M.; Zhao, Y. Characteristics of cell wall pectic polysaccharides affect textural properties of instant controlled pressure drop dried carrot chips derived from different tissue zone. Food Chem. 2019, 293, 358–367. [Google Scholar] [CrossRef]
- Rahman, M.S. Handbook of Food Preservation; CRC Press: Boca Raton, FL, USA, 2007. [Google Scholar]
- Rahman, M.S.; Perera, C.O. Drying and food preservation. In Handbook of Food Preservation; CRC Press: Boca Raton, FL, USA, 2007; pp. 421–450. [Google Scholar]
- Schieber, A.; Carle, R. Occurrence of carotenoid cis-isomers in food: Technological, analytical, and nutritional implications. Trends Food Sci. Technol. 2005, 16, 416–422. [Google Scholar] [CrossRef]
- Özbek, H.N. Radio frequency-assisted hot air drying of carrots for the production of carrot powder: Kinetics and product quality. LWT 2021, 152, 112332. [Google Scholar] [CrossRef]
- Chen, J.; Venkitasamy, C.; Shen, Q.; McHugh, T.H.; Zhang, R.; Pan, Z. Development of healthy crispy carrot snacks using sequential infrared blanching and hot air drying method. LWT 2018, 97, 469–475. [Google Scholar] [CrossRef]
- Wiktor, A.; Parniakov, O.; Toepfl, S.; Witrowa-Rajchert, D.; Heinz, V.; Smetana, S. Sustainability and bioactive compound preservation in microwave and pulsed electric fields technology assisted drying. Innov. Food Sci. Emerg. Technol. 2021, 67, 102597. [Google Scholar] [CrossRef]
- Fratianni, A.; Niro, S.; Messia, M.C.; Panfili, G.; Marra, F.; Cinquanta, L. Evaluation of carotenoids and furosine content in air dried carrots and parsnips pre-treated with pulsed electric field (PEF). Eur. Food Res. Technol. 2019, 245, 2529–2537. [Google Scholar] [CrossRef]
- Wiktor, A.; Nowacka, M.; Dadan, M.; Rybak, K.; Lojkowski, W.; Chudoba, T.; Witrowa-Rajchert, D. The effect of pulsed electric field on drying kinetics, color, and microstructure of carrot. Dry. Technol. 2016, 34, 1286–1296. [Google Scholar] [CrossRef]
- Vorobiev, E.; Lebovka, N. Fundamentals of electroporation, theory and mathematical models for simulation of PEE processing. In Processing of Foods and Biomass Feedstocks by Pulsed Electric Energy; Springer: Cham, Switzerland, 2020; pp. 27–49. [Google Scholar]
- Angersbach, A.; Heinz, V.; Knorr, D. Electrophysiological model of intact and processed plant tissues: Cell disintegration criteria. Biotechnol. Prog. 1999, 15, 753–762. [Google Scholar] [CrossRef]
- Lebovka, N.I.; Bazhal, M.I.; Vorobiev, E. Estimation of characteristic damage time of food materials in pulsed-electric fields. J. Food Eng. 2002, 54, 337–346. [Google Scholar] [CrossRef]
- Biswas, R.; Hossain, M.A.; Zzaman, W. Thin layer modeling of drying kinetics, rehydration kinetics and color changes of osmotic pre-treated pineapple (Ananas comosus) slices during drying: Development of a mechanistic model for mass transfer. Innov. Food Sci. Emerg. Technol. 2022, 80, 103094. [Google Scholar] [CrossRef]
- Peleg, M. An empirical model for the description of moisture sorption curves. J. Food Sci. 1988, 53, 1216–1217. [Google Scholar] [CrossRef]
- García-Pascual, P.; Sanjuán, N.; Melis, R.; Mulet, A. Morchella esculenta (morel) rehydration process modelling. J. Food Eng. 2006, 72, 346–353. [Google Scholar] [CrossRef]
- Sadler, G.; Davis, J.; Dezman, D. Rapid extraction of lycopene and β-carotene from reconstituted tomato paste and pink grapefruit homogenates. J. Food Sci. 1990, 55, 1460–1461. [Google Scholar] [CrossRef]
- Won, Y.-C.; Min, S.C.; Lee, D.-U. Accelerated drying and improved color properties of red pepper by pretreatment of pulsed electric fields. Dry. Technol. 2015, 33, 926–932. [Google Scholar] [CrossRef]
- Teissié, J.; Eynard, N.; Gabriel, B.; Rols, M.P. Electropermeabilization of cell membranes. Adv. Drug Deliv. Rev. 1999, 35, 3–19. [Google Scholar] [CrossRef] [PubMed]
- Knorr, D.; Geulen, M.; Grahl, T.; Sitzmann, W. Food application of high electric field pulses. Trends Food Sci. Technol. 1994, 5, 71–75. [Google Scholar] [CrossRef]
- Angersbach, A.; Heinz, V.; Knorr, D. Effects of pulsed electric fields on cell membranes in real food systems. Innov. Food Sci. Emerg. Technol. 2000, 1, 135–149. [Google Scholar] [CrossRef]
- Töpfl, S. Pulsed Electric Fields (PEF) for Permeabilization of Cell Membranes in Food-and Bioprocessing–Applications, Process and Equipment Design and Cost Analysis. Ph.D. Thesis, Technische Universität Berlin, Berlin, Germany, 2006. [Google Scholar]
- Amiali, M.; Briki, S.; Bechaa, B.; Zitouni, B.; Raghavan, G.V. Pulsed Electric Field Effect Pretreatment on the Behavior of Microwave-assisted Pomegranate Arils (Punica granatum L.) Hot air Drying. Res. Sq. 2022, 1–24. [Google Scholar] [CrossRef]
- Jeong, S.H.; Kim, E.C.; Lee, D.U. The impact of a consecutive process of pulsed electric field, sous-vide cooking, and reheating on the properties of beef semitendinosus muscle. Foods 2020, 9, 1674. [Google Scholar] [CrossRef] [PubMed]
- Liu, C.; Pirozzi, A.; Ferrari, G.; Vorobiev, E.; Grimi, N. Impact of pulsed electric fields on vacuum drying kinetics and physicochemical properties of carrot. Food Res. Int. 2020, 137, 109658. [Google Scholar] [CrossRef]
- Tyree, M.T. The symplast concept a general theory of symplastic transport according to the thermodynamics of irreversible processes. J. Theor. Biol. 1970, 26, 181–214. [Google Scholar] [CrossRef] [PubMed]
- Botero-Uribe, M.; Fitzgerald, M.; Gilbert, R.G.; Midgley, J. Effect of pulsed electrical fields on the structural properties that affect french fry texture during processing. Trends Food Sci. Technol. 2017, 67, 111. [Google Scholar] [CrossRef]
- Weaver, J.C.; Chizmadzhev, Y.A. Theory of electroporation: A review. Bioelectrochem. Bioenerg. 1996, 41, 135–160. [Google Scholar] [CrossRef]
- Puértolas, E.; Cregenzán, O.; Luengo, E.; Álvarez, I.; Raso, J. Pulsed-electric-field-assisted extraction of anthocyanins from purple-fleshed potato. Food Chem. 2013, 136, 1330–1336. [Google Scholar] [CrossRef]
- Lammerskitten, A.; Mykhailyk, V.; Wiktor, A.; Toepfl, S.; Nowacka, M.; Bialik, M.; Czyżewski, J.; Witrowa-Rajchert, D.; Parniakov, O. Impact of pulsed electric fields on physical properties of freeze-dried apple tissue. Innov. Food Sci. Emerg. Technol. 2019, 57, 102211. [Google Scholar] [CrossRef]
- Leong, S.Y.; Richter, L.K.; Knorr, D.; Oey, I. Feasibility of using pulsed electric field processing to inactivate enzymes and reduce the cutting force of carrot (Daucus carota var. Nantes). Innov. Food Sci. Emerg. Technol. 2014, 26, 159–167. [Google Scholar] [CrossRef]
- Liu, T.; Dodds, E.; Leong, S.Y.; Eyres, G.T.; Burritt, D.J.; Oey, I. Effect of pulsed electric fields on the structure and frying quality of “kumara” sweet potato tubers. Innov. Food Sci. Emerg. Technol. 2017, 39, 197–208. [Google Scholar] [CrossRef]
- Moens, L.G.; De Laet, E.; Van Wambeke, J.; Van Loey, A.M.; Hendrickx, M.E. Pulsed electric field and mild thermal processing affect the cooking behaviour of carrot tissues (Daucus carota) and the degree of methylesterification of carrot pectin. Innov. Food Sci. Emerg. Technol. 2020, 66, 102483. [Google Scholar] [CrossRef]
- Karunasena, H.C.P.; Hesami, P.; Senadeera, W.; Gu, Y.; Brown, R.J.; Oloyede, A. Scanning electron microscopic study of microstructure of gala apples during hot air drying. Dry. Technol. 2014, 32, 455–468. [Google Scholar] [CrossRef]
- Nguyen, T.K.; Mondor, M.; Ratti, C. Shrinkage of cellular food during air drying. J. Food Eng. 2018, 230, 8–17. [Google Scholar] [CrossRef]
- Kingsly, A.R.P.; Meena, H.R.; Jain, R.K.; Singh, D.B. Shrinkage of ber (Zizyphus mauritian L.) fruits during sun drying. J. Food Eng. 2007, 79, 6–10. [Google Scholar] [CrossRef]
- Lewicki, P.P.; Pawlak, G. Effect of drying on microstructure of plant tissue. Dry. Technol. 2003, 21, 657–683. [Google Scholar] [CrossRef]
- Telfser, A.; Galindo, F.G. Effect of reversible permeabilization in combination with different drying methods on the structure and sensorial quality of dried basil (Ocimum basilicum L.) leaves. LWT 2019, 99, 148–155. [Google Scholar] [CrossRef]
- Barba, F.J.; Parniakov, O.; Pereira, S.A.; Wiktor, A.; Grimi, N.; Boussetta, N.; Saraiva, J.A.; Raso, J.; Martin-Belloso, O.; Witrowa-Rajchertd, D.; et al. Current applications and new opportunities for the use of pulsed electric fields in food science and industry. Food Res. Int. 2015, 77, 773–798. [Google Scholar] [CrossRef]
- López-Gámez, G.; Elez-Martínez, P.; Martín-Belloso, O.; Soliva-Fortuny, R. Changes of carotenoid content in carrots after application of pulsed electric field treatments. LWT 2021, 147, 111408. [Google Scholar] [CrossRef]
- Wiktor, A.; Dadan, M.; Nowacka, M.; Rybak, K.; Witrowa-Rajchert, D. The impact of combination of pulsed electric field and ultrasound treatment on air drying kinetics and quality of carrot tissue. LWT 2019, 110, 71–79. [Google Scholar] [CrossRef]
- Parniakov, O.; Bals, O.; Lebovka, N.; Vorobiev, E. Pulsed electric field assisted vacuum freeze-drying of apple tissue. Innov. Food Sci. Emerg. Technol. 2016, 35, 52–57. [Google Scholar] [CrossRef]


| Drying Model | Newton | Page | Henderson & Pabis | |||||||||
|---|---|---|---|---|---|---|---|---|---|---|---|---|
| Model Parameter | R2 | RMSE | SSE | Model Parameter | R2 | RMSE | SSE | Model Parameter | R2 | RMSE | SSE | |
| Control 1) | k = 0.5757 | 0.646 | 0.131 | 0.120 | k = 0.3311 n = 1.0750 | 0.999 | 0.005 | 0.001 | a = 1.0869 k = 0.3924 | 0.998 | 0.009 | 0.000 |
| 1.0 kV/cm | k = 0.6009 | 0.591 | 0.161 | 0.134 | k = 0.2470 n = 1.2929 | 0.999 | 0.010 | 0.001 | a = 1.3020 k = 0.4537 | 0.992 | 0.023 | 0.004 |
| 1.5 kV/cm | k = 0.7247 | 0.603 | 0.140 | 0.137 | k = 0.3746 n = 1.1760 | 0.979 | 0.032 | 0.007 | a = 1.5851 k = 0.6168 | 0.858 | 0.084 | 0.049 |
| 2.0 kV/cm | k = 0.7820 | 0.663 | 0.137 | 0.131 | k = 0.3614 n = 1.2832 | 0.998 | 0.010 | 0.007 | a = 1.5192 k = 0.6656 | 0.973 | 0.039 | 0.011 |
| 2.5 kV/cm | k = 0.8495 | 0.562 | 0.150 | 0.157 | k = 0.3724 n = 1.3000 | 0.983 | 0.030 | 0.007 | a = 2.2450 k = 0.8117 | 0.643 | 0.135 | 0.128 |
| Temp (°C) | Sample | Model Name | |||||||||||
|---|---|---|---|---|---|---|---|---|---|---|---|---|---|
| Peleg’s Model | Exponential Model | First-Order Model | |||||||||||
| Model Parameter | R2 | RMSE | MRE | Model Parameter | R2 | RMSE | MRE | Model Parameter | R2 | RMSE | MRE | ||
| 90 °C | Control 1 | k1 = 0.0815 k2 = 0.1311 | 0.9916 | 0.1109 | 2.5453 | k3 = 0.9367 k4 = 0.7074 | 0.9956 | 0.0105 | 2.3746 | k3 =0.8815 k4 = 1 | −209.72 | 2.3090 | 585.55 |
| 1.0 kV/cm | k1 = 0.0800 k2 = 0.1204 | 0.9854 | 0.1615 | 3.8241 | k3 = 0.8982 k4 = 0.7211 | 0.9864 | 0.0187 | 4.1473 | k3 = 0.8459 k4 = 1 | −182.17 | 2.1759 | 527.12 | |
| 1.5 kV/cm | k1 = 0.0757 k2 = 0.1198 | 0.9875 | 0.1513 | 3.4958 | k3 = 0.9309 k4 = 0.7261 | 0.9856 | 0.0195 | 4.4629 | k3 = 0.8731 k4 = 1 | −196.17 | 2.2773 | 568.71 | |
| 2.0 kV/cm | k1 = 0.0663 k2 = 0.1068 | 0.9927 | 0.1282 | 2.7456 | k3 = 0.9382 k4 = 0.7136 | 0.9940 | 0.0124 | 2.8911 | k3 = 0.8812 k4 = 1 | −206.87 | 2.3081 | 583.68 | |
| 2.5 kV/cm | k1 = 0.0572 k2 = 0.1077 | 0.9914 | 0.1385 | 2.7680 | k3 = 1.0378 k4 = 0.6984 | 0.9907 | 0.0155 | 3.9789 | k3 = −0.9683 k4 = 1 | −271.32 | 2.6592 | 743.28 | |
Disclaimer/Publisher’s Note: The statements, opinions and data contained in all publications are solely those of the individual author(s) and contributor(s) and not of MDPI and/or the editor(s). MDPI and/or the editor(s) disclaim responsibility for any injury to people or property resulting from any ideas, methods, instructions or products referred to in the content. |
© 2023 by the authors. Licensee MDPI, Basel, Switzerland. This article is an open access article distributed under the terms and conditions of the Creative Commons Attribution (CC BY) license (https://creativecommons.org/licenses/by/4.0/).
Share and Cite
Kim, S.-Y.; Lee, B.-M.; Hong, S.-Y.; Yeo, H.-H.; Jeong, S.-H.; Lee, D.-U. A Pulsed Electric Field Accelerates the Mass Transfer during the Convective Drying of Carrots: Drying and Rehydration Kinetics, Texture, and Carotenoid Content. Foods 2023, 12, 589. https://doi.org/10.3390/foods12030589
Kim S-Y, Lee B-M, Hong S-Y, Yeo H-H, Jeong S-H, Lee D-U. A Pulsed Electric Field Accelerates the Mass Transfer during the Convective Drying of Carrots: Drying and Rehydration Kinetics, Texture, and Carotenoid Content. Foods. 2023; 12(3):589. https://doi.org/10.3390/foods12030589
Chicago/Turabian StyleKim, Si-Yeon, Byung-Min Lee, Seok-Young Hong, Hyun-Ho Yeo, Se-Ho Jeong, and Dong-Un Lee. 2023. "A Pulsed Electric Field Accelerates the Mass Transfer during the Convective Drying of Carrots: Drying and Rehydration Kinetics, Texture, and Carotenoid Content" Foods 12, no. 3: 589. https://doi.org/10.3390/foods12030589
APA StyleKim, S.-Y., Lee, B.-M., Hong, S.-Y., Yeo, H.-H., Jeong, S.-H., & Lee, D.-U. (2023). A Pulsed Electric Field Accelerates the Mass Transfer during the Convective Drying of Carrots: Drying and Rehydration Kinetics, Texture, and Carotenoid Content. Foods, 12(3), 589. https://doi.org/10.3390/foods12030589