1. Introduction
Different types of cheese have been produced in wide-ranging textures, flavors, and forms, in different regions with unique cultures and environments. Different cheesemaking techniques have been developed over time in response to new technologies and consumer demands. Cheeses can be grouped or classified according to criteria such as the production method, animal milk used, ripening process, country of origin, texture, fat and moisture content, etc. However, key differences in cheese characteristics can generally be attributed to the origin of the milk, moisture content, variation in the container for ripening and preservation, as well as lengths of aging [
1].
White brine cheeses (WBC) undergo a ripening process during which they develop microbiological and technological characteristics [
1]. WBC are particularly popular in Balkan, Middle Eastern, and Mediterranean regions, and in North Africa and Eastern Europe. They include a large number of varieties, such as Feta (Greece), Telemea or Telemes (Romania, Greece), Akawi (Lebanon, Syria), Halloumi (Cyprus) etc., and are produced by different processing methods, so they have differences in their physico-chemical, textural, and sensory properties [
2]. Their manufacture dates back thousands of years (approximately 8000 years ago) [
3].
WBC, in general, have a texture that varies from soft to semi-hard. These cheeses have no rind, a slightly acidic taste, due to the action of lactic acid bacteria during ripening, and a salty taste, which arises from storage in brine. Therefore, salt and acid are the critical parameters for the conservation of these types of cheese [
4,
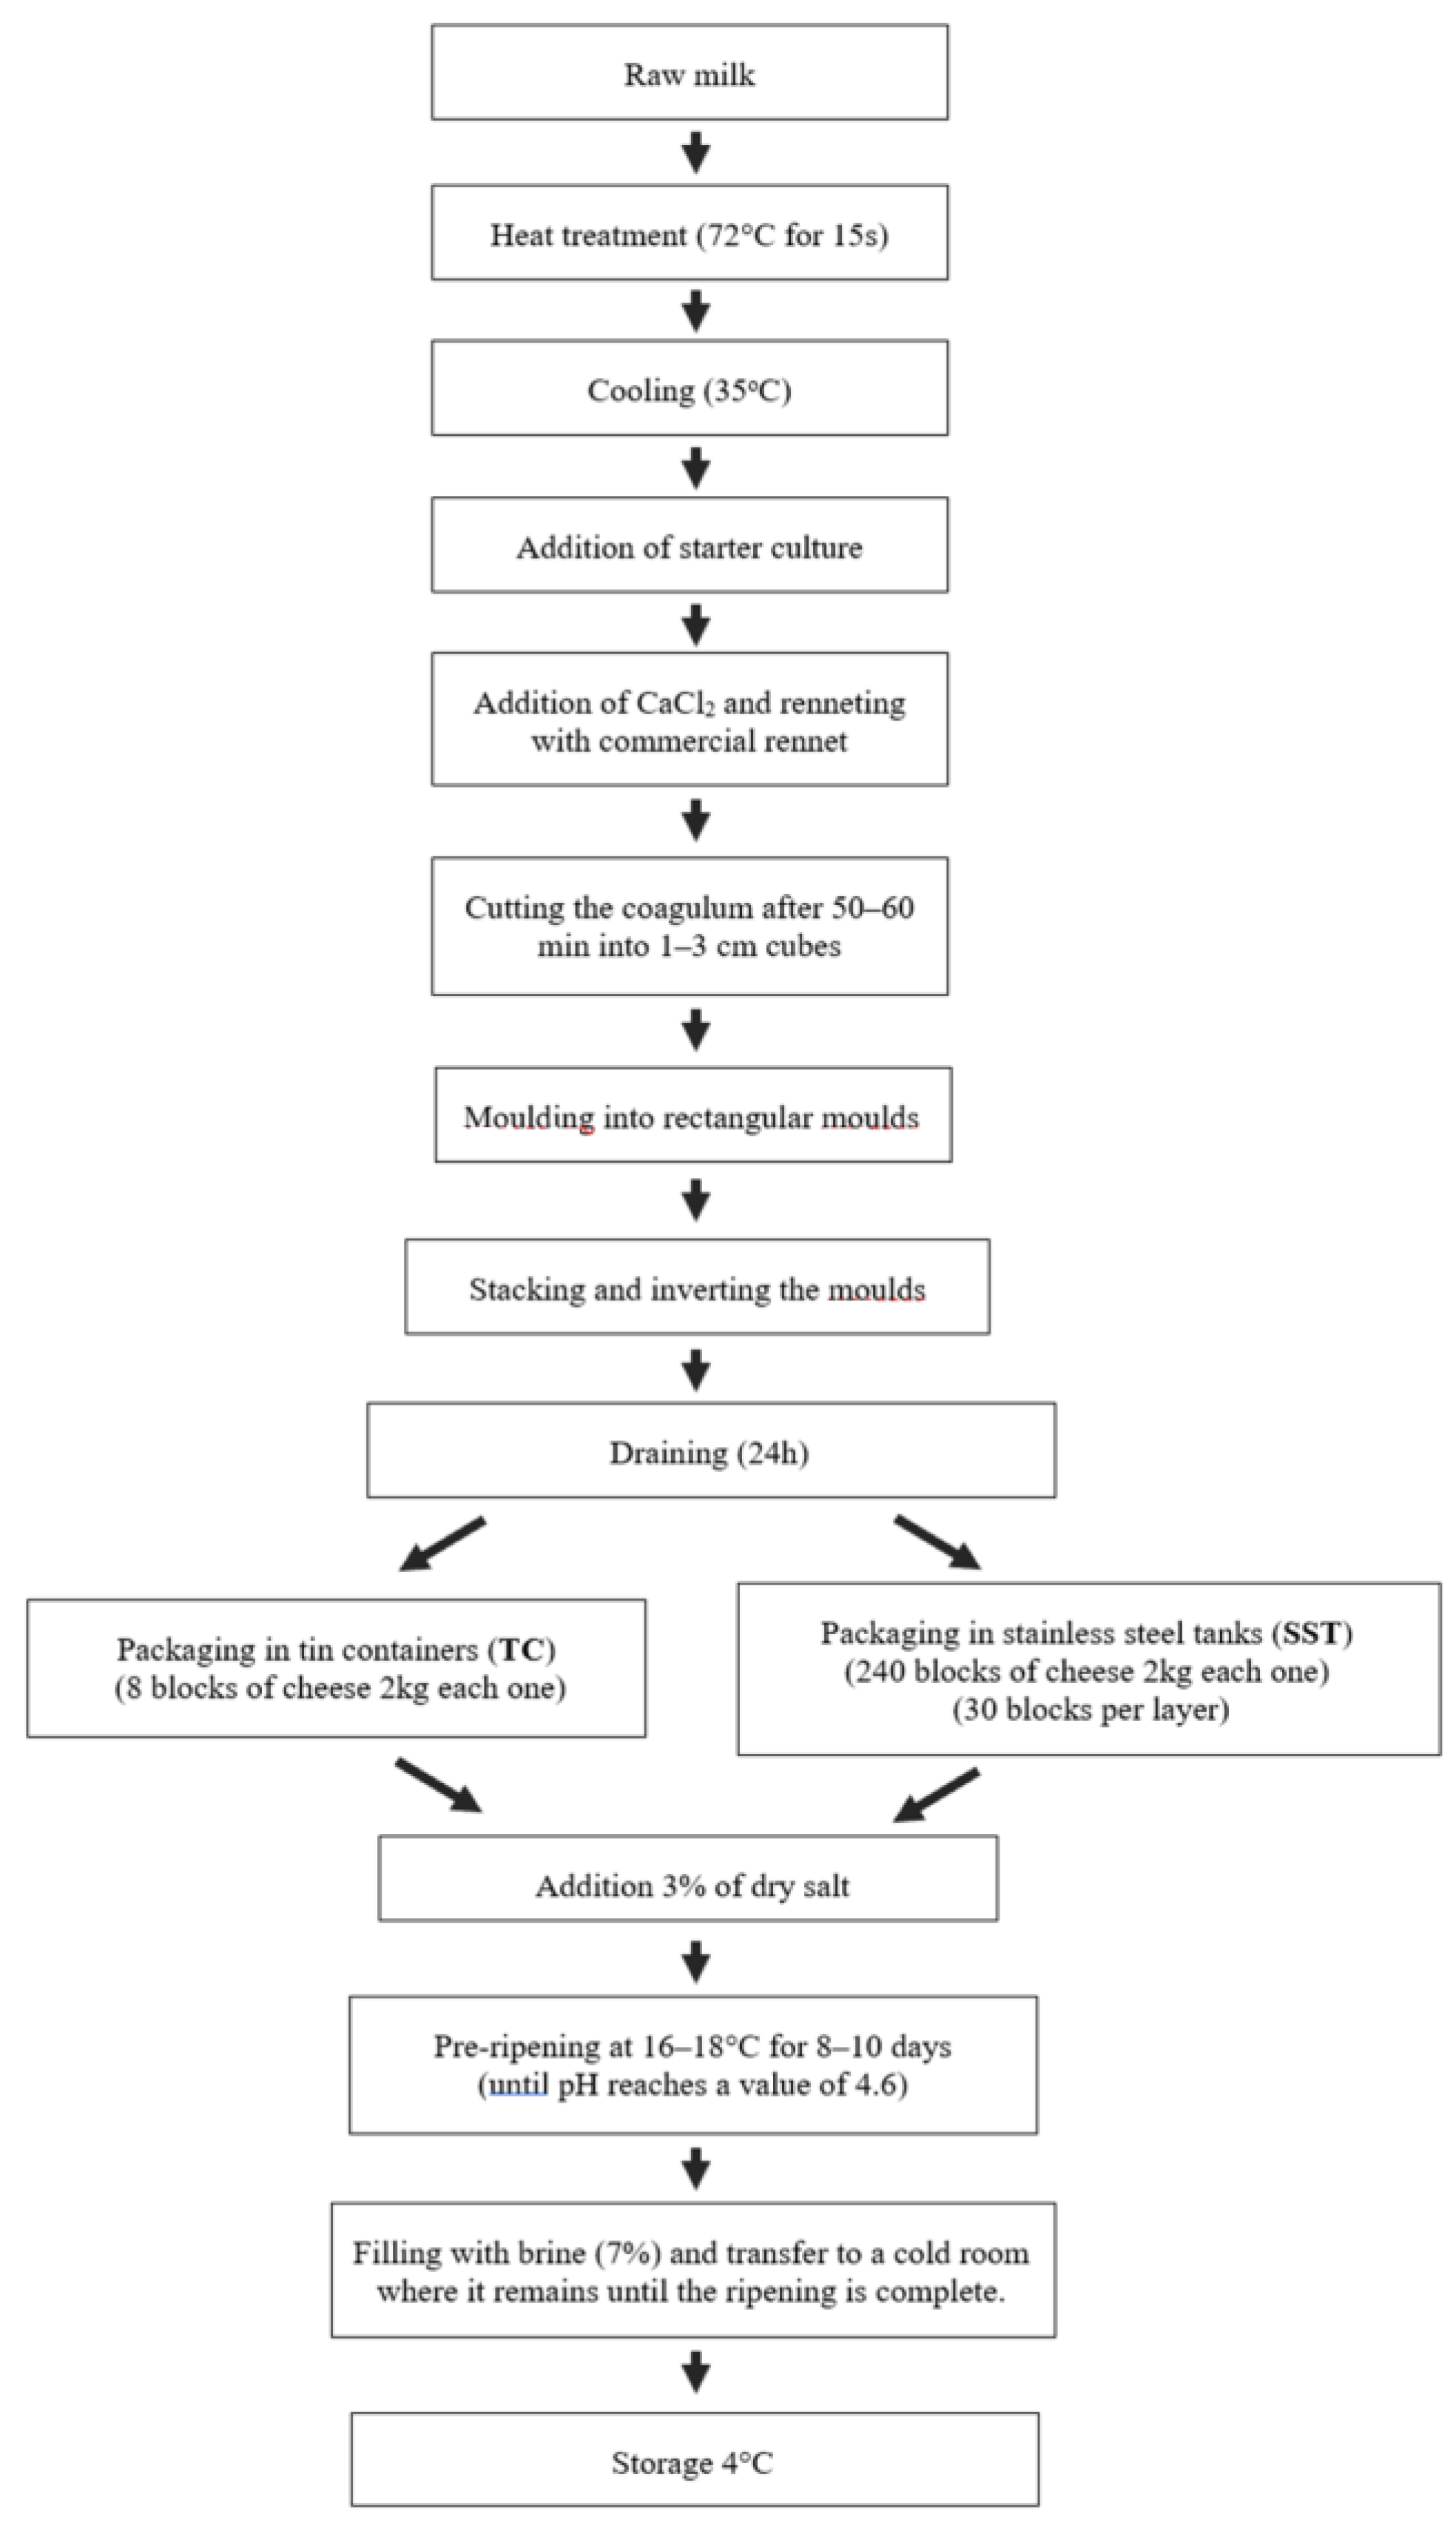
5]. The main differences among the cheeses are observed in the manufacturing process (for example, milk type, coagulation time and temperature, pressure during draining, shape and size of the curd, and salting of the curd before brining). Sheep or goat milk, or their mixture, is commonly used in their production, however, due to the high purchasing demand, other types of milk, such as cow’s or buffalo’s, can be used [
4]. Raw (according to legislation) or pasteurized (72 °C for 15 s or 63 °C for 30 min) milk cheese is used in WBC manufacture [
6]. Thermophilic or mesophilic lactic acid bacteria, or combination of them, are commonly used as starter cultures. Non-starter lactic acid bacteria (NSLAB) are predominant when using unpasteurized milk in production.
WBC are white in color, except for those made from cow’s milk that gives a yellowish color due to the presence of carotenoids. These cheeses have no gas holes but they sometimes develop small mechanical openings [
3]. The texture of WBC is smooth, soft, and crumbly but still sliceable, and some of them may become brittle when old [
6]. Their flavor is slightly sour to very salty and, for some varieties, mildly acidic and piquant. The shape varies but is usually produced in rectangular or cubic blocks that weigh 250–1000 g. The cheeses are packed in containers of various capacities. The most common are rectangular tin cans, lacquered metal or plastic containers with up to 15–16 kg capacity or, traditionally, wooden barrels of 40–50 kg capacity [
3,
6]. Most WBC are consumed fresh after ripening for 2 months or more in brine (8–10% NaCl concentration) [
3,
6]. Post-ripening, WBC are repacked in plastic bags under vacuum (without brine) or in plastic containers with brine [
6].
Tin cans are usually used for the ripening and preservation of WBC, before their sub-packaging in smaller containers. However, in recent years, stainless steel tanks of large capacity have been used more and more, mainly in large cheese factories. More specifically, the use of tin containers (TC) was one of the most suitable for the ripening, packaging, and handling of brine cheeses due to their low cost, light weight per unit area, easy handling, and O2 product protection. Over the years, TC have been partially replaced by other materials, such as plastic and stainless steel. The latter is resistant to corrosion and low temperatures, accepts electro-polishing, and offers the product protection from O2, light, odors, and microorganisms. An advantage of the stainless steel tanks (SST) is their reusability and ease of cleaning, even with a CPI system. Thus, the use of SST containers is constantly increasing and mainly by cheese factories, where a large part of their production is intended for repackaging.
Although there are many research studies that refer to the characteristics of WBC matured and preserved in tin or wooden containers, no research to date provide data on the characteristics of cheeses that are ripened and preserved in large capacity stainless steel tanks (SST) (approximately 500 kg).
Considering the growing interest in the use of large capacity containers for ripening and preservation, this study aims to investigate the use of stainless steel tanks (SST), and their effect on the quality of WBC, comparing this to those ripened in tin containers (TC). The physico-chemical, microbiological, textural, and sensory characteristics of WBC, made from sheep’s milk, were studied during their preservation over 180 days in SST and TC.
3. Results and Discussion
3.1. Physico-Chemical Composition
The results of the physico-chemical analysis of the experimental cheeses and brines during the ripening–preservation period are shown in
Table 1 and
Table 2. The type of containers (TC and SST) did not have a statistically significant (
p > 0.05) effect on the content of total solids, moisture, fat, protein, ash, salt, and pH between both the WBC and the brines of the two groups (TC and SST).
After 10 days of ripening, the pH of the cheeses kept in TC and SST decreased, at 4.43 and 4.45, respectively, which is desirable. At 60 days onwards, both white brine cheeses (kept in TC and SST) had the desired pH (up to 4.5). The same pH (<4.6) was observed in the respective brines too. This pH value is particularly important in order to prevent microbial spoilage.
At 60 days onwards, when the cheese is considered ready for consumption, the average moisture content of the cheeses being ripened in TC and SST ranged from 53.04 to 56.34% and 54.13 to 54.63%, respectively. Both cheeses (TC and SST ripened), are classified as quality A, as set out in Greek legislation [
20].
During the ripening–preservation process, the fat content (expressed on dry matter) of both cheeses was similar. At 60 days, the fat content of TC- and SST-ripened cheeses ranged from 51.64 to 53.50% and 52.18 to 53.74%, and that remained constant up to 90 days. Based on their fat content, the cheeses from both groups are classified as quality A based on Greek legislation [
20].
The protein content (expressed on dry matter) of both TC- and SST-ripened cheeses was similar (p > 0.05); during ripening–preservation, and after the 60th day, this ranged from 34.26 to 35.84% and 34.80 to 36.24%, respectively. Both groups presented their maximum value at day 90. In addition, the protein content of the respective brine, was seen to increase continuously up to day 90, when a maximum value for both brines was recorded. This probably indicates the transfer of proteins from the cheese to the brine.
The salt concentration in both cheese groups increased over time and, on the 60th day onwards, ranged from 2.77 to 3.19% and 2.90 to 3.24% in TC and SST, respectively. No significant statistical differences (p > 0.05) were observed in the salt concentration of SST-ripened cheeses compared to the TC cheeses. This can be confirmed by the salt content of the brine which, in both cases, decreased up to the 90th day.
The ash content of the cheeses (in TC and SST) was similar (
p > 0.05) and increased over time and varied from 3.29 to 3.74% and 3.44 to 3.81% for TC and SST, respectively. The physico-chemical characteristics and the pH of TC- and SST-ripened cheeses, throughout their ripening–preservation process, agree with those described in recent research works [
21,
22,
23,
24].
3.2. Major Mineral Composition
Table 3 and
Table 4 show the composition of the major minerals (Ca, Mg, K, and Na) in TC-/SST-ripened cheeses, and the respective brines, during their ripening–preservation. The different ripening–preservation containers did not statistically significantly (
p > 0.05) affect the concentration of mineral in both cheese groups and the respective cheese brines throughout the ripening–preservation process.
From the 60th day onwards, the concentration of Ca and K was similar, for TC (223.96–313.67 mg 100 g
−1 and 48.65–86.95 mg 100 g
−1) and SST (235.05–280.59 mg 100 g
−1 and 59.42–75.73 mg 100 g
−1). The concentration of Mg did not have significant differences between the TC and SST cheeses. This was observed throughout the ripening and preservation of the cheeses, as shown in the
Table 3. The concentration of Na was similar for both groups of cheeses (1053.40–1215.50 mg 100 g
−1 for TC cheeses and 1167.88–1266.06 mg 100 g
−1 for SST cheeses) with the highest being noted at day 180, as was also observed with the salt concentration (
Table 1).
The composition of the inorganic elements in both TS- and SST-ripened cheeses, throughout the ripening–preservation process, agrees with previous findings. The amount of Ca and Mg found in TC and SST cheeses were slightly lower than those reported by Abou Jaoude et al. and Barać et al. [
25,
26], while the concentration of K and Na agreed with those reported by Barać et al. [
25].
Regarding the brines, the concentrations of Ca and Mg were similar in both groups (with the exception of the 10th day, when Ca was statistically significantly higher in SST, p-value = 0.042). In the TC brine, Ca and Mg ranged between 372.33 and 450.60 mg 100 g−1 and 27.85 and 29.91 mg 100 g−1, respectively, while, in SST brine, Ca and Mg ranged between 354.97 and 413.09 mg 100 g−1 and 24.60 and 28.42 mg 100 g−1. The concentration of K ranged from 104.80 to 120.09 and 92.73 mg 100 g−1 to 130.12 for TC and SST brines, respectively, with the highest values being noted on the 180th day. Finally, the concentration of Na was similar in the two groups of brines throughout the ripening–preservation process, with values ranging from 2046.38 to 2255.00 mg 100 g−1 and 2234.93 to 2371.95 mg 100 g−1 for TC and SST brines, respectively.
3.3. Proteolysis
Proteolysis is the most important biochemical event during the ripening of most rennet-coagulated cheese varieties, with a major impact on flavor and texture. During the ripening of the cheeses, caseins are hydrolyzed, resulting in water-soluble nitrogenous fractions (WSN). These fractions are indicators of the proteolysis that the cheeses undergo, which describes the speed and manner of ripening of the cheeses. Proteolysis, in terms of both SN and low-molecular-weight nitrogen fractions (i.e., TCA–SN and PTA–SN) expressed on cheese weight, is lower in brined cheeses compared to semi-hard and hard cheeses [
10]. The main reason is the higher moisture content (53–56%) compared to the other cheeses groups and the very high salt-in-moisture content. Furthermore, the migration of whey proteins and soluble proteolysis products into the brine limits the concentration of these products in the cheese mass [
10].
Table 5 shows in detail the course of the WSN/TN, TCA-N/TN, and TCA-N/WSN indices of the cheeses ripened and preserved in TC and SST containers. The water-soluble nitrogen ratio (WSN/TN) increased from 8.19% on day 1 to 10.29% and 10.41% for (TC) and (SST), respectively, on day 10, and remained at these levels until, on the 180th day of preservation of the cheeses, they showed small, but not statistically significant, differences (
p > 0.05). No significant difference (
p > 0.05) was found for ripening index between the two groups of cheeses during ripening–preservation. The values of the WSN/TN index found for both the TS and SST groups of cheese during the ripening–preservation process agreed with those reported by Zoidou, et al. and by Abd El Salam and Alichanidis [
22,
27]. The TCA-N/TN index showed a similar trend and no significant differences (
p > 0.05) between the two groups of cheeses. The TCA-N/TN values in the TS and SST cheeses are in accordance with those of other research studies [
22,
27]. Finally, the TCA-N/WSN index showed no statistically significant differences (
p > 0.05) between the two groups during ripening–preservation. Therefore, considering the above, we can draw the conclusion that there was a slightly increased ripening speed in the TC cheeses, up to 90 days; however, at 180 days, the level of proteolysis of both groups of cheeses was similar.
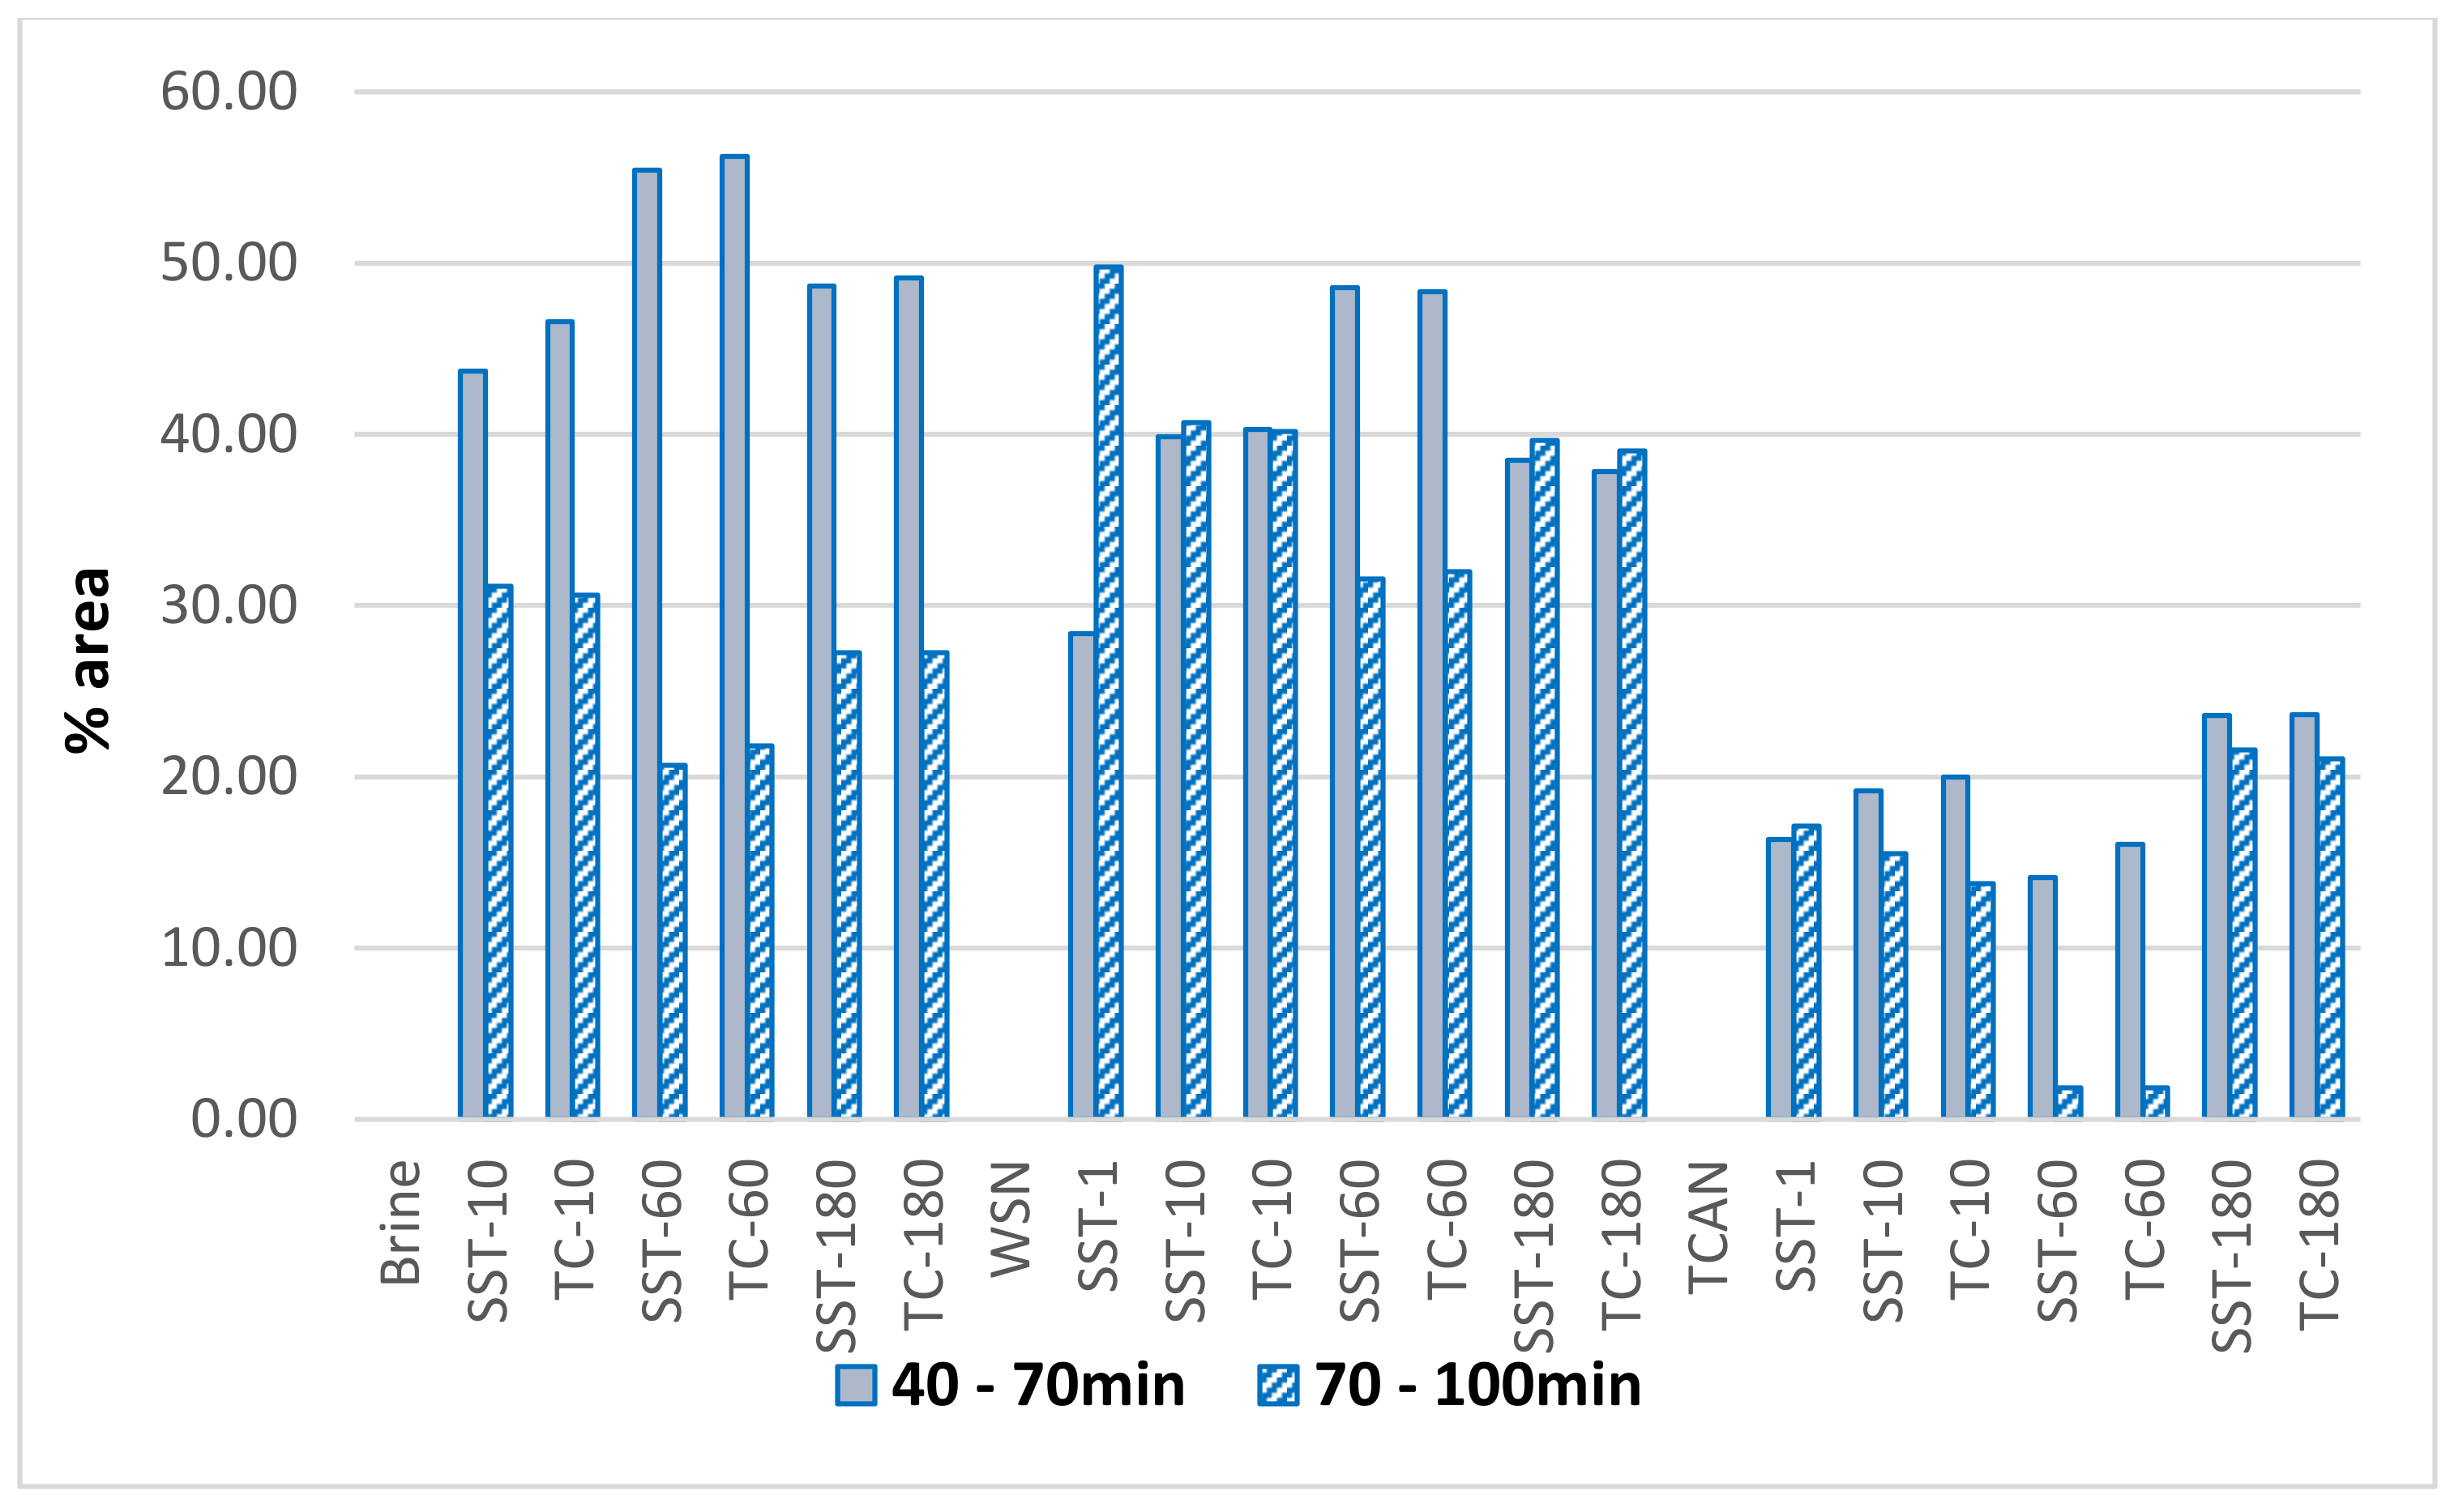
Figure 2 and
Table 6,
Table 7 and
Table 8 show the evolution of the characteristic regions of the RP-HPLC profiles. Chromatograms show some free amino acids and non-nitrogenous soluble components (eluted in the 0–10 min interval), followed by small peptides and the majority of free amino acids (proteolysis products) (in the 10–40 min interval), the water-soluble components (in the 40–70 min interval), and, finally, the hydrophobic components, large peptides, and whey proteins (in the 70–100 min interval). Comparing the chromatographic analysis of the nitrogen fractions of the cheeses and brines in the two ripening-preservation media (TC and SST), no differences were found between them. Specifically, the percentages of the chromatographic surfaces in the time intervals 0–10, 10–40, 40–70, and 70–100 min, of the chromatograms and the ratios (55–100 min)/(10–55 min), and (70–100 min)/(0–70 min) of the nitrogen fractions of cheeses (WSN/TN and TCA-N/TN
Table 7 and
Table 8, respectively) and brines (
Table 6), were similar during ripening–preservation in TC and SST, and did not present any statistically significant difference (
p > 0.05).
At the 70–100 min range, hydrophobic peptides and whey proteins were eluted. Much of the nitrogenous components of the brine consist of such components (20–30%) throughout the ripening of both cheese types. This shows how whey proteins diffuse into the brine. However, more than 50% of the brine peptides appear to be composed of the soluble components of the 40–70 range, following the course of their increase in the cheese. Therefore, the level of proteolysis and the rate of ripening were similar in TC and SST cheeses.
3.4. Fatty Acids Profile
Individual fatty acids and the proportion of fatty acid groups (saturated, SFA; mono-unsaturated, MUFA; and polyunsaturated, PUFA) found in both the TC and SST WBC, at the 60th, 90th, and 180th day of ripening–preservation, are shown in
Table 9. The most abundant FAs throughout the ripening–preservation period were palmitic acid (C16:0), oleic (C18:1n-9), and myristic (C14:0) acids. The values for palmitic acid and oleic acid for TC cheeses ranged from 30.74 to 31.14% and 19.14 to 20.72%, respectively, while, for SST, they ranged from 30.24 to 31.08% and 19.14 to 20.72%, respectively. Myristic acid, the third most abundant FA, showed a statistically significant difference between the TC and SST cheeses on day 60 (
p-value = 0.027) and day 90 (
p-value = 0.017). For the other identified FAs, similar values with no statistically significant differences (
p > 0.05) were found between the two groups of cheeses, with the exception of the caprylic acid which presented a statistically significant difference (
p-value = 0.038) on day 90, with SST having a higher value than TC. Overall, the values of the cheeses, regarding their SFA, MUFA, and PUFA content, were similar between the TC and SST cheeses, and no statistical difference was observed between them (
p > 0.05). Therefore, we can claim that the different ripening–preservation containers did not affect their fatty acid content. The fatty acid composition reported here was similar to that reported by other studies concerning white brine cheeses [
21,
23,
28].
3.5. Volatile Compounds
The results of the volatile compounds analysis of WBCs are shown in
Table 10. A total of 94 volatile compounds were identified and grouped into the following chemical classes: organic acids (15), alcohols (16), aldehydes (10), esters (13), ketones (11), lactones (5), terpens (6), alcanes (8), and amines (3). Organic acids, alcohols, and esters, both in number and amount, are the dominant chemical groups. Regarding the individual identified volatile compounds, no significant differences were observed between the TC and SST cheeses. Organic acids were the most abundant chemical class in both cheeses (TC and SST) with acetic acid, decanoic acid, hexanoic acid, and octanoic acid representing about 78% of the total amount of organic acids. Each of them gives a characteristic flavor note [
21]. In general, fatty acids, having between 4 and 20 carbon atoms, are formed through lipolysis by microbial lipases. The shorter fatty acids may come (originate) from the degradation of lactose and amino acids, as well as from the oxidation of ketones, esters, and aldehydes [
21,
29]. As expected, the samples (TC and SST) had the highest content of total organic acids on the 180th day (3828.29 mg/kg for TC and 3846.02 mg/kg for SST). From the chemical class of alcohols, the major alcohol was ethanol (both in TC and SST) throughout their ripening–preservation period, with the maximum value in both cases being noted on the 180th day (530.41 and 549.44 for TC and SST, respectively), which was expected, considering that its formation is due to lactose fermentation, proteolysis, and reduction in acetaldehyde [
21,
29]. Esters can be produced enzymatically or chemically through the reaction of short to medium chain fatty acids with primary and secondary alcohols that both derive from lactose fermentation and amino acid catabolism [
21,
30].
Regarding the chemical class of esters, it was observed that their total amount increased with time, with the maximum value being noted on the 180th day in both TC- (220 mg/kg) and SST- (275.48 mg/kg) ripened cheeses. The esters detected in large quantities in all cheese samples were acetic acid 2-phenylethylester, decanoic acid ethylester, and 2-ethenyloxyethanol. Among the less abundant groups, alkanes and terpenes, lactones, and ketones were more represented in both cheeses at 180 days. The volatile profile of white brine cheese in this study is close to those reported by other studies concerning this type of cheese [
21,
31].
3.6. Texture Profile Analysis
Table 11 shows the textural characteristics of the TC- and SST-ripened cheeses during the ripening–preservation period. The ripening–preservation containers did not significantly (
p > 0.05) affect the textural characteristics of the cheeses, as their values had been similar over time.
The hardness of both groups of cheeses increased with time and specifically in the period of 60–180 days. This increase was enhanced by the progressive increase in the salt and ash content of the respective cheeses during the 60th–180th days [
16], and the decrease in the fat content during the 90th–180th days [
32]. Both cheese groups showed the lowest (6.04 ± 1.90 N for TC and 7.14 ± 2.47 N for SST) and the highest (9.66 ± 1.10 N for TC and 8.45 ± 2.29 N for SST) values on the 60th and 180th days, respectively. Due to the increase in hardness, the gumminess and chewiness of both cheeses also increased during their ripening–preservation. The cheeses (TC and SST) showed the highest value in gumminess and chewiness on day 180 (3.44 ± 0.37 N and 3.67 ± 0.26 J for TC, and 2.99 ± 0.86 N and 5.89 ± 2.48 J for SST, respectively). The value of the adhesiveness (in both groups of cheeses) increased (in absolute value). Finally, the cohesiveness of the cheeses increased in both groups, showing their maximum value on the 180th day (0.36 ± 0.02 for TC and 0.35 ± 0.01 for SST). As an exception, at day 90, the cohesiveness of the TC cheese decreased. Overall, the values of the textural characteristics of both TC- and SST-ripened cheeses reported here are similar to those reported by Kaminarides et al. [
33], with the exception of the adhesiveness and gumminess parameters.
3.7. Microbiological Evolution during Cheese Ripening–Preservation
The microbiological results, total viable count (TVC), and molds/yeasts concerning the cheeses of the two groups and the respective brines during their ripening–preservation are presented in
Table 12 and
Table 13.
The TVCs in both cheeses and brines decreased over the ripening–preservation period. The mesophilic flora had quite similar values in both the cheeses and brines of the two groups. No statistically significant differences (p > 0.05) were found between the cheeses of the two groups and the respective brines, except for the 90th day, when the brine at TC showed a significantly (p = 0.041) higher TVC than that of the SST brine.
Molds/yeasts counts were low in both TC- and SST-ripened cheeses and brines. Different ripening–preservation containers did not statistically significantly (
p > 0.05) affect the population of molds/yeasts, neither in the cheeses nor in the brines. The results regarding the TVC and the molds/yeasts, observed in both TC and SST cheeses during their ripening–preservation, agree with those reported in other studies [
22,
34].
3.8. Sensory Evaluation
The results of the sensory evaluation of the cheeses are presented in the
Table 14. Specifically, the TC- and SST-ripened cheeses did not show significant differences (
p > 0.05) between them regarding their appearance/color, structure/texture, and flavor/odor, with their scores being similar throughout their ripening–preservation. On days 60 and 90, the cheeses (of both groups) had the characteristics of mature cheeses, with a semi-hard texture and a pleasant acidic taste. Both cheese groups obtained the highest total score on day 90 (91.45% ± 1.97 for TC and 90.95% ± 4.60 for SST, with coefficients of 4 and 5, respectively). The high score of the structure parameter, on day 90, was expected due to the fact that the gradual accumulation of total solids and large water-soluble peptides showed their maximum value for both groups of cheeses on day 90 as well. However, the cheeses of both groups received lower scores on day 180, which was expected since proteolysis and lipolysis are more intense during that time. The cheeses were characterized by a pleasant, acidic taste.


