
Investigating the Contribution of Blending on the Dough Rheology of Roller-Milled Hard Red Wheat

Abstract
1. Introduction
2. Materials and Methods
2.1. Test Material
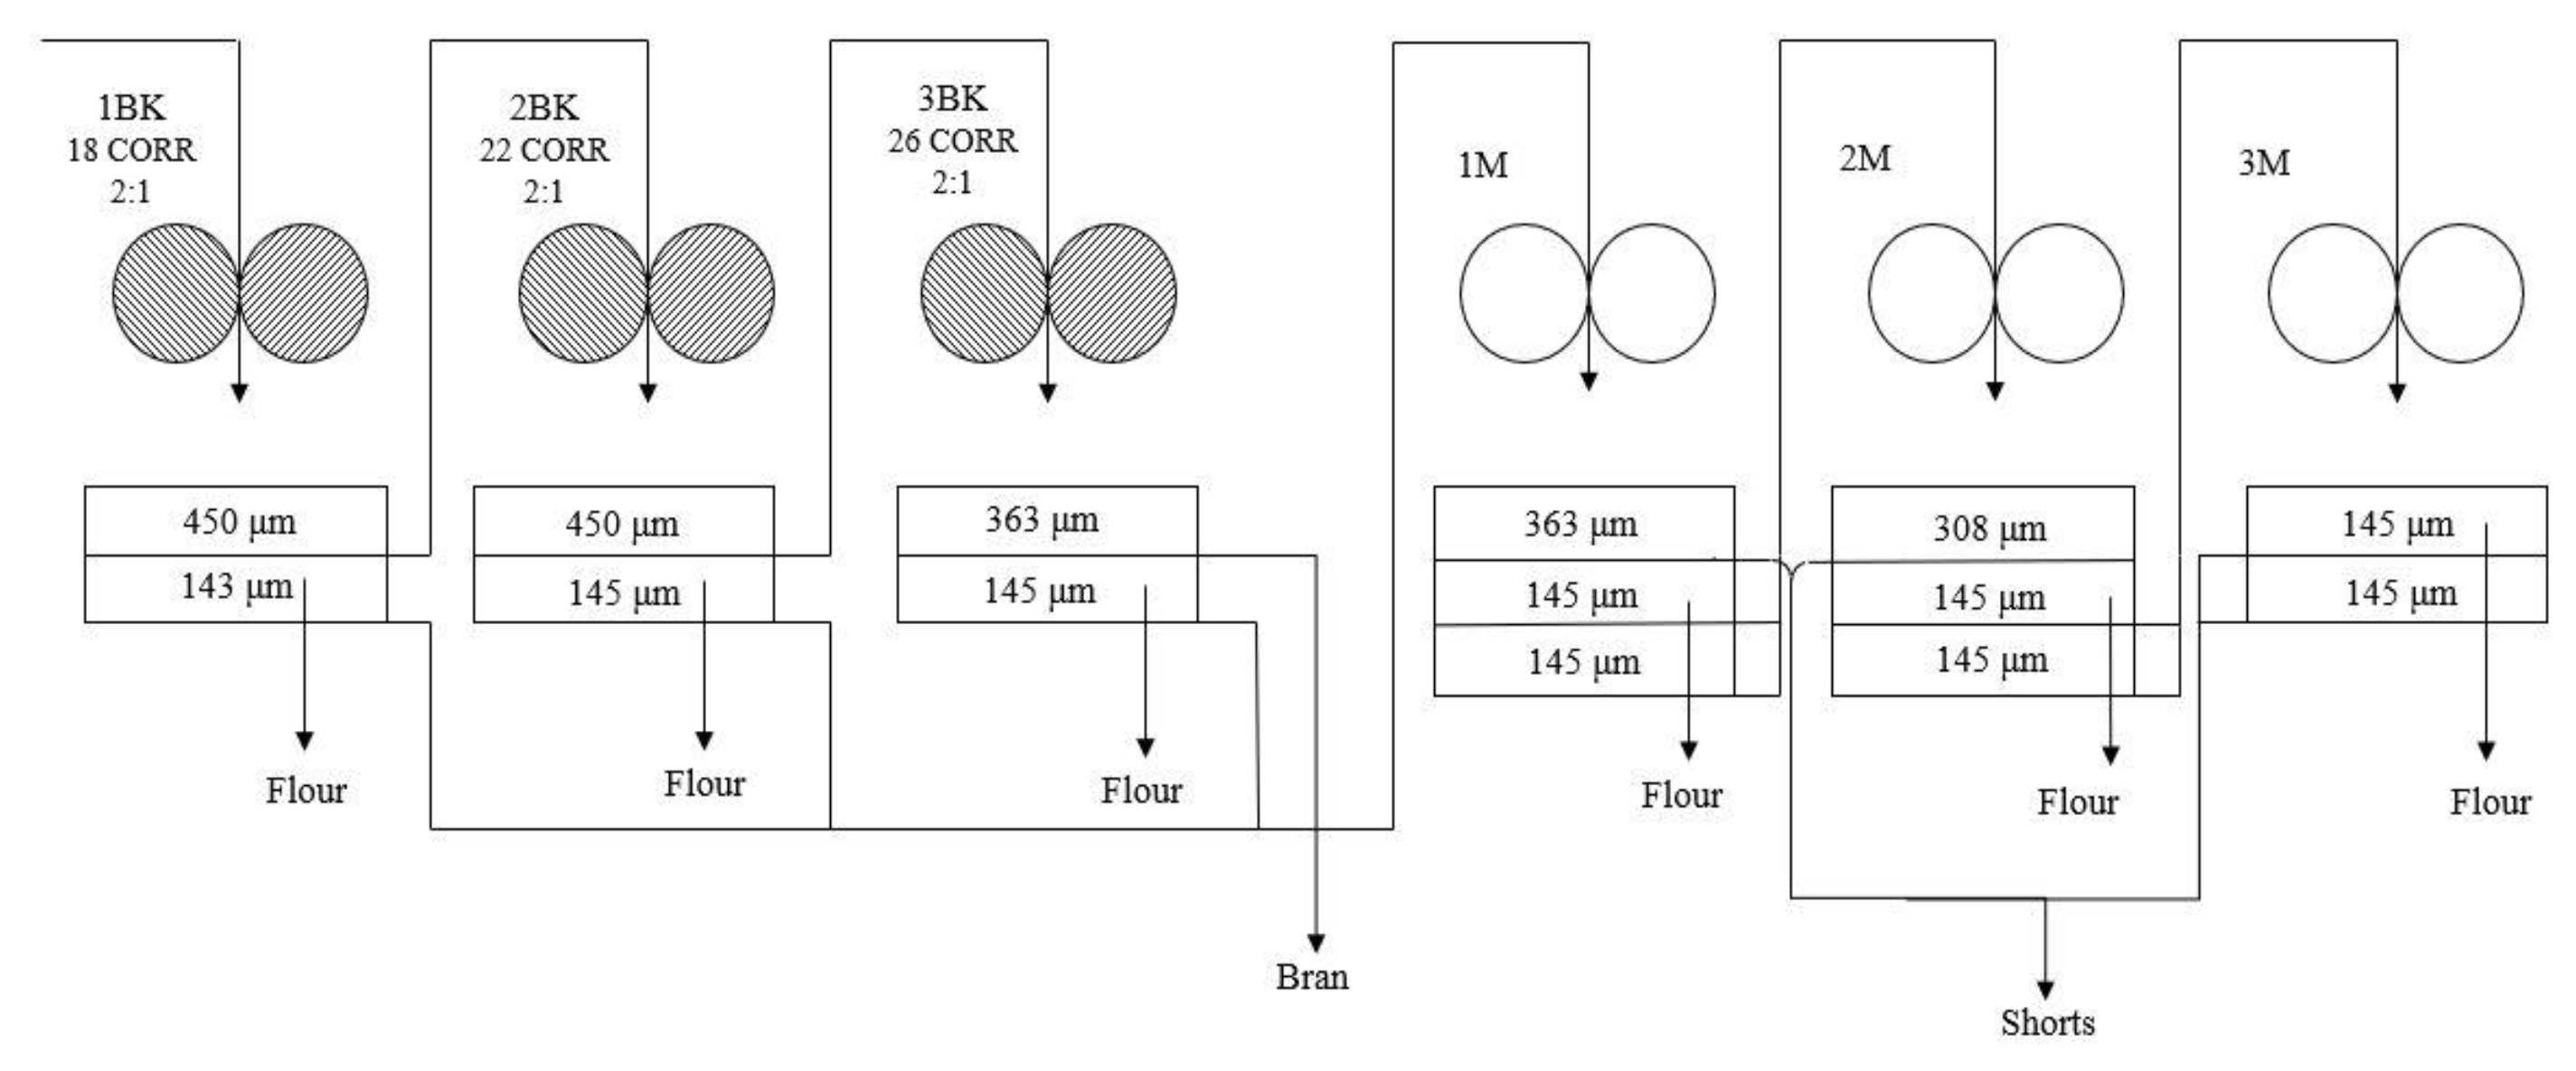
2.2. Milling
2.3. Compositional Analysis
2.4. Particle Size Analysis
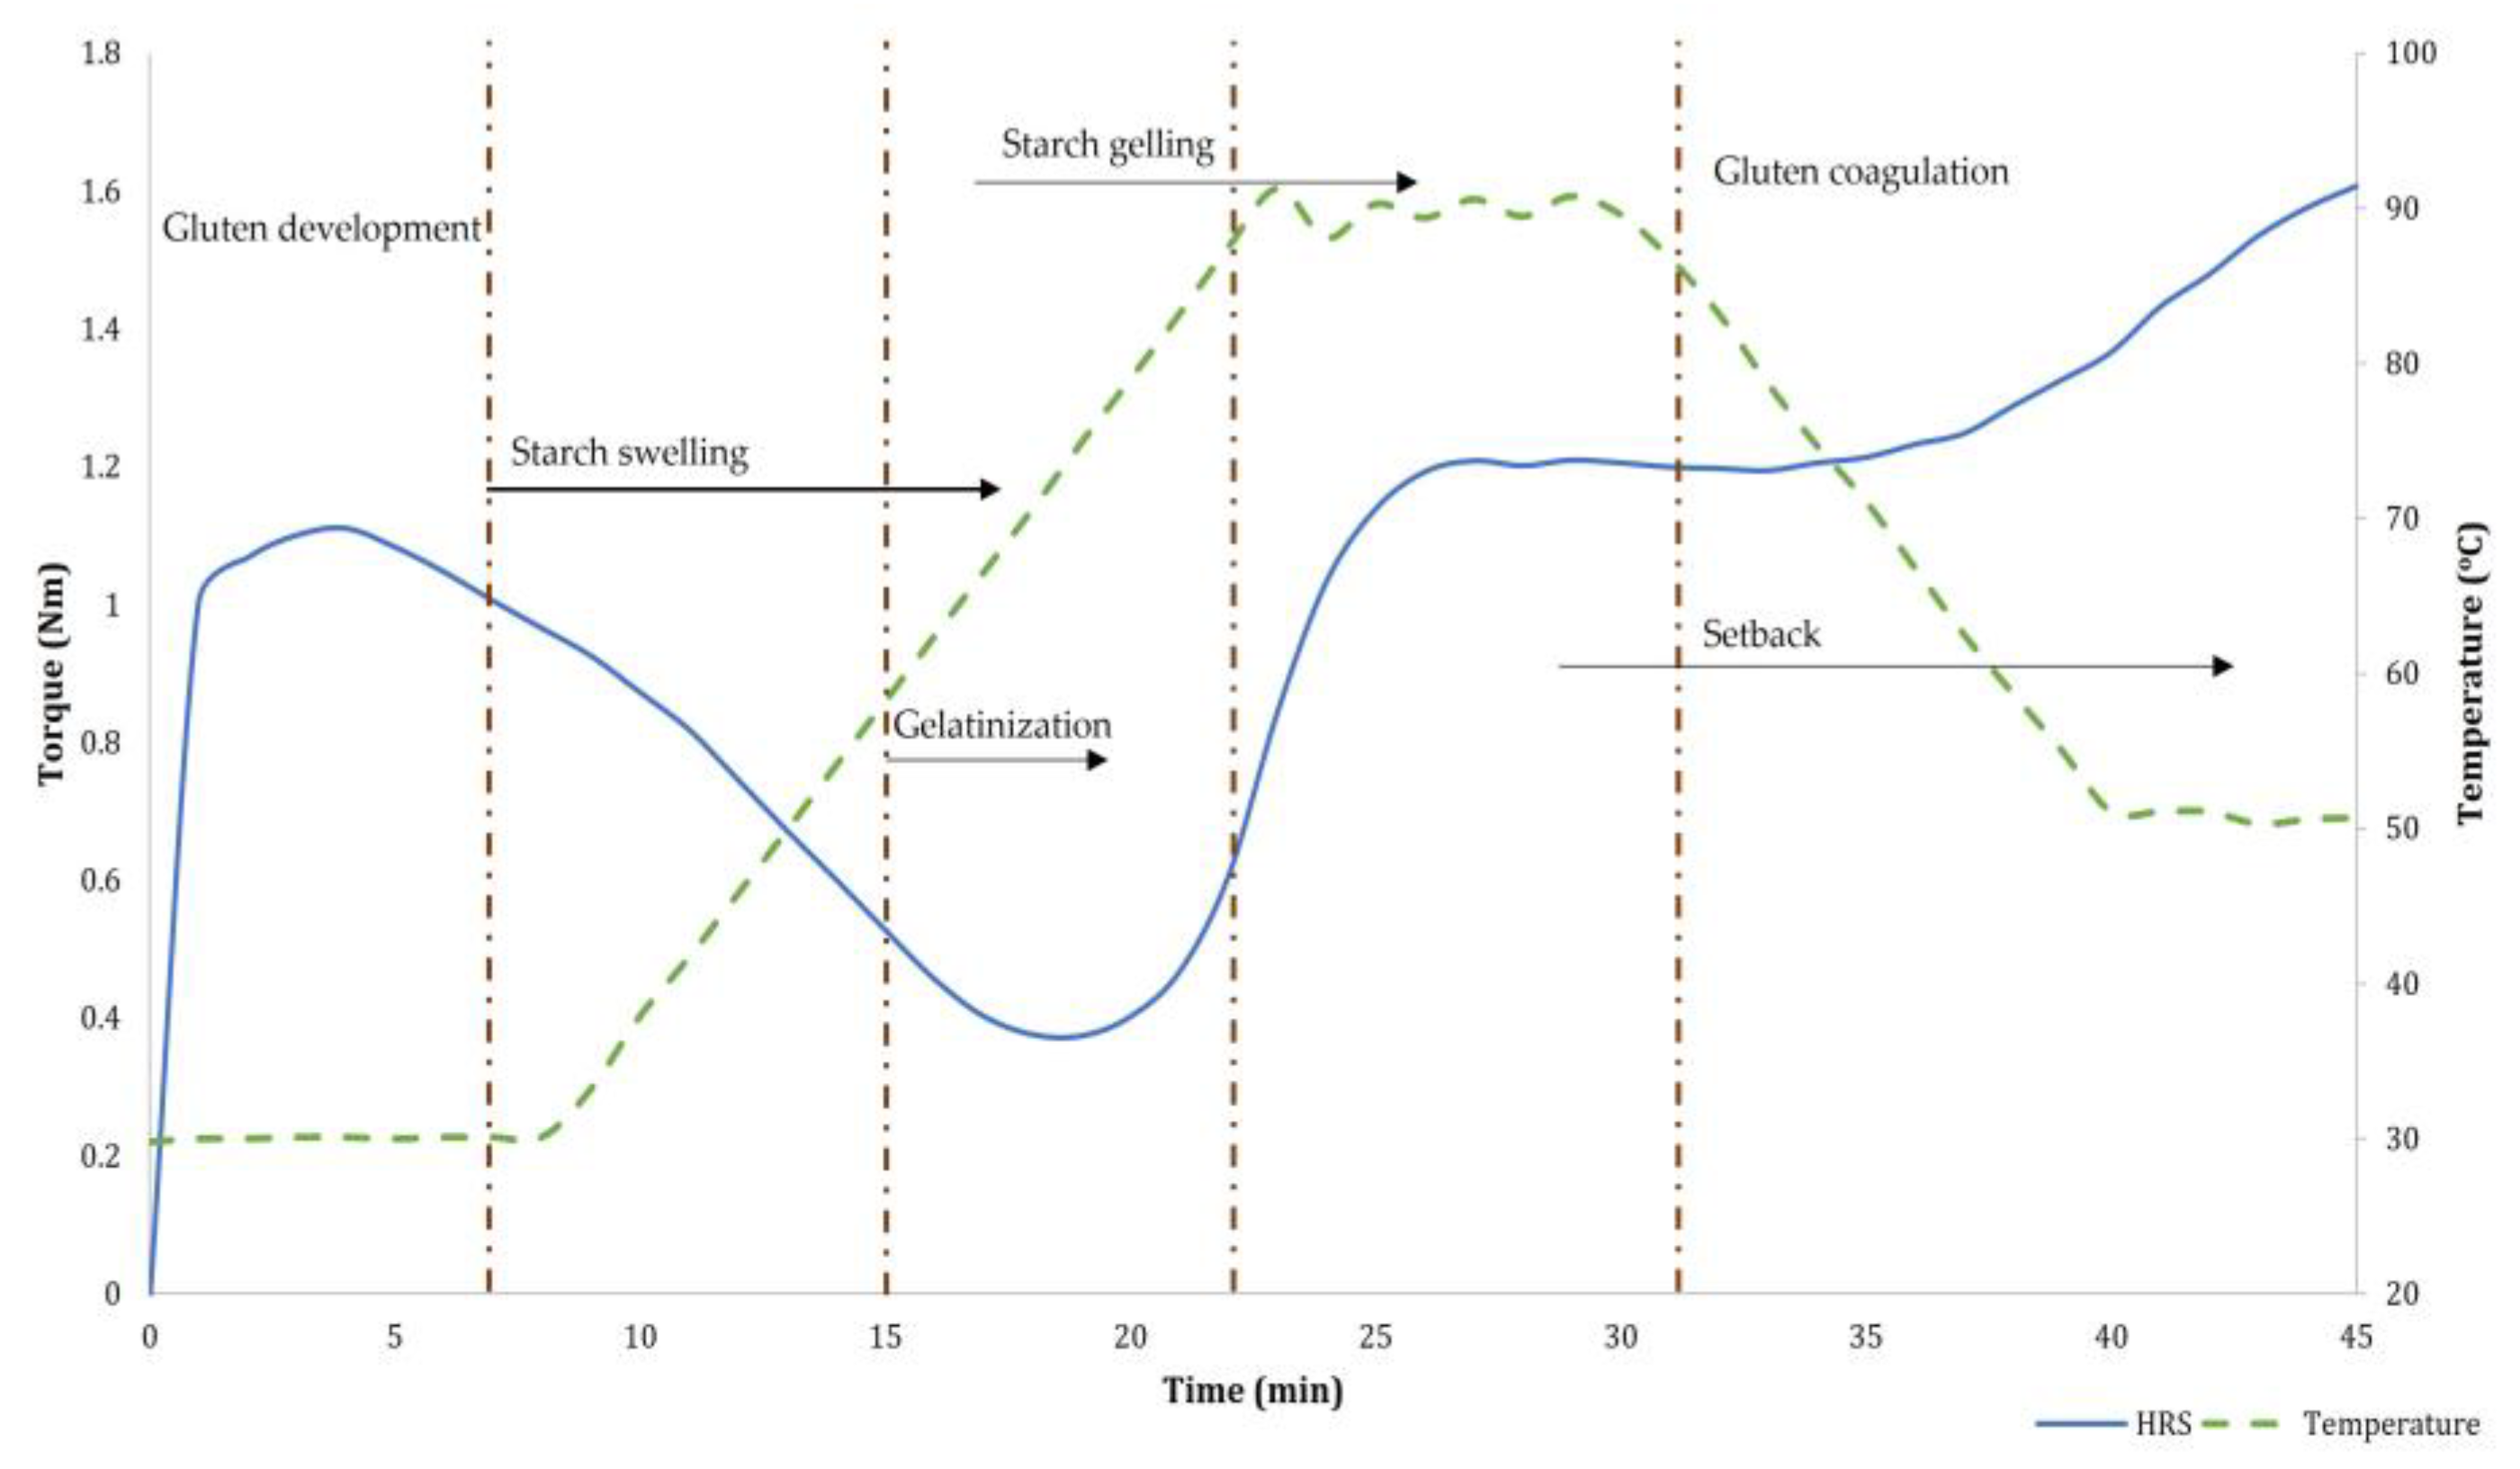
2.5. Thermomechanical Characteristics
2.6. Statistical Analysis
3. Results
3.1. Flour Yield
3.2. Compositional Analysis
3.3. Particle Size Analysis
3.4. Thermomechanical Analysis
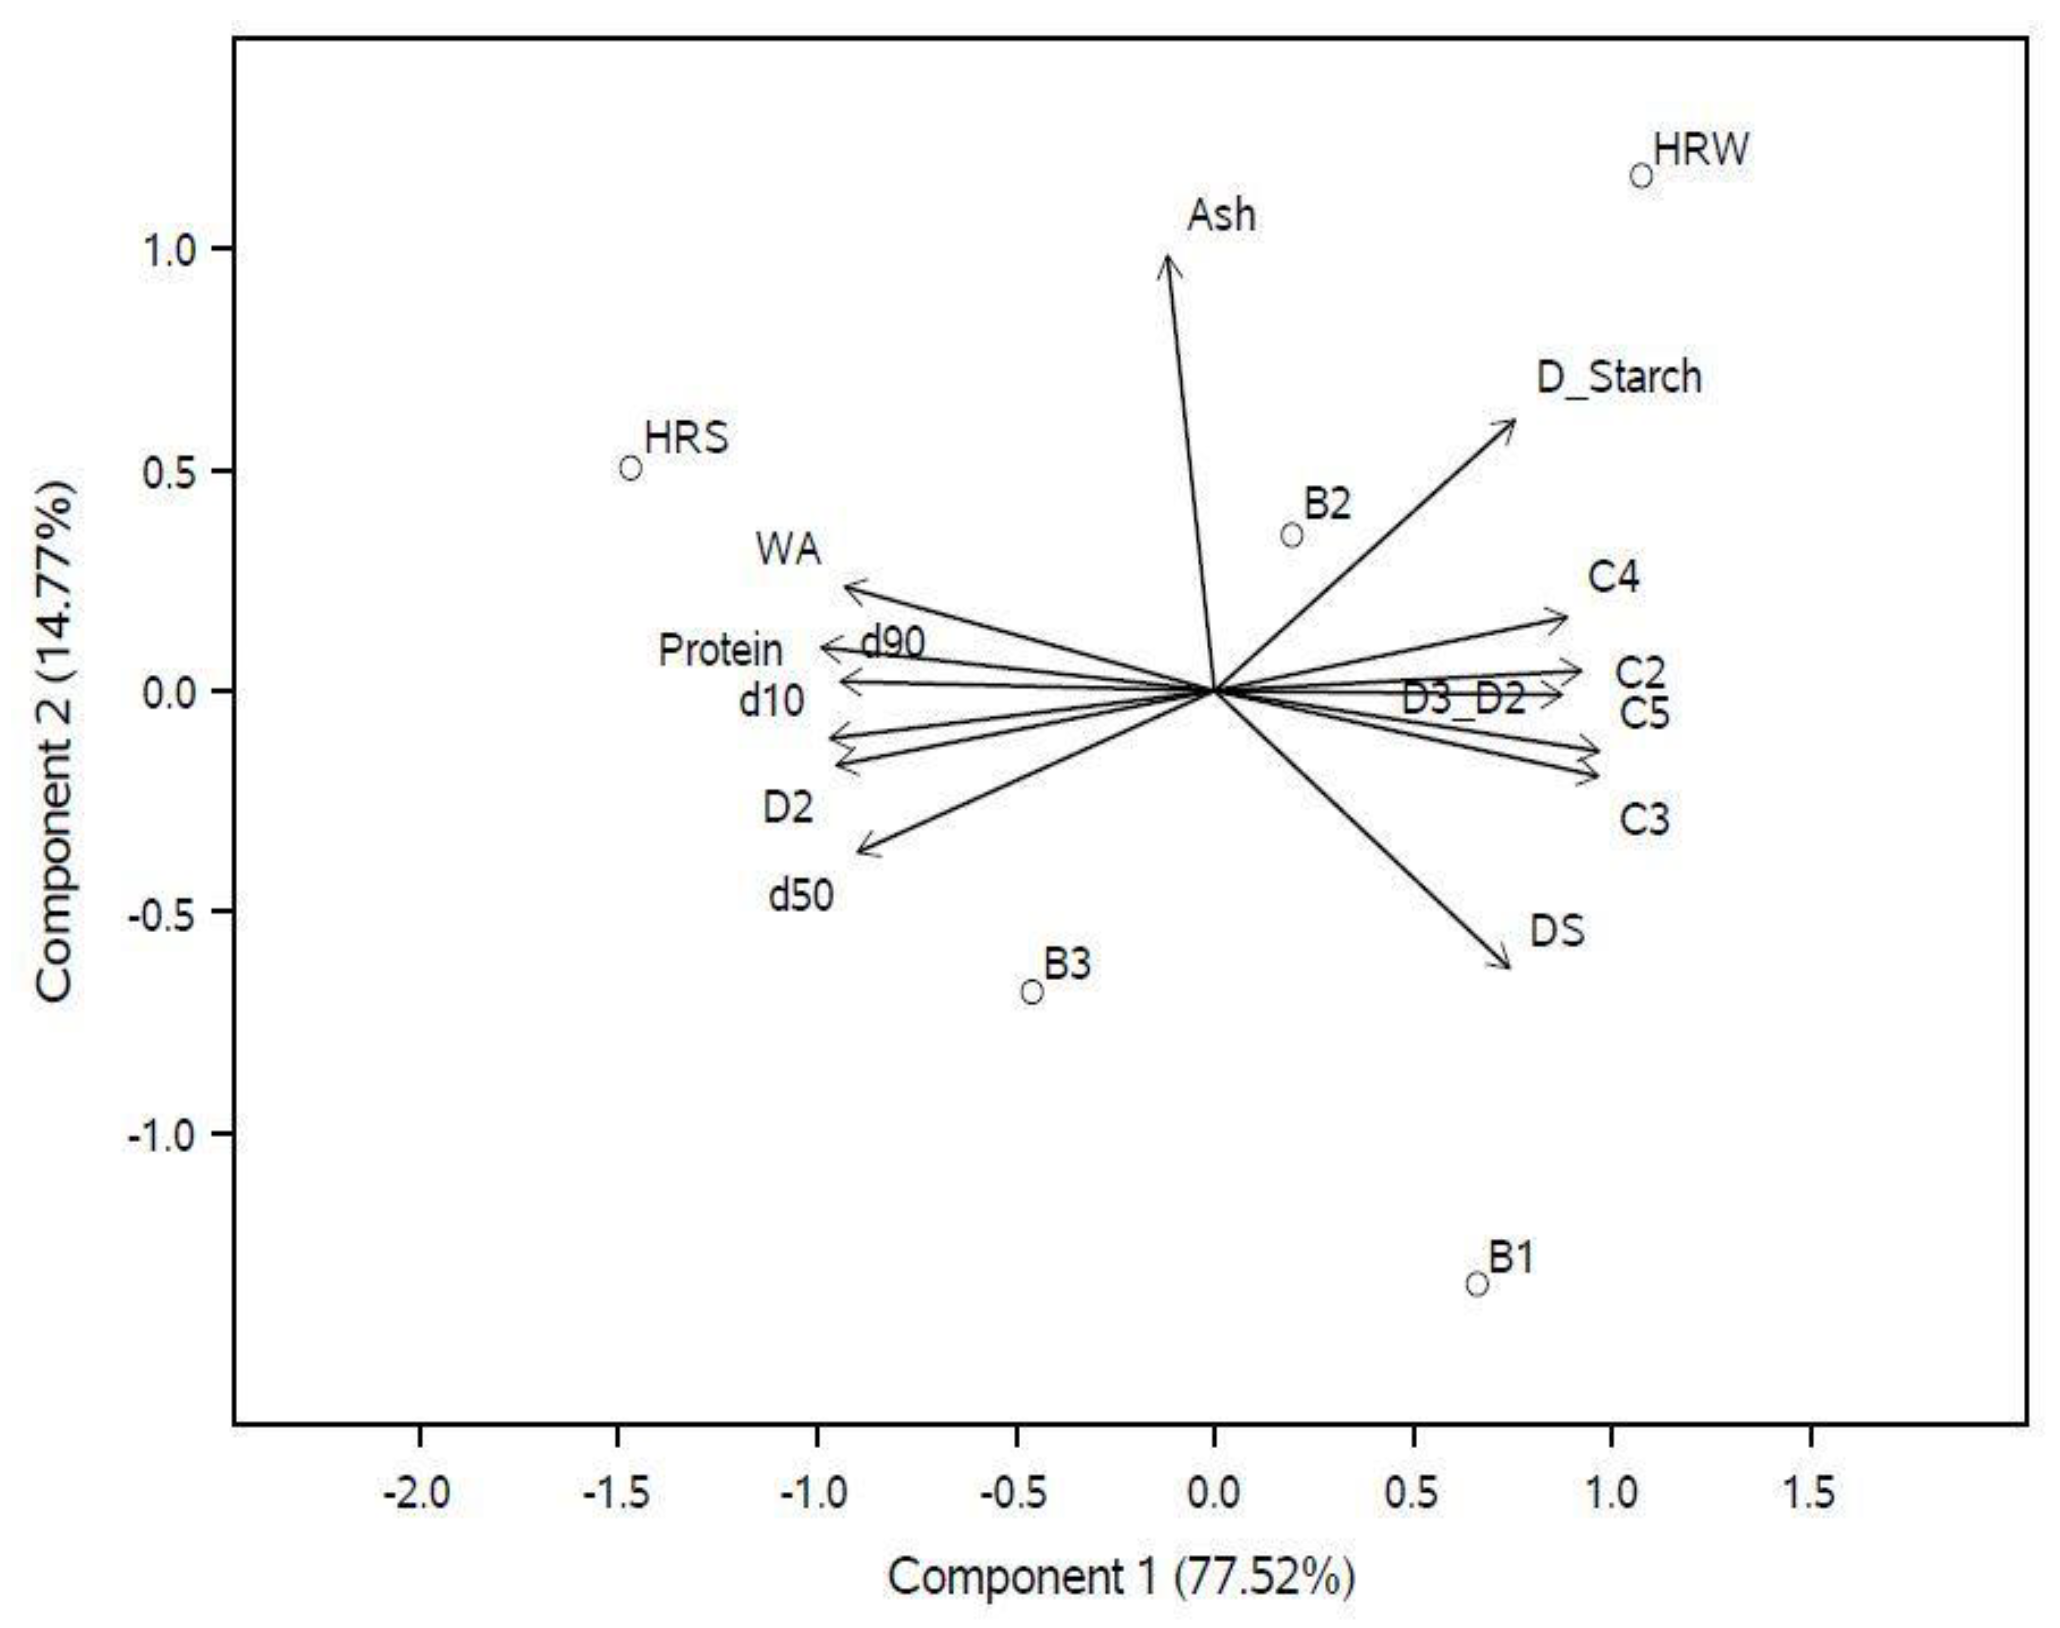
3.5. Principal Component Analysis (PCA)
4. Discussion
4.1. Compositional Analysis
4.2. Particle Size
4.3. Thermomechanical Properties
5. Conclusions
Supplementary Materials
Author Contributions
Funding
Data Availability Statement
Acknowledgments
Conflicts of Interest
References
- Hermans, W.; Mutlu, S.; Michalski, A.; Langenaeken, N.A.; Courtin, C.M. The Contribution of Sub-Aleurone Cells to Wheat Endosperm Protein Content and Gradient Is Dependent on Cultivar and N-Fertilization Level. J. Agric. Food Chem. 2021, 69, 6444–6454. [Google Scholar] [CrossRef] [PubMed]
- Baasandorj, T.; Ohm, J.B.; Manthey, F.; Simsek, S. Effect of Kernel Size and Mill Type on Protein, Milling Yield, and Baking Quality of Hard Red Spring Wheat. Cereal Chem. 2015, 92, 81–87. [Google Scholar] [CrossRef]
- Brütsch, L.; Huggler, I.; Kuster, S.; Windhab, E.J. Industrial Roller Milling Process Characterisation for Targeted Bread Quality Optimization. Food Bioprocess Technol. 2017, 10, 710–719. [Google Scholar] [CrossRef]
- Campbell, G.M. Roller Milling of Wheat. In Handbook of Powder Technology; Salman, A.D., Ghadiri, M., Hounslow, M.J., Eds.; Elsevier Science B. V: Amsterdam, The Netherlands, 2007; Volume 12, pp. 383–419. ISBN 9780444530806. [Google Scholar]
- Posner, E.S. CHAPTER 5: Wheat Flour Milling. In WHEAT: Chemistry and Technology; Khan, K., Shewry, P.R., Eds.; American Association of Cereal Chemists Inc.: St. Paul, MN, USA, 2009; pp. 119–152. ISBN 9781891127557. [Google Scholar]
- Abo-Dief, M.; Abo-Bakr, T.; Youssef, M.; Moustafa, A. Quality of Wheat Flour and Pan Bread as Influenced by the Tempering Time and Milling System. Cereal Chem. 2019, 96, 429–438. [Google Scholar] [CrossRef]
- Kweon, M.; Martin, R.; Souza, E. Effect of Tempering Conditions on Milling Performance and Flour Functionality. Cereal Chem. 2009, 86, 12–17. [Google Scholar] [CrossRef]
- Fang, C.; Campbell, G.M. On Predicting Roller Milling Performance V: Effect of Moisture Content on the Particle Size Distribution from First Break Milling of Wheat. J. Cereal Sci. 2003, 37, 31–41. [Google Scholar] [CrossRef]
- Hook, S.C.W.; Bone, G.T.; Fearn, T. The Conditioning of Wheat. An Investigation into the Conditioning Requirements of Canadian Western Red Spring No. 1. J. Sci. Food Agric. 1982, 33, 663–670. [Google Scholar] [CrossRef]
- Warechowska, M.; Markowska, A.; Warechowski, J.; Miś, A.; Nawrocka, A. Effect of Tempering Moisture of Wheat on Grinding Energy, Middlings and Flour Size Distribution, and Gluten and Dough Mixing Properties. J. Cereal Sci. 2016, 69, 306–312. [Google Scholar] [CrossRef]
- Rozbicki, J.; Ceglińska, A.; Gozdowski, D.; Jakubczak, M.; Cacak-Pietrzak, G.; Madry, W.; Golba, J.; Piechociński, M.; Sobczyński, G.; Studnicki, M.; et al. Influence of the Cultivar, Environment and Management on the Grain Yield and Bread-Making Quality in Winter Wheat. J. Cereal Sci. 2015, 61, 126–132. [Google Scholar] [CrossRef]
- Tian, W.; Jaenisch, B.; Gui, Y.; Hu, R.; Chen, G.; Lollato, R.P.; Li, Y. Effect of Environment and Field Management Strategies on Phenolic Acid Profiles of Hard Red Winter Wheat Genotypes. J. Sci. Food Agric. 2022, 102, 2424–2431. [Google Scholar] [CrossRef]
- Vazquez, D.; Berger, A.; Prieto-Linde, M.L.; Johansson, E. Can Nitrogen Fertilization Be Used to Modulate Yield, Protein Content and Bread-Making Quality in Uruguayan Wheat? J. Cereal Sci. 2019, 85, 153–161. [Google Scholar] [CrossRef]
- Raj, A.S.; Siliveru, K.; Mclean, R.; Prasad, P.V.V.; Lollato, R.P. Intensive Management Simultaneously Reduces Yield Gaps and Improves Milling and Baking Properties of Bread Wheat. Crop Sci. 2023, 63, 936–955. [Google Scholar] [CrossRef]
- Alfin, F. Miller; Parantez Publishing and Congress Ltd.: İstanbul, Turkey, 2019; pp. 70–73. [Google Scholar]
- Li, X.; Bonyadi, M.R.; Michalewicz, Z.; Barone, L. A Hybrid Evolutionary Algorithm for Wheat Blending Problem. Sci. World J. 2014, 2014, 967254. [Google Scholar] [CrossRef] [PubMed]
- Hayta, M.; Çakmakli, Ü. Optimization of Wheat Blending to Produce Breadmaking Flour. J. Food Process. Eng. 2001, 24, 179–192. [Google Scholar] [CrossRef]
- Noor, M.A.; Sheppard, J.W.; Yaw, S. Mixing Grain to Improve Profitability in Winter Wheat Using Evolutionary Algorithms. SN Comput. Sci. 2022, 3, 172–179. [Google Scholar] [CrossRef]
- Pojić, M.M.; Spasojević, N.B.; Atlas, M.D. Chemometric Approach to Characterization of Flour Mill Streams: Chemical and Rheological Properties. Food Bioprocess Technol. 2014, 7, 1298–1309. [Google Scholar] [CrossRef]
- Prabhasankar, P.; Sudha, M.L.; Haridas Rao, P. Quality Characteristics of Wheat Flour Milled Streams. Food Res. Int. 2000, 33, 381–386. [Google Scholar] [CrossRef]
- Rani, K.U.; Prasada Rao, U.J.S.; Leelavathi, K.; Haridas Rao, P. Distribution of Enzymes in Wheat Flour Mill Streams. J. Cereal Sci. 2001, 34, 233–242. [Google Scholar] [CrossRef]
- Dizlek, H.; Özer, M.S. Improvement of Physical, Physicochemical, and Rheological Characteristics of Sunn Pest (Eurygaster Integriceps) Damaged Wheat by Blending. Qual. Assur. Saf. Crops Foods 2017, 9, 31–39. [Google Scholar] [CrossRef]
- Levent, H.; Bilgiçli, N. Effects of Immature Wheat on Some Properties of Flour Blends and Rheological Properties of Dough. Qual. Assur. Saf. Crops Food. 2017, 9, 55–65. [Google Scholar] [CrossRef]
- Statista Estimated Market Volume of Bread and Bakery Products Worldwide in from 2017 to 2025. Available online: https://www.statista.com/statistics/947363/bread-and-bakery-products-market-size-global/ (accessed on 26 January 2023).
- ANSI/ASABE. Moisture Measurement—Unground Grain and Seeds. ASABE Stand. 2012, 1988, 2–4. [Google Scholar]
- AACC. International Approved Methods of Analysis. Available online: https://www.cerealsgrains.org/resources/Methods/Pages/default.aspx (accessed on 21 October 2021).
- Pezzali, J.G.; Suprabha-Raj, A.; Siliveru, K.; Aldrich, C.G. Characterization of White and Red Sorghum Flour and Their Potential Use for Production of Extrudate Crisps. PLoS ONE 2020, 15, e0234940. [Google Scholar] [CrossRef] [PubMed]
- Saad, M.; Sadoudi, A.; Rondet, E.; Cuq, B. Morphological Characterization of Wheat Powders, How to Characterize the Shape of Particles? J. Food Eng. 2011, 102, 293–301. [Google Scholar] [CrossRef]
- Espinosa-ramírez, J.; Rosa-millan, D.; Esther, P.; Serna-saldívar, S.O. Assessment of the Quality of Fresh Nixtamalized Maize Doughs with Different Degrees of Cooking and Milling: A Comparison of Mixolab and RVA Analyses. J. Cereal Sci. 2021, 102, 103321. [Google Scholar] [CrossRef]
- Dubat, A. Mixolab: A New Approach to Rheology; American Association of Cereal Chemists Inc.: St. Paul, MN, USA, 2013; ISBN 1891127772. [Google Scholar]
- Cappelli, A.; Guerrini, L.; Parenti, A.; Palladino, G.; Cini, E. Effects of Wheat Tempering and Stone Rotational Speed on Particle Size, Dough Rheology and Bread Characteristics for a Stone-Milled Weak Flour. J. Cereal Sci. 2020, 91, 102879. [Google Scholar] [CrossRef]
- Sakhare, S.D.; Inamdar, A.A. The Cumulative Ash Curve: A Best Tool to Evaluate Complete Mill Performance. J. Food Sci. Technol. 2014, 51, 795–799. [Google Scholar] [CrossRef]
- Tosi, P.; Gritsch, C.S.; He, J.; Shewry, P.R. Distribution of Gluten Proteins in Bread Wheat (Triticum Aestivum) Grain. Ann. Bot. 2011, 108, 23–35. [Google Scholar] [CrossRef] [PubMed]
- Yahata, E.; Maruyama-Funatsuki, W.; Nishio, Z.; Yamamoto, Y.; Hanaoka, A.; Sugiyama, H.; Tanida, M.; Saruyama, H. Relationship between the Dough Quality and Content of Specific Glutenin Proteins in Wheat Mill Streams, and Its Application to Making Flour Suitable for Instant Chinese Noodles. Biosci. Biotechnol. Biochem. 2006, 70, 788–797. [Google Scholar] [CrossRef] [PubMed]
- Wang, Q.; Li, L.; Zheng, X. A Review of Milling Damaged Starch: Generation, Measurement, Functionality and Its Effect on Starch-Based Food Systems. Food Chem. 2020, 315, 126267. [Google Scholar] [CrossRef] [PubMed]
- Ma, S.; Wang, C.; Li, L.; Wang, X. Effects of Particle Size on the Quality Attributes of Wheat Flour Made by the Milling Process. Cereal Chem. 2020, 97, 172–182. [Google Scholar] [CrossRef]
- Barak, S.; Mudgil, D.; Khatkar, B.S. Effect of Flour Particle Size and Damaged Starch on the Quality of Cookies. J. Food Sci. Technol. 2014, 51, 1342–1348. [Google Scholar] [CrossRef] [PubMed]
- Monnet, A.F.; Eurieult, A.; Berland, S.; Almeida, G.; Jeuffroy, M.H.; Michon, C. Damaged Starch in Pea versus Wheat Flours: Fragmentation Behavior and Contribution of Fine and Coarse Fractions. Cereal Chem. 2019, 96, 465–477. [Google Scholar] [CrossRef]
- Siliveru, K.; Ambrose, R.K.; Vadlani, P.V. Significance of Composition and Particle Size on the Shear Flow Properties of Wheat Flour. J. Sci. Food Agric. 2017, 97, 2300–2306. [Google Scholar] [CrossRef]
- Woźniak, W.; Styk, W. Internal Damage to Wheat Grain as a Result of Wetting and Drying. Dry. Technol. 1996, 14, 349–365. [Google Scholar] [CrossRef]
- Ghodke, S.K.; Ananthanarayan, L.; Rodrigues, L. Use of RSM to Investigate Effect of Milling Condition on Damaged Starch, Dough Stickiness and Chapatti Quality. Food Chem. 2009, 112, 1010–1015. [Google Scholar] [CrossRef]
- Posner, E.S.; Chew-Guevara, A.A.; Mitre-Dieste, M.; Perez-Carrillo, E.; Heredia-Olea, E.; Wilson, J.D.; Serna-Saldivar, S.O. Generation of a Mixolab Profile after the Evaluation of the Functionality of Different Commercial Wheat Flours for Hot-Press Tortilla Production. Cereal Chem. 2014, 91, 139–145. [Google Scholar] [CrossRef]
- Patwa, A.; Malcolm, B.; Wilson, J.; Ambrose, R.P.K. Particle Size Analysis of Two Distinct Classes of Wheat Flour by Sieving. Trans. ASABE 2014, 57, 151–159. [Google Scholar] [CrossRef]
- Pang, J.; Guan, E.; Yang, Y.; Li, M.; Bian, K. Effects of Wheat Flour Particle Size on Flour Physicochemical Properties and Steamed Bread Quality. Food Sci. Nutr. 2021, 9, 4691–4700. [Google Scholar] [CrossRef]
- Maghirang, E.B.; Lookhart, G.L.; Bean, S.R.; Pierce, R.O.; Xie, F.; Caley, M.S.; Wilson, J.D.; Seabourn, B.W.; Ram, M.S.; Park, S.H.; et al. Comparison of Quality Characteristics and Breadmaking Functionality of Hard Red Winter and Hard Red Spring Wheat. Cereal Chem. 2006, 83, 520–528. [Google Scholar] [CrossRef]
- Sluimer, P. Principles of Breadmaking: Functionality of Raw Materials and Process Steps; American Association of Cereal Chemists: St. Paul, MN, USA, 2005; ISBN 9781891127458. [Google Scholar]
- Park, S.H.; Wilson, J.D.; Seabourn, B.W. Starch Granule Size Distribution of Hard Red Winter and Hard Red Spring Wheat: Its Effects on Mixing and Breadmaking Quality. J. Cereal Sci. 2009, 49, 98–105. [Google Scholar] [CrossRef]
- Chiotelli, E.; Le Meste, M. Effect of Small and Large Wheat Starch Granules on Thermomechanical Behavior of Starch. Cereal Chem. 2002, 79, 286–293. [Google Scholar] [CrossRef]
- Hoseney, R.C.; Lineback, D.R.; Seib, P.A. Role of Starch in Baked Foods. Bak. Dig. 1978, 52, 11–16. [Google Scholar]
- Prabhasankar, P. Haridas Rao Effect of Different Milling Methods on Chemical Composition of Whole Wheat Flour. Eur. Food Res. Technol. 2001, 213, 465–469. [Google Scholar] [CrossRef]
- Liu, Y.; Ohm, J.B.; Hareland, G.; Wiersma, J.; Kaiser, D. Sulfur, Protein Size Distribution, and Free Amino Acids in Flour Mill Streams and Their Relationship to Dough Rheology and Breadmaking Traits. Cereal Chem. 2011, 88, 109–116. [Google Scholar] [CrossRef]
- Menkovska, M.; Knezevic, D.; Ivanoski, M. Protein Allelic Composition, Dough Rheology, and Baking Characteristics of Flour Mill Streams from Wheat Cultivars with Known and Varied Baking Qualities. Cereal Chem. 2002, 79, 720–725. [Google Scholar] [CrossRef]
- Wang, Y.G.; Khan, K.; Hareland, G.; Nygard, G. Distribution of Protein Composition in Bread Wheat Flour Mill Streams and Relationship to Breadmaking Quality. Cereal Chem. 2007, 84, 271–275. [Google Scholar] [CrossRef]
- Hoseney, R.C. Principles of Cereal Science and Technology; American Association of Cereal Chemists (AACC): St. Paul, MN, USA, 1994; ISBN 0913250791. [Google Scholar]
- Codină, G.G.; Dabija, A.; Oroian, M. Prediction of Pasting Properties of Dough from Mixolab Measurements Using Artificial Neuronal Networks. Foods 2019, 8, 447. [Google Scholar] [CrossRef]
- Barrera, G.N.; Pérez, G.T.; Ribotta, P.D.; León, A.E. Influence of Damaged Starch on Cookie and Bread-Making Quality. Eur. Food Res. Technol. 2007, 225, 1–7. [Google Scholar] [CrossRef]
- Hackenberg, S.; Vogel, C.; Scherf, K.A.; Jekle, M.; Becker, T. Impact of Altered Starch Functionality on Wheat Dough Microstructure and Its Elongation Behaviour. Food Chem. 2019, 290, 64–71. [Google Scholar] [CrossRef]


| Flour Yield | d10 | d50 | d90 | Protein | Damaged Starch | Ash | |
|---|---|---|---|---|---|---|---|
| Sample | (%) | (μm) | (μm) | (μm) | (%) | (%) | (%) |
| HRW | 73.22 (3.6) A | 22.61 (0.96) B | 69.03 (10.1) A | 131.82 (17.9) A | 9.41 (0.42) D | 9.25 (2.32) A | 0.55 (0.12) A |
| B1 | 74.33 (2.9) A | 23.43 (2.55) AB | 74.24 (13.4) A | 130.14 (20.6) A | 10.28 (0.66) CD | 8.37 (1.26) A | 0.44 (0.11) A |
| B2 | 73.23 (2.7) A | 24.09 (1.80) AB | 75.09 (7.1) A | 141.01 (13.8) A | 11.39 (1.11) C | 9.51 (1.89) A | 0.44 (0.21) A |
| B3 | 72.88 (1.9) A | 24.00 (2.30) AB | 77.76 (6.6) A | 129.99 (7.7) A | 12.94 (1.43) B | 9.08 (2.03) A | 0.43 (0.18) A |
| HRS | 68.38 (7.6) A | 25.44 (3.01) A | 79.55 (9.9) A | 143.02 (10.0) A | 15.88 (0.69) A | 8.63 (2.32) A | 0.60 (0.20) A |
| Source | Damaged Starch | Ash | Protein | d10 | d50 | d90 |
|---|---|---|---|---|---|---|
| Wheat | 3.32 | 8.62 | 67.82 | 7.74 | 9.35 | 5.76 |
| Moisture content (MC) | 4.4 | 1.91 | 0.5 | ns | 4.74 | ns |
| Time | 2.68 | 7.9 | 0.91 | ns | ns | ns |
| Milling stream | 77.75 | 64.92 | 26.89 | 82.95 | 63.88 | 58.34 |
| Wheat × MC | 0.86 | 4.78 | 0.94 | ns | ns | ns |
| Wheat × Time | 1.68 | 1.19 | 0.38 | 0.94 | 1.95 | 2.21 |
| Wheat × Milling stream | ns | ns | 0.57 | 0.8 | ns | 1.86 |
| MC × Time | 5.91 | 4.52 | 0.61 | 2.88 | 8.36 | 5.75 |
| MC × Milling stream | ns | ns | 0.25 | 1.04 | 1.98 | ns |
| Time × Milling stream | ns | 0.87 | 0.2 | ns | ns | ns |
| Wheat × MC × Time | 1.86 | 2.96 | 0.53 | ns | 1.55 | ns |
| Wheat × MC × Milling stream | ns | ns | ns | ns | 1.21 | 1.98 |
| Wheat × Time × Milling stream | ns | ns | 0.16 | ns | ns | 1.95 |
| MC × Time × Milling stream | 0.37 | ns | ns | ns | 1.88 | 1.69 |
| Rheological Properties | Samples | ||||
|---|---|---|---|---|---|
| HRW | B1 | B2 | B3 | HRS | |
| WA (%) | 62.9 (6.4) B | 61.5 (6.0) B | 62.8 (3.4) B | 65.9 (5.2) AB | 68.9 (3.1) A |
| C2 (Nm) | 0.48 (0.05) A | 0.46 (0.05) A | 0.47 (0.04) A | 0.45 (0.05) A | 0.4 (0.04) B |
| C3 (Nm) | 1.5 (0.5) A | 1.5 (0.5) A | 1.3 (0.4) A | 1.2 (0.4) AB | 0.9 (0.3) B |
| C4 (Nm) | 1.6 (0.3) A | 1.6 (0.3) A | 1.7 (0.4) A | 1.4 (0.5) A | 1.4 (0.2) A |
| C5 (Nm) | 2.5 (0.6) A | 2.6 (0.5) A | 2.5 (0.3) A | 2.2 (0.5) AB | 1.9 (0.3) B |
| α | −0.08 (0.0) A | −0.11 (0.2) A | −0.08 (0.0) A | −0.07 (0.0) A | −0.08 (0.0) A |
| β | 0.21 (0.1) A | 0.14 (0.1) AB | 0.15 (0.1) AB | 0.12 (0.1) B | 0.09 (0.1) B |
| γ | −0.03 (0.1) AB | −0.06(0.1) B | 0.02 (0.1) A | −0.02 (0.1) AB | 0.03 (0.1) A |
| C2–C1 (Nm) | −0.63 (0.0) A | −0.64 (0.1) A | −0.65 (0.0) A | −0.61 (0.2) A | −0.71 (0.0) B |
| C3–C2 (Nm) | 0.96 (0.5) A | 1.04 (0.1) A | 0.8 (0.4) AB | 0.82 (0.3) AB | 0.51 (0.3) B |
| C4–C3 (Nm) | 0.1 (0.4) B | 0.1 (0.5) B | 0.4 (0.5) AB | 0.2 (0.4) AB | 0.5 (0.2) A |
| C5–C4 (Nm) | 0.91 (0.3) A | 0.99 (0.5) A | 0.8 (0.34) AB | 0.77 (0.4) AB | 0.55 (0.1) B |
| T1 (s) | 66.68 (43.7) B | 146.2 (143.3) AB | 165.6 (135.6) AB | 212.1 (164.5) A | 184 (88.6) A |
| Stability (min) | 9.02 (0.7) B | 9.91 (1.4) A | 9.0 (1.0) B | 8.86 (0.8) B | 8.30 (0.8) B |
| D2 (°C) | 53.59 (2.0) B | 54.02 (1.0) AB | 54.43 (1.3) AB | 54.82 (1.4) AB | 55.03 (1.3) A |
| D3–D2 (°C) | 19.59 (4.9) A | 18.39 (5.3) AB | 13.95 (4.3) C | 14.21 (5.2) BC | 12.87 (3.5) C |
Disclaimer/Publisher’s Note: The statements, opinions and data contained in all publications are solely those of the individual author(s) and contributor(s) and not of MDPI and/or the editor(s). MDPI and/or the editor(s) disclaim responsibility for any injury to people or property resulting from any ideas, methods, instructions or products referred to in the content. |
© 2023 by the authors. Licensee MDPI, Basel, Switzerland. This article is an open access article distributed under the terms and conditions of the Creative Commons Attribution (CC BY) license (https://creativecommons.org/licenses/by/4.0/).
Share and Cite
Suprabha Raj, A.; Boyacioglu, M.H.; Dogan, H.; Siliveru, K. Investigating the Contribution of Blending on the Dough Rheology of Roller-Milled Hard Red Wheat. Foods 2023, 12, 2078. https://doi.org/10.3390/foods12102078
Suprabha Raj A, Boyacioglu MH, Dogan H, Siliveru K. Investigating the Contribution of Blending on the Dough Rheology of Roller-Milled Hard Red Wheat. Foods. 2023; 12(10):2078. https://doi.org/10.3390/foods12102078
Chicago/Turabian StyleSuprabha Raj, Anu, M. Hikmet Boyacioglu, Hulya Dogan, and Kaliramesh Siliveru. 2023. "Investigating the Contribution of Blending on the Dough Rheology of Roller-Milled Hard Red Wheat" Foods 12, no. 10: 2078. https://doi.org/10.3390/foods12102078
APA StyleSuprabha Raj, A., Boyacioglu, M. H., Dogan, H., & Siliveru, K. (2023). Investigating the Contribution of Blending on the Dough Rheology of Roller-Milled Hard Red Wheat. Foods, 12(10), 2078. https://doi.org/10.3390/foods12102078