

Effects of Extraction Methods on the Characteristics, Physicochemical Properties and Sensory Quality of Collagen from Spent-Hens Bones
 ,
,
Abstract
1. Introduction
2. Material and Method
2.1. Materials and Chemicals
2.2. Sample Preparation
2.3. Characterization of Chicken Bone Collagen
2.3.1. Proximate Analysis
2.3.2. Yield
2.3.3. Sodium Dodecyl Sulfate Polyacrylamide Gel Electrophoresis (SDS-PAGE)
2.3.4. Amino Acid Composition Analysis
2.3.5. UV Absorption Spectrum Scanning
2.3.6. Fourier Transform Infrared Spectroscopy (FTIR)
2.3.7. Thermal Stability Analysis
2.3.8. Scanning Electron Microscopy (SEM)
2.4. Processing Property Analysis
2.4.1. Turbidity Analysis
2.4.2. Soubility Analysis
2.4.3. WHC and OAC
2.4.4. Emulsifying and Foaming Analysis
2.5. In Vitro Antioxidant Properties
2.6. Color and Sensory Evaluation
2.7. Statistical Analysis
3. Result and Analysis
3.1. Characterization of Chicken Bone Collagen
3.1.1. Yield and Chemical Composition Analysis
3.1.2. Amino Acid Composition Analysis
3.1.3. SDS-PAGE
3.1.4. UV
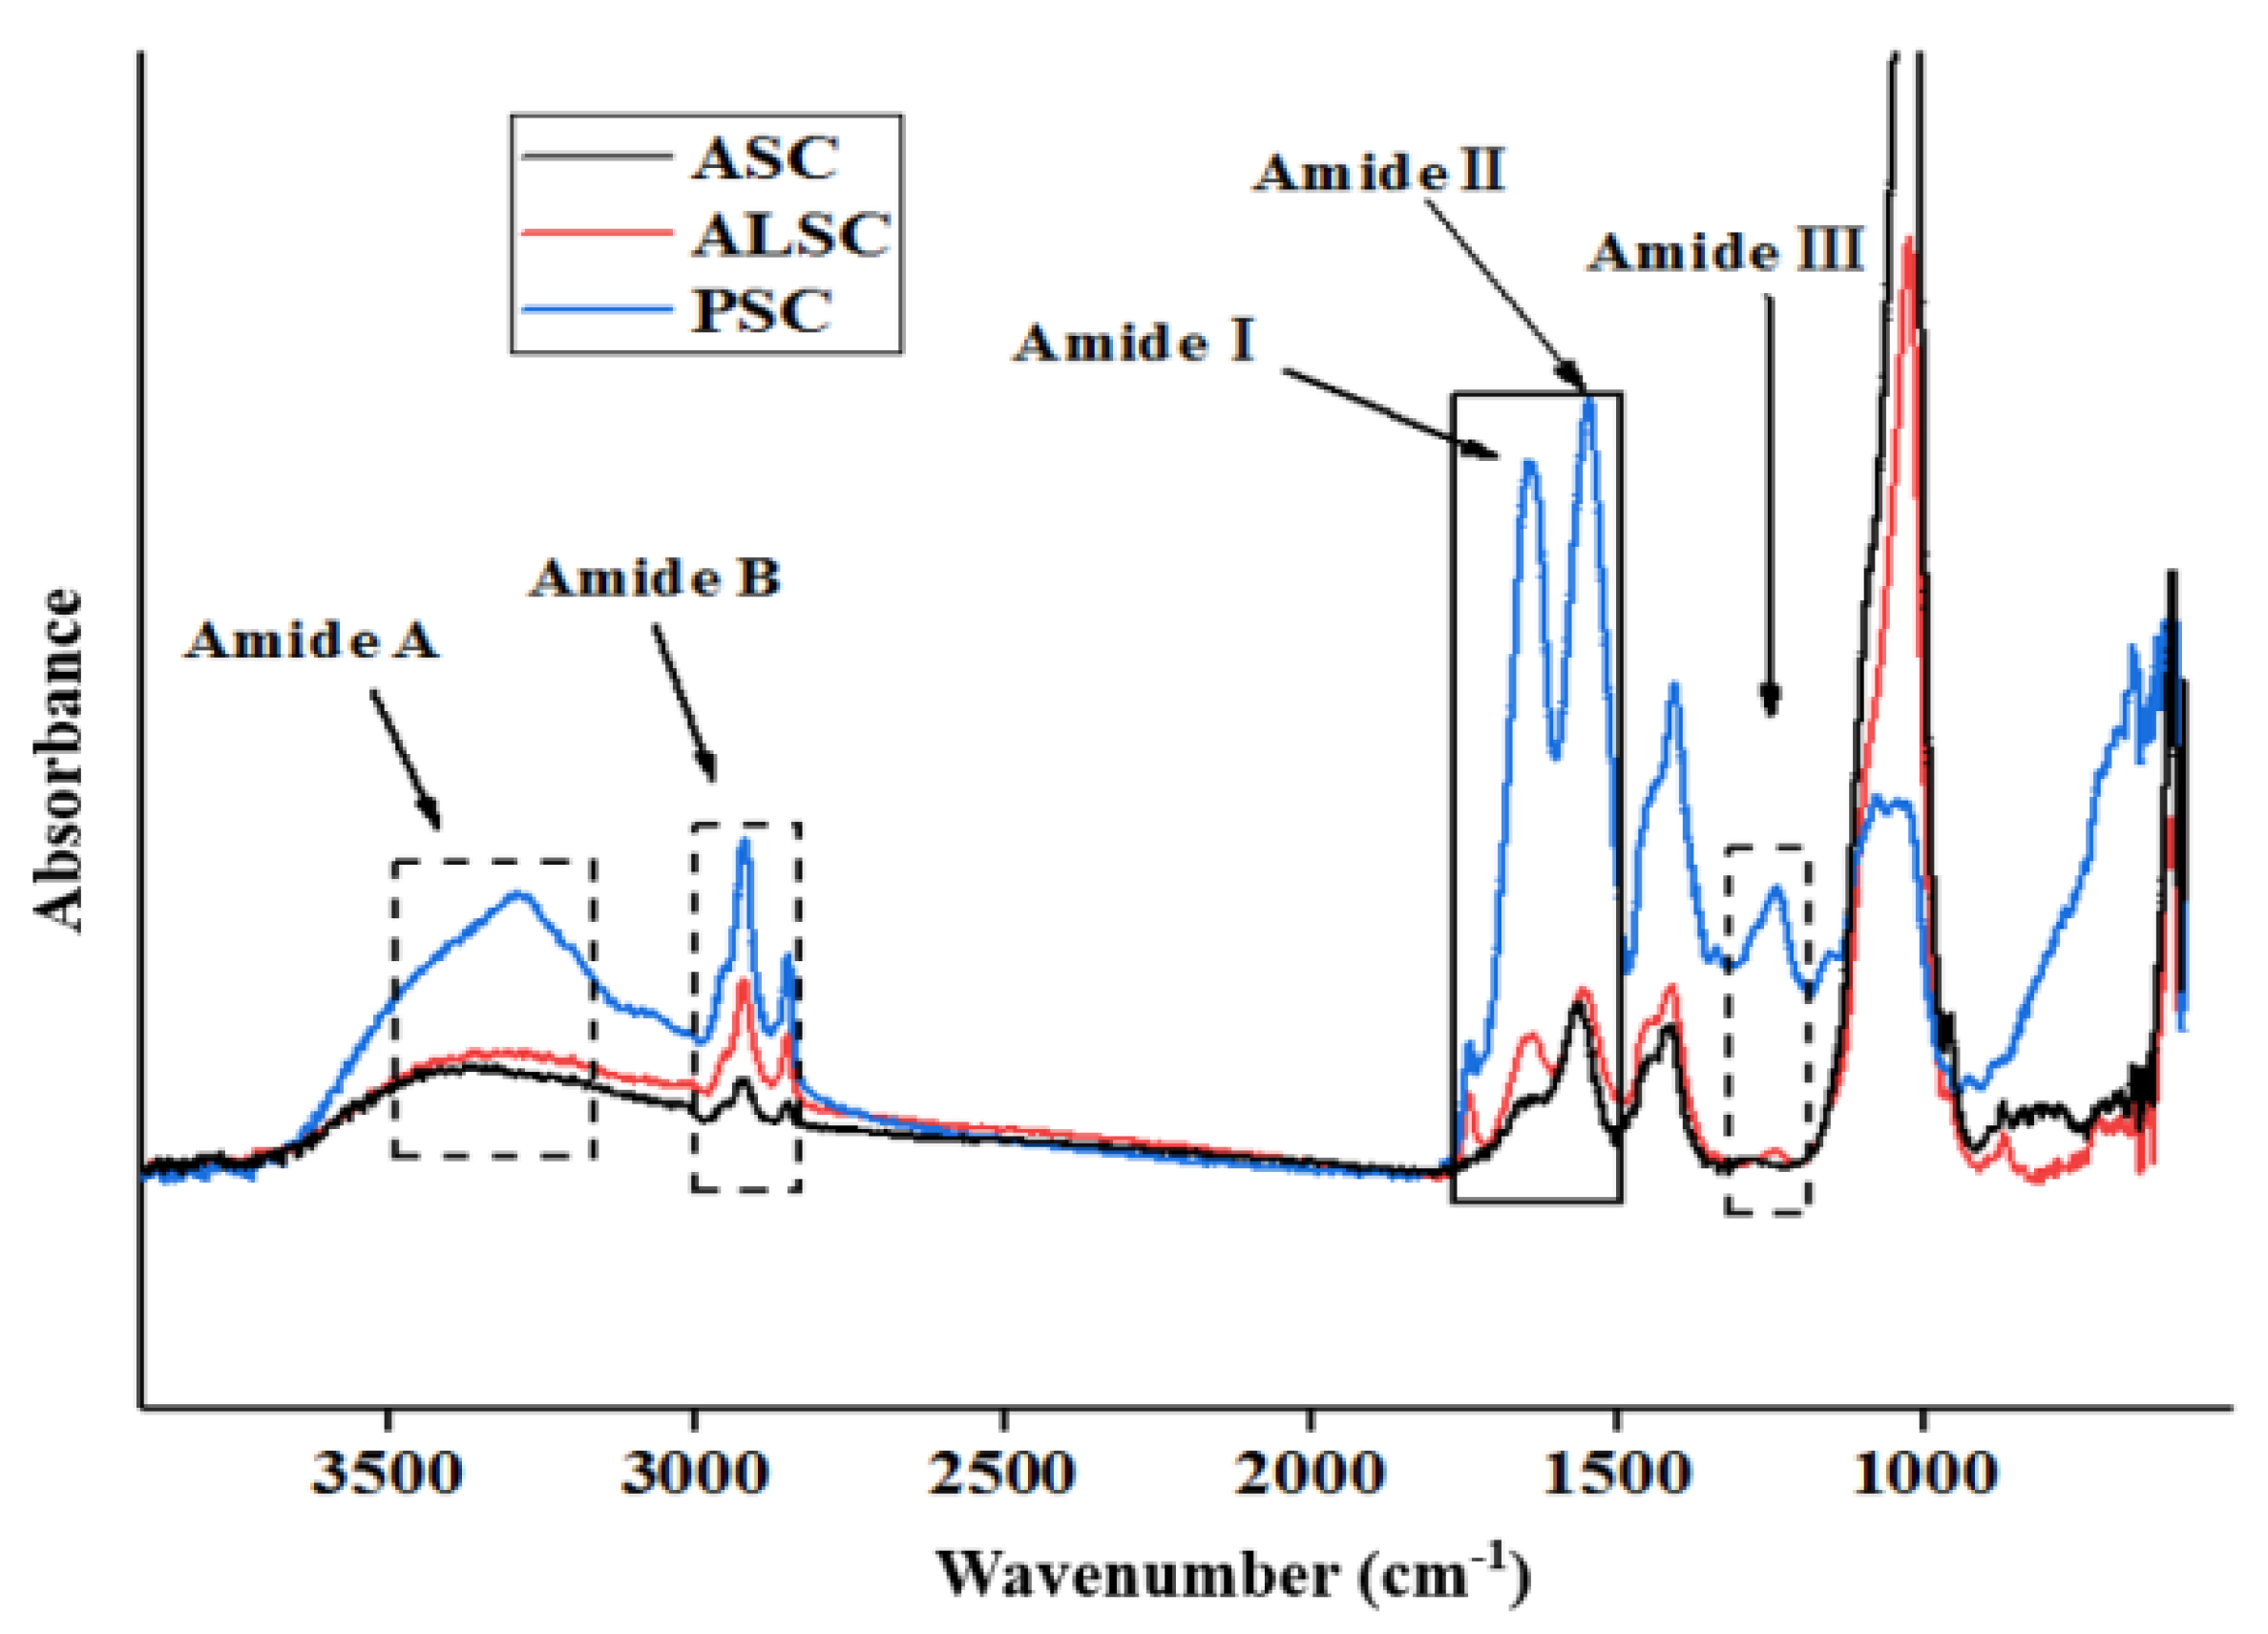
3.2. FTIR
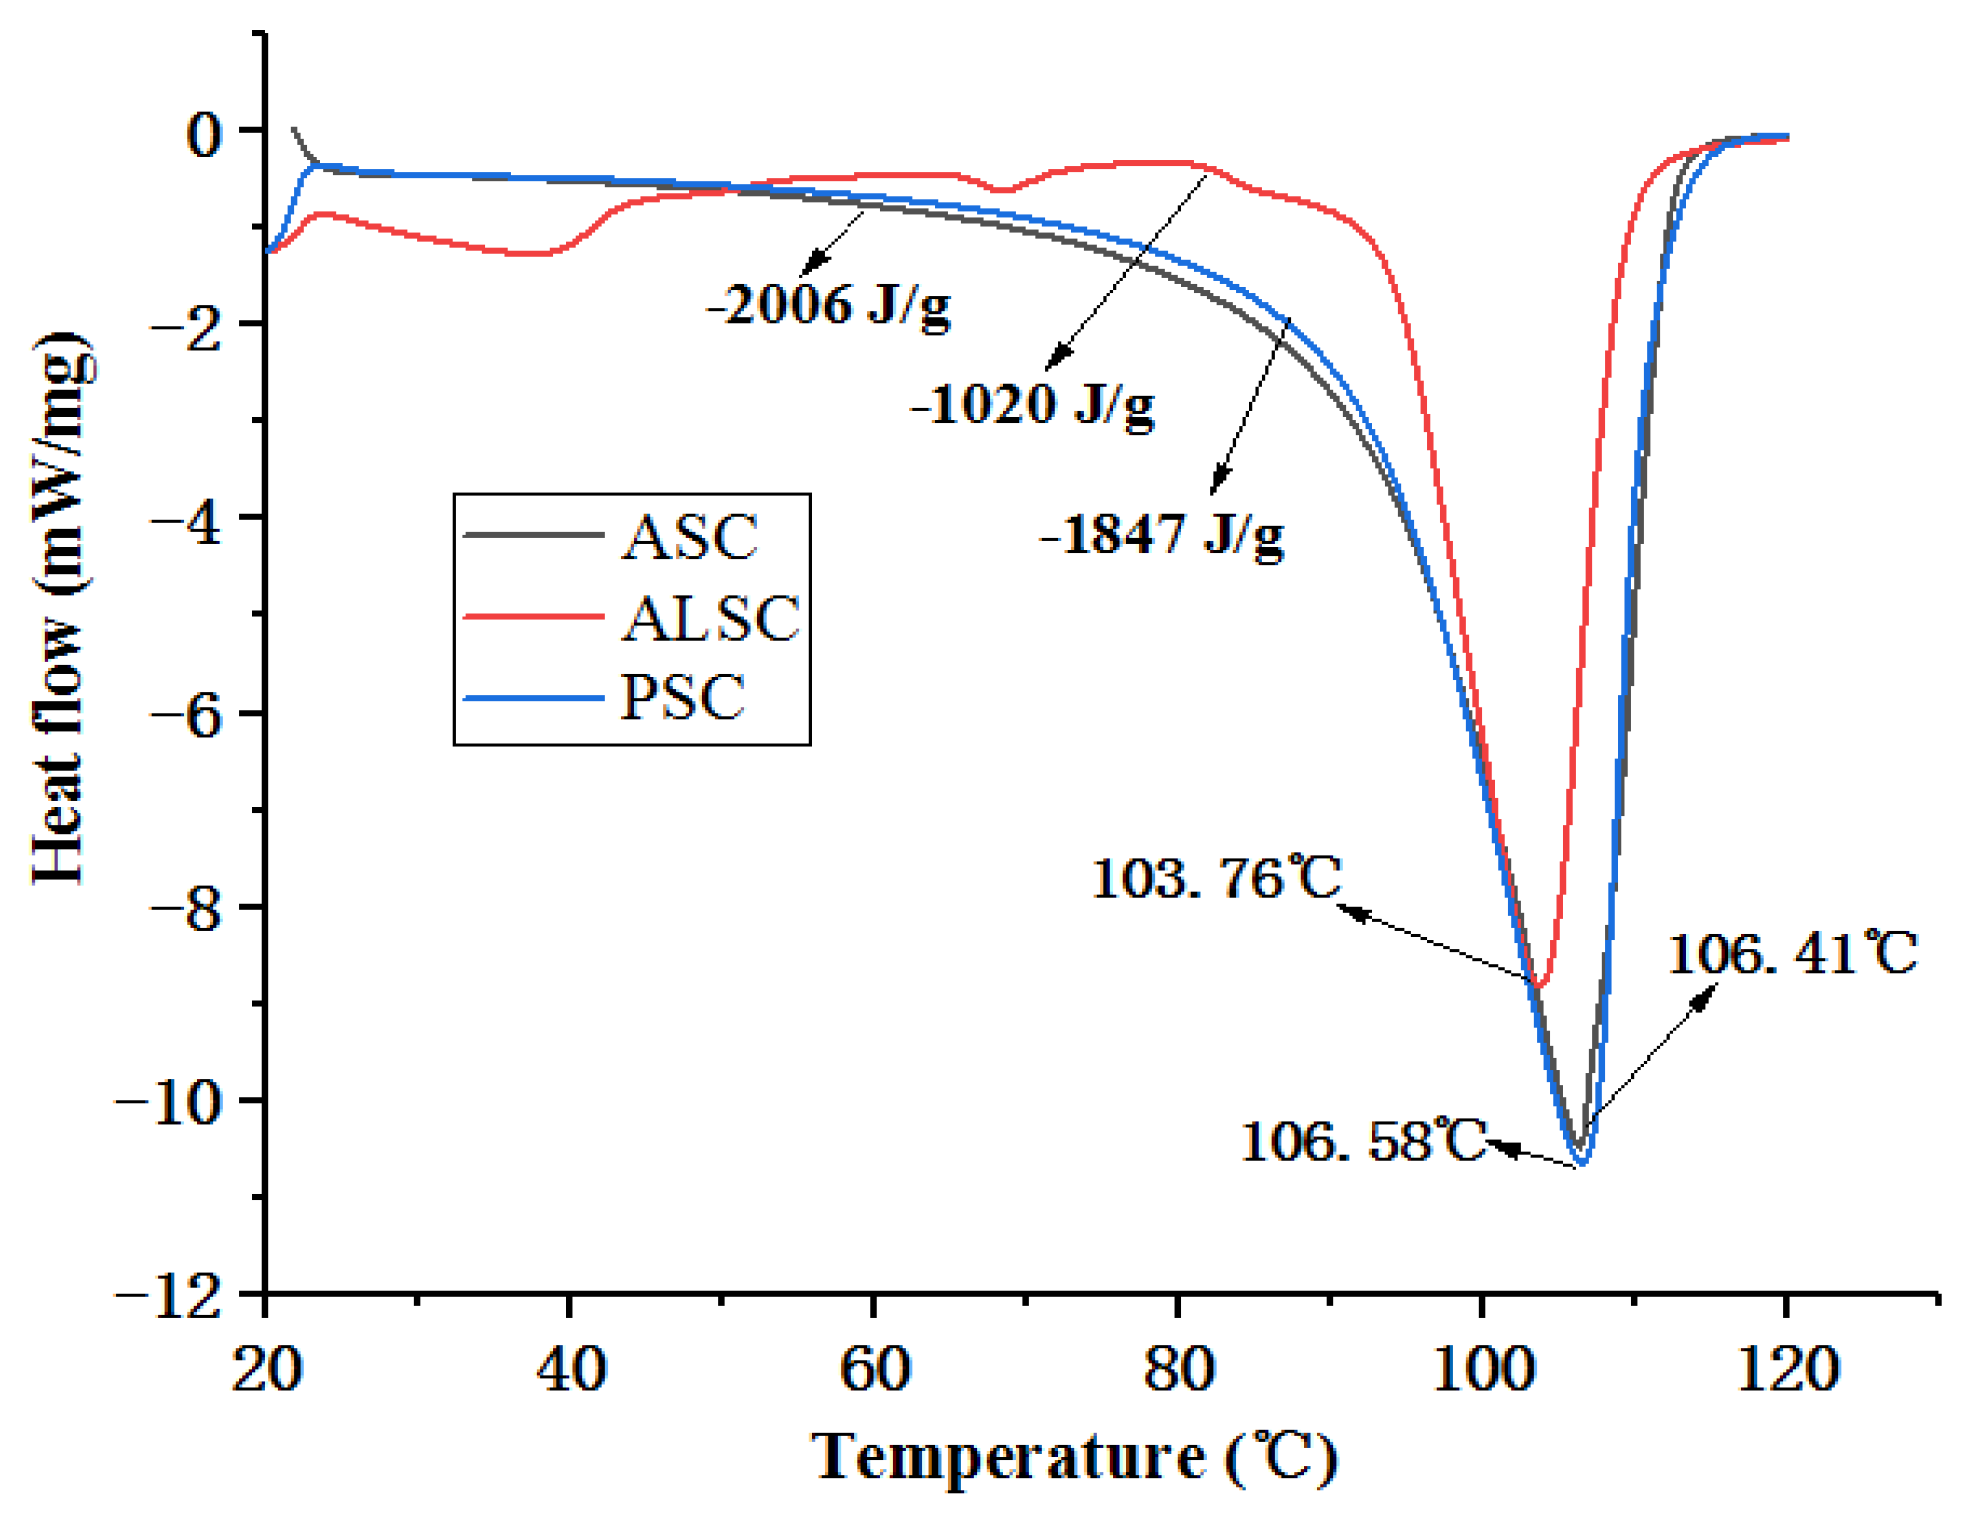
3.3. Thermal Stability
3.4. Microstructure
3.5. Processing Properties
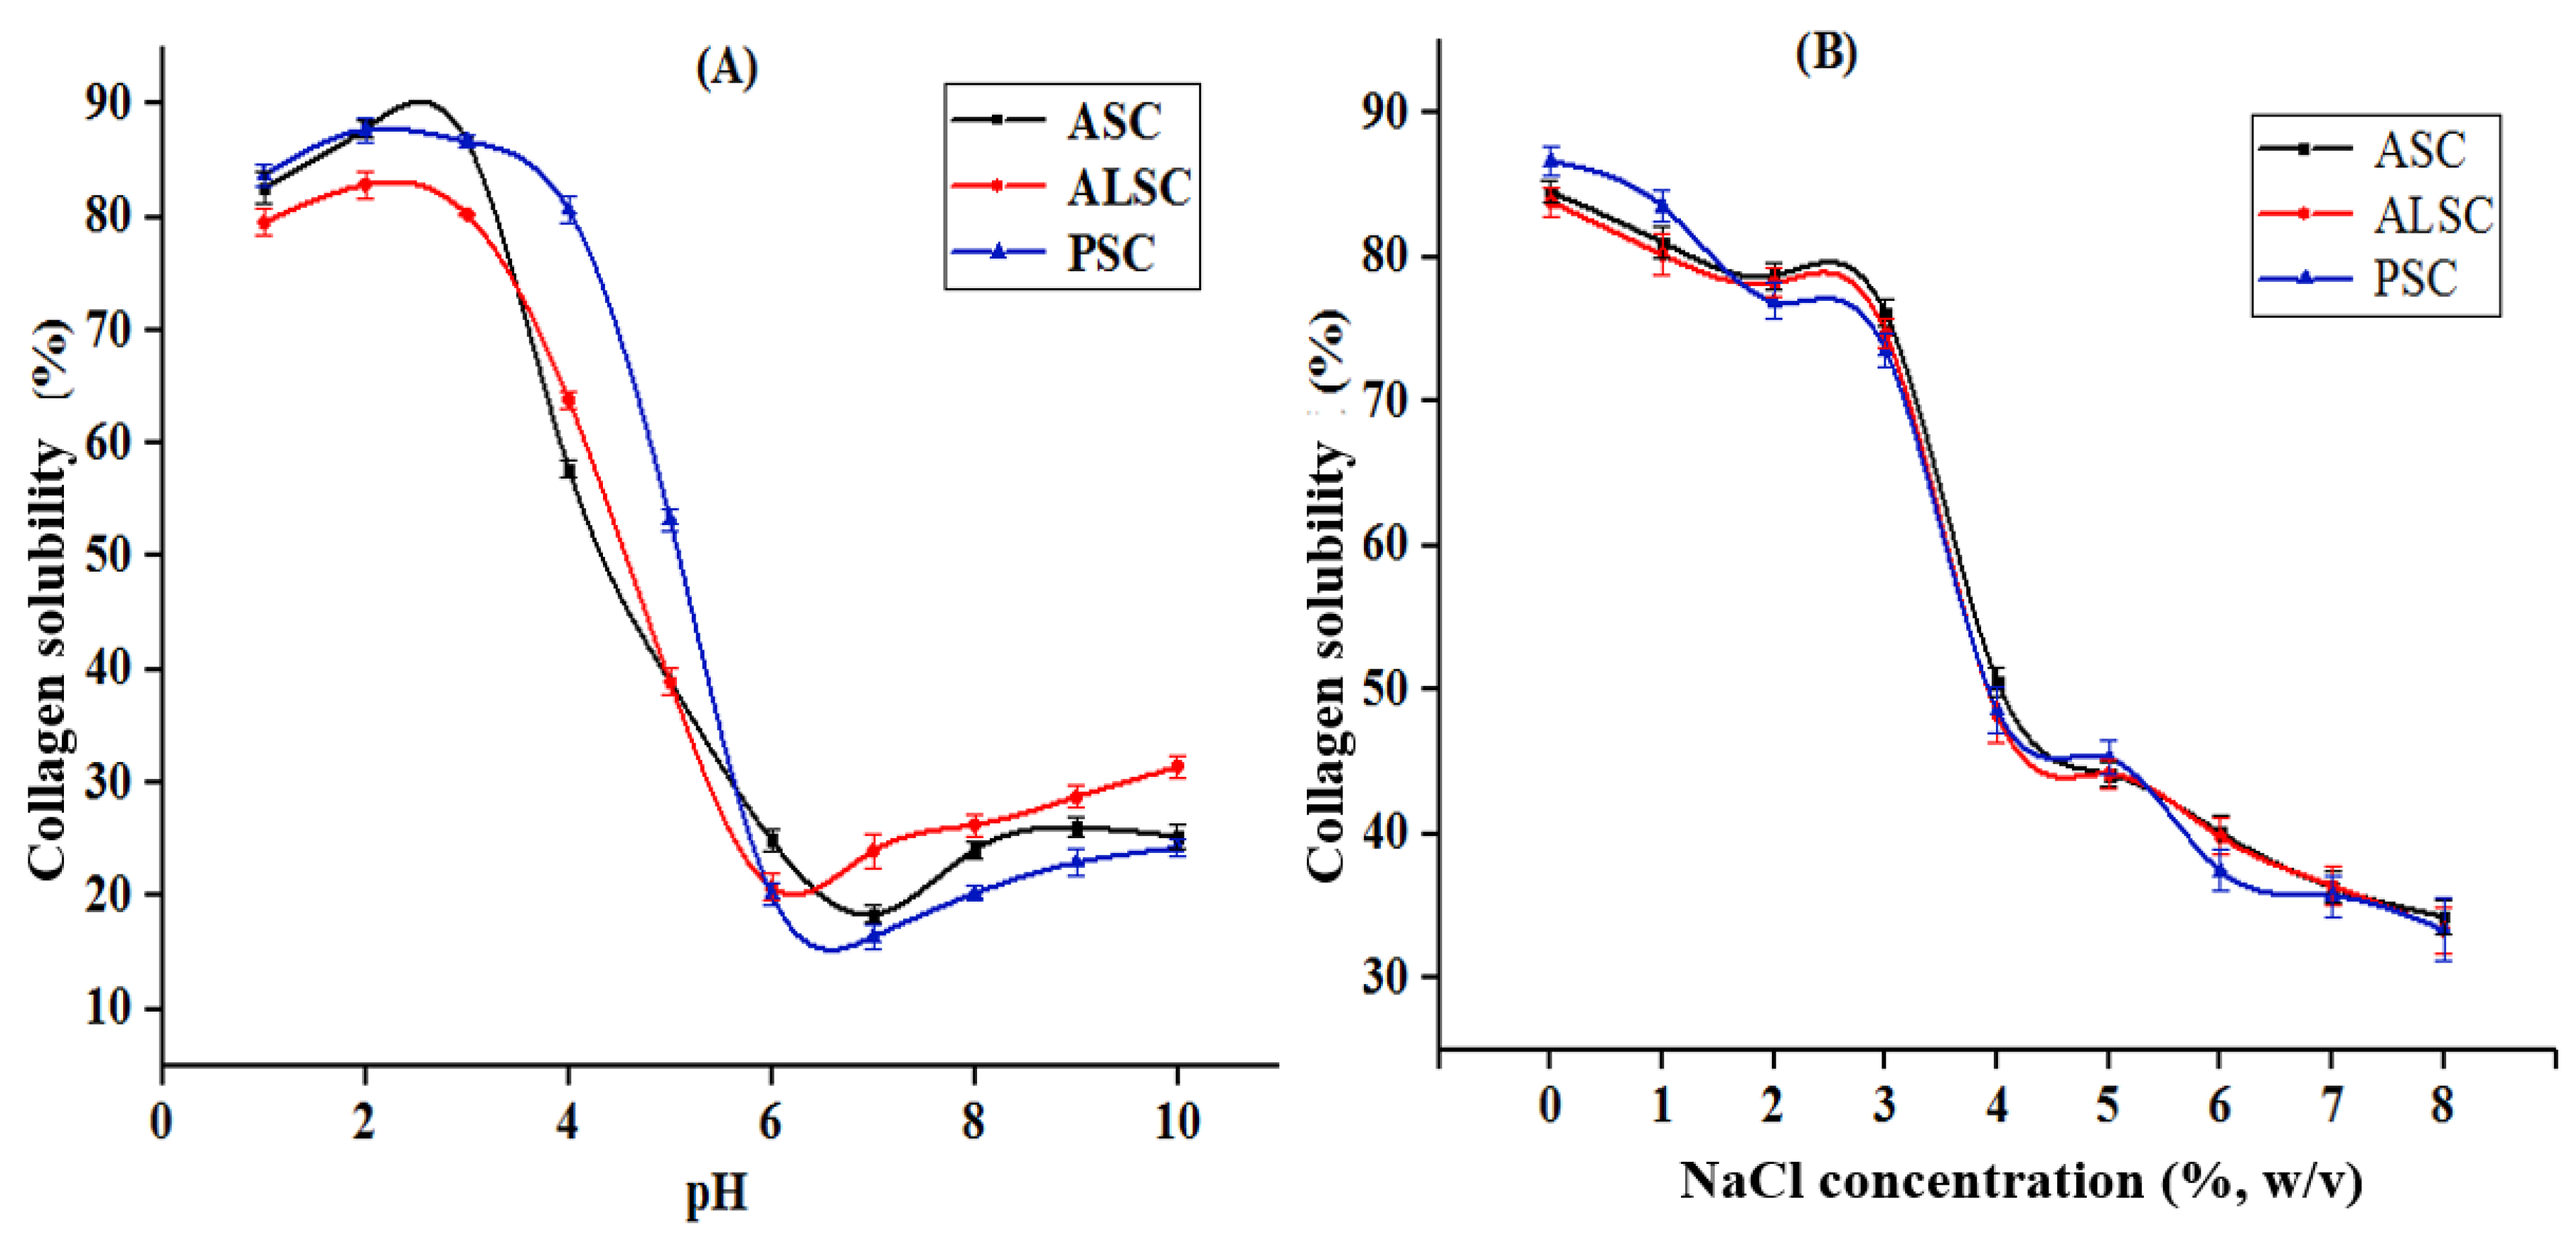
3.5.1. Solubility
3.5.2. Turbidity
3.5.3. WHC and OAC
3.5.4. Emulsifying and Foaming
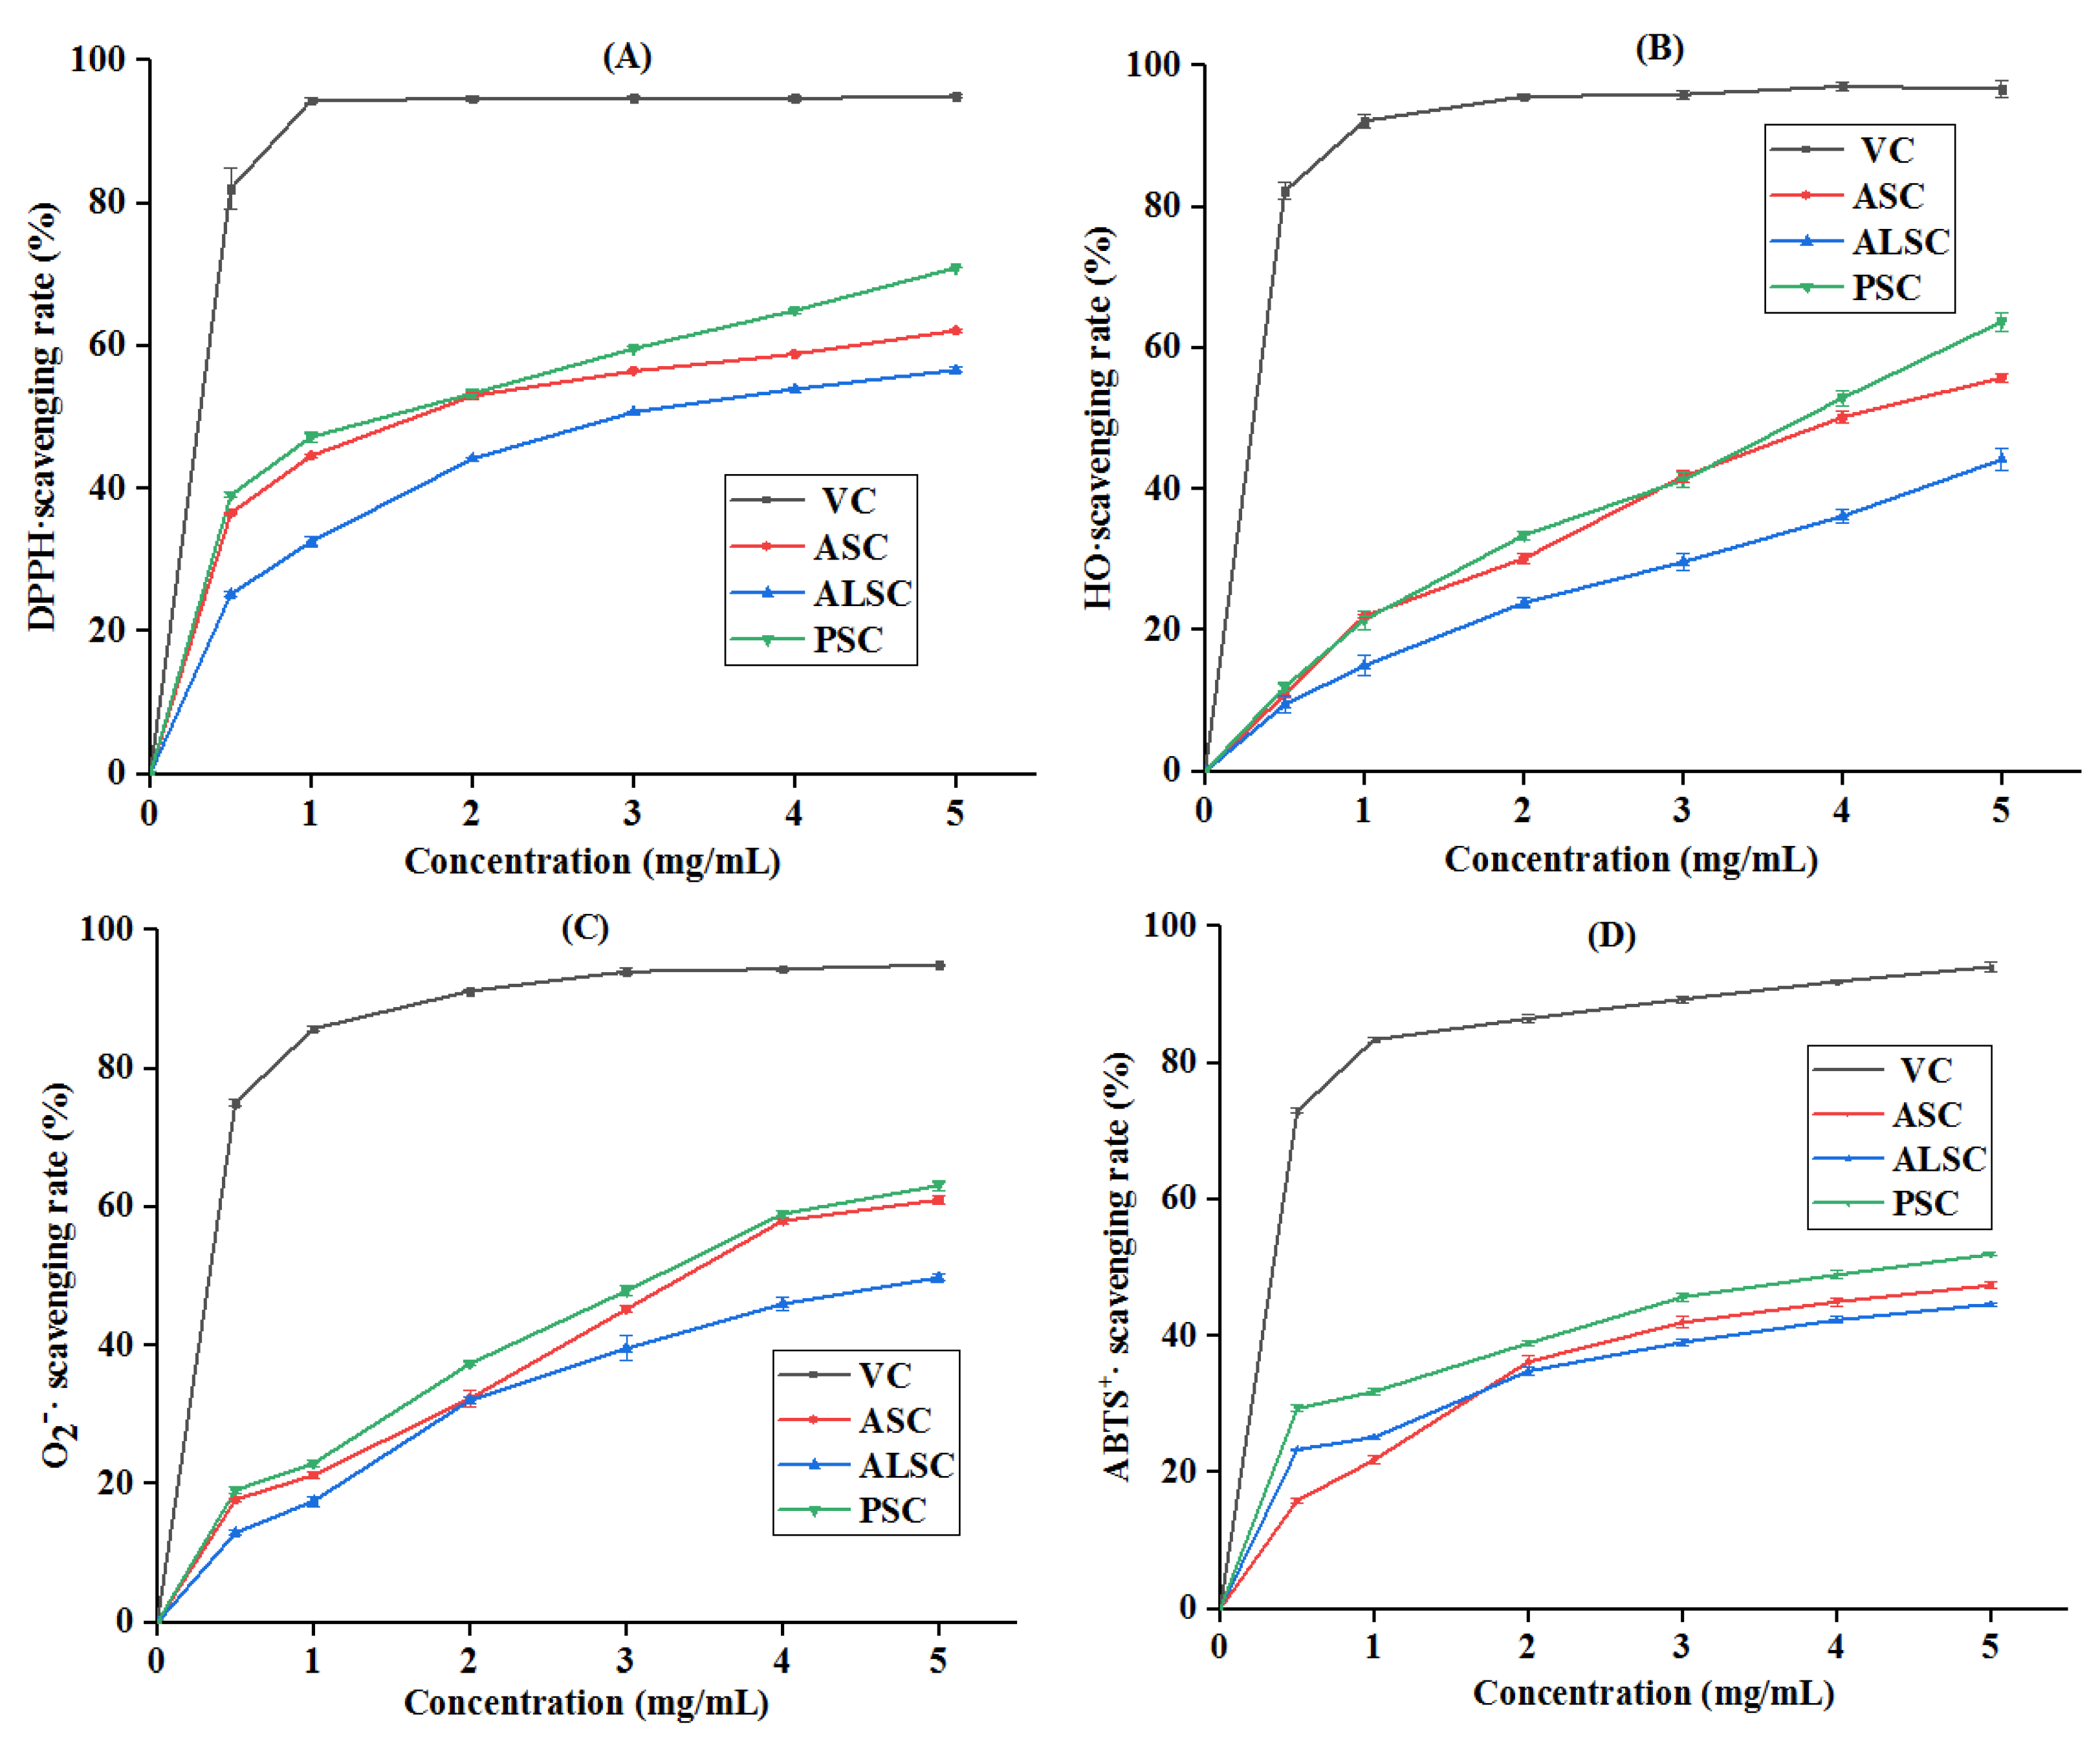
3.6. In Vitro Antioxidant Properties of Collagen
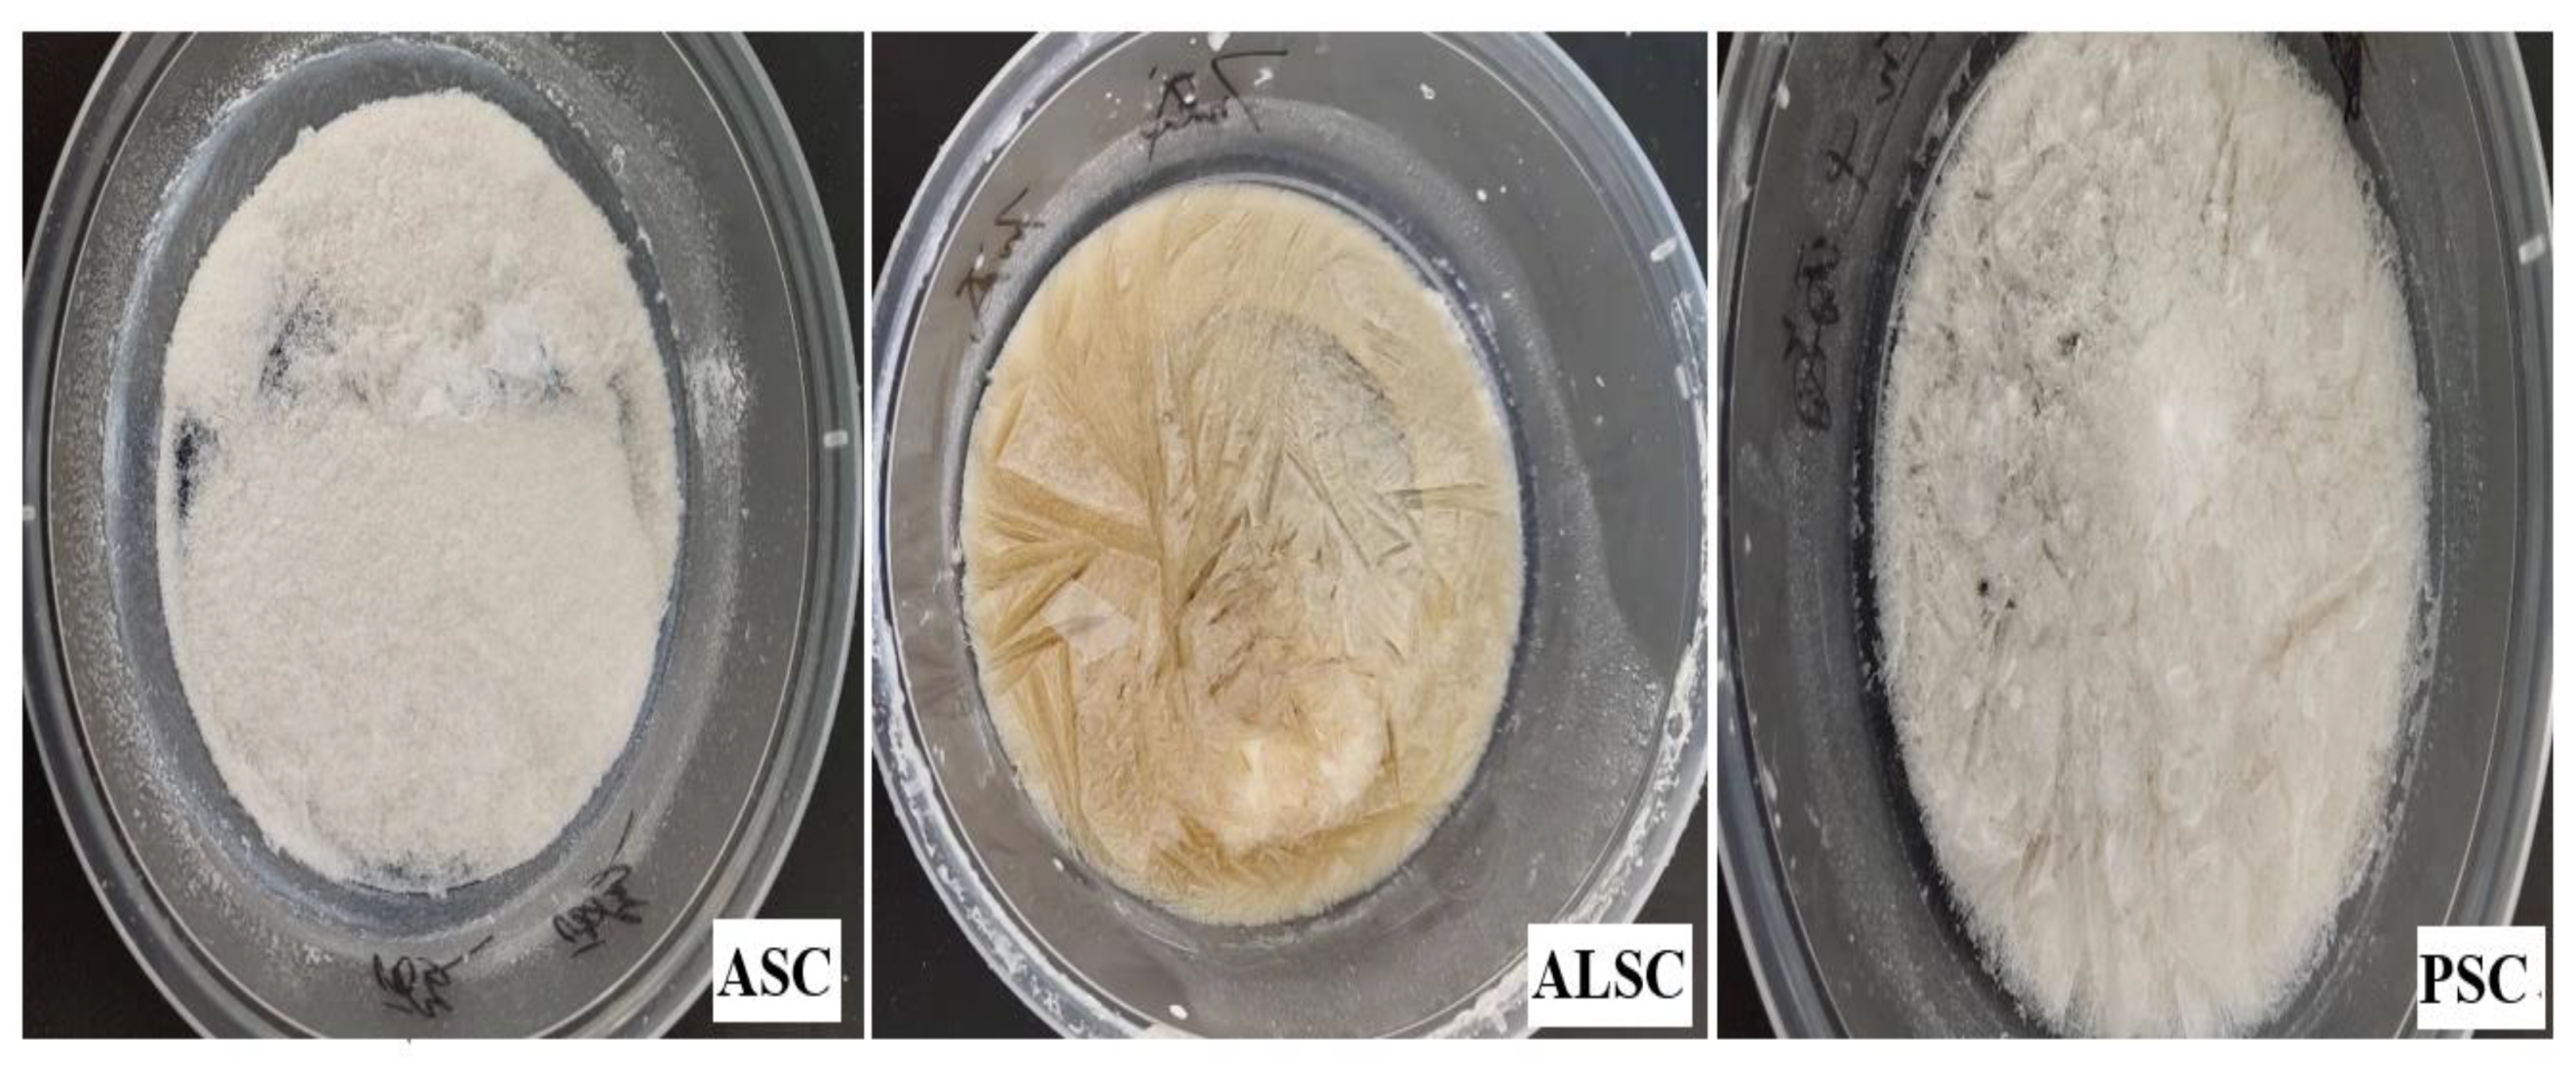
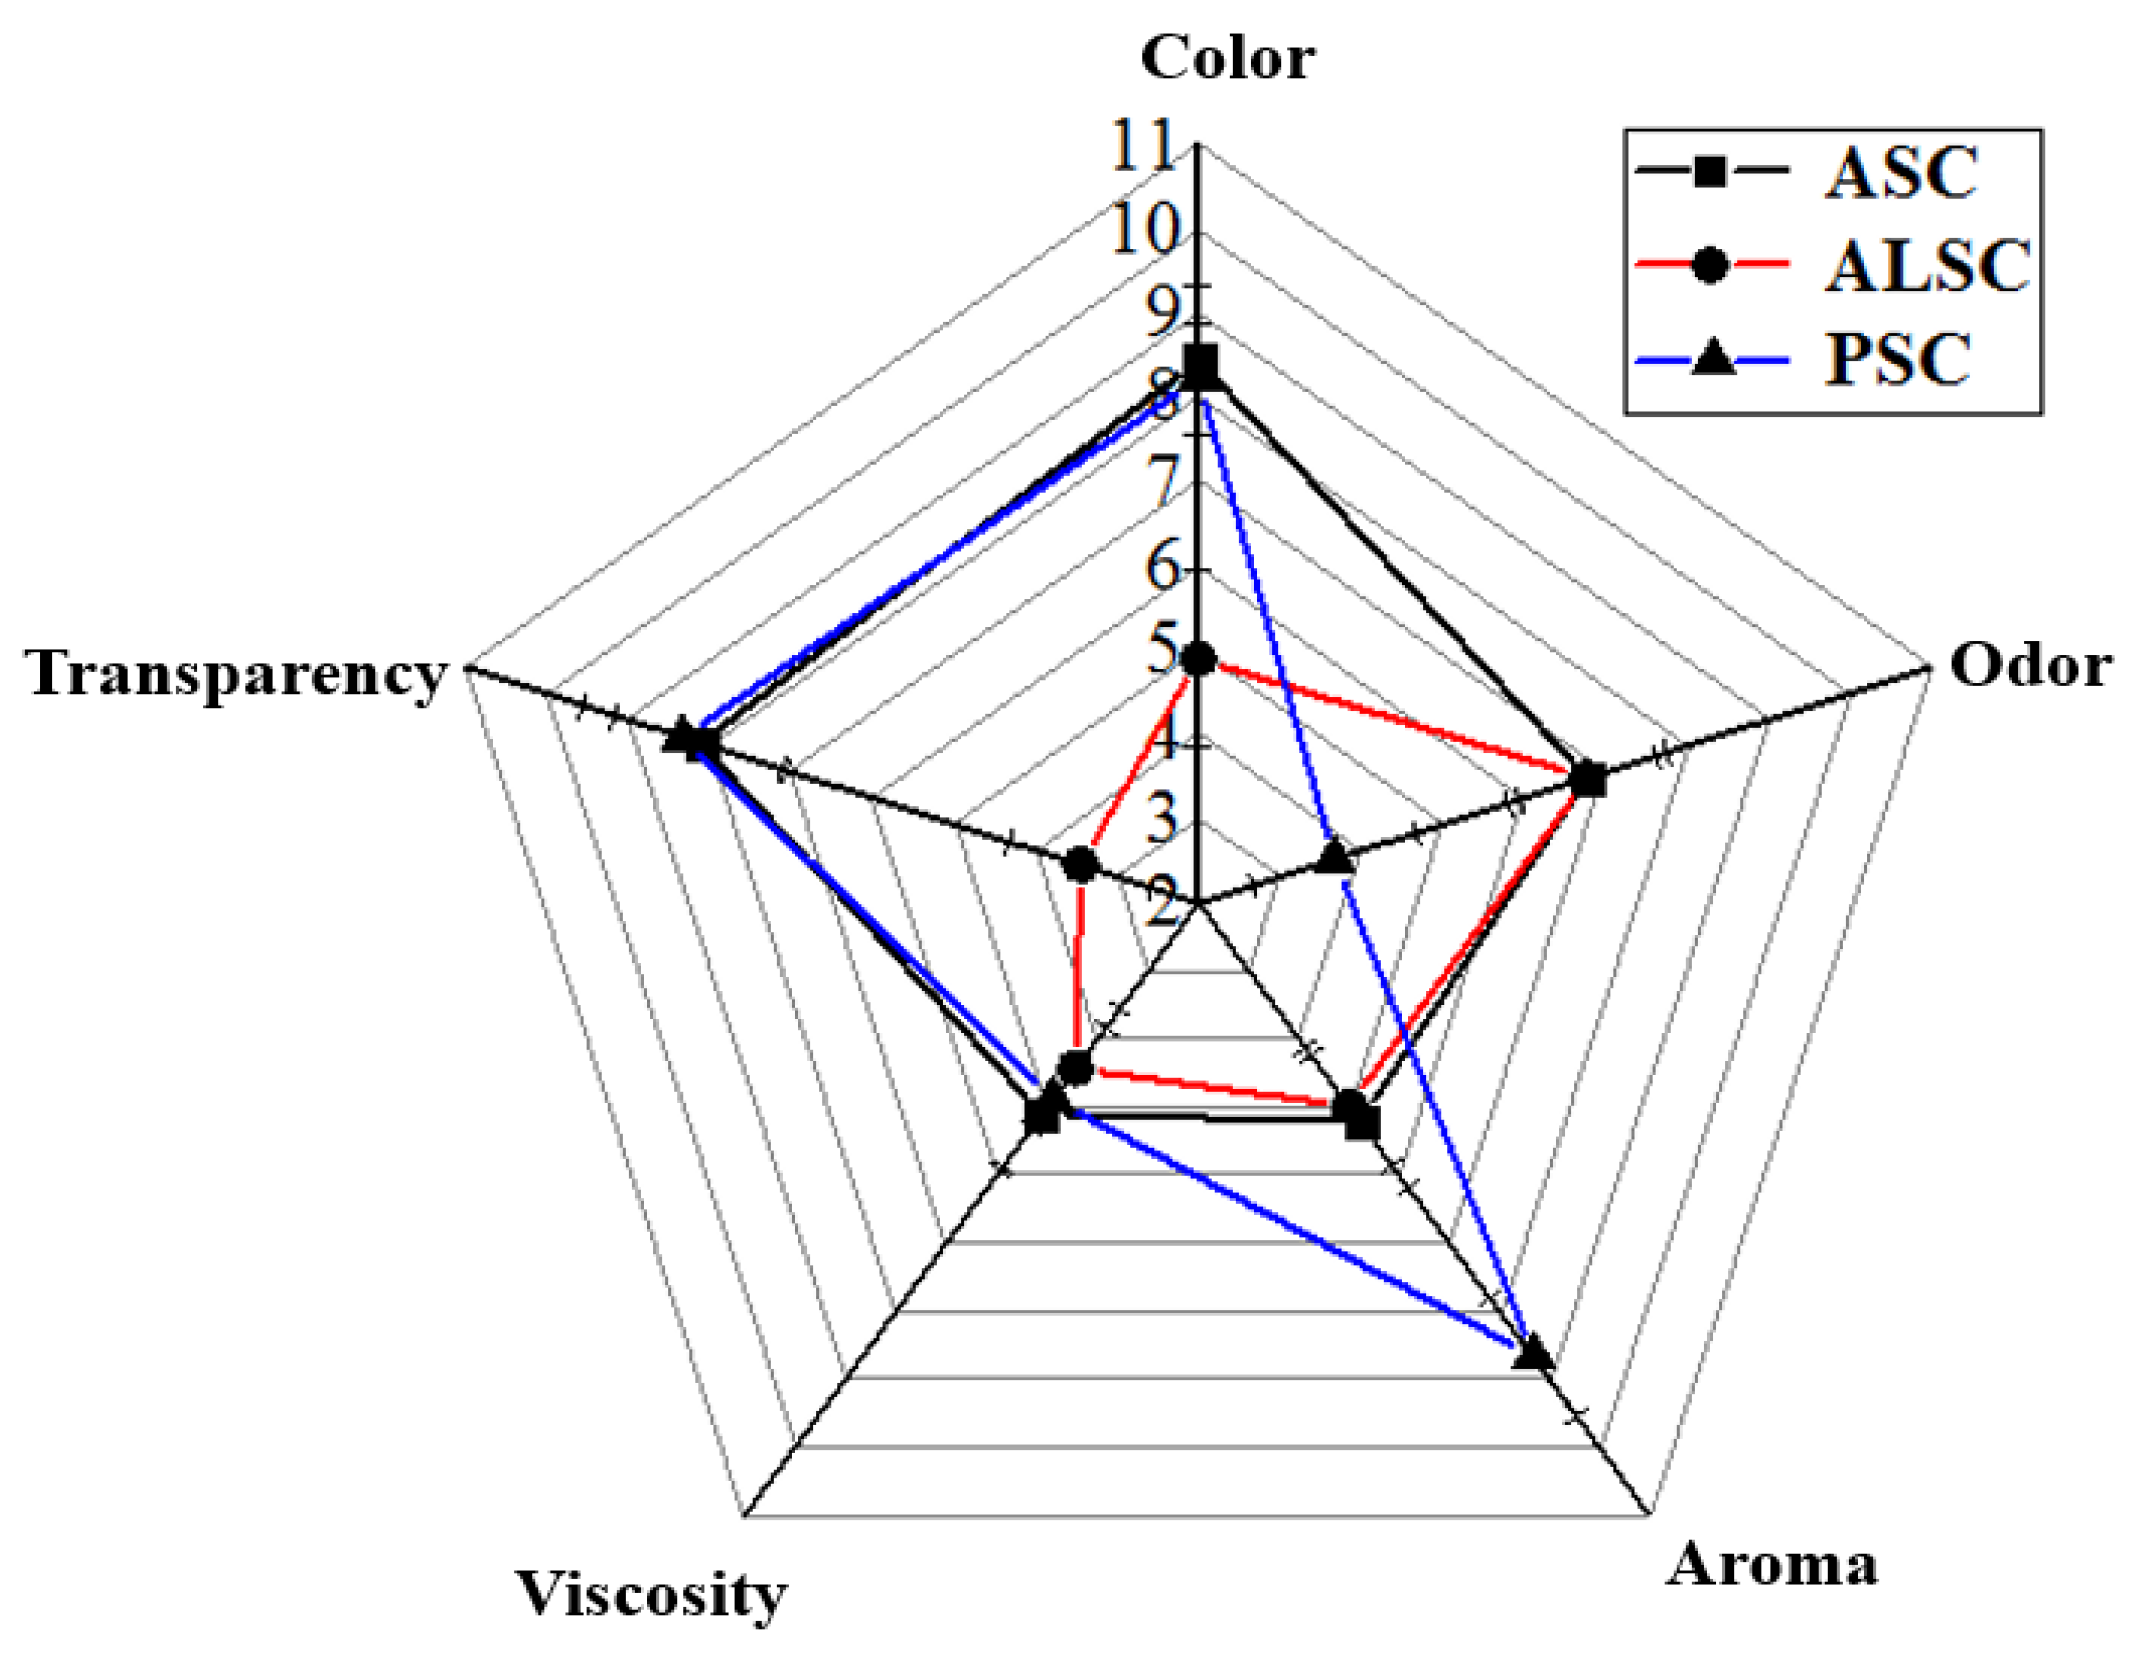
3.7. Color and Sensory Evaluation
4. Discussion
4.1. Effects of Extraction Methods on Collagen Characteristics
4.2. Effect of Extraction Methods on the Processing Properties of Collagen
4.3. Effect of Extraction Methods on Activity of Collagen In Vitro
4.4. Effects of Extraction Methods on Sensory Quality of Collagen
5. Conclusions
Author Contributions
Funding
Institutional Review Board Statement
Informed Consent Statement
Data Availability Statement
Acknowledgments
Conflicts of Interest
References
- Zhang, Y.; Xiao, B.; Wang, K.; Xin, X.; Wang, J. Research on global broiler production, Trade and industrial economic Development in 2021. Chin. J. Anim. Sci. 2022, 58, 216–222. [Google Scholar]
- Du, F. Study on the Optimization of Quality Characteristics of the Breast Paste during Different Storage Conditions. Master’s Thesis, Bohai University, Jinzhou, China, 2020. [Google Scholar]
- Liu, X. Study on Processing Quality and Suitability of Dried-Chicken Slice and Floss of Spent Laying Hens. Master’s Thesis, Bohai University, Jinzhou, China, 2021. [Google Scholar]
- Sun, H.; Zhang, C.; Li, X.; Li, Y.; Dong, X.; Wang, C.; Xie, X. Taste Compounds in Maillard Reaction Products of Chicken Bone Extract and its Enzymatic Hydrolysate. Mod. Food Sci. Technol. 2013, 29, 1872–1877. [Google Scholar]
- Wang, Y.; Zhang, D.; Rao, W.; Xu, R. Optimization of the enzymolysis parameters of peptides from chicken bone protein. Food Res. Dev. 2011, 32, 16–19. [Google Scholar]
- Dong, X. Study on Resource Utilization of Chicken Bone by-Products and Development of Ostein (Peptide) Flavor Base Material. Master’s Thesis, Chongqing Technology and Business University, Chongqing, China, 2013. [Google Scholar]
- Fu, Y.; Therkildsen, M.; Aluko, R.; Lametsch, R. Exploration of collagen recovered from animal by-products as a precursor of bioactive peptides: Successes and challenges. Crit. Rev. Food Sci. 2019, 59, 2011–2027. [Google Scholar] [CrossRef] [PubMed]
- Jayathilakan, K.; Sultana, K.; Radhakrishna, K.; Bawa, A. Utilization of byproducts and waste materials from meat, poultry and fish processing industries: A review. J. Food Sci. Technol. 2012, 49, 278–293. [Google Scholar] [CrossRef] [PubMed]
- Toldra, F.; Mora, L.; Reig, M. New insights into meat by-product utilization. Meat Sci. 2016, 120, 54–59. [Google Scholar] [CrossRef] [PubMed]
- Cao, C.; Xiao, Z.; Wu, Y.; Ge, C. Diet and skin Aging-From the perspective of food nutrition. Nutrients 2020, 12, 870. [Google Scholar] [CrossRef]
- Fratzl, P.P. Collagen Structure and Mechanics; Springer: Berlin/Heidelberg, Germany, 2008. [Google Scholar]
- Myllyharju, J.; Kivirikko, K. Collagens, modifying enzymes and their mutations in humans, flies and worms. Trends Genet. 2004, 20, 33–43. [Google Scholar] [CrossRef]
- Bay-Jensen, M.K.D.L. Biochemistry of Collagens, Laminins and Elastin; Elsevier: Amsterdam, The Netherlands, 2016. [Google Scholar]
- Wang, L.; Wang, Q.; Qian, J.; Liang, Q.; Wang, Z.; Xu, J.; He, S.; Ma, H. Bioavailability and bioavailable forms of collagen after oral administration to rats. J. Agric. Food Chem. 2015, 63, 3752–3756. [Google Scholar] [CrossRef]
- Cao, C.; Xiao, Z.; Ge, C.; Wu, Y. Animal by-products collagen and derived peptide, as important components of innovative sustainable food systems—A comprehensive review. Crit. Rev. Food Sci. Nutr. 2021, 62, 8703–8727. [Google Scholar] [CrossRef]
- Ye, M.L. Study on the Underlying Mechanism of Anti-Osteoporosis of yak(bos Grunniens) Bone Collagen Peptide. Ph.D. Thesis, Chinese Academy of Agricultural Sciences, Beijing, China, 2019. [Google Scholar]
- Zhao, W.; Chi, C.; Zhao, Y.; Wang, B. Preparation, Physicochemical and Antioxidant Properties of Acid- and Pepsin-Soluble Collagens from the Swim Bladders of Miiuy Croaker (Miichthys miiuy). Mar. Drugs 2018, 16, 162. [Google Scholar] [CrossRef]
- Tan, Y.; Chang, S.K.C. Isolation and characterization of collagen extracted from channel catfish (Ictalurus punctatus) skin. Food Chem. 2018, 242, 147–155. [Google Scholar] [CrossRef] [PubMed]
- Bi, C.; Li, X.; Xin, Q.; Han, W.; Shi, C.; Guo, R.; Shi, W.; Qiao, R.; Wang, X.; Zhong, J. Effect of extraction methods on the preparation of electrospun/electrosprayed microstructures of tilapia skin collagen. J. Biosci. Bioeng. 2019, 128, 234–240. [Google Scholar] [CrossRef] [PubMed]
- Liu, D.; Zhang, X.; Li, T.; Yang, H.; Zhang, H.; Regenstein, J.M.; Zhou, P. Extraction and characterization of acid- and pepsin-soluble collagens from the scales, skins and swim-bladders of grass carp (Ctenopharyngodon idella). Food Biosci. 2015, 9, 68–74. [Google Scholar] [CrossRef]
- Yu, H. Preparation and Antioxidant of Collagen from Deer Bone. Master’s Thesis, Changchun University of Technology, Changchun, China, 2016. [Google Scholar]
- Dai, Y.M. Study on the Hydrolysisof Veal Bone and Its Antioxidant Activity of Its Enzymecontent. Master’s Thesis, Xihua University, Chengdu, China, 2013. [Google Scholar]
- Cao, C.; Xiao, Z.; Tong, H.; Liu, Y.; Wu, Y.; Ge, C. Oral intake of chicken bone collagen peptides Anti-Skin aging in mice by regulating collagen degradation and synthesis, inhibiting inflammation and activating lysosomes. Nutrients 2022, 14, 1622. [Google Scholar] [CrossRef] [PubMed]
- Akram, A.N.; Zhang, C. Effect of ultrasonication on the yield, functional and physicochemical characteristics of collagen-II from chicken sternal cartilage. Food Chem. 2020, 307, 125544. [Google Scholar] [CrossRef] [PubMed]
- Zou, Y.; Xu, P.; Li, P.; Cai, P.; Zhang, M.; Sun, Z.; Sun, C.; Xu, W.; Wang, D. Effect of ultrasound pre-treatment on the characterization and properties of collagen extracted from soft-shelled turtle (Pelodiscus sinensis). LWT-Food Sci. Technol. 2017, 82, 72–81. [Google Scholar] [CrossRef]
- Ahmad, T.; Ismail, A.; Ahmad, S.A.; Khalil, K.A.; Leo, T.K.; Awad, E.A.; Imlan, J.C.; Sazili, A.Q. Effects of ultrasound assisted extraction in conjugation with aid of actinidin on the molecular and physicochemical properties of bovine hide gelatin. Molecules 2018, 23, 730. [Google Scholar] [CrossRef]
- Bradford, M.M. A rapid and sensitive method for the quantitation of microgram quantities of protein utilizing the principle of protein-dye binding. Anal. Biochem. 1976, 72, 248–254. [Google Scholar] [CrossRef]
- Nasrin, T.A.A.; Noomhorm, A.; Anal, A.K. Physico-Chemical characterization of culled plantain pulp starch, peel starch, and flour. Int. J. Food Prop. 2015, 18, 165–177. [Google Scholar] [CrossRef]
- Fan, L.; Dongying, J.; Kai, Y. Amino acid composition and functional properties of collagen polypeptide from Yak (Bos grunniens) bone. LWT-Food Sci. Technol. 2008, 42, 165–177. [Google Scholar]
- Li, X.R.; Chi, C.F.; Li, L.; Wang, B. Purification and Identification of Antioxidant Peptides from Protein Hydrolysate of Scalloped Hammerhead (Sphyrna lewini) Cartilage. Mar. Drugs 2017, 15, 61. [Google Scholar] [CrossRef] [PubMed]
- Boran, G.; Lawless, H.T.; Regenstein, J.M. Effects of extraction conditions on the sensory and instrumental characteristics of fish gelatin gels. J. Food Sci. 2010, 75, S469–S476. [Google Scholar] [CrossRef]
- Yue, J.Y. Study of Gel Properties and Application of Chicken bone Protein. Master’s Thesis, Chinese Academy of Agricultural Sciences, Beijing, China, 2017. [Google Scholar]
- Zhou, C.; Li, Y.; Yu, X.; Yang, H.; Ma, H.; Yagoub, A.; Cheng, Y.; Hu, J.; Otu, P.N.Y. Extraction and characterization of chicken feet soluble collagen. LWT-Food Sci. Technol. 2016, 74, 145–153. [Google Scholar] [CrossRef]
- Damodar, D.; Pisut, K.; Anita, L.; Muhammad, B.S.; Anil, K.A. Optimization of collagen extraction from chicken feet by papain hydrolysis and synthesis of chicken feet collagen based biopolymeric fibres. J. Food Sci. Technol. 2018, 23, 23–30. [Google Scholar]
- Hui, C.; Shi-Ying, X. Purification and characterization of type II collagen from chick sternal cartilage. Food Chem. 2008, 108, 439–445. [Google Scholar]
- Han, W. Preparation of Collagen by Microbial Fermentation and Its Properties and Applications. Master’s Thesis, Shanghai Ocean University, Shanghai, China, 2019. [Google Scholar]
- Li, Z.; Wang, B.; Chi, C.; Zhang, Q.; Gong, Y.; Tang, J.; Luo, H.; Ding, G. Isolation and characterization of acid soluble collagens and pepsin soluble collagens from the skin and bone of Spanish mackerel (Scomberomorous niphonius). Food Hydrocolloid 2013, 31, 103–113. [Google Scholar] [CrossRef]
- Zeng, S.; Yin, J.; Yang, S.; Zhang, C.; Yang, P.; Wu, W. Structure and characteristics of acid and pepsin-solubilized collagens from the skin of cobia (Rachycentron canadum). Food Chem. 2012, 135, 1975–1984. [Google Scholar] [CrossRef]
- Yousefi, M.; Ariffin, F.; Huda, N. An alternative source of type I collagen based on by-product with higher thermal stability. Food Hydrocolloid 2017, 63, 372–382. [Google Scholar] [CrossRef]
- Muyonga, J.H.; Cole, C.G.B.; Duodu, K.G. Characterisation of acid soluble collagen from skins of young and adult Nile perch (Lates niloticus). Food Chem. 2003, 85, 81–89. [Google Scholar] [CrossRef]
- Ana, M.D.G.P.; Gilberto, G.; Dilip, K.D.G. Dielectric and pyroelectric characterization of anionic and native collagen. Polym. Eng. Sci. 1996, 36, 2932–2938. [Google Scholar]
- Barth, A. Infrared spectroscopy of proteins. Biochim. Et Biophys. Acta 2007, 1767, 1073–1101. [Google Scholar] [CrossRef] [PubMed]
- Gómez-Guillén, P.M.D.F. Characterization of gelatin gels induced by high pressure. Food Hydrocolloid 2002, 3, 197–205. [Google Scholar]
- Wikstrom, M.B. Detection of microbial proteolytic activity by a cultivation plate assay in which different proteins adsorbed to a hydrophobic surface are used as substrates. Appl. Environ. Microb. 1983, 45, 393–400. [Google Scholar] [CrossRef] [PubMed]
- Zou, Y.; Wang, L.; Cai, P.; Li, P.; Zhang, M.; Sun, Z.; Sun, C.; Xu, W.; Wang, D. Effect of ultrasound assisted extraction on the physicochemical and functional properties of collagen from soft-shelled turtle calipash. Int. J. Biol. Macromol. 2017, 105 Pt 3, 1602–1610. [Google Scholar] [CrossRef]
- Zhang, J.B.; Zhao, Y.Q.; Wang, Y.M.; Chi, C.F.; Wang, B. Eight collagen peptides from hydrolysate fraction of spanish mackerel skins: Isolation, identification, and in vitro antioxidant activity evaluation. Mar. Drugs 2019, 17, 224. [Google Scholar] [CrossRef]
- Zhou, T.; Wu, Y.J.; Lu, F.Y.; Yang, B.; Feng, J.J.; Yang, J.; Zhou, Y.; Wang, D.Y.; Xu, W.M. Physicochemical and functional pproperties of collagen peptides derived from ultrasonic-assisted alkaline protease hydrolysis of chicken claws. Meat Res. 2021, 35, 8–12. [Google Scholar]
- Muhammad, N.A.N.; Huda, N.; Karim, A.A.; Nafchi, A.M. Effects of acid type extraction on characterization and sensory profile of duck feet gelatin: Towards finding bovine gelatin alternative. J. Food Meas. Charact. 2018, 12, 480–486. [Google Scholar] [CrossRef]
- Xu, X. Study on Enzymolysis of Chicken Bone Residue and Its Application. Master’s Thesis, Henan Agricultural University, Zhengzhou, China, 2009. [Google Scholar]
- Ding, X.Y. Enzymatic Hydrolysis of Chicken Bone Paste and the Study on the Application of Its Products. Master’s Thesis, Fuzhou University, Fuzhou, China, 2006. [Google Scholar]
- Alberts, B.; Johnson, A.; Lewis, J.; Raff, M.; Roberts, K.; Walter, P. The shape and structure of proteins. In Molecular Biology of the Cell, 4th ed.; Garland Science: New York, NY, USA, 2002. [Google Scholar]
- Oechsle, A.M.; Akgün, D.; Krause, F.; Maier, C.; Gibis, M.; Kohlus, R.; Weiss, J. Microstructure and physical–chemical properties of chicken collagen. Food Struct. 2016, 7, 29–37. [Google Scholar] [CrossRef]
- Ulug, S.K.; Jahandideh, F.; Wu, J. Novel technologies for the production of bioactive peptides. Trends Food Sci. Technol. 2021, 120, 27–39. [Google Scholar] [CrossRef]
- Akkasit, J.; Soottawat, B.; Wonnop, V.; Takeshi, N.; Munehiko, T. Isolation and characterisation of acid and pepsin-solubilised collagens from the skin of Brownstripe red snapper (Lutjanus vitta). Food Chem. 2005, 93, 475–484. [Google Scholar]
- Prabjeet, S.; Soottawat, B.; Sajid, M.; Hideki, K. Isolation and characterisation of collagen extracted from the skin of striped catfish (Pangasianodon hypophthalmus). Food Chem. 2010, 124, 97–105. [Google Scholar]
- Lin, C.T.; Ke, X.X.; Guo, J.H.; Wu, Q.M.; Liu, S.T.; Guo, J.K.; Rao, P.F.; Chen, X.C. Preliminary antioxidant pelationship of collagen and collagen peptides. J. Chin. Inst. Food Sci. Technol. 2017, 17, 44–50. [Google Scholar]
- Chi, C.F.; Hu, F.Y.; Wang, B.; Li, Z.R.; Luo, H.Y. Influence of Amino Acid Compositions and Peptide Profiles on Antioxidant Capacities of Two Protein Hydrolysates from Skipjack Tuna (Katsuwonus pelamis) Dark Muscle. Mar. Drugs 2015, 13, 2580–2601. [Google Scholar] [CrossRef] [PubMed]


| Index | Chemical Composition of Raw Materials and Collagen | |||
|---|---|---|---|---|
| Bone Meal | ASC | ALSC | PSC | |
| Yield (%) | - | 3.39 ± 0.37 b | 2.42 ± 0.12 c | 9.63 ± 0.60 a |
| Moisture (%) | 64.80 ± 1.73 a | 5.10 ± 0.48 b | 4.96 ± 0.28 b | 5.18 ± 0.30 b |
| Ash (%) | 7.92 ± 0.36 a | 1.47 ± 0.12 b | 1.44 ± 0.11 b | 1.43 ± 0.08 b |
| Protein (%) | 15.79 ± 0.55 c | 83.37 ± 0.72 b | 81.37 ± 2.11 b | 87.63 ± 2.36 a |
| Fat (%) | 7.45 ± 0.78 a | 0.43 ± 0.02 c | 1.09 ± 0.03 b | 0.20 ± 0.01 d |
| Amino Acid Species | Content (%, g per 100 g of Protein) | ||
|---|---|---|---|
| ASC | ALSC | PSC | |
| Asp | 4.56 | 6.30 | 4.45 |
| Thr | 2.53 | 3.37 | 2.37 |
| Ser | 3.81 | 4.63 | 3.72 |
| Glu | 9.28 | 10.06 | 9.14 |
| Gly | 26.74 | 22.67 | 27.86 |
| Ala | 9.83 | 9.12 | 9.61 |
| Val | 1.40 | 1.97 | 1.45 |
| Met | 1.84 | 2.72 | 2.11 |
| Ile | 1.35 | 2.54 | 1.48 |
| Leu | 2.81 | 4.72 | 2.54 |
| Tyr | 0.87 | 0.93 | 0.49 |
| Phe | 2.44 | 3.71 | 2.03 |
| Lys | 3.34 | 3.96 | 3.15 |
| His | 0.48 | 0.88 | 0.57 |
| Arg | 5.17 | 5.28 | 5.22 |
| Pro | 10.55 | 8.27 | 11.60 |
| Hyp | 9.51 | 6.29 | 9.83 |
| Properties | Peak Wave Number (cm−1) | Assignment | References | ||
|---|---|---|---|---|---|
| ASC | ALSC | PSC | |||
| Amide A | 3340.91 | 3371.93 | 3290.62 | N-H stretch and hydrogen bond | [37,42] |
| Amide B | 2923.13 | 2923.51 | 2921.42 | CH2 asymmetric stretch | |
| - | 2852.32 | 2856.20 | 2851.19 | CH2 symmetric stretch | |
| Amide I | 1644.51 | 1652.18 | 1644.4 | C=O stretch/hydrogen bond coupled with COO- | |
| Amide II | 1559.72 | 1560.49 | 1548.3 | NH bends and CN stretch | |
| Amide III | 1244.24 | 1250.84 | 1243.22 | NH bends and CN stretch | |
| - | 1025.72 | 1027.95 | 1080.46 | C-O stretch | |
| Processing Properties | ASC | ALSC | PSC |
|---|---|---|---|
| Turbidity (mg/L) | 47.28 ± 5.58 b | 132.94 ± 26.13 a | 57.67 ± 6.73 b |
| WHC (g/g) | 0.71 ± 0.03 c | 0.85 ± 0.01 b | 1.06 ± 0.04 a |
| OAC (mL/g) | 4.98 ± 0.51 c | 6.35 ± 0.43 b | 8.17 ± 0.93 a |
| FA (%) | 109.78 ± 1.44 b | 113.27 ± 1.07 b | 124.83 ± 2.67 a |
| FS (%) | 103.83 ± 0.60 c | 105.89 ± 1.40 b | 108.78 ± 0.82 a |
| ESI (m2/g) | 50.65 ± 5.44 b | 49.22 ± 3.97 b | 66.14 ± 6.82 a |
| EAI (min) | 51.10 ± 4.50 b | 42.50 ± 4.98 bc | 66.69 ± 5.72 a |
| Collagen | L* | a* | b* |
|---|---|---|---|
| ASC | 93.35 ± 1.22 a | 0.76 ± 0.46 | 0.55 ± 0.42 c |
| ALSC | 62.38 ± 1.12 c | 0.91 ± 0.57 | 20.93 ± 1.85 a |
| PSC | 81.24 ± 0.68 b | 0.24 ± 0.17 | 11.84 ± 0.52 b |
Disclaimer/Publisher’s Note: The statements, opinions and data contained in all publications are solely those of the individual author(s) and contributor(s) and not of MDPI and/or the editor(s). MDPI and/or the editor(s) disclaim responsibility for any injury to people or property resulting from any ideas, methods, instructions or products referred to in the content. |
© 2023 by the authors. Licensee MDPI, Basel, Switzerland. This article is an open access article distributed under the terms and conditions of the Creative Commons Attribution (CC BY) license (https://creativecommons.org/licenses/by/4.0/).
Share and Cite
Cao, C.; Wang, H.; Zhang, J.; Kan, H.; Liu, Y.; Guo, L.; Tong, H.; Wu, Y.; Ge, C. Effects of Extraction Methods on the Characteristics, Physicochemical Properties and Sensory Quality of Collagen from Spent-Hens Bones. Foods 2023, 12, 202. https://doi.org/10.3390/foods12010202
Cao C, Wang H, Zhang J, Kan H, Liu Y, Guo L, Tong H, Wu Y, Ge C. Effects of Extraction Methods on the Characteristics, Physicochemical Properties and Sensory Quality of Collagen from Spent-Hens Bones. Foods. 2023; 12(1):202. https://doi.org/10.3390/foods12010202
Chicago/Turabian StyleCao, Changwei, Hailang Wang, Jinyan Zhang, Huan Kan, Yun Liu, Lei Guo, Huiquan Tong, Yinglong Wu, and Changrong Ge. 2023. "Effects of Extraction Methods on the Characteristics, Physicochemical Properties and Sensory Quality of Collagen from Spent-Hens Bones" Foods 12, no. 1: 202. https://doi.org/10.3390/foods12010202
APA StyleCao, C., Wang, H., Zhang, J., Kan, H., Liu, Y., Guo, L., Tong, H., Wu, Y., & Ge, C. (2023). Effects of Extraction Methods on the Characteristics, Physicochemical Properties and Sensory Quality of Collagen from Spent-Hens Bones. Foods, 12(1), 202. https://doi.org/10.3390/foods12010202