Article

Metabolite Profiling of Chestnut (Castanea crenata) According to Origin and Harvest Time Using 1H NMR Spectroscopy

Food Analysis Research Center, Korea Food Research Institute, Wanju 55365, Korea
*
Author to whom correspondence should be addressed.
These authors contributed equally to this work.
Foods 2022, 11(9), 1325; https://doi.org/10.3390/foods11091325
Submission received: 5 April 2022 / Revised: 25 April 2022 / Accepted: 28 April 2022 / Published: 2 May 2022
(This article belongs to the Section Plant Foods)

Abstract

:
Chestnuts are an important food crop commonly used as a food ingredient due to their nutritional properties and potential health benefits. In Korea, chestnuts have been crossbred to develop cultivars with insect resistance and high productivity, producing multiple chestnut varieties. This study classified 17 Castanea crenata cultivars produced in Korea according to origin and harvest time and determined the metabolites in chestnut kernels using 1H nuclear magnetic resonance spectroscopy. The 17 C. crenata cultivars were divided into four groups based on their geographic origin: Korean native, Korean hybrid, Japanese native, and Japanese hybrid. The cultivars were also divided into three groups depending on their harvest period: early-ripening cultivar, mid-ripening cultivar, and late-ripening cultivar. The partial least squares-discriminant analysis score plot revealed differences among the groups. Identified metabolites, including amino acids, organic acids, and sugars, contributed to discriminating the origin and harvest time of the C. crenata chestnut kernels. Significant differences were observed, mainly in amino acids, which suggests that the composition of amino acids is one factor influenced by both the origin and harvest time of C. crenata. These results are useful to both growers and breeders because they identify the nutritional and metabolic characteristics of each C. crenata cultivar.

1. Introduction

The chestnut, belonging to the Fagaceae family, is cultivated globally, including the Korean and Japanese chestnut (Castanea crenata Siebold & Zucc.), Chinese chestnut (Castanea mollissima Blume), European chestnut (Castanea sativa Miller), and North American chestnut (Castanea dentate (Marshall) Borkh.) [1,2,3]. According to the Food and Agriculture Organization, chestnut production continuously increased in Asia until 2014, and Korea is the second-largest producer of chestnuts in Asia after China [4]. In Korea, more than 50,000 tons of ripe chestnuts were produced from September to October every year until 2020 [5]. Chestnut is popular in Korea for its rich taste and high nutritive value [6]. Compared to other fruits, chestnut has a higher starch content and a lower moisture content, and it also contains proteins, amino acids, dietary fiber, vitamins, and minerals [7]. It is mainly prepared by roasting in winter or it consumed as a canned food and is used in traditional customs, such as wedding ceremonies and other ancestral rites. The inner skins are used as cosmetic ingredients [8,9].
In 1958, the chestnut gall wasp (Drycocosmus kuriphylus Yasumatsu), which damages and kills chestnut trees, appeared in Korea and spread across the country. As a result, many native Korean chestnut trees were harmed. Since then, large-scale crossbreeding of chestnut trees has been carried out to develop cultivars with resistance to insects and cold, high productivity, and large nut size [10]. The cultivars commonly grown in Korea are related to the Japanese chestnut and are derived from intra-hybridization or individual selection [11,12]. Currently, cultivars originating from Japan or Korea, such as Daebo, Okkwang, Ginyose, Tanzawa, Tsukuba, and Riheiguri, are widely cultivated in Korea. However, little information is available regarding the metabolic characteristics of these varieties [13,14].
Food qualities, such as fragrance, taste, appearance, shelf-life, and nutritional content, are determined by biochemical compositions and are reflected in the metabolite profiles [15,16]. Metabolites represent the intermediates or final products of cellular regulatory mechanisms, and they can be considered as the response of the biological system to environmental changes [17]. Because plant materials vary chemically, the same cultivars can have different chemical components due to genotype variations, environmental factors, time of harvesting, and post-harvesting factors [18]. The investigation of differences in metabolite profiling across cultivars may provide useful information for the comprehensive evaluation of the nutritional value of chestnuts, contributing to the improvement of new varieties or the selection of chestnut varieties for specific uses.
Metabolomics has proven to be a powerful tool for the extensive analysis and identification of plant and food compositions [19]. Nuclear magnetic resonance (NMR) spectroscopy gives excellent metabolite profiles by taking advantage of this technique’s high reproducibility, non-selective analysis, and complete analysis of the molecular components of a complex matrix [20]. Recently, metabolomics studies using 1H NMR spectroscopy or mass spectrometry have also been applied to food science [17,21]. There are not many metabolomics studies on chestnuts, and most of the previous studies have been on chestnut shells [22,23]. No metabolite profiles of C. crenata chestnut kernel extracts using NMR spectroscopy have been reported to date. In this study, we performed the metabolic profiling of 17 C. crenata cultivar kernels using 1H NMR spectroscopic analysis to measure the metabolite level of several metabolite classes. In addition, 17 C. crenata cultivars were classified according to their origin and harvest time, and metabolic profiling results were submitted for statistical multivariate analyses to determine the metabolic characteristics according each category. This research provides information on the features of chestnut cultivars according to their origin and harvest time that is useful to both growers and breeders.

2. Materials and Methods

2.1. Standards and Reagents

A 99.8% methanol-d4 and 99.9% deuterium oxide were purchased from Cambridge Isotope Laboratories, Inc. (Andover, MA, USA), 3-(trimethylsilyl)propionic-2,2,3,3-d4 acid (TSP), and hydrochloric acid were obtained from Sigma-Aldrich (St. Louis, MO, USA), and sodium hydroxide was obtained from Junsei Chemical (Tokyo, Japan). All chemicals were of analytical grade.

2.2. Sample Collection

C. crenata chestnuts were commercially purchased, approximately 4 kg per sample, from local markets in South Korea. A total of seventeen C. crenata chestnuts were collected between September and November 2020. All chestnut varieties were produced in Buyeo-gun or Gongju-si, Chungcheongnam-do, South Korea. The sample information of C. crenata are shown in Table 1. C. crenata cultivars were classified into four groups depending on the C. crenata chestnut cultivar origin: Korean native or crossbred between Korean native (KN), Korean hybrid crossbred with other origins (KH), Japanese native or crossbred between Japanese native (JN), and Japanese hybrid crossbred with other origins (JH). Also, the chestnut varieties were divided into three types according to their optimal ripening time: early-ripening cultivar (ERC), mid-ripening cultivar (MRC), and late-ripening cultivar (LRC).
To prepare the kernels, the outer shell and inner shell from the chestnuts were separated automatically using a chestnut skin removal machine. They were stored at −80 °C before freeze-drying. They were put in a freeze dryer (FDCF-12003, Operon, Korea) and freeze-dried for 72 h under conditions with a condenser temperature of −50 °C and a pressure of 10 mTorr. Dried kernels were ground to a fine powder and stored at −80 °C until the analysis.

2.3. Sample Preparation

The metabolite extraction step was performed following a method described by Jung et al. [24] but was slightly modified. Approximately 50 mg of dried sample was extracted in 500 μL of methanol-d4, 400 μL of a 0.2 M sodium phosphate buffer in D2O (pH 7.0), and 100 μL of 6 mM TSP. D2O was used as a field frequency lock signal and TSP was an internal standard with a chemical shift reference (δ) of 0.0 ppm. The mixtures were vortexed and sonicated for 20 min, and then adjusted to pH 7.0 ± 0.1 using 0.2 M NaOH and 0.2 M HCl solutions. Afterwards, they were centrifuged at 12,000 rpm at room temperature for 20 min. The upper layer was transferred into 5 mm diameter NMR tubes and stored at 4 °C until analysis.

2.4. 1H NMR Analysis

1H NMR spectra were recorded on a Bruker AbanceHD 800 MHz FT-NMR Spectrometer (Bruker BioSpin Co., Billerica, MA, USA), operating at 298 K, using a 5 mm triple resonance inverse cryoprobe with Z-gradients. The NOESY pulse sequence was applied to suppress the residual water signal. For each sample, 64 transients were collected in to 64,000 data points using a spectral width of 16,393.4 Hz with a relaxation delay of 2.0 s, and an acquisition time of 2.0 s. A line-broadening function of 0.5 Hz was applied to all spectra for Fourier transformation. All NMR spectra were phased and underwent baseline correction. Signal assignments for representative samples were facilitated by using two-dimensional (2D) total correlation spectroscopy (TOCSY), 800 MHz NMR database of Chenomx NMR Suite Version 8.6 (Edmonton, AB, Canada), and spiking experiments [25]. In addition, the Chenomx NMR Suite Version 8.6 software was used to quantify the metabolites in C. crenata. This program compares the concentration of a known reference signal (TSP) with signals derived from a library of compounds to determine the concentrations of individual metabolites [26].

2.5. Statistical Analysis

Partial least squares-discriminant analysis (PLS-DA) were performed with a unit variance scale using SIMCA-P+, version 16.0 (Umetrics, Umeå, Sweden). PLS-DA was performed to maximize the separation between samples. The PLS-DA was described as a regression extension of the principal component analysis (PCA) that provides the maximum covariance between the measured data (X) and the response variable (Y) [27]. R2 and Q2 values describe the quality of the models. R2 represents the goodness of fit and is defined as a proportion of the variance in the data described by the models. Q2 represents the predictability and is defined as the proportion of variance in the predictable data [27]. Also, to verify the significant differences in the quantified metabolites between more than two groups, the nonparametric Kruskal–Wallis test followed by Dunn’s post hoc test was performed using GraphPad Prism, version 5 (San Diego, CA, USA).

3. Results and Discussion

3.1. Metabolite Profiling of C. crenata by 1H NMR Spectroscopy

We analyzed the kernels of 17 C. crenata chestnut cultivars produced in Buyeo-gun or Gongju-si, Chungcheongnam-do, using 1H NMR spectroscopy to determine metabolite differences. To minimize the impact of the cultivation environment, we selected C. crenata chestnuts produced in Buyeo-gun or Gongju-si, which are geographically close and have similar environments, in the Chungcheongnam-do Province. Figure 1 shows representative 800 MHz 1H NMR spectra of Okkwang (KN and MRC), Ginyosi (JN and LRC), and Moriwase (JH, which crossbreeds easily, and ERC), which are three cultivars of the C. crenata chestnut. The most dominant part of each 1H NMR spectrum was in the carbohydrate region (3.2–5.4 ppm), whereas the aromatic regions (6.9–8.5 ppm) had very low intensities. The spectral resonances of metabolites were assigned according to the 800 MHz library from Chenomx NMR Suite (version 8.6), 2D TOCSY NMR spectra, and spiking experiments.
The analysis of the C. crenata chestnut kernel extracts by 1H NMR spectroscopy detected the essential primary metabolites. The chemical shifts of the identified metabolites are listed in Table 2. A total of 30 metabolites were quantified, including 15 amino acids (alanine, arginine, asparagine, aspartate, glutamate, glutamine, histidine, isoleucine, leucine, phenylalanine, threonine, trigonelline, tryptophan, tyrosine, and valine), six organic acids (citric acid, formic acid, fumaric acid, malic acid, malonic acid, and succinic acid), three sugars (fructose, glucose, and sucrose), and six other compounds (4-aminobutyrate, betaine, choline, ethanol, ethanolamine, and myo-inositol).

3.2. Metabolic Characterization Depending on C. crenata Chestnut Cultivar Origin

As most chestnut cultivars cultivated in Korea originated in Japan or Korea, differences in metabolites across the varieties were first examined according to their origin. Although the morphological characteristics of the Korean and Japanese varieties are similar, a previous study suggested that the Japanese C. crenata and the Korean C. crenata might have separate evolutionary histories, according to a phenogram constructed based on polymorphisms [11]. These genetic differences may affect their metabolite contents. We classified the C. crenata cultivars into four groups: KN, KH, JN, and JH. The average concentrations of all metabolites identified in C. crenata chestnut kernels for each group are presented in Table S1.
PLS-DA was performed on the concentrations of the identified metabolites to discriminate the four groups of C. crenata chestnuts, as shown in Figure 2. Good discrimination between Korean and Japanese cultivars was achieved according to the second component (PLS-2), which had a goodness of fit of R2Y = 0.516 and predictability of Q2 = 0.356 (Figure 2A). No significant differences were observed between the Korean cultivars categorized as KN and KH, but distinct differences were identified between the Japanese cultivars categorized as JN and JH. In particular, the JH group was distinct from the other three groups based on the first component (PLS-1) of the PLS-DA score plot, indicating that the JH group features different metabolic patterns from the other groups. Because the KH group displayed no significant difference from the KN group, and PLS-DA was performed for three groups, except the KH group, to detect more distinct metabolite patterns among the three groups. The PLS-DA score plot showed good separation among the three groups with a goodness of fit of R2Y = 0.609 and predictability of Q2 = 0.521 (Figure 2B). Unlike the other three groups, the JH group was hybridized with the Chinese chestnut (Castanea mollissima Blume) or the Pyongyang chestnut (Castanea bungeana Blume), which are different species from C. crenata. These results show that the cultivars in the JH group, which are produced by crossbreeding with other species, have a large difference in metabolite content compared with the other cultivars cultivated in Korea, and the origins of hybrid species could affect the metabolite levels in C. crenata chestnut kernels.
As a result of the univariate analysis for assessing the differences in metabolite levels among the groups, 19 of the 30 identified metabolites showed significant concentration differences between KN, JN, and JH, which is evident in the PLS-DA plots (Figure 3).
Of the 19 metabolites with significant differences, 13 were amino acids, which indicates that the amino acid profile is one of the main factors that can be used to determine the origins of C. crenata. Amino acids play an important role in cellular metabolism [28], and high levels of glutamic acid and aspartic acid in food influences taste and flavor [29]. The most abundant amino acids identified in C. crenata chestnut kernels were asparagine and glutamate, but most of the essential amino acids were present. In particular, the JH group was characterized as having reduced amino acid levels compared with the other two groups, except for trigonelline. The amino acids that showed significant differences between the KN and JN groups were glutamine, arginine, and aspartate, whereas the concentrations of other amino acids were similar between these two groups.
Sugars, including fructose, glucose, and sucrose, were identified in C. crenata chestnut kernels. The sugar composition alters the sensory characteristics of chestnuts by making them sweeter; therefore, the sugar profile represents a commercially important quality indicator [30,31]. Sugar variance has also been used for the inter-cultivar discrimination of chestnuts [32]. Sucrose was the most abundant compound among the metabolites identified in C. crenata chestnut kernels, with average concentrations between 38,943 and 42,280 µM in each group. This finding was similar to previous analyses reporting a high sucrose content in chestnuts [30] but no significant difference in sucrose concentrations was identified between the groups. The lowest fructose and glucose levels were detected in the JN group, which were significantly different from those in the KN group but not those in the JH group. Similar to our results, previous studies also reported the highest fructose contents for the Pyeonggi (KN group) and Riheiguri (JH group) cultivars [13]. Our results showed that fructose and glucose could be used as discriminatory factors to distinguish between the KN and JN groups.
Citric acid showed a significant difference in concentration between the KN and JH groups, and its concentration was the lowest in the JH group. Malic, citric, and ascorbic acids were the major organic acids found in the chestnut kernels, and some differences were observed among the organic acid compositions of the chestnut varieties [33]. The properties and levels of organic acids are key factors influencing the flavors of fruits and vegetables. In addition, organic acids can protect against various diseases because of their antioxidant activities [34].
Choline and betaine had significantly lower levels in the JH group compared with the JN group. Choline, which is abundant in plants, is an important nutrient that acts as a biosynthesis precursor of phospholipids and the neurotransmitter acetylcholine [35]. Betaine tends to accumulate in the cytoplasm and intercellular fluids, where it exerts protective functions on the structures of proteins, nucleic acids, and cell membranes, in response to abiotic plant stresses such as the reduced availability of water, high soil salinity, hypoxia, cold, and freezing [35].
The 4-aminobutyrate (GABA) level was the lowest in the KN group, and the difference was significant compared to the JH group. GABA can affect fruit storage or seed germination by changing the metabolism of nitrogen and carbon [36] and contributes to plant development and stress adaptation [37,38,39]. In addition, GABA modulates anion flux in plants through its role in signal transduction, which regulates plant physiology [40].

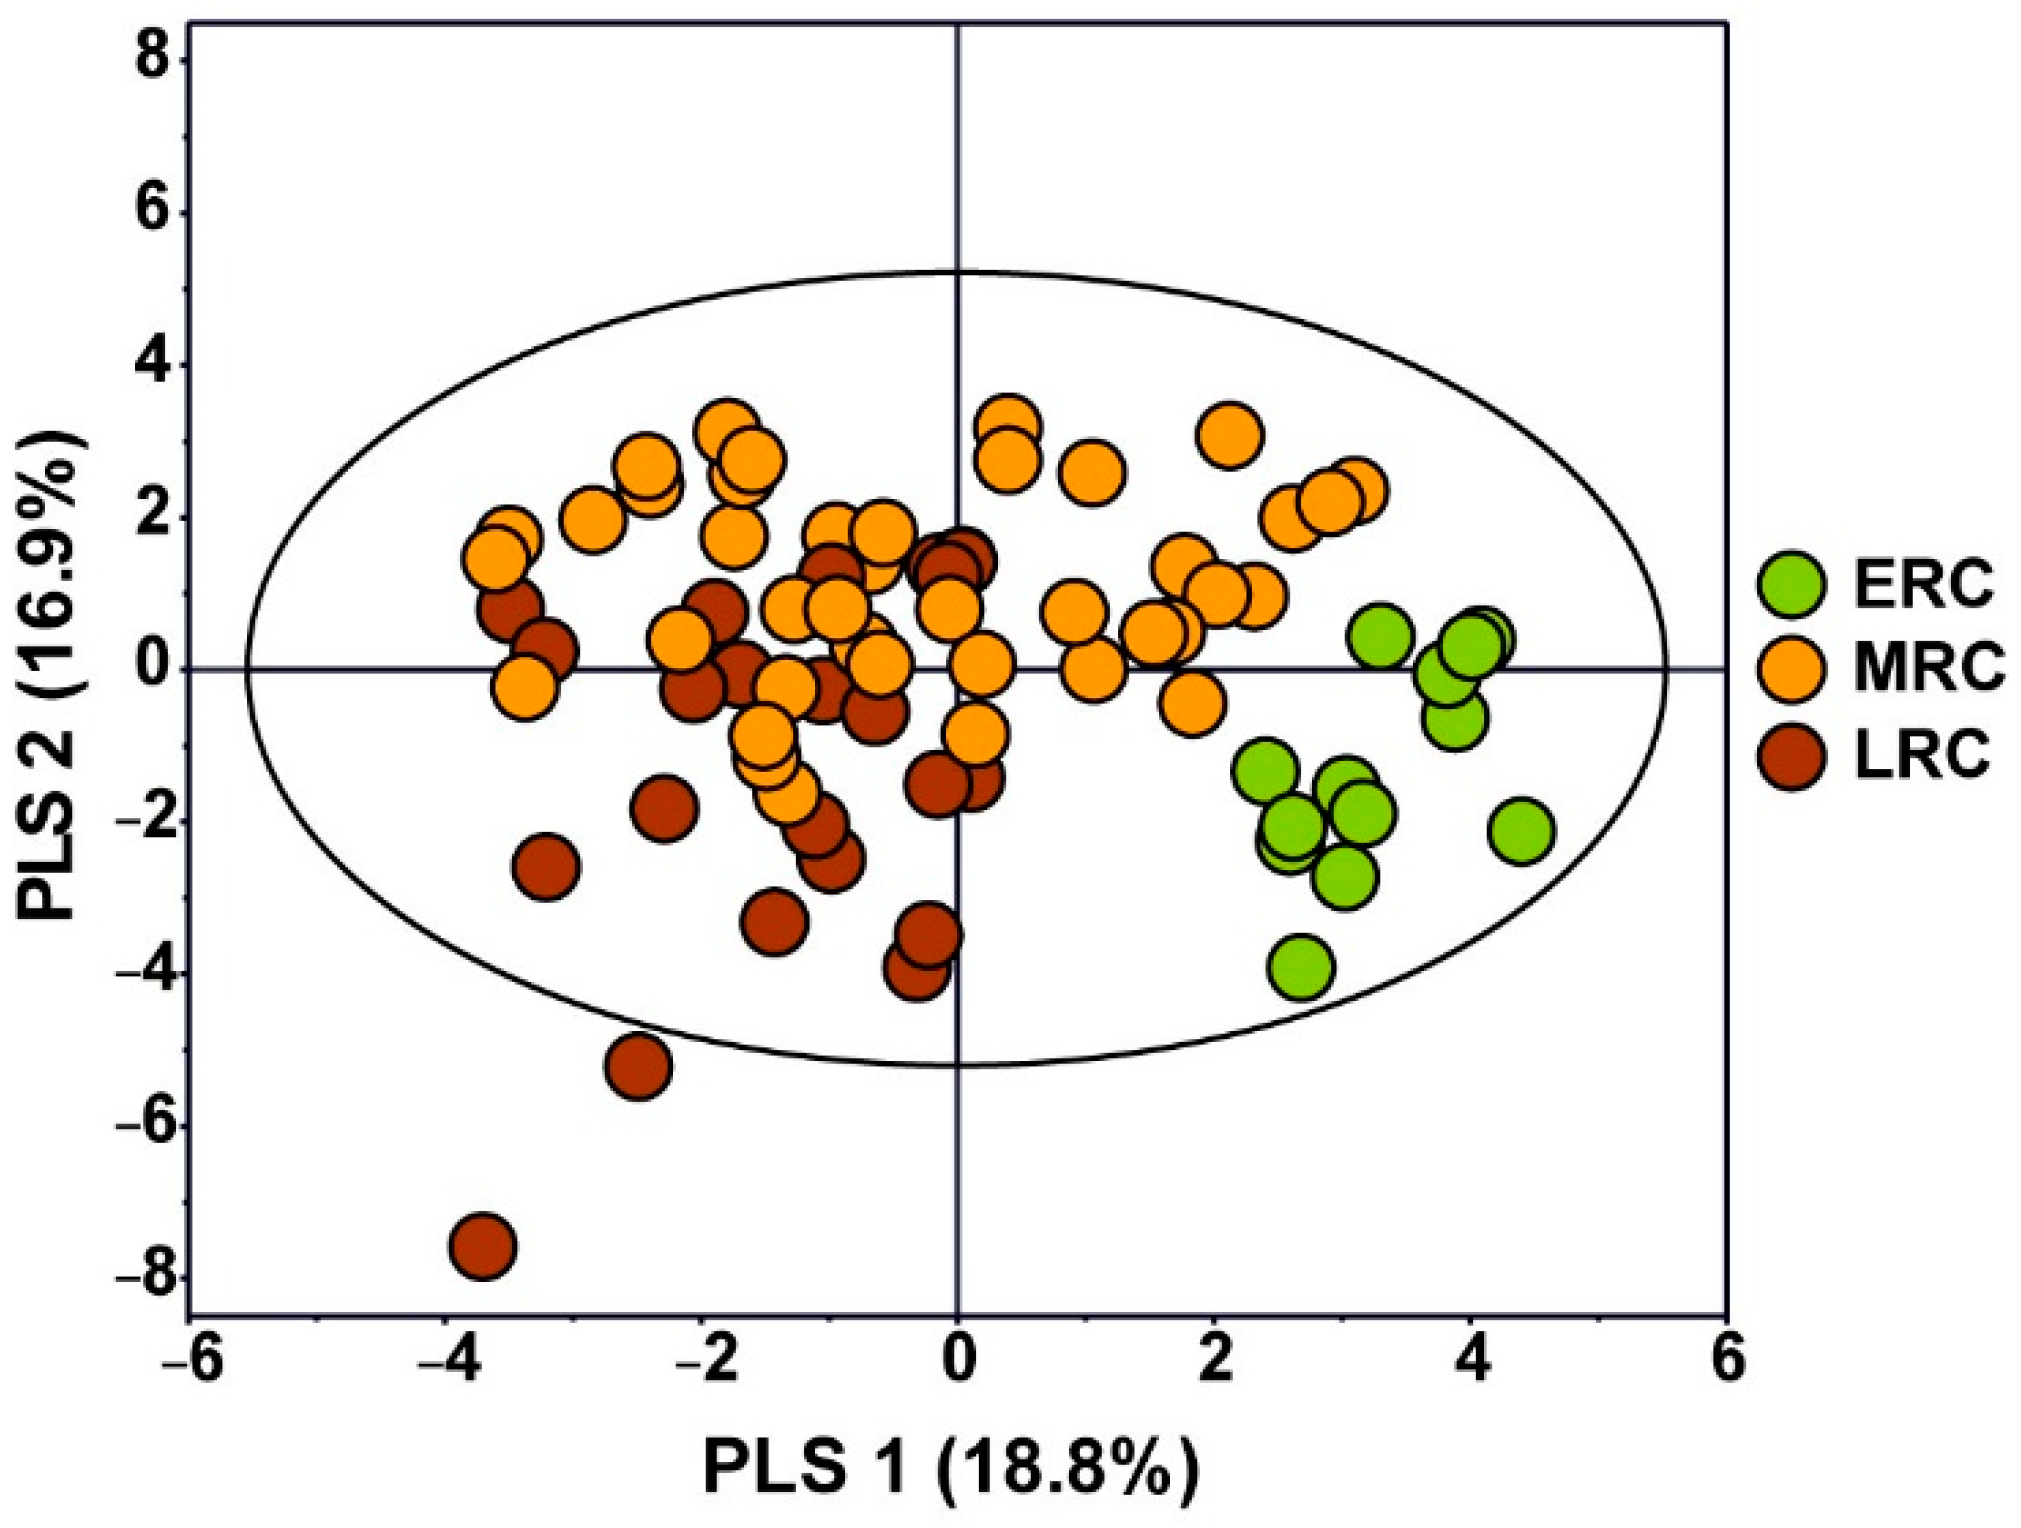
3.3. Metabolic Characterization Depending on Harvest Time of C. crenata Chestnut Cultivars

The chestnut varieties were divided into three types according to the optimal ripening time: ERC, MRC, and LRC. The optimal ripening time for ERCs ranges from the end of August to early September, the optimal ripening time for MRCs is mid-September, and the optimal ripening time for LRCs ranges from the end of September to early October. The optimal ripening time for each chestnut variety determines the harvest time, which affects metabolite concentrations. The average contents of all identified metabolites in C. crenata chestnut kernels for each group are shown in Table S2. In Figure 4, the PLS-DA score plot shows the separation among the three groups using three components and has R2Y and Q2 values of 0.417 and 0.324, respectively. In particular, the ERC group was the most strongly discriminated from the other groups using PLS-1. These results showed that the harvest time affects the concentrations of metabolites in C. crenata chestnut kernels.
A Kruskal–Wallis test with Dunn’s multiple comparison post hoc test was used to compare the three groups. Of the 30 metabolites quantified, 13 showed significant differences in levels between the ERC, MRC, and LRC groups (Figure 5). In particular, nine metabolites with significant differences between the three groups had the highest concentrations in the LRC group.
Of the 13 metabolites with significant differences, nine were amino acids, suggesting that the harvest time of C. crenata is one of the main factors affecting amino acid levels. A previous study has shown that the levels of free amino acids and sugars in peanuts decline after the early harvest time, plateau during the optimum harvest season, and increase during the late harvest time [41]. The analysis of free amino acids in the stems of Acanthopanax koreanum Nakai, harvested in May, July, and September, showed the highest concentrations in those harvested in September [42]. Our results showed that most amino acid levels were high in the LRC group, except those of trigonelline and aspartate.
Betaine, ethanol, GABA, and myo-inositol had significant differences in concentrations between the groups. The level of GABA was significantly higher in the LRC group than in the MRC group, and betaine and ethanol levels were significantly higher in the LRC group than in the ERC group. In contrast, the concentration of myo-inositol was higher in the ERC group than in the LRC group. Myo-inositol oxidizes to d-glucuronic acid and plays a role in the biogenesis of plant cell walls and related structures [43,44]. The isomerization and methylation of myo-inositol forms O-methyl inositol, which participates in stress-related responses and seed product storage [45,46,47,48,49].

4. Conclusions

In this study, we determined the metabolite profiles of various cultivars of C. crenata to investigate the effects of different origins and harvest times. Metabolite profiling using 1H NMR spectroscopy revealed that the levels of primary metabolites in various groups of C. crenata were significantly different according to their origin and harvest time. The KN, JN, and JH (origin) groups could be distinguished according to their metabolite profiles, especially JH, which was the most strongly separated group. The significantly different metabolites across the three groups (KN, JN, and JH) included 13 amino acids, two sugars, one organic acid, and three additional compounds. The significantly different metabolites across the three harvest time groups (ERC, MRC, and LRC) included nine amino acids and four other compounds. The concentrations of significantly different metabolites were higher in the LRC group, and myo-inositol was detected at high levels in the ERC group. In particular, significant differences in amino acid concentrations were observed, suggesting that the origin and harvest time of C. crenata affect the composition of amino acids. This is the first report to describe different metabolite compositions in C. crenata chestnut kernels with different origins and harvest times using 1H NMR spectral analysis. Since there have been few metabolomics studies on chestnut kernels before, this study provides information on the metabolites of chestnut kernels. Our results provide information regarding the differences in metabolite profiles associated with various C. crenata cultivars and can be used to improve the nutritional or metabolic benefits of C. crenata chestnut kernels. These results can help growers and consumers intentionally select chestnut cultivars that satisfy their nutritional and taste needs. This information could also be useful for breeding programs to develop superior C. crenata varieties. In addition, although we have only focused on metabolite differences between on cultivars, further study on the genetic and metabolite differences of chestnut cultivars together will provide good information for producing better chestnut cultivars.

Supplementary Materials

The following supporting information can be downloaded at: https://www.mdpi.com/article/10.3390/foods11091325/s1, Table S1: Metabolite concentrations quantified by 1H NMR in C. crenata according to geographical origin; Table S2: Metabolite concentrations quantified by 1H NMR in C. crenata according to harvest time.

Author Contributions

Conceptualization, M.-S.K.; Methodology, J.M.Y. and M.N.; Software, J.M.Y. and M.N.; Validation, J.M.Y. and M.N.; Formal Analysis, J.M.Y. and M.N.; Investigation, J.M.Y. and M.N.; Resources, M.-S.K.; Data Curation, M.-S.K.; Writing—Original Draft Preparation, J.M.Y. and M.N.; Writing—Review & Editing, M.-S.K.; Visualization, J.M.Y. and M.N.; Supervision, M.-S.K.; Project Administration, M.-S.K.; Funding Acquisition, M.-S.K. All authors have read and agreed to the published version of the manuscript.

Funding

This study was carried out with the support of ‘R&D Program for Forest Science Technology (Project No. 2020207A00-2222-BA01)’ provided by Korea Forest Service (Korea Forestry Promotion Institute).

Institutional Review Board Statement

Not applicable.

Informed Consent Statement

Not applicable.

Data Availability Statement

The data presented in this study are available within the manuscript and the Supplementary Materials.

Conflicts of Interest

The authors declare that there is no conflict of interest regarding the publication of this article.

References

  1. Chiocchio, I.; Prata, C.; Mandrone, M.; Ricciardiello, F.; Marrazzo, P.; Tomasi, P.; Angeloni, C.; Fiorentini, D.; Malaguti, M.; Poli, F. Leaves and spiny burs of Castanea Sativa from an experimental chestnut grove: Metabolomic analysis and anti-neuroinflammatory activity. Metabolites 2020, 10, 408. [Google Scholar] [CrossRef] [PubMed]
  2. Tsurunaga, Y.; Takahashi, T. Evaluation of the Antioxidant Activity, Deodorizing Effect, and Antibacterial Activity of ‘Porotan’Chestnut By-Products and Establishment of a Compound Paper. Foods 2021, 10, 1141. [Google Scholar] [CrossRef] [PubMed]
  3. Silva, D.; Zambon, C.; Techio, V.; Pio, R. Floral characterization and pollen germination protocol for Castanea crenata Siebold & Zucc. S. Afr. J. Bot. 2020, 130, 389–395. [Google Scholar]
  4. Kang, M.-J.; Shin, A.-Y.; Shin, Y.; Lee, S.-A.; Lee, H.-R.; Kim, T.-D.; Choi, M.; Koo, N.; Kim, Y.-M.; Kyeong, D. Identification of transcriptome-wide, nut weight-associated SNPs in Castanea crenata. Sci. Rep. 2019, 9, 13161. [Google Scholar] [CrossRef] [Green Version]
  5. Korea Statistical Information Service. Available online: http://kosis.kr (accessed on 14 March 2022).
  6. Youn, U.-Y.; Shon, M.-S.; Kim, G.-N.; Katagiri, R.; Harata, K.; Ishida, Y.; Lee, S.-C. Antioxidant and anti-adipogenic activities of chestnut (Castanea crenata) byproducts. Food Sci. Biotechnol. 2016, 25, 1169–1174. [Google Scholar] [CrossRef] [PubMed]
  7. Pereira-Lorenzo, S.; Ramos-Cabrer, A.M.; Díaz-Hernández, M.; Ciordia-Ara, M.; Ríos-Mesa, D. Chemical composition of chestnut cultivars from Spain. Sci. Hortic. 2006, 107, 306–314. [Google Scholar] [CrossRef] [Green Version]
  8. Tuyen, P.T.; Xuan, T.D.; Khang, D.T.; Ahmad, A.; Quan, N.V.; Tu Anh, T.T.; Anh, L.H.; Minh, T.N. Phenolic compositions and antioxidant properties in bark, flower, inner skin, kernel and leaf extracts of Castanea crenata Sieb. et Zucc. Antioxidants 2017, 6, 31. [Google Scholar] [CrossRef] [Green Version]
  9. Noh, J.-R.; Gang, G.-T.; Kim, Y.-H.; Yang, K.-J.; Hwang, J.-H.; Lee, H.-S.; Oh, W.-K.; Song, K.-S.; Lee, C.-H. Antioxidant effects of the chestnut (Castanea crenata) inner shell extract in t-BHP-treated HepG2 cells, and CCl4-and high-fat diet-treated mice. Food Chem. Toxicol. 2010, 48, 3177–3183. [Google Scholar] [CrossRef]
  10. Kim, M.; Lee, U.; Kim, S.; Hwang, M.; Lee, M. Comparison of nut characteristics between Korean native chestnut accessions and prevailing cultivars cultivated in Korea. In Proceedings of the III International Chestnut Congress 693, Chaves, Portugal, 20–23 October 2004; pp. 299–304. [Google Scholar]
  11. Yamamoto, T.; Shimada, T.; Kotobuki, K.; Morimoto, Y.; Yoshida, M. Genetic characterization of Asian chestnut varieties assessed by AFLP. Jpn. J. Breed. 1998, 48, 359–363. [Google Scholar] [CrossRef] [Green Version]
  12. Yamamoto, T.; Tanaka, T.; Kotobuki, K.; Matsuta, N.; Suzuki, M.; Hayashi, T. Characterization of simple sequence repeats in Japanese chestnut. J. Hortic. Sci. Biotechnol. 2003, 78, 197–203. [Google Scholar] [CrossRef]
  13. Seo, D.-J.; Chung, M.-J.; Kim, D.-J.; You, J.-K.; Choe, M. Nutritional constituent analysis of Korean chestnuts. J. Korean Soc. Food Sci. Nutr. 2009, 38, 166–176. [Google Scholar] [CrossRef]
  14. Jeong, H.-R.; Jo, Y.-N.; Jeong, J.-H.; Jin, D.-E.; Song, B.-G.; Jin, Y.-R.; Kim, M.-J.; Lee, U.; Heo, H.-J. Change in the chemical composition of chestnuts (Castanea crenata) from different periods. Korean J. Food Sci. Technol. 2012, 44, 393–400. [Google Scholar] [CrossRef] [Green Version]
  15. Hall, R.D. Plant metabolomics: From holistic hope, to hype, to hot topic. New Phytol. 2006, 169, 453–468. [Google Scholar] [CrossRef]
  16. Hall, R.D. Food metabolomics: META-PHOR. A new European research initiative. Agro FOOD Industry Hi Tech 2007, 18, 14. [Google Scholar]
  17. Son, H.-S.; Hwang, G.-S.; Kim, K.M.; Ahn, H.-J.; Park, W.-M.; Van Den Berg, F.; Hong, Y.-S.; Lee, C.-H. Metabolomic studies on geographical grapes and their wines using 1H NMR analysis coupled with multivariate statistics. J. Agric. Food Chem. 2009, 57, 1481–1490. [Google Scholar] [CrossRef]
  18. Porzel, A.; Farag, M.A.; Mülbradt, J.; Wessjohann, L.A. Metabolite profiling and fingerprinting of Hypericum species: A comparison of MS and NMR metabolomics. Metabolomics 2014, 10, 574–588. [Google Scholar] [CrossRef]
  19. Dixon, R.A.; Gang, D.R.; Charlton, A.J.; Fiehn, O.; Kuiper, H.A.; Reynolds, T.L.; Tjeerdema, R.S.; Jeffery, E.H.; German, J.B.; Ridley, W.P. Applications of metabolomics in agriculture. J. Agric. Food Chem. 2006, 54, 8984–8994. [Google Scholar] [CrossRef] [PubMed]
  20. Calò, F.; Girelli, C.R.; Wang, S.C.; Fanizzi, F.P. Geographical Origin Assessment of Extra Virgin Olive Oil via NMR and MS Combined with Chemometrics as Analytical Approaches. Foods 2022, 11, 113. [Google Scholar] [CrossRef] [PubMed]
  21. Hama, J.R.; Fitzsimmons-Thoss, V. Determination of Unsaturated Fatty Acids Composition in Walnut (Juglans regia L.) Oil Using NMR Spectroscopy. Food Anal. Methods 2022, 1–11. [Google Scholar] [CrossRef]
  22. Cacciola, N.A.; Cerrato, A.; Capriotti, A.L.; Cavaliere, C.; D’Apolito, M.; Montone, C.M.; Piovesana, S.; Squillaci, G.; Peluso, G.; Laganà, A. Untargeted characterization of chestnut (Castanea sativa Mill.) shell polyphenol extract: A valued bioresource for prostate cancer cell growth inhibition. Molecules 2020, 25, 2730. [Google Scholar] [CrossRef]
  23. Cerulli, A.; Napolitano, A.; Masullo, M.; Hošek, J.; Pizza, C.; Piacente, S. Chestnut shells (Italian cultivar “Marrone di Roccadaspide” PGI): Antioxidant activity and chemical investigation with in depth LC-HRMS/MSn rationalization of tannins. Food Res. Int. 2020, 129, 108787. [Google Scholar] [CrossRef] [PubMed]
  24. Jung, Y.; Lee, J.; Kim, H.K.; Moon, B.C.; Ji, Y.; Hwang, G.-S. Metabolite profiling of Curcuma species grown in different regions using 1 H NMR spectroscopy and multivariate analysis. Analyst 2012, 137, 5597–5606. [Google Scholar] [CrossRef]
  25. Lee, M.Y.; Moon, B.C.; Kwon, Y.K.; Jung, Y.; Oh, T.K.; Hwang, G.S. Discrimination of Polygonatum species and identification of novel markers using 1H NMR-and UPLC/Q-TOF MS-based metabolite profiling. J. Sci. Food Agric. 2016, 96, 3846–3852. [Google Scholar] [CrossRef]
  26. Jung, Y.; Ha, M.; Lee, J.; Ahn, Y.G.; Kwak, J.H.; Ryu, D.H.; Hwang, G.-S. Metabolite profiling of the response of burdock roots to copper stress. J. Agric. Food Chem. 2015, 63, 1309–1317. [Google Scholar] [CrossRef]
  27. Worley, B.; Powers, R. Multivariate analysis in metabolomics. Curr. Metab. 2013, 1, 92–107. [Google Scholar]
  28. Mattila, P.; Salo-Väänänen, P.; Könkö, K.; Aro, H.; Jalava, T. Basic composition and amino acid contents of mushrooms cultivated in Finland. J. Agric. Food Chem. 2002, 50, 6419–6422. [Google Scholar] [CrossRef] [PubMed]
  29. Phat, C.; Moon, B.; Lee, C. Evaluation of umami taste in mushroom extracts by chemical analysis, sensory evaluation, and an electronic tongue system. Food Chem. 2016, 192, 1068–1077. [Google Scholar] [CrossRef]
  30. De Vasconcelos, M.d.C.B.; Nunes, F.; Viguera, C.G.; Bennett, R.N.; Rosa, E.A.; Ferreira-Cardoso, J.V. Industrial processing effects on chestnut fruits (Castanea sativa Mill.) 3. Minerals, free sugars, carotenoids and antioxidant vitamins. Int. J. Food Sci. Technol. 2010, 45, 496–505. [Google Scholar] [CrossRef]
  31. Fernandes, Â.; Antonio, A.L.; Barros, L.; Barreira, J.C.; Bento, A.; Botelho, M.L.; Ferreira, I.C. Low dose γ-irradiation as a suitable solution for chestnut (Castanea sativa Miller) conservation: Effects on sugars, fatty acids, and tocopherols. J. Agric. Food Chem. 2011, 59, 10028–10033. [Google Scholar] [CrossRef]
  32. Barreira, J.; Pereira, J.A.; Oliveira, M.; Ferreira, I.C. Sugars profiles of different chestnut (Castanea sativa Mill.) and almond (Prunus dulcis) cultivars by HPLC-RI. Plant Foods Hum. Nutr. 2010, 65, 38–43. [Google Scholar] [CrossRef]
  33. Suárez, M.H.; Galdón, B.R.; Mesa, D.R.; Romero, C.D.; Rodríguez, E.R. Sugars, organic acids and total phenols in varieties of chestnut fruits from Tenerife (Spain). Food Nutr. Sci. 2012, 3, 705–715. [Google Scholar] [CrossRef] [Green Version]
  34. Ribeiro, B.; Rangel, J.; Valentão, P.c.; Andrade, P.B.; Pereira, J.A.; Bölke, H.; Seabra, R.M. Organic acids in two Portuguese chestnut (Castanea sativa Miller) varieties. Food Chem. 2007, 100, 504–508. [Google Scholar] [CrossRef]
  35. Servillo, L.; Giovane, A.; Casale, R.; Balestrieri, M.L.; Cautela, D.; Paolucci, M.; Siano, F.; Volpe, M.G.; Castaldo, D. Betaines and related ammonium compounds in chestnut (Castanea sativa Mill.). Food Chem. 2016, 196, 1301–1309. [Google Scholar] [CrossRef]
  36. Du, C.; Chen, W.; Wu, Y.; Wang, G.; Zhao, J.; Sun, J.; Ji, J.; Yan, D.; Jiang, Z.; Shi, S. Effects of GABA and vigabatrin on the germination of Chinese chestnut recalcitrant seeds and its implications for seed dormancy and storage. Plants 2020, 9, 449. [Google Scholar] [CrossRef] [PubMed] [Green Version]
  37. Bouche, N.; Fromm, H. GABA in plants: Just a metabolite? Trends Plant Sci. 2004, 9, 110–115. [Google Scholar] [CrossRef]
  38. Kinnersley, A.M.; Turano, F.J. Gamma aminobutyric acid (GABA) and plant responses to stress. Crit. Rev. Plant Sci. 2000, 19, 479–509. [Google Scholar] [CrossRef]
  39. Bouché, N.; Lacombe, B.t.; Fromm, H. GABA signaling: A conserved and ubiquitous mechanism. Trends Cell Biol. 2003, 13, 607–610. [Google Scholar] [CrossRef]
  40. Ramesh, S.A.; Tyerman, S.D.; Gilliham, M.; Xu, B. γ-Aminobutyric acid (GABA) signalling in plants. Cell. Mol. Life Sci. 2017, 74, 1577–1603. [Google Scholar] [CrossRef]
  41. Oupadissakoon, C.; Young, C.T.; Giesbrecht, F.G.; Perry, A. Effect of location and time of harvest on free amino acid and free sugar contents of Florigiant peanuts. Peanut Sci. 1980, 7, 61–67. [Google Scholar] [CrossRef]
  42. Jwa, C.-S.; Yang, Y.-T.; Koh, J.-S. Changes in free sugars, organic acids, free amino acids and minerals by harvest time and parts of Acanthopanax koreanum. Appl. Biol. Chem. 2000, 43, 106–109. [Google Scholar]
  43. Loewus, F.A.; Loewus, M.W. Myo-inositol: Its biosynthesis and metabolism. Annu. Rev. Plant Physiol. 1983, 34, 137–161. [Google Scholar] [CrossRef]
  44. Loewus, F. Biogenesis of Plant Cell Wall Polysaccharides; Elsevier: Amsterdam, The Netherlands, 2012. [Google Scholar]
  45. Horbowicz, M.; Obendorf, R.L. Seed desiccation tolerance and storability: Dependence on flatulence-producing oligosaccharides and cyclitols—Review and survey. Seed Sci. Res. 1994, 4, 385–405. [Google Scholar] [CrossRef]
  46. Bohnert, H.J.; Jensen, R.G. Strategies for engineering water-stress tolerance in plants. Trends Biotechnol. 1996, 14, 89–97. [Google Scholar] [CrossRef]
  47. Obendorf, R.L. Oligosaccharides and galactosyl cyclitols in seed desiccation tolerance. Seed Sci. Res. 1997, 7, 63–74. [Google Scholar] [CrossRef]
  48. Peterbauer, T.; Puschenreiter, M.; Richter, A. Metabolism of galactosylononitol in seeds of Vigna umbellata. Plant Cell Physiol. 1998, 39, 334–341. [Google Scholar] [CrossRef] [Green Version]
  49. Peterbauer, T.; Richter, A. Galactosylononitol and stachyose synthesis in seeds of adzuki bean: Purification and characterization of stachyose synthase. Plant Physiol. 1998, 117, 165–172. [Google Scholar] [CrossRef] [PubMed] [Green Version]
Figure 1. 800 MHz 1H NMR spectra of pulp of Castanea crenata harvested in Chungcheongnam-do. (A) Okkwang (Korean native and mid-ripening cultivar), (B) Ginyosi (Japanese native and late-ripening cultivar), (C) Moriwase (Japan hybrid which crossbreeds with other origins and early-ripening cultivar).(1, alanine; 2, arginine; 3, asparagine; 4, aspartate; 5, glutamate; 6, glutamine; 7, histidine; 8, isoleucine; 9, leucine; 10, phenylalanine; 11, threonine; 12, trigonelline; 13, tryptophan; 14, tyrosine; 15, valine; 16, citric acid; 17, formic acid; 18, fumaric acid; 19, malic acid; 20, malonic acid; 21, succinic acid; 22, fructose; 23, glucose; 24, sucrose; 25, 4-aminobutyrate; 26, betaine; 27, choline; 28, ethanol; 29, ethanolamine; 30, myo-inositol).
Foods 11 01325 g001
Figure 2. (A) PLS-DA score plot (R2X = 0.441, R2Y = 0.516, Q2 = 0.356) of quantified metabolites in KN, JN, KH, and JH C. crenata chestnut show the pattern in which KH is included in KN. (B) PLS-DA score plot (R2X = 0.339, R2Y = 0.609, Q2 = 0.521) of quantified metabolites shows the separation among KN, JN, and JH C. crenata chestnut. Letters on the legend represent: KN, Korean native or crossbred between Korean native; KH, Korean hybrid which crossbreeds with other origins; JN, Japanese native or crossbred between Japanese native; JH, Japanese hybrid which crossbreeds with other origins.
Foods 11 01325 g002
Figure 3. Quantification of metabolites in KN, JN, and JH of C. crenata chestnut. Kruskal–Wallis tests yielded significant differences determined by Dunn’s multiple comparison post hoc tests using GraphPad Prism 5.0. Significant differences in Kruskal–Wallis tests are represented as # p < 0.05, ## p < 0.01, and ### p < 0.001 and by Dunn’s multiple comparison post hoc tests are represented as * p < 0.05, ** p < 0.01, and *** p < 0.001. Error bars indicate means ± standard deviation. Letters on the horizontal axis represent: KN, Korean native or crossbred between Korean native; KH, Korean hybrid which crossbreeds with other origins; JN, Japanese native or crossbred between Japanese native; JH, Japanese hybrid which crossbreeds with other origins.
Foods 11 01325 g003
Figure 4. PLS-DA score plot (R2X = 0.357, R2Y = 0.417, Q2 = 0.324) of quantified metabolites in ERC, MRC, and LRC of C. crenata chestnut. Letters on the legend represent: ERC, early-ripening cultivar; MRC, mid-ripening cultivar; LRC, late-ripening cultivar.
Foods 11 01325 g004
Figure 5. Levels of metabolites in early-ripening cultivars, mid-ripening cultivars and late-ripening cultivars of C. crenata chestnut. Kruskal–Wallis tests yielded significant differences determined by Dunn’s multiple comparison post hoc tests using GraphPad Prism 5.0. Significant differences by Kruskal–Wallis tests are represented as # p < 0.05, ## p < 0.01, and ### p < 0.001, and by Dunn’s multiple comparison post hoc tests are represented as * p < 0.05, ** p < 0.01, and *** p < 0.001. Error bars indicate means ± standard deviation. Letters on the horizontal axis represent: ERC, early-ripening cultivar; MRC, mid-ripening cultivar; LRC, late-ripening cultivar.
Foods 11 01325 g005
Table 1. Sample list of Castanea crenata chestnut used in this study.
RegionNumber of SamplesCultivar NameOriginCrossbreedingOrigin GroupHarvest Time
Chungchengnam-do
(latitude 36° N,
Longitude 127° E)
5OkkwangKoreacrenata aKNMid ripening
5JahongKoreacrenata aKNMid ripening
5MipungKoreacrenata aKNLate ripening
5JuokKoreacrenata hybrid
(Gwangjujoyul a × Okkwang a)
KNMid ripening
3PyeonggiKoreacrenata hybrid
(Riheiguri × Ginyosi b)
KHMid ripening
4DaeboKoreacrenata hybrid
(Sangmyeon 1 a × Riheiguri)
KHMid ripening
4IdeaKoreacrenata hybrid
(Ibuki × Sandae a)
KHLate ripening
5OtanbaJapancrenata bJNMid ripening
5GinyosiJapancrenata bJNLate ripening
5TanzawaJapancrenata hybrid
(Otomune b × Taishouwase b)
JNEarly ripening
5TsukubaJapancrenata hybrid
(Ganne b × Hayadama b)
JNMid ripening
4IshizuuchiJapancrenata hybrid
(Ganne b × Kasaharawase b)
JNLate ripening
5PorotanJapan(crenata × bungeana) × crenata hybrid (550-40 × Tanzawa b)JHEarly ripening
3MoriwaseJapancrenata × bungeana hybrid
(Pyungyangyul × Toyotamawase b)
JHEarly ripening
4RiheiguriJapancrenata × mollissima hybridJHMid ripening
4Hyogo57Japancrenata × mollissima hybridJHMid ripening
5Banseki cJapan--Late ripening
a The origin of cultivars was Korea only. b The origin of cultivars was Japan only. c Since there was no information on crossbreeding, the Banseki cultivar was excluded from the groups classified according to origin.
Table 2. Metabolites and 1H chemical shifts identified by 800 MHz 1H NMR a.
No.Metabolites1H Chemical Shifts bFormula
Amino acids
1Alanine1.5 (d), 3.8 (q)C3H7NO2
2Arginine1.7 (m), 1.9 (m), 3.2 (t), 3.8 (t)C6H14N4O2
3Asparagine2.8 (q), 2.9 (dd), 3.9 (q), 6.9 (s)C4H8N2O3
4Aspartate2.6 (q), 2.8 (dd), 3.8 (dd)C4H7NO4
5Glutamate2.0 (m), 2.1 (m), 2.4 (m), 3.8 (q)C5H9NO4
6Glutamine2.44 (m), 2.12 (m)C5H10N2O3
7Histidine3.2 (m), 4.0 (t), 7.1 (s), 7.9 (s)C6H9N3O2
8Isoleucine0.9 (t), 1.0 (d), 1.2 (m), 1.5 (m), 2.0 (m), 3.7 (d)C6H13NO2
9Leucine0.9(d), 1.0 (d), 1.7 (m), 1.7 (m), 1.7 (m), 3.7 (q)C6H13NO2
10Phenylalanine3.1 (q), 3.3 (q), 4.0 (q), 7.3 (d), 7.4 (m)C9H11NO2
11Threonine1.3 (d), 3.6 (d), 4.3 (q)C4H9NO3
12Trigonelline8.0 (t), 8.8 (dd), 9.1 (s)C7H7NO2
13Tryptophan7.1 (t), 7.2 (t), 7.3 (s), 7.5 (d), 7.7 (d)C11H12N2O2
14Tyrosine3.1 (q), 3.2 (q), 3.9 (q), 6.8 (d), 7.2 (d)C9H11NO3
15Valine1.0 (d), 2.3 (m), 3.6 (d)C5H11NO2
Organic acids
16Citric acid2.5 (d), 2.7 (d)C6H8O7;
17Formic acid8.4 (s)CH2O2
18Fumaric acid6.5 (s)C4H4O4
19Malic acid2.4 (q), 2.7 (dd), 4.3 (d)C4H6O5
20Malonic acid3.1 (s)C3H4O4
21Succinic acid2.3 (s)C4H6O4
Sugars
22Fructose3.5–4.1 (m)C6H12O6
23Glucose3.2 (q), 3.4 (m), 3.5 (q), 3.7 (m), 4.6 (d), 5.2 (d)C6H12O6
24Sucrose3.4 (t), 3.5 (dd), 3.6 (dd), 3.7 (t), 3.8 (m), 4.0 (t), 4.2 (d), 5.4 (d)C12H22O11
Others
254-Aminobutyrate1.9 (m), 2.3 (t), 3.0 (t)C4H9NO2
26Betaine3.3 (s), 3.9 (s)(CH3)3N+
CH2COO
27Choline3.2 (s), 3.5 (m), 4.0 (m)C5H14NO
28Ethanol1.18 (t), 3.6 (q)C2H5OH
29Ethanolamine3.1 (t), 3.8 (t)C2H7NO
30Myo-inositol3.2 (t), 3.5 (dd), 3.6 (t), 4.0 (t)C6H12O6
a The chemical shifts were determined at pH 7.0 and expressed as relative values to those of TSP at 0 ppm. b Letters in parentheses indicate the peak multiplicities: s, singlet; d, doublet; t, triplet; dd, doublet of doublet; tt, triplet of triplet; q, quartet; and m, multiplet.
Publisher’s Note: MDPI stays neutral with regard to jurisdictional claims in published maps and institutional affiliations.

