
Determination of Five Phthalate Esters in Tea and Their Dynamic Characteristics during Black Tea Processing


Abstract
:
1. Introduction
2. Materials and Methods
2.1. Reagents and Standards for PAEs
2.2. Tea Sampling
2.3. Construction of Standard Curves of PAEs
2.4. Extraction of PAEs in Tea
2.5. Optimization of PAE Extractions in Tea Using Response Surface Methodology
2.6. GC–MS Analysis
2.7. Method Validation
2.8. Statistical Data Analysis
3. Results
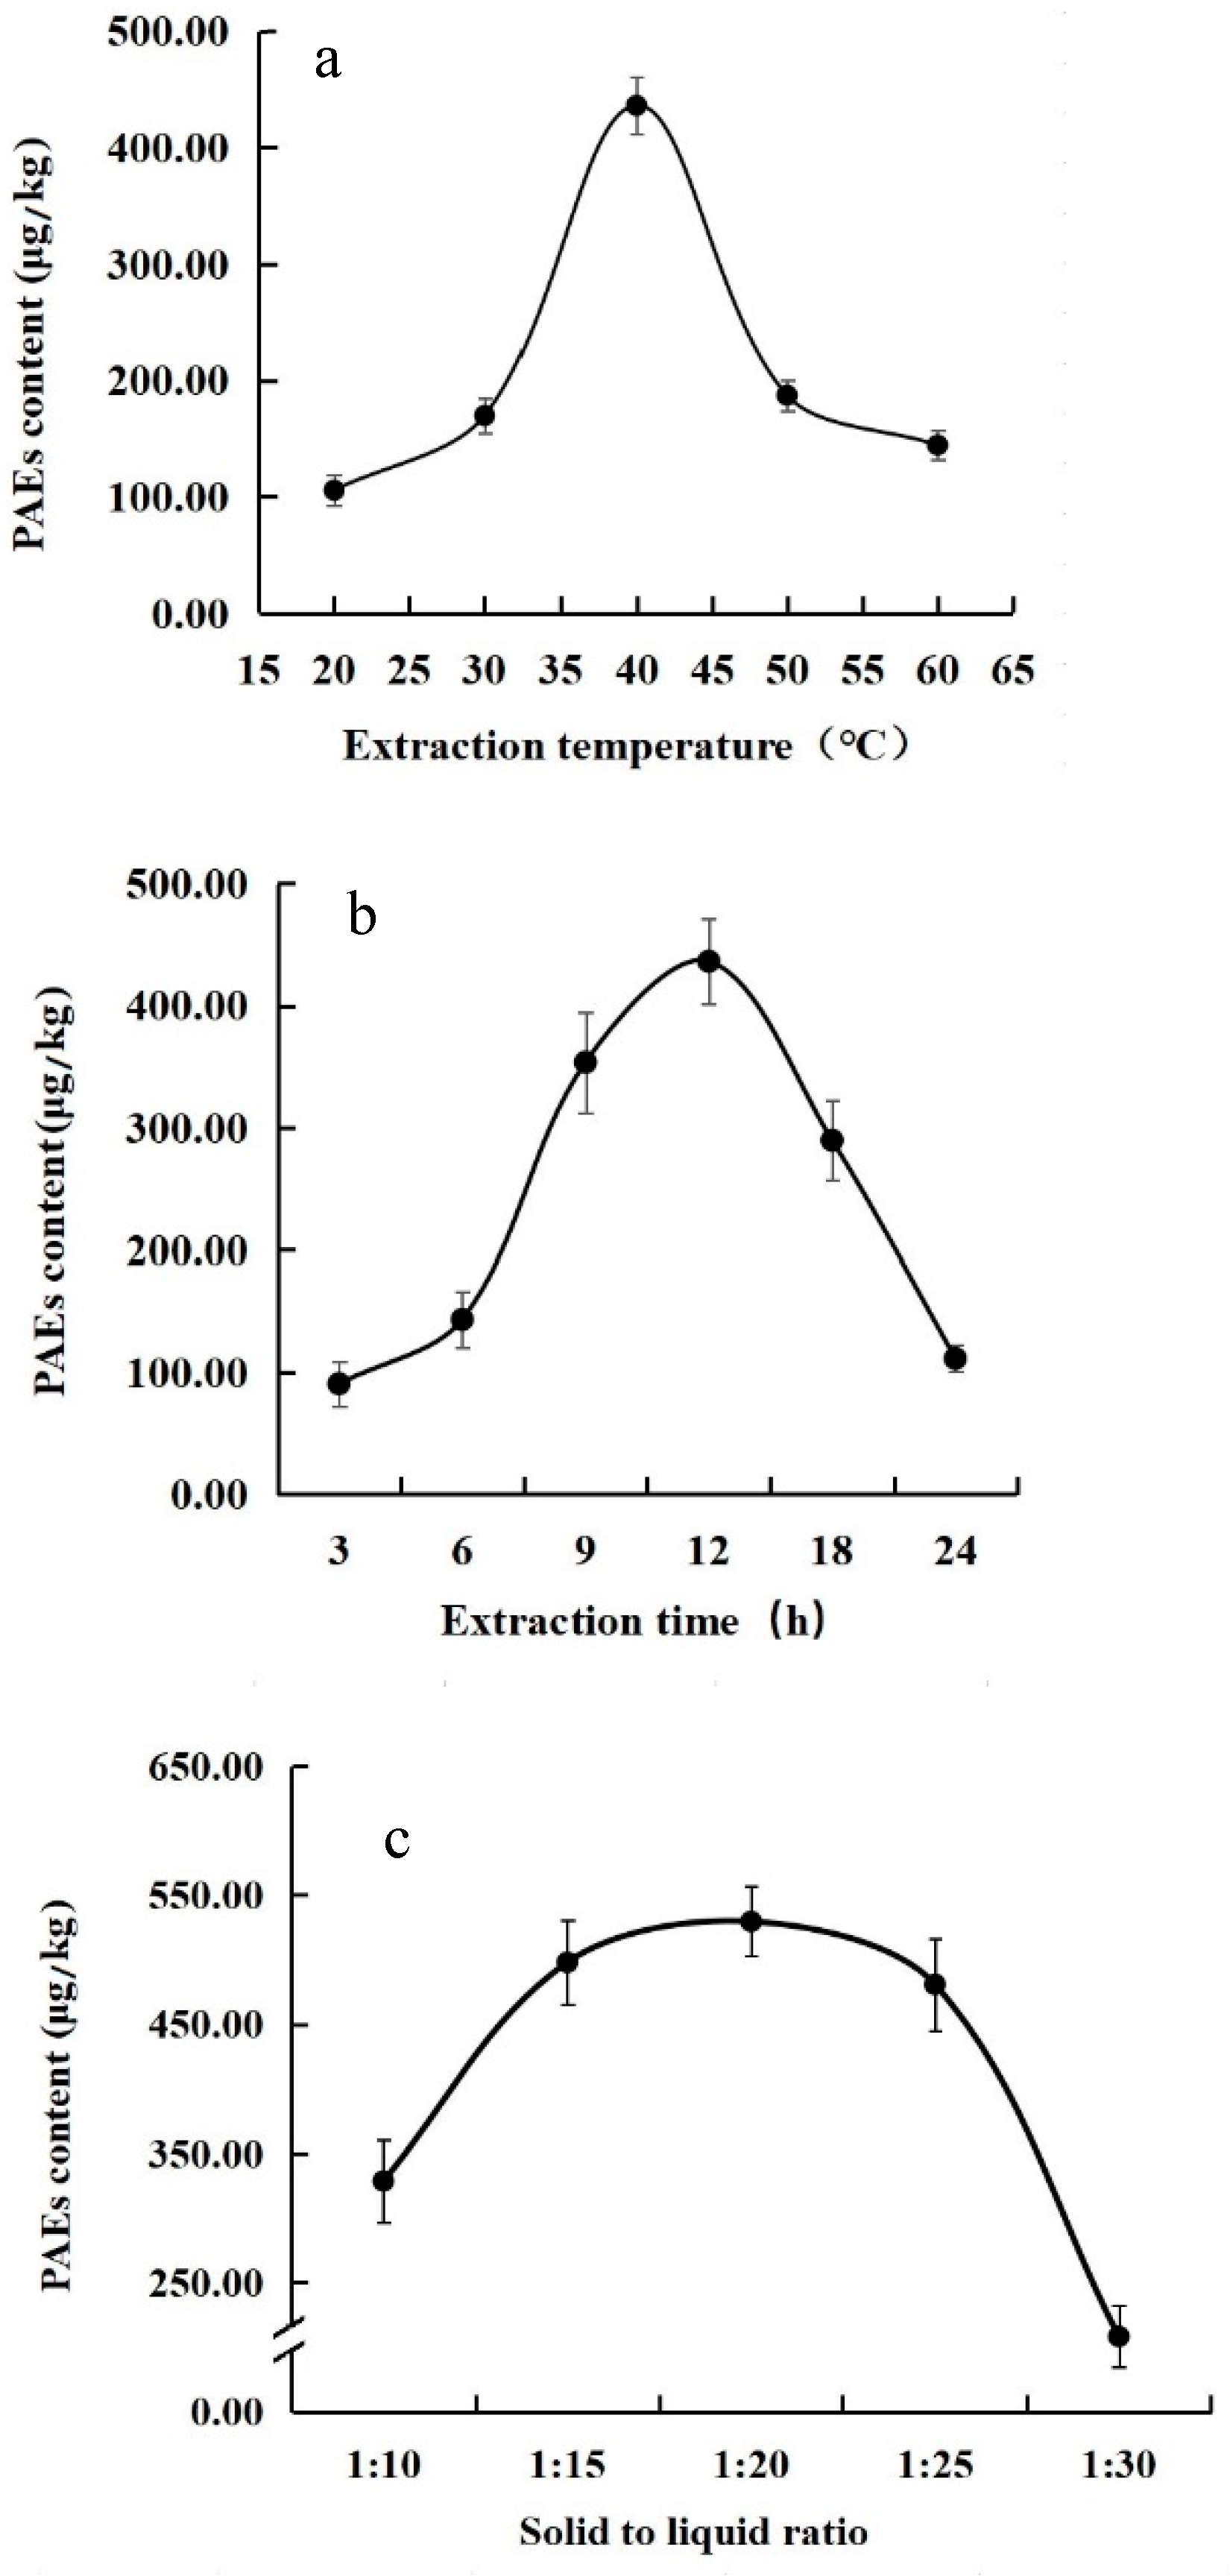
3.1. Effects of Single Factors on Extraction of PAEs from Tea
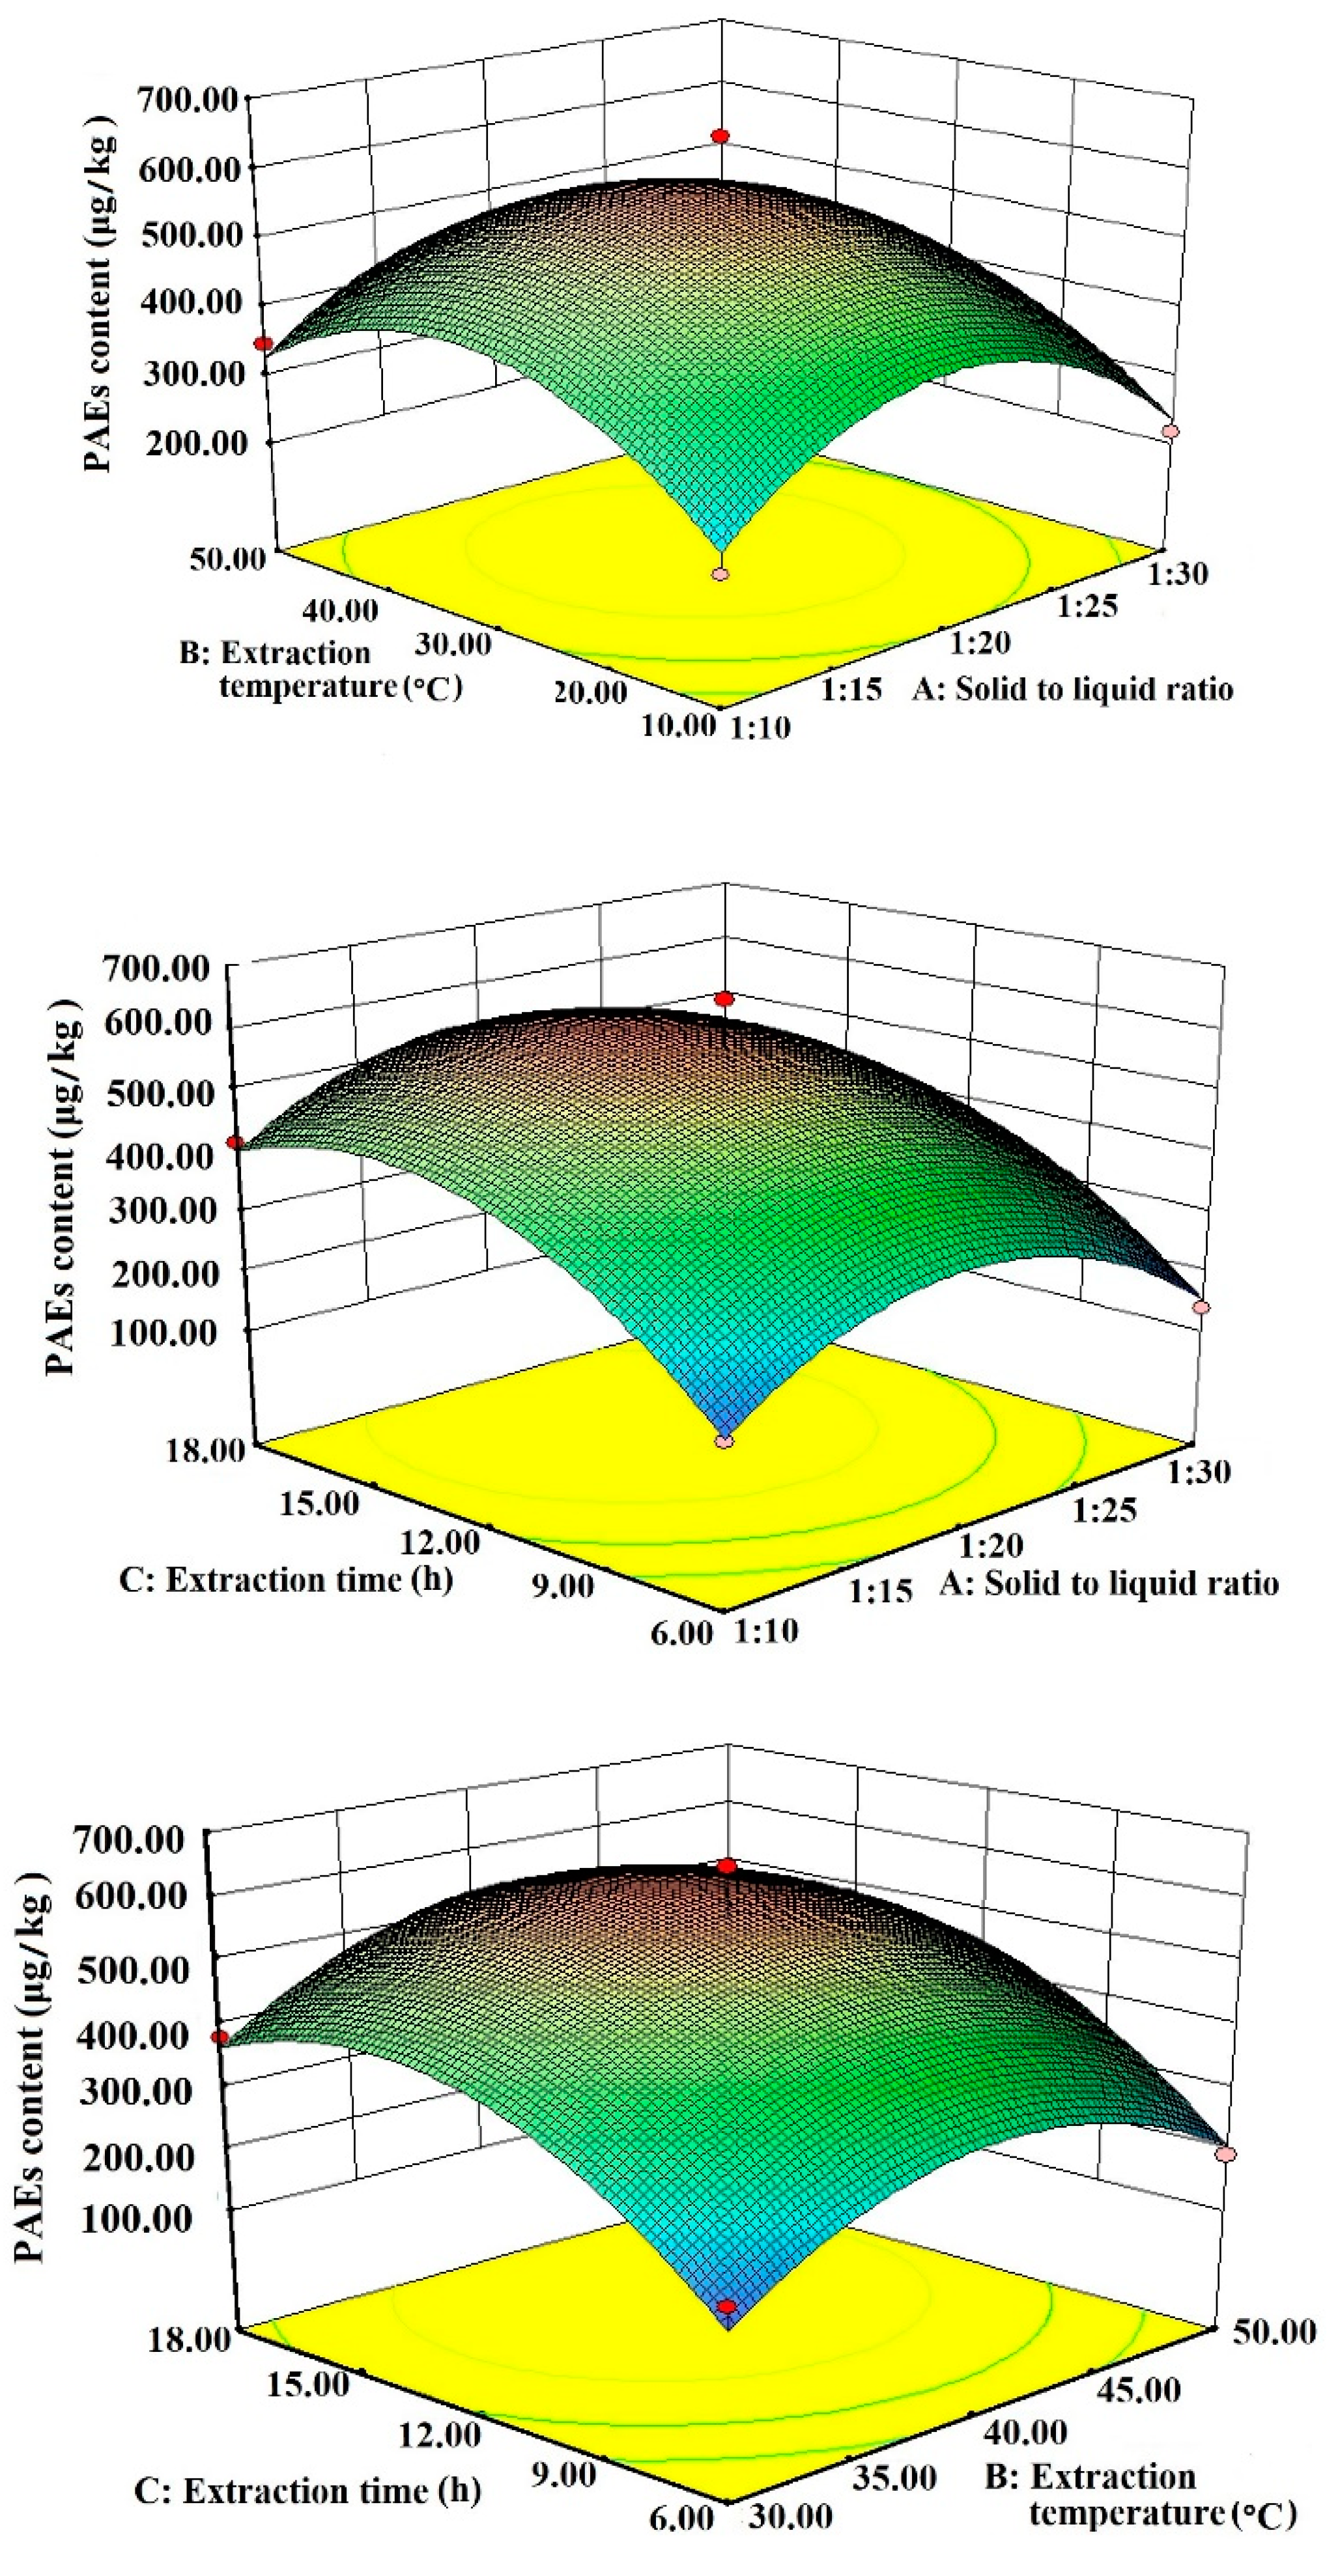
3.2. Response Surface Optimization Experiment
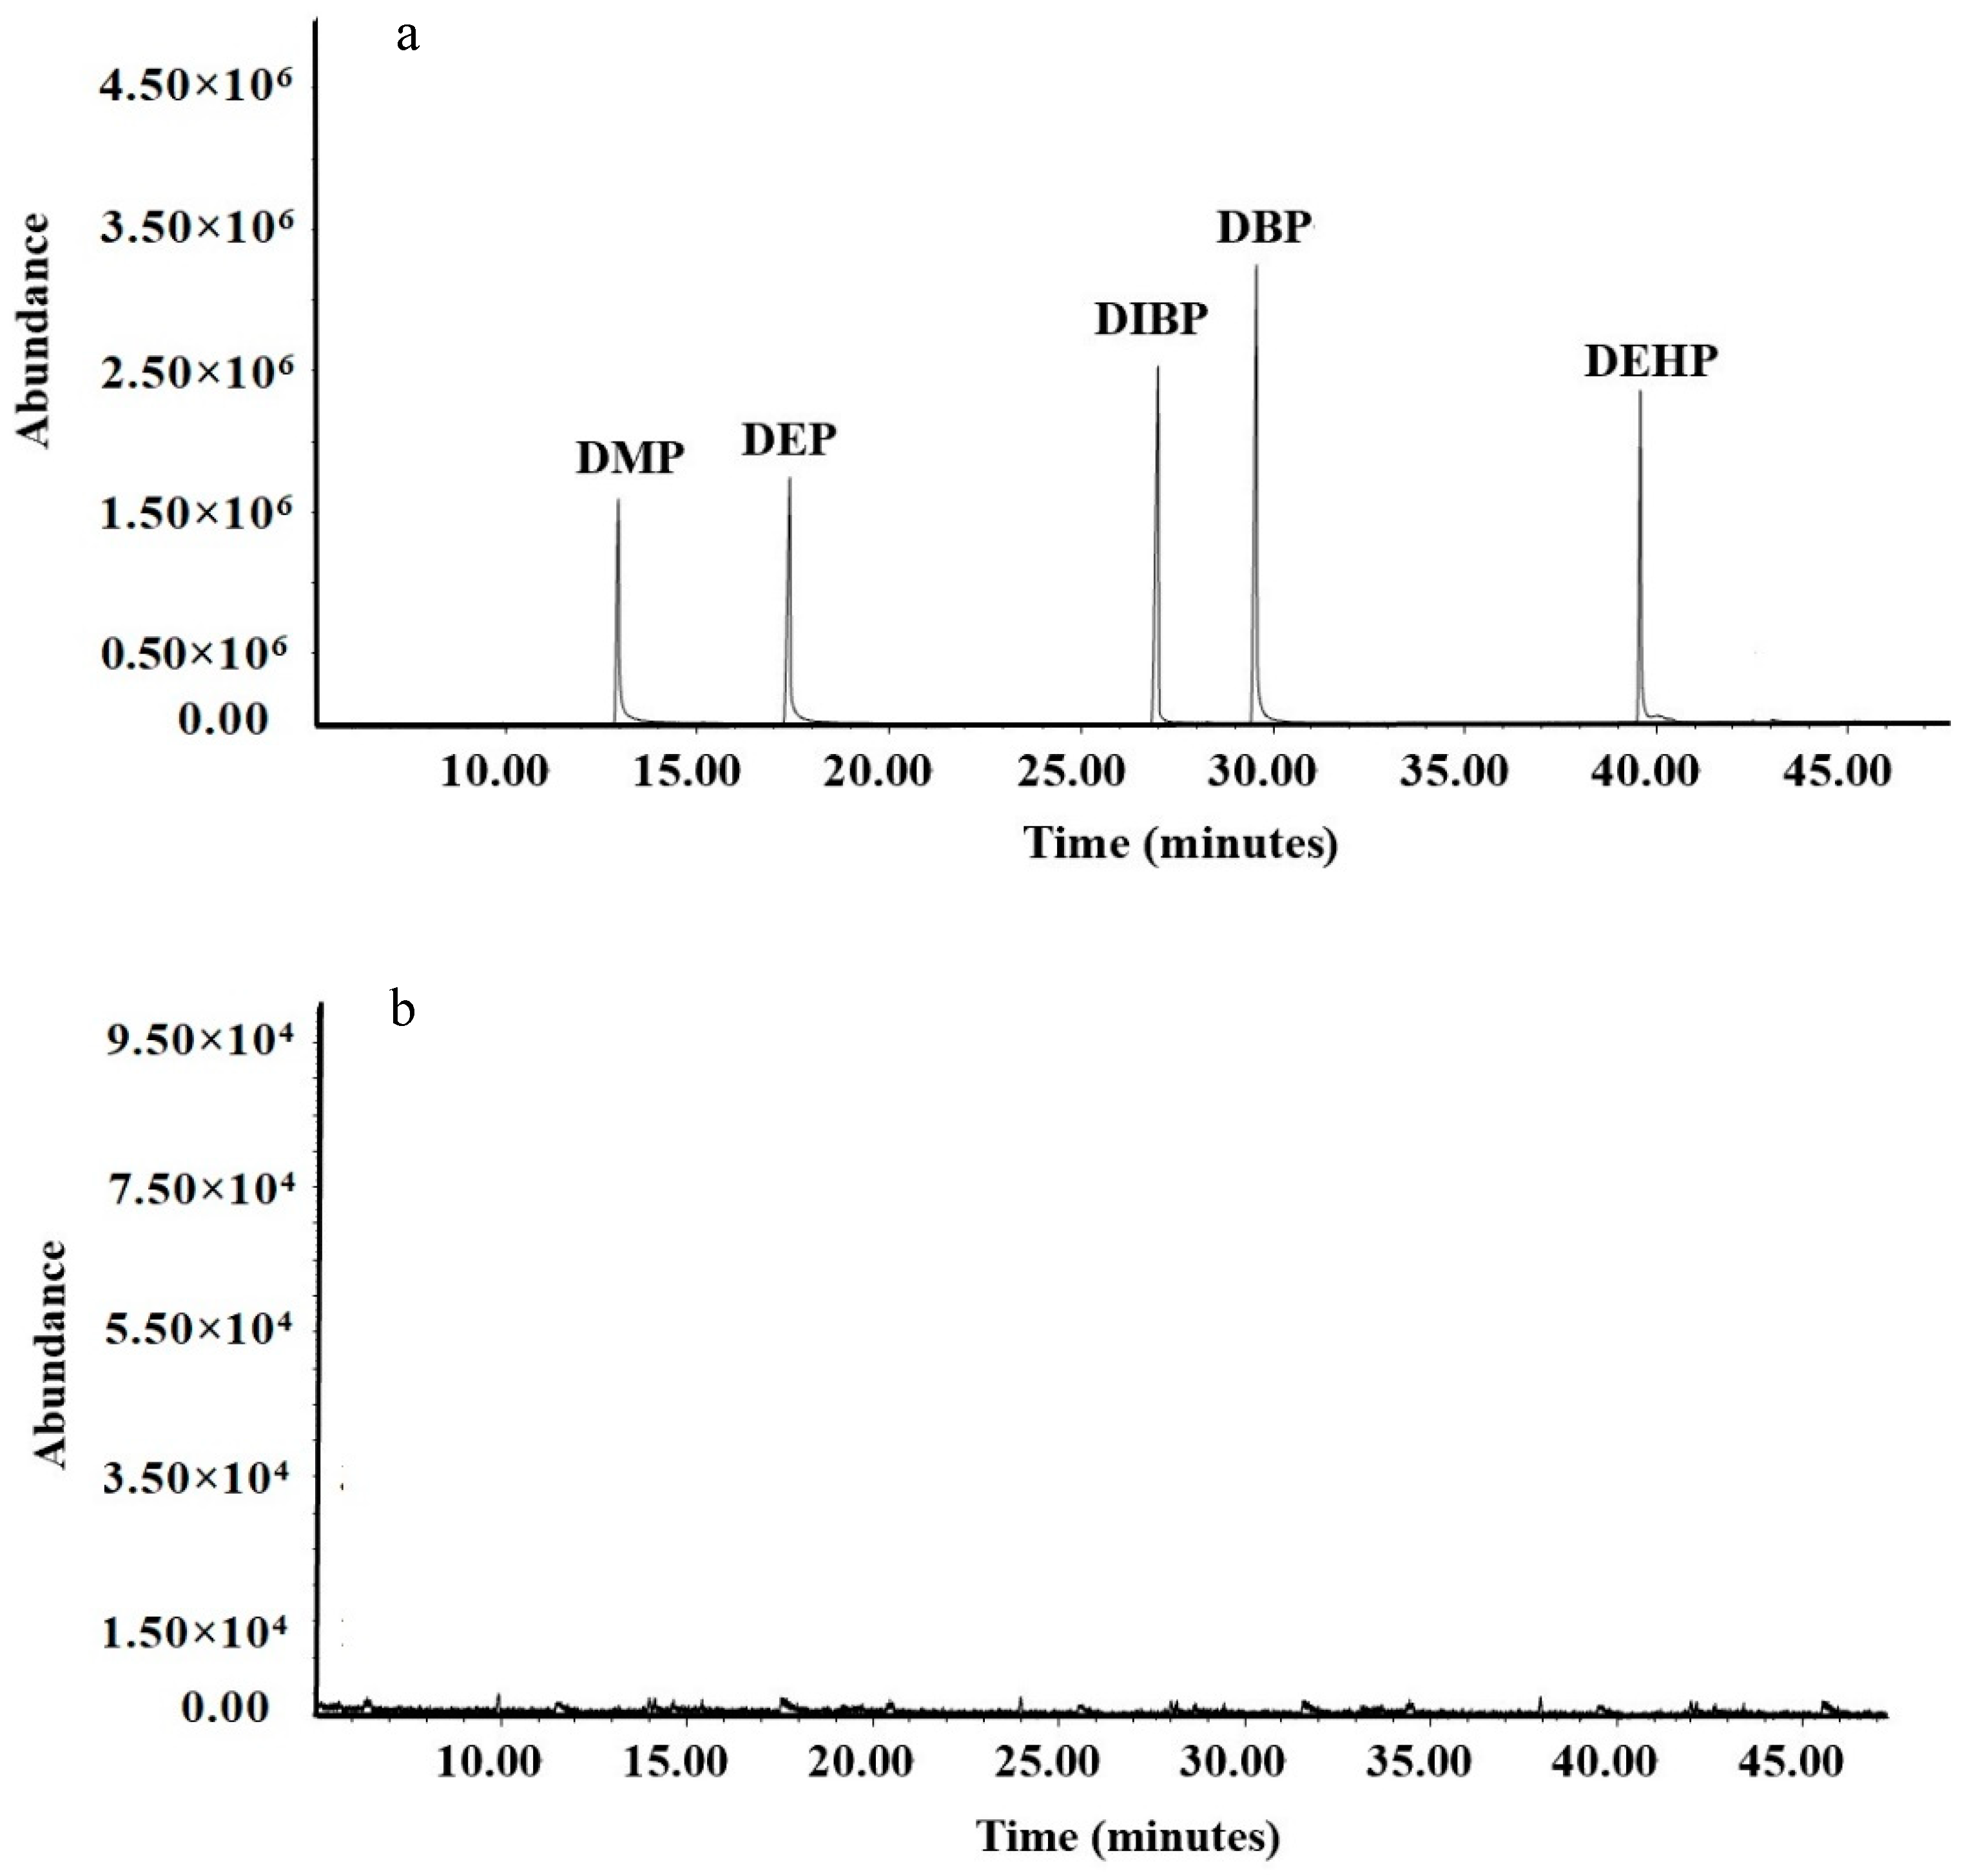
3.3. Validation of the Developed Method
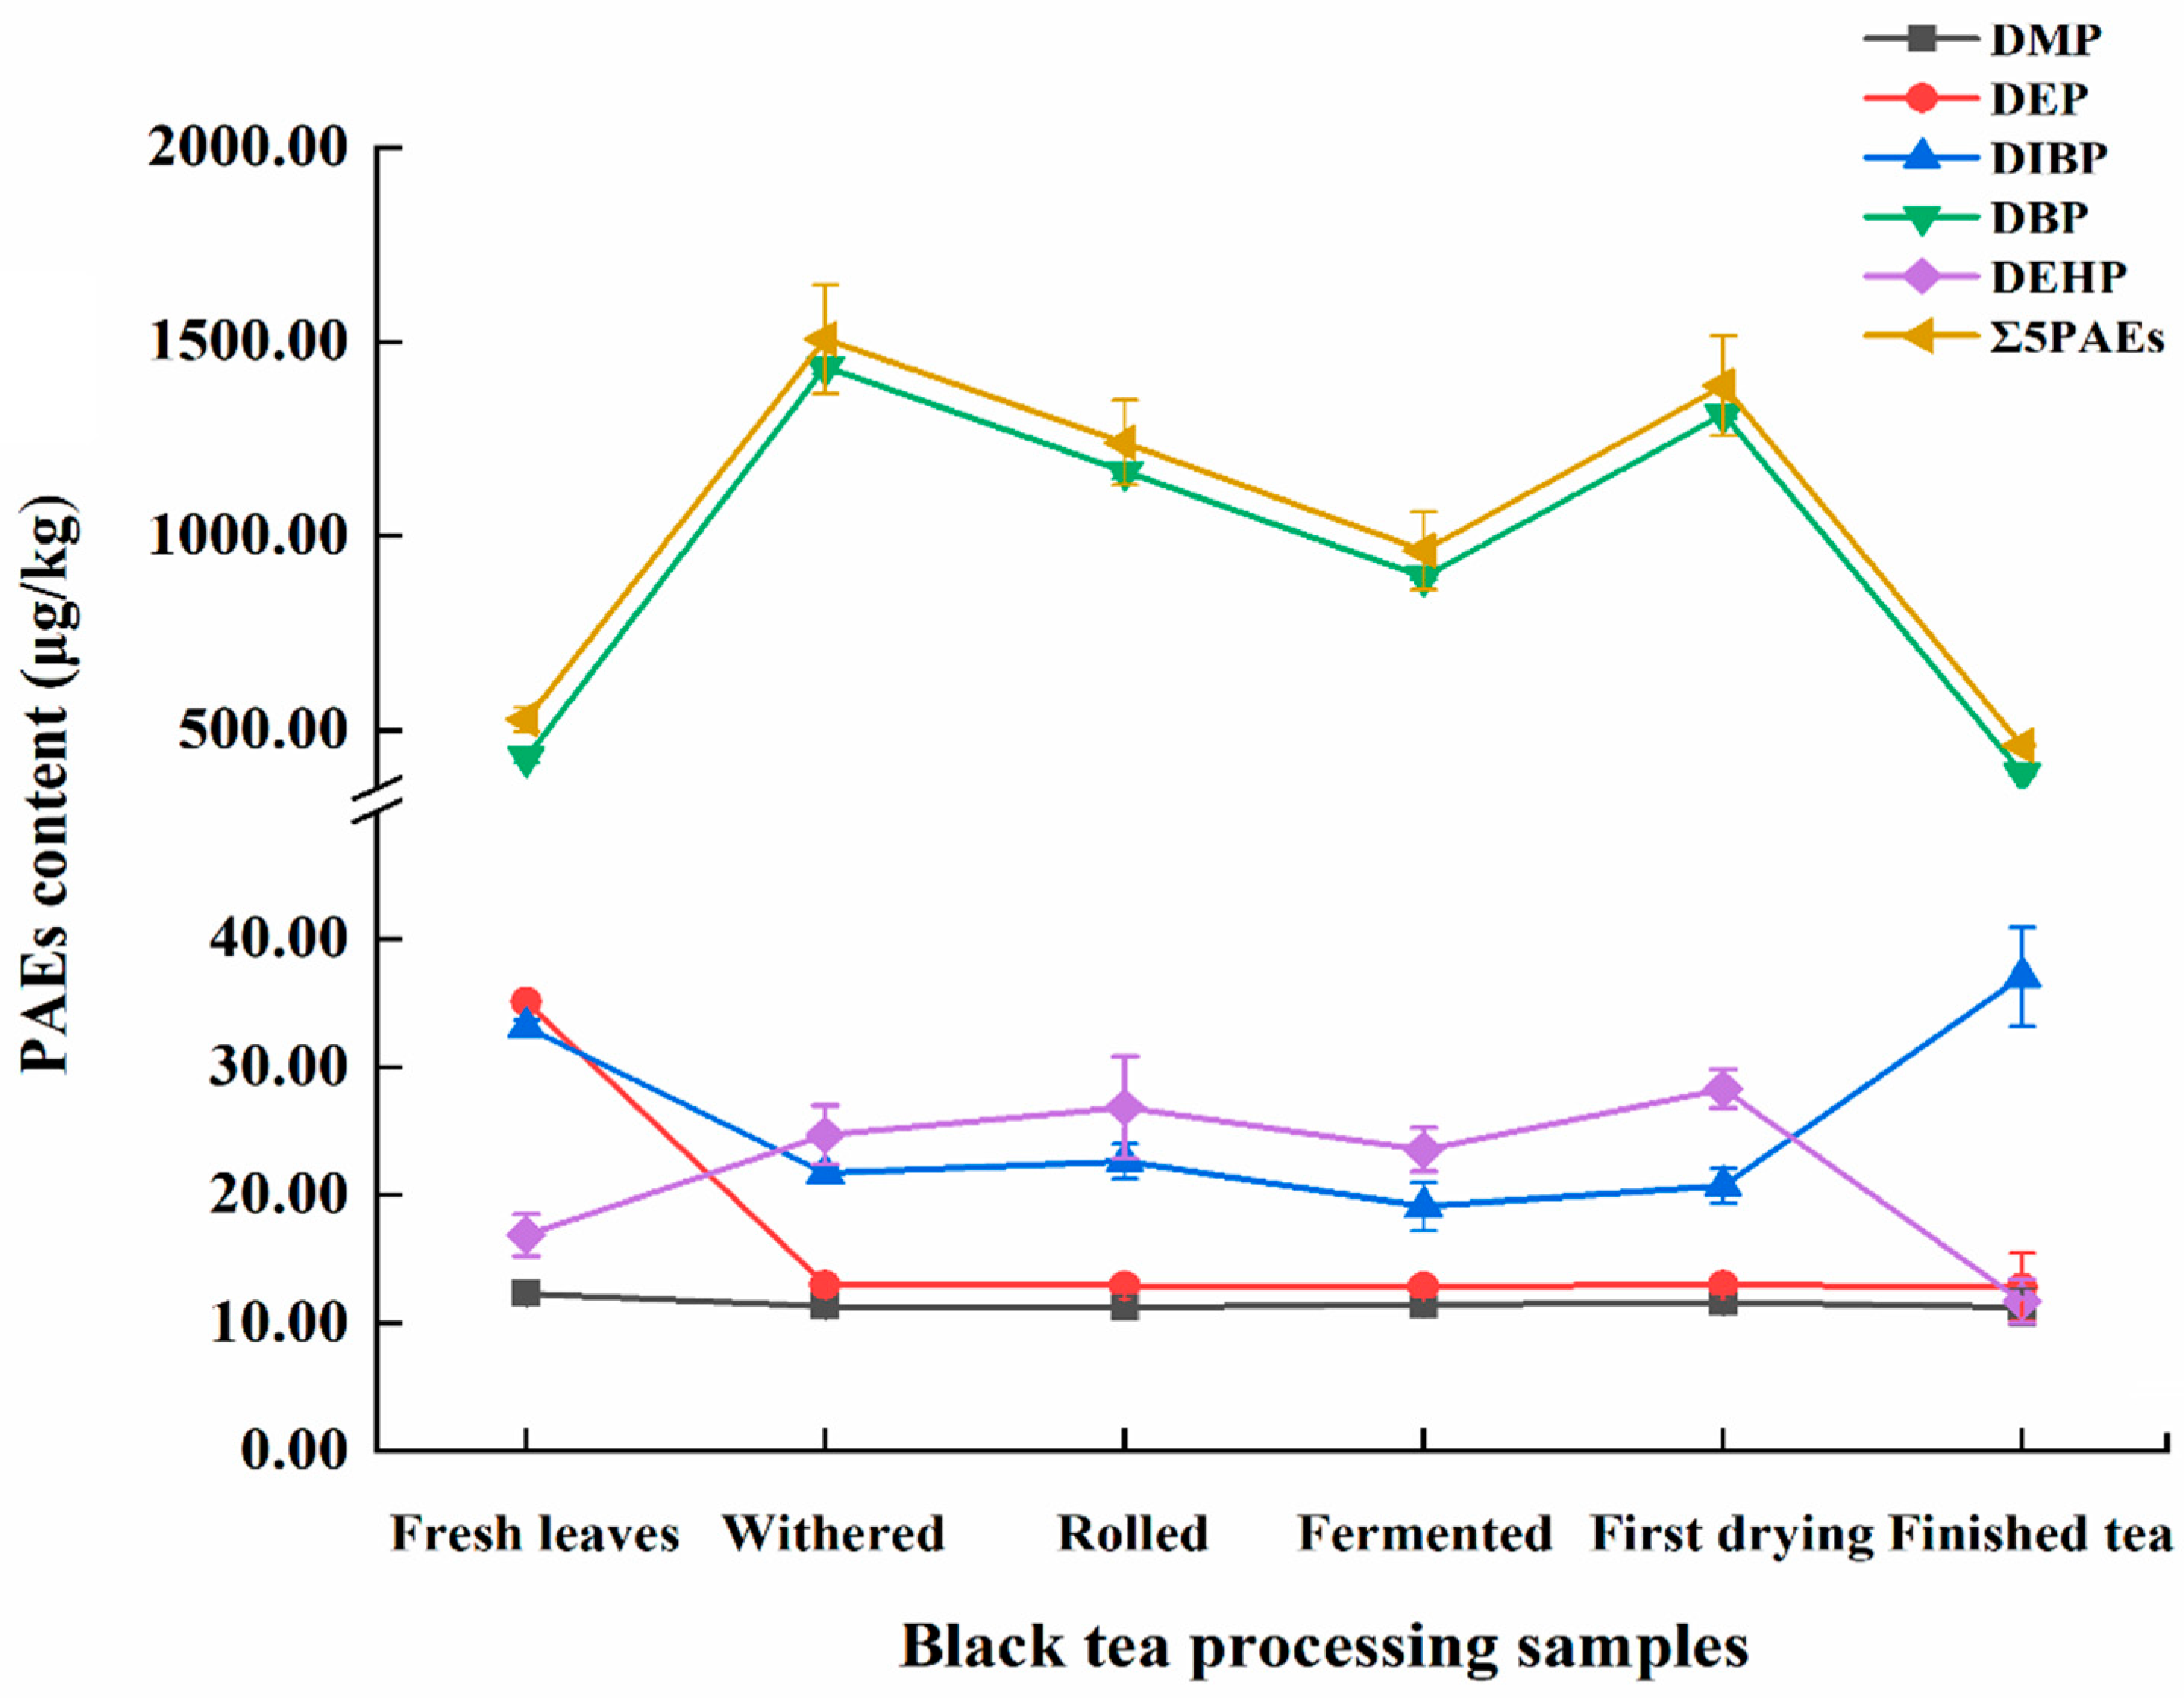
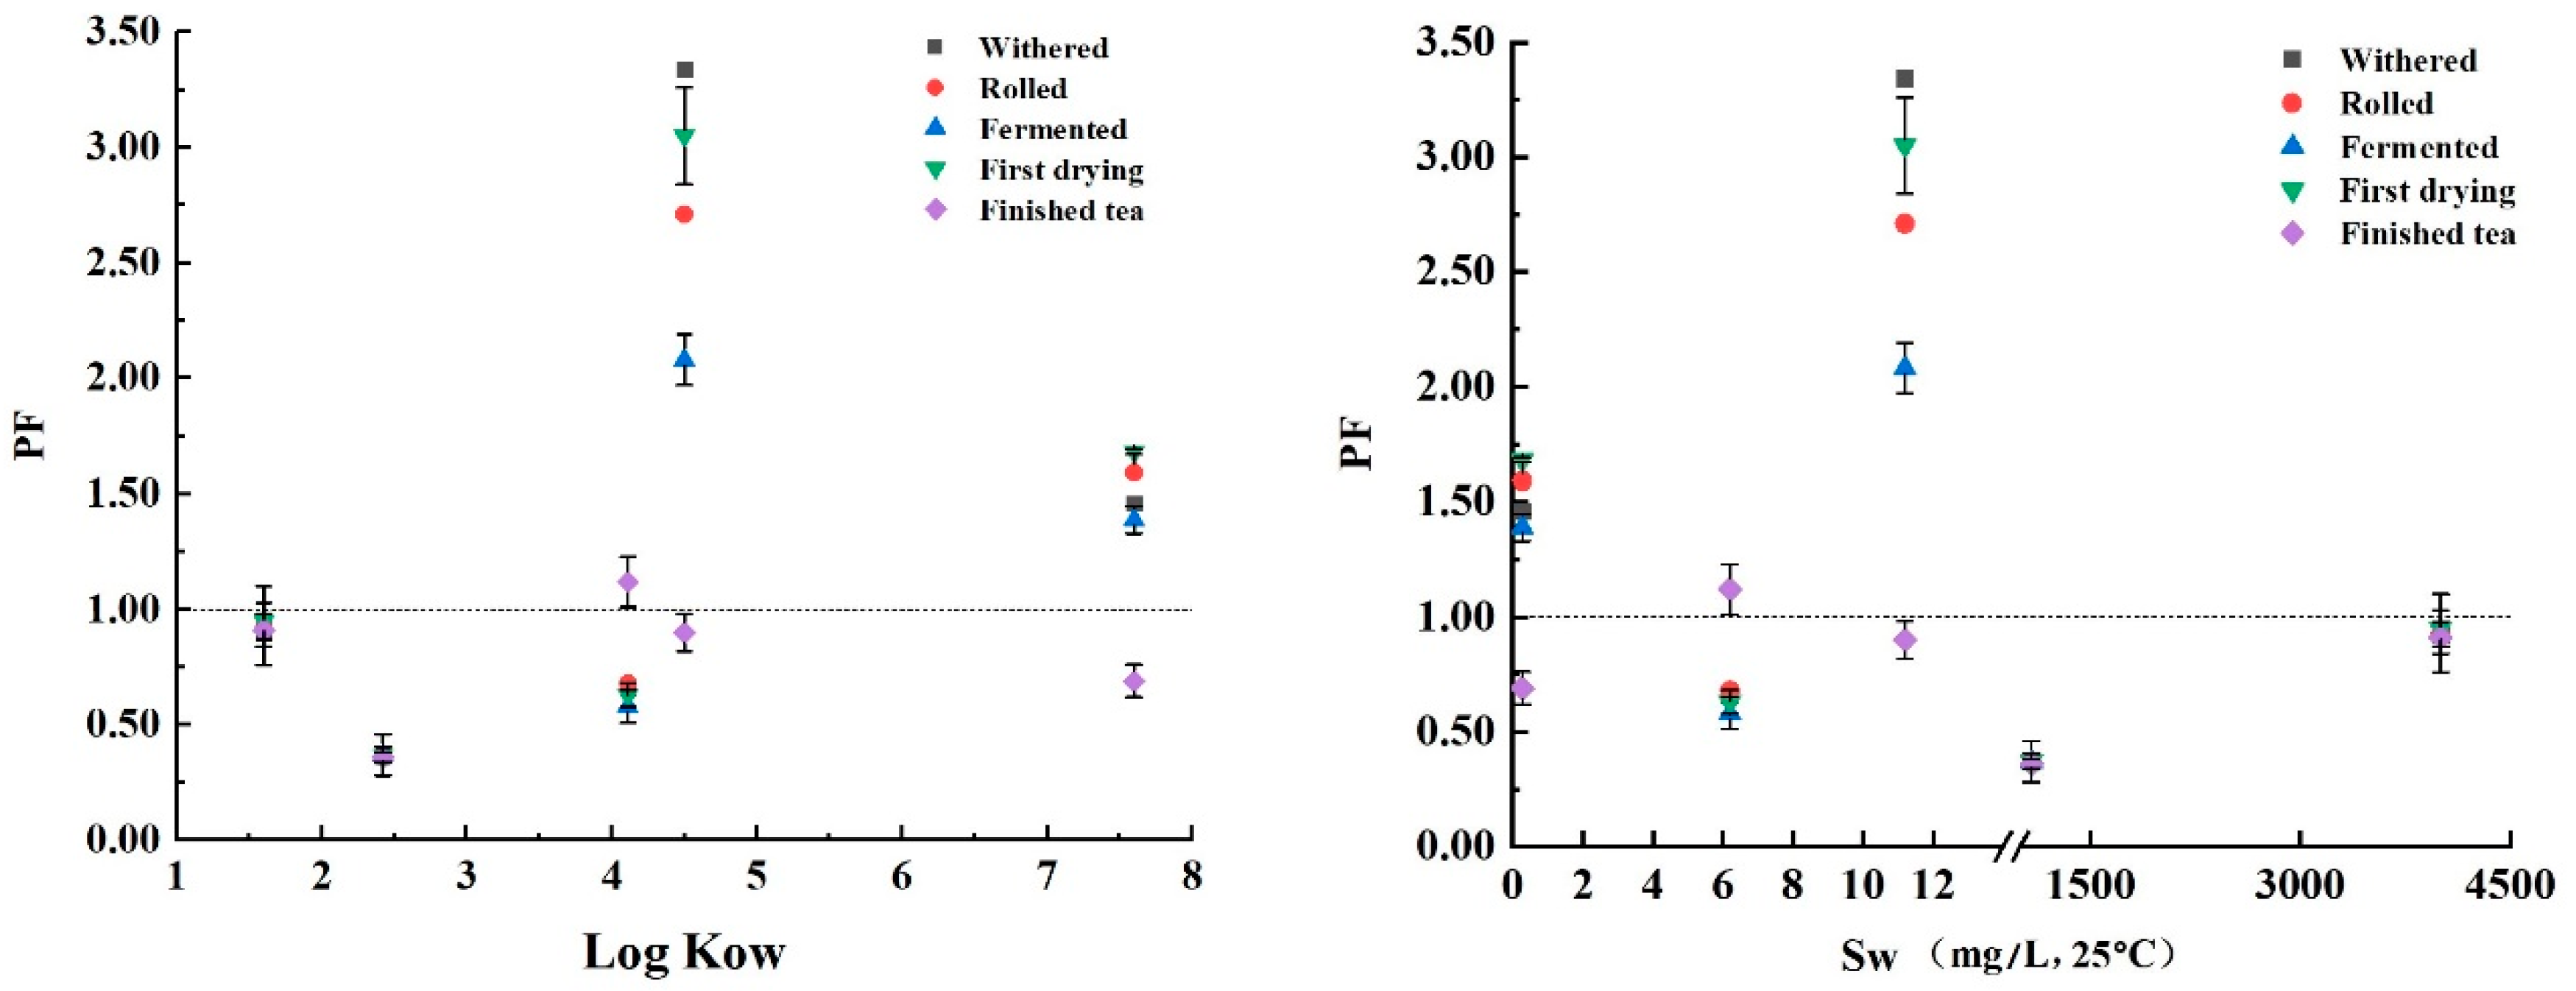
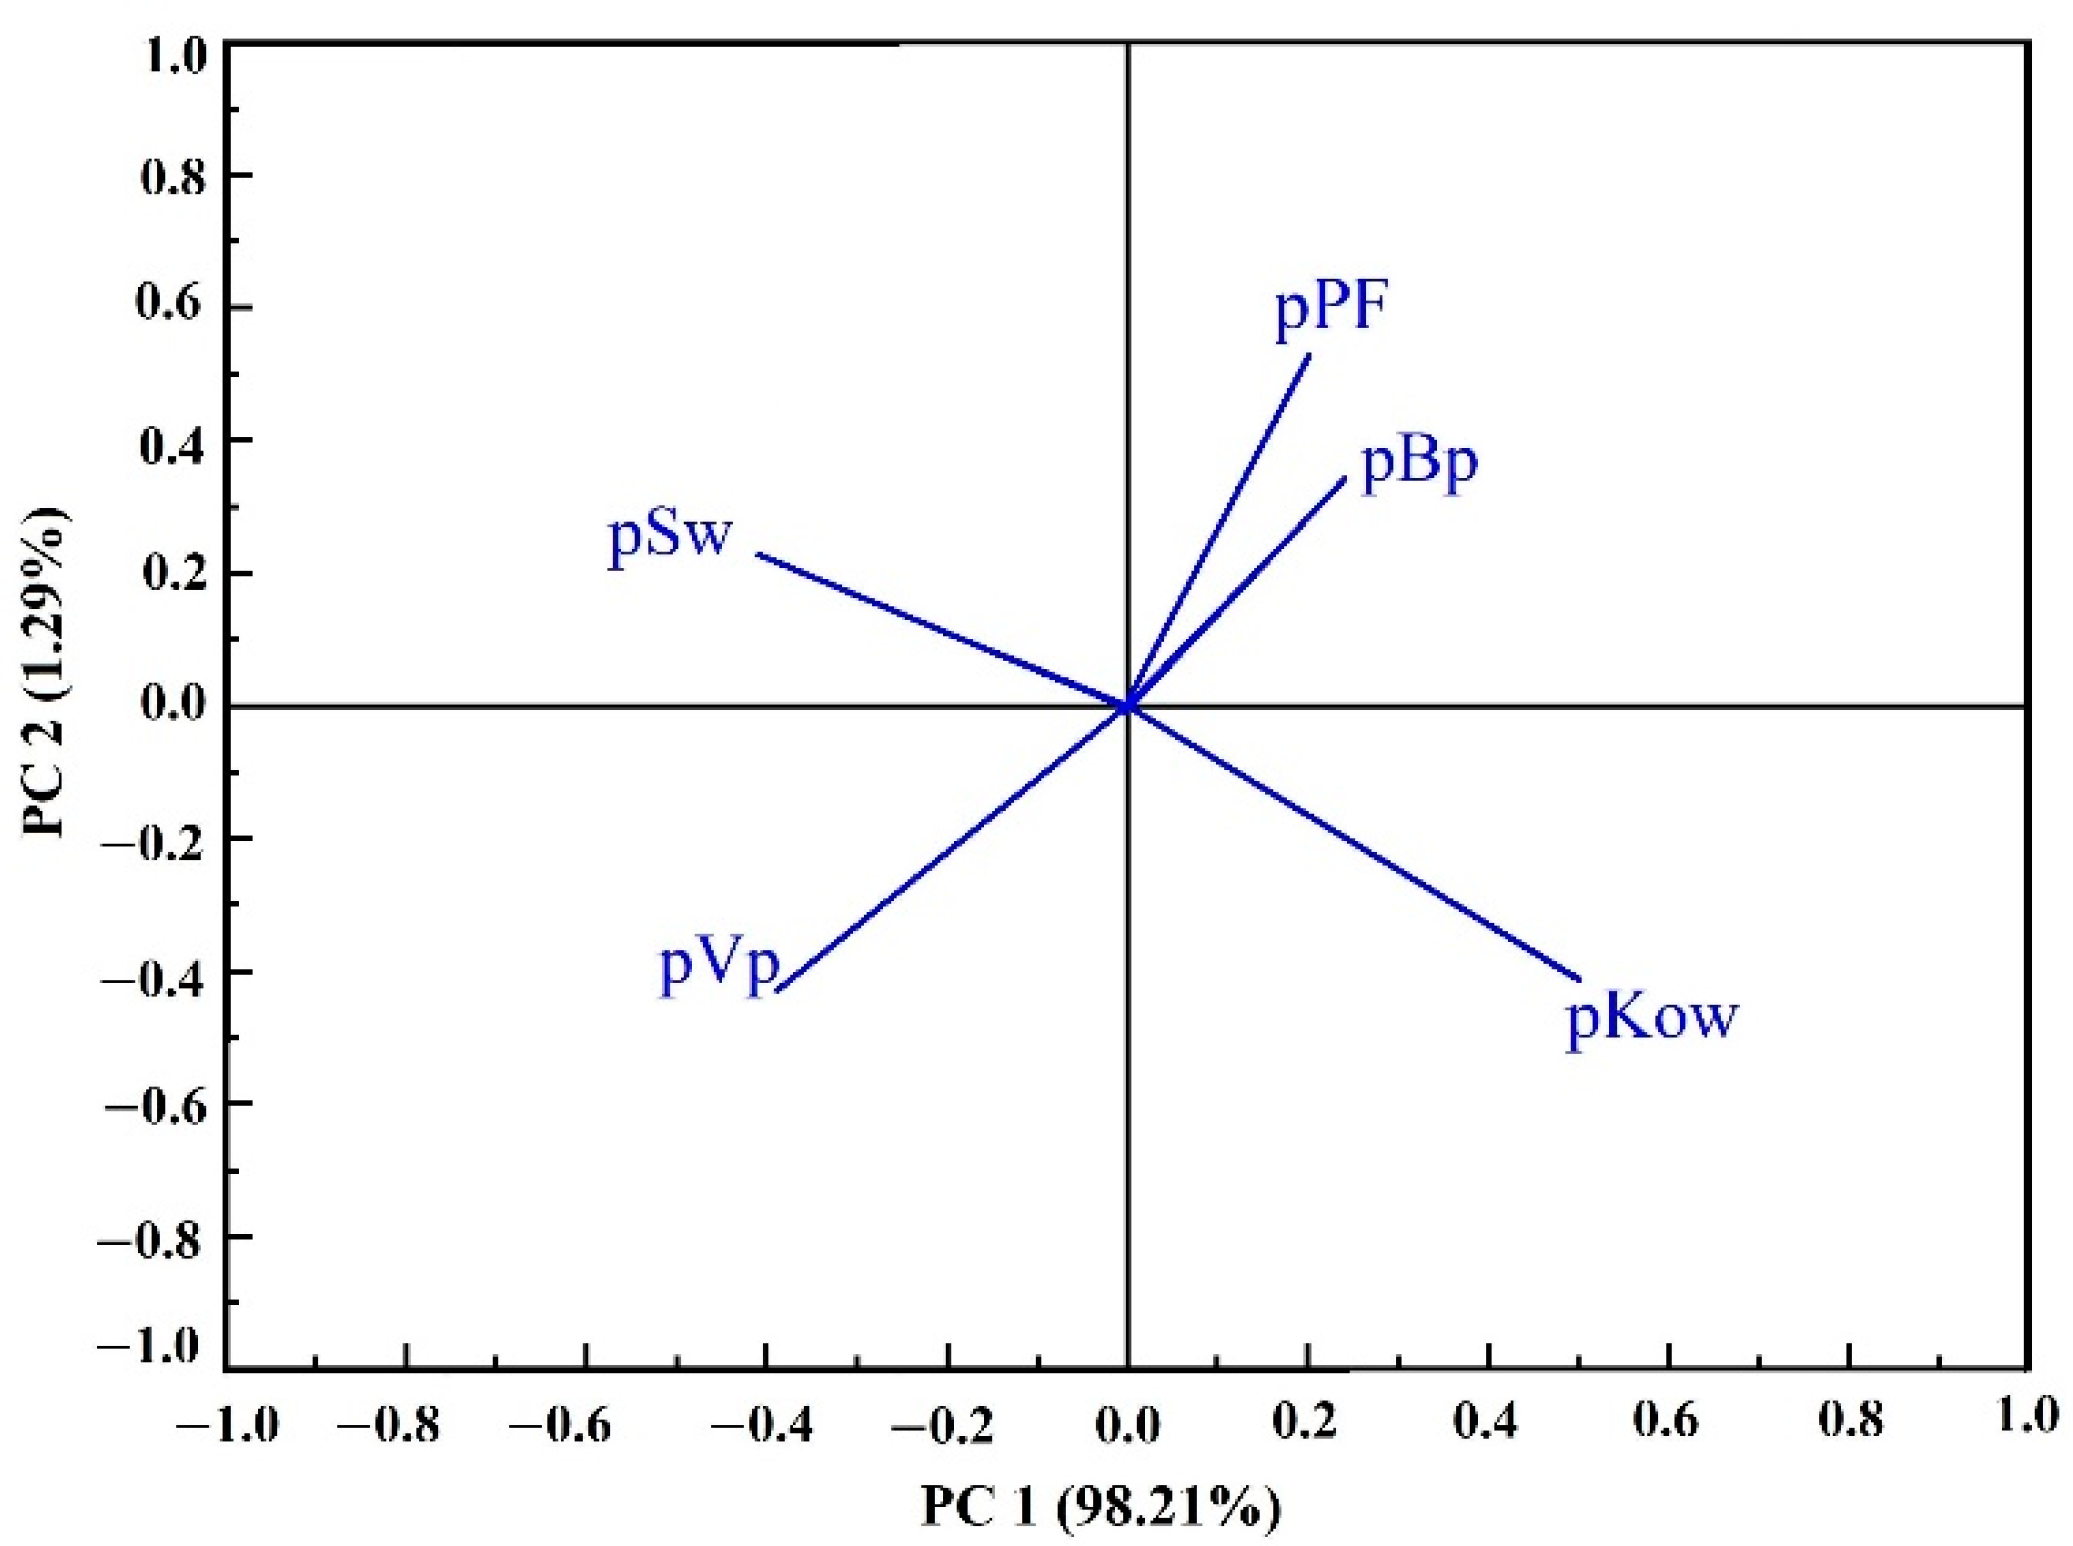
3.4. Dynamic Changes of PAEs during Black Tea Processing
4. Discussion
5. Conclusions
Supplementary Materials
Author Contributions
Funding
Institutional Review Board Statement
Informed Consent Statement
Data Availability Statement
Acknowledgments
Conflicts of Interest
References
- Zia, A.I.; Syaifudin, A.R.M.; Mukhopadhyay, S.C.; Yu, P.L.; Al-Bahadly, I.H.; Gooneratne, C.P.; Kosel, J.; Liao, T.-S. Electrochemical impedance spectroscopy based MEMS sensors for phthalates detection in water and juices. J. Phys. Conf. Ser. 2013, 439, 012026. [Google Scholar] [CrossRef]
- Yang, J.; Li, Y.; Wang, Y.; Ruan, J.; Zhang, J.; Sun, C. Recent advances in analysis of phthalate esters in foods. TrAC Trends Anal. Chem. 2015, 72, 10–26. [Google Scholar] [CrossRef]
- Ramzi, A.; Gireeshkumar, T.R.; Habeeb Rahman, K.H.; Manu, M.; Balachandran, K.K.; Chacko, J.; Chandramohanakumar, N. Distribution and contamination status of phthalic acid esters in the sediments of a tropical monsoonal estuary, Cochin—India. Chemosphere 2018, 210, 232–238. [Google Scholar] [CrossRef] [PubMed]
- Salazar-Beltrán, D.; Hinojosa-Reyes, L.; Palomino-Cabello, C.; Turnes-Palomino, G.; Hernández-Ramírez, A.; Guzmán-Mar, J.L. Determination of phthalate acid esters plasticizers in polyethylene terephthalate bottles and its correlation with some physicochemical properties. Polym. Test. 2018, 68, 87–94. [Google Scholar] [CrossRef]
- Keresztes, S.; Tatár, E.; Czégény, Z.; Záray, G.; Mihucz, V.G. Study on the leaching of phthalates from polyethylene terephthalate bottles into mineral water. Sci. Total Environ. 2013, 458–460, 451–458. [Google Scholar] [CrossRef] [Green Version]
- Net, S.; Delmont, A.; Sempéré, R.; Paluselli, A.; Ouddane, B. Reliable quantification of phthalates in environmental matrices (air, water, sludge, sediment and soil): A review. Sci. Total Environ. 2015, 515–516, 162–180. [Google Scholar] [CrossRef]
- Zhao, H.-M.; Du, H.; Xiang, L.; Chen, Y.-L.; Lu, L.-A.; Li, Y.-W.; Li, H.; Cai, Q.-Y.; Mo, C.-H. Variations in phthalate ester (PAE) accumulation and their formation mechanism in Chinese flowering cabbage (Brassica parachinensis L.) cultivars grown on PAE-contaminated soils. Environ. Pollut. 2015, 206, 95–103. [Google Scholar] [CrossRef]
- Salazar-Beltrán, D.; Hinojosa-Reyes, L.; Ruiz-Ruiz, E.; Hernández-Ramírez, A.; Guzmán-Mar, J.L. Phthalates in Beverages and Plastic Bottles: Sample Preparation and Determination. Food Anal. Methods 2018, 11, 48–61. [Google Scholar] [CrossRef]
- Tan, W.; Yu, H.; Huang, C.; Li, D.; Zhang, H.; Zhao, X.; Li, R.; Wang, G.; Zhang, Y.; He, X.; et al. Intercropping wheat and maize increases the uptake of phthalic acid esters by plant roots from soils. J. Hazard. Mater. 2018, 359, 9–18. [Google Scholar] [CrossRef]
- Wang, J.C.; Wang, X.R. Simultaneous determination of 22 phthalate esters in milk powder by GC-MS/MS. J. Sci. Technol. Food Ind. 2022, 43, 280–285. [Google Scholar]
- Ji, J.; Liu, Y.; Wang, D. Comparison of de-skin pretreatment and oil extraction on aflatoxins, phthalate esters, and polycyclic aromatic hydrocarbons in peanut oil. Food Control 2020, 118, 107365. [Google Scholar] [CrossRef]
- Perestrelo, R.; Silva, C.; Algarra, M.; Câmara, J. Evaluation of the Occurrence of Phthalates in Plastic Materials Used in Food Packaging. Appl. Sci. 2021, 11, 2130. [Google Scholar] [CrossRef]
- Fang, Y.; Sha, W.Z. Research progress of detection methods for phthalate esters in food and food packing materials. J. Crim. Technol. 2016, 1, 20–24. [Google Scholar] [CrossRef]
- Ma, Y.; Gao, X.; Ruan, Y.; Cui, H.; Zhang, L.; Zhang, W.; Wang, S. Determination of Phthalate Esters in Beverages and Water Samples by Solid Phase Extraction with Resin Based COFs as Filler. Water 2021, 13, 3338. [Google Scholar] [CrossRef]
- Huang, Z.; Tu, C.; Liu, H.; Wang, L.; Zhu, Z.; Watanabe, I. Hollow fiber-solid phase microextraction of phthalate esters from bottled water followed by flash evaporation gas chromatography-flame ionization detection. J. Chromatogr. A 2020, 1619, 460953. [Google Scholar] [CrossRef]
- Zhou, J.; Qi, Y.; Wu, H.; Diao, Q.; Tian, F.; Li, Y. Simultaneous determination of trace migration of phthalate esters in honey and royal jelly by GC-MS. J. Sep. Sci. 2014, 37, 650–657. [Google Scholar] [CrossRef]
- Notardonato, I.; Passarella, S.; Iannone, A.; Di Fiore, C.; Russo, M.V.; Protano, C.; Vitali, M.; Avino, P. Comparison of Two Extraction Procedures, SPE and DLLME, for Determining Plasticizer Residues in Hot Drinks at Vending Machines. Processes 2021, 9, 1588. [Google Scholar] [CrossRef]
- Jin, X.; Kaw, H.Y.; Wang, Z.; Zou, Y.; Li, W.; Guo, Z.; Sun, H.; Zhao, J.; Li, D. One-step extraction method of phthalate esters in vegetable oils. Chin. J. Chromatogr. 2018, 36, 173–178. [Google Scholar] [CrossRef] [Green Version]
- Sinha, P.; Anshu, A.K.; Tiwari, M.; Ahmad, Y. Determination of PAEs in soil of municipal wards of Patna, India by microwave assisted extraction and LC-MS/MS. Soil Sediment Contam. Int. J. 2019, 28, 162–170. [Google Scholar] [CrossRef]
- Li, H.; Tian, F.; Ren, X.; Wang, X. Determination of phthalic acid esters in soil by gas chromatography-tandem mass spectrometry. Chin. J. Chromatogr. 2011, 29, 563–566. [Google Scholar] [CrossRef]
- Lou, C.; Guo, D.; Zhang, K.; Wu, C.; Zhang, P.; Zhu, Y. Simultaneous determination of 11 phthalate esters in bottled beverages by graphene oxide coated hollow fiber membrane extraction coupled with supercritical fluid chromatography. Anal. Chim. Acta 2018, 1007, 71–79. [Google Scholar] [CrossRef] [PubMed]
- Li, X.; Liu, W.; Zhang, C.; Song, P.; Wang, J. Fate of Phthalic Acid Esters (PAEs) in Typical Greenhouse Soils of Different Cultivation Ages. Bull. Environ. Contam. Toxicol. 2020, 104, 301–306. [Google Scholar] [CrossRef] [PubMed]
- Yin, P.; Liu, X.; Chen, H.; Pan, R.; Ma, G. Determination of 16 phthalate esters in tea samples using a modified QuEChERS sample preparation method combined with GC-MS/MS. Food Addit. Contam. Part A 2014, 31, 1406–1413. [Google Scholar] [CrossRef] [PubMed]
- Wang, Z.; He, M.; Chen, B.; Hu, B. Triazine covalent organic polymer coated stir bar sorptive extraction coupled with high performance liquid chromatography for the analysis of trace phthalate esters in mineral water and liquor samples. J. Chromatogr. A 2021, 1660, 462665. [Google Scholar] [CrossRef] [PubMed]
- Alnaimat, A.S.; Barciela-Alonso, M.C.; Bermejo-Barrera, P. Development of a sensitive method for the analysis of four phthalates in tea samples: Tea bag contribution to the total amount in tea infusion. Food Addit. Contam. Part A 2020, 37, 1719–1729. [Google Scholar] [CrossRef] [PubMed]
- Yadav, S.; Rai, S.; Srivastava, A.K.; Panchal, S.; Patel, D.; Sharma, V.; Jain, S.; Srivastava, L. Determination of pesticide and phthalate residues in tea by QuEChERS method and their fate in processing. Environ. Sci. Pollut. Res. 2017, 24, 3074–3083. [Google Scholar] [CrossRef] [PubMed]
- Tsochatzis, E.; Karayannakidis, P.; Kalogiannis, S. Determination of selected dichloroanilines and phthalates in lyophilised mussels samples with ultra-high performance liquid chromatography-tandem mass spectrometry after QuEChERS clean-up. Food Addit. Contam. Part A 2019, 36, 1253–1260. [Google Scholar] [CrossRef]
- Du, L.; Ma, L.; Qiao, Y.; Lu, Y.; Xiao, D. Determination of phthalate esters in teas and tea infusions by gas chromatography–mass spectrometry. Food Chem. 2016, 197, 1200–1206. [Google Scholar] [CrossRef]
- Liu, P.; Chen, H.; Gao, G.; Hao, Z.; Wang, C.; Ma, G.; Chai, Y.; Zhang, L.; Liu, X. Occurrence and Residue Pattern of Phthalate Esters in Fresh Tea Leaves and during Tea Manufacturing and Brewing. J. Agric. Food Chem. 2016, 64, 8909–8917. [Google Scholar] [CrossRef]
- Pang, Y.-H.; Yue, Q.; Huang, Y.-Y.; Yang, C.; Shen, X.-F. Facile magnetization of covalent organic framework for solid-phase extraction of 15 phthalate esters in beverage samples. Talanta 2020, 206, 120194. [Google Scholar] [CrossRef]
- GB/T 8302; Tea Sampling. [NSPRC] National Standards of the People’s Republic of China: Beijing, China, 2013.
- GB 5009.271; Determination of Phthalate Esters in Foods. [NSPRC] National Standards of the People’s Republic of China: Beijing, China, 2016.
- Draper, N.R. Introduction to Box and Wilson (1951) On the Experimental Attainment of Optimum Conditions. In Breakthroughs in Statistics. Springer Series in Statistics (Perspectives in Statistics); Kotz, S., Johnson, N.L., Eds.; Springer: Berlin/Heidelberg, Germany, 1992; pp. 267–269. [Google Scholar] [CrossRef]
- Zhang, J.; Li, M.; Kong, Z.; Bai, T.; Quan, R.; Gao, T.; Duan, L.; Liu, Y.; Fan, B.; Wang, F. Model prediction of herbicide residues in soybean oil: Relationship between physicochemical properties and processing factors. Food Chem. 2022, 370, 131363. [Google Scholar] [CrossRef] [PubMed]
- Feki, F.; Klisurova, D.; Masmoudi, M.A.; Choura, S.; Denev, P.; Trendafilova, A.; Chamkha, M.; Sayadi, S. Optimization of microwave assisted extraction of simmondsins and polyphenols from Jojoba (Simmondsia chinensis) seed cake using Box-Behnken statistical design. Food Chem. 2021, 356, 129670. [Google Scholar] [CrossRef] [PubMed]
- Wang, X.; Zhou, L.; Luo, F.; Zhang, X.; Sun, H.; Yang, M.; Lou, Z.; Chen, Z. 9,10-Anthraquinone deposit in tea plantation might be one of the reasons for contamination in tea. Food Chem. 2018, 244, 254–259. [Google Scholar] [CrossRef] [PubMed]
- GB/T 27417; Comformity Assessment—Guidance on Validation and Verification of Chemical Analytical Methods. [NSPRC] National Standards of the People’s Republic of China: Beijing, China, 2017.
- Liu, P.X.; Chen, H.P.; Zhang, M.L.; Gao, J.W.; Yin, P.; Liu, X. Progress on pollution level and detection technology of phthalate in tea leaves. J. Zhejiang Agric. Sci. 2015, 56, 1796–1804. [Google Scholar] [CrossRef]
- Fei, X.Y.; Lin, Z.; Liang, M.Z.; Wang, L.B.; Chen, J.W.; Lv, H.P.; Tan, J.F.; Guo, L. Study on anthocyanins extraction process in tea by response surface method. Tea Sci. 2012, 32, 197–202. [Google Scholar] [CrossRef]
- Lin, D.; Zhu, L. Polycyclic Aromatic Hydrocarbons: Pollution and Source Analysis of a Black Tea. J. Agric. Food Chem. 2004, 52, 8268–8271. [Google Scholar] [CrossRef]
- Grover, I.S.; Singh, S.; Pal, B. Priority PAHs in orthodox black tea during manufacturing process. Environ. Monit. Assess. 2013, 185, 6291–6294. [Google Scholar] [CrossRef]
- Gao, G.; Chen, H.; Liu, P.; Hao, Z.; Ma, G.; Chai, Y.; Wang, C.; Lu, C. Residue pattern of polycyclic aromatic hydrocarbons during green tea manufacturing and their transfer rates during tea brewing. Food Addit. Contam. Part A 2017, 34, 990–999. [Google Scholar] [CrossRef]
- Sood, C.; Jaggi, S.; Kumar, V.; Ravindranath, S.; Shanker, A. How manufacturing processes affect the level of pesticide residues in tea. J. Sci. Food Agric. 2004, 84, 2123–2127. [Google Scholar] [CrossRef]


| Test Number | Factor | Experimental Content (μg/kg) | Predicted Content (μg/kg) | ||
|---|---|---|---|---|---|
| Solid–Liquid Ratio (A) | Extraction Temperature (B) | Extraction Time (C) | |||
| 1 | 1:20 | 40 | 12 | 546.14 | 567.92 |
| 2 | 1:20 | 40 | 12 | 557.63 | 576.48 |
| 3 | 1:10 | 50 | 12 | 348.29 | 328.23 |
| 4 | 1:20 | 40 | 12 | 647.50 | 585.85 |
| 5 | 1:20 | 40 | 12 | 559.27 | 577.11 |
| 6 | 1:20 | 40 | 12 | 529.08 | 533.45 |
| 7 | 1:10 | 40 | 18 | 416.98 | 402.39 |
| 8 | 1:30 | 30 | 12 | 216.75 | 236.81 |
| 9 | 1:20 | 30 | 6 | 193.37 | 158.72 |
| 10 | 1:20 | 50 | 18 | 395.63 | 430.28 |
| 11 | 1:10 | 30 | 12 | 219.02 | 249.49 |
| 12 | 1:10 | 40 | 6 | 166.01 | 170.17 |
| 13 | 1:30 | 50 | 12 | 302.30 | 207.11 |
| 14 | 1:30 | 40 | 6 | 138.57 | 153.16 |
| 15 | 1:20 | 30 | 18 | 380.81 | 364.92 |
| 16 | 1:30 | 40 | 18 | 354.47 | 350.30 |
| 17 | 1:20 | 50 | 6 | 191.22 | 207.11 |
| Source of Variance | Degrees of Freedom | Sum of Square | Mean Square | F-Value | p-Value | Distinctiveness |
|---|---|---|---|---|---|---|
| A-Solid–liquid ratio | 1 | 2387.40 | 2387.40 | 1.15 | 0.3190 | |
| B-Extraction temperature | 1 | 6468.96 | 6468.96 | 3.12 | 0.1208 | |
| C-Extraction time | 1 | 92,177.15 | 92,177.15 | 44.42 | 0.0003 | ** |
| AB | 1 | 477.86 | 477.86 | 0.23 | 0.6459 | |
| AC | 1 | 307.65 | 307.65 | 0.15 | 0.7116 | |
| BC | 1 | 72.00 | 72.00 | 0.035 | 0.8575 | |
| A2 | 1 | 1.062 × 10⁵ | 1.062 × 10⁵ | 51.16 | 0.0002 | ** |
| B2 | 1 | 79,652.45 | 79,652.45 | 38.39 | 0.0004 | ** |
| C2 | 1 | 82,674.64 | 82,674.64 | 39.84 | 0.0004 | ** |
| Model | 9 | 4.018 × 10⁵ | 44,642.87 | 21.51 | 0.0003 | ** |
| Residual | 7 | 14,525.52 | 2075.07 | |||
| Lack-of-fit | 3 | 6028.92 | 2009.64 | 0.95 | 0.4980 | |
| Pure error | 4 | 8496.60 | 2124.15 | |||
| Cor total | 16 | 4.163 × 10⁵ |
| Number | Compound | Retention Time (min) | Qualitativeion (m/z) | Quantitative Ion (m/z) |
|---|---|---|---|---|
| 1 | DMP | 12.98 | 163,77,194,133 | 163 |
| 2 | DEP | 17.38 | 149,177,105,222 | 149 |
| 3 | DiBP | 26.90 | 149,223,104,167 | 149 |
| 4 | DBP | 29.50 | 149,223,205,104 | 149 |
| 5 | DEHP | 39.57 | 149,167,279,113 | 149 |
| PAEs | Linear Range (μg/L) | r2 | LOD (μg/kg) | LOQ (μg/kg) | Recoveries, % (RSD, %) | Matrix Effect | ||
|---|---|---|---|---|---|---|---|---|
| 100 μg/L | 500 μg/L | 1000 μg/L | ||||||
| DMP | 1.00–1000.00 | 0.9910 | 0.40 | 1.33 | 81.71 (4.32) | 95.00 (7.55) | 97.07 (5.70) | 1.13 |
| DEP | 1.00–1000.00 | 0.9914 | 0.61 | 2.03 | 80.70 (5.60) | 94.28 (6.52) | 93.88 (4.56) | 1.02 |
| DIBP | 1.00–1000.00 | 0.9950 | 0.42 | 1.40 | 82.69 (8.14) | 94.22 (4.03) | 91.57 (3.31) | 0.63 |
| DBP | 1.00–500.00 | 0.9961 | 0.50 | 1.66 | 89.30 (6.67) | 90.37 (8.69) | 98.28 (4.58) | 0.50 |
| DEHP | 1.00–1000.00 | 0.9963 | 0.21 | 0.71 | 84.37 (6.39) | 93.99 (3.94) | 98.68 (2.72) | 0.40 |
| Sample | DMP | DEP | DIBP | DBP | DEHP | Sum |
|---|---|---|---|---|---|---|
| Fresh leaves sample | 12.31 ± 0.39 | 35.13 ± 0.17 | 33.15 ± 0.56 | 430.41 ± 15.08 | 16.89 ± 1.64 | 527.90 ± 31.38 |
| Withered sample | 11.36 ± 0.35 | 13.01 ± 0.22 | 21.73 ± 0.37 | 1436.37 ± 17.32 | 24.73 ± 2.29 | 1507.21 ± 139.04 |
| Rolled sample | 11.28 ± 0.87 | 12.97 ± 0.51 | 22.68 ± 1.34 | 1166.90 ± 18.83 | 26.86 ± 3.99 | 1240.86 ± 109.02 |
| Fermented sample | 11.44 ± 0.39 | 12.87 ± 0.54 | 19.13 ± 1.88 | 895.98 ± 9.16 | 23.56 ± 1.69 | 962.97 ± 100.84 |
| First drying sample | 11.67 ± 0.40 | 12.99 ± 0.33 | 20.77 ± 1.37 | 1313.84 ± 9.31 | 28.33 ± 1.52 | 1387.61 ± 128.37 |
| Finished tea sample | 11.26 ± 1.47 | 12.82 ± 2.68 | 37.08 ± 3.87 | 387.69 ± 4.09 | 11.73 ± 1.72 | 460.85 ± 4.33 |
| PAEs | CAS Number | Mw | Log Kow | Sw (mg/L, 25 °C) | Vp (mm Hg, 25 °C) | Mp (°C) | Bp (°C) | Structural Formula |
|---|---|---|---|---|---|---|---|---|
| DMP | 131-11-3 | 194.19 | 1.60 | 4000.00 | 3.08 × 10⁻³ | 5.50 | 282.68 |  |
| DEP | 84-66-2 | 222.24 | 2.42 | 1080.00 | 2.10 × 10⁻³ | −40.50 | 294.00 | 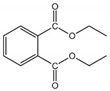 |
| DiBP | 84-69-5 | 278.35 | 4.11 | 6.20 | 4.76 × 10⁻⁵ | −50.00 | 327.00 | 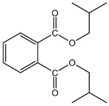 |
| DBP | 84-74-2 | 278.35 | 4.50 | 11.20 | 2.01 × 10⁻⁵ | −35.00 | 337.00 | 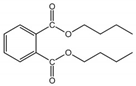 |
| DEHP | 117-81-7 | 390.57 | 7.60 | 0.27 | 1.42 × 10⁻⁷ | −50.00 | 384.90 | 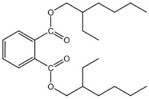 |
Publisher’s Note: MDPI stays neutral with regard to jurisdictional claims in published maps and institutional affiliations. |
© 2022 by the authors. Licensee MDPI, Basel, Switzerland. This article is an open access article distributed under the terms and conditions of the Creative Commons Attribution (CC BY) license (https://creativecommons.org/licenses/by/4.0/).
Share and Cite
Tang, Y.; Wang, M.; Pan, C.; Mi, S.; Han, B. Determination of Five Phthalate Esters in Tea and Their Dynamic Characteristics during Black Tea Processing. Foods 2022, 11, 1266. https://doi.org/10.3390/foods11091266
Tang Y, Wang M, Pan C, Mi S, Han B. Determination of Five Phthalate Esters in Tea and Their Dynamic Characteristics during Black Tea Processing. Foods. 2022; 11(9):1266. https://doi.org/10.3390/foods11091266
Chicago/Turabian StyleTang, Yanyan, Mengxin Wang, Cheng Pan, Shuishan Mi, and Baoyu Han. 2022. "Determination of Five Phthalate Esters in Tea and Their Dynamic Characteristics during Black Tea Processing" Foods 11, no. 9: 1266. https://doi.org/10.3390/foods11091266
APA StyleTang, Y., Wang, M., Pan, C., Mi, S., & Han, B. (2022). Determination of Five Phthalate Esters in Tea and Their Dynamic Characteristics during Black Tea Processing. Foods, 11(9), 1266. https://doi.org/10.3390/foods11091266