
The Effect of Heat Treatment on Cow’s Milk Protein Profiles

 , , , and
Abstract
:1. Introduction
2. Materials and Methods
2.1. Design of the Experiment
- Analysis of the protein content in raw milk (FTIR spectroscopy);
- Heat treatment of milk (Experiment 1—heating time: 10 min, 20 min and 30 min, heating temperature: 65 °C, 75 °C, 85 °C, 95 °C, 100 °C; Experiment 2—heating time: 5, 10, 15, 20, 25, 30 min, heating temperature: 75 °C, 85 °C, 95 °C);
- Analysis of the protein content in heat-treated milk (FTIR spectroscopy);
- Skimming of heat-treated milk samples;
- Analysis of the protein content of the supernatant of skimmed heat-treated milk samples (UV spectroscopy);
- Analysis of whey protein and casein complex denaturation (SDS-PAGE);
- Densitometric analysis of stained gels;
- Determination of denaturation degree of individual proteins fractions (%);
- Statistical analysis.
2.2. Collection of Milk Samples
2.3. Heat Treatment of Milk Samples
2.4. Skimming the Heat-Treated Milk Samples
2.5. Analysis of Protein Content
2.6. SDS-PAGE Analysis of Protein Fraction Denaturation
2.7. Densitometric Analysis
2.8. Statistical Analysis
3. Results

| Heating Time | Protein Fraction | Heating Temperature | ||||||
|---|---|---|---|---|---|---|---|---|
| Raw | 65 °C | 75 °C | 85 °C | 95 °C | 100 °C | p-Value | ||
| 10 min | α-cas | 1.60 c | 1.62 c | 1.63 c | 1.71 b | 1.75 ab | 1.80 a | p < 0.05 |
| ±0.02 | ±0.02 | ±0.03 | ±0.02 | ±0.01 | ±0.08 | |||
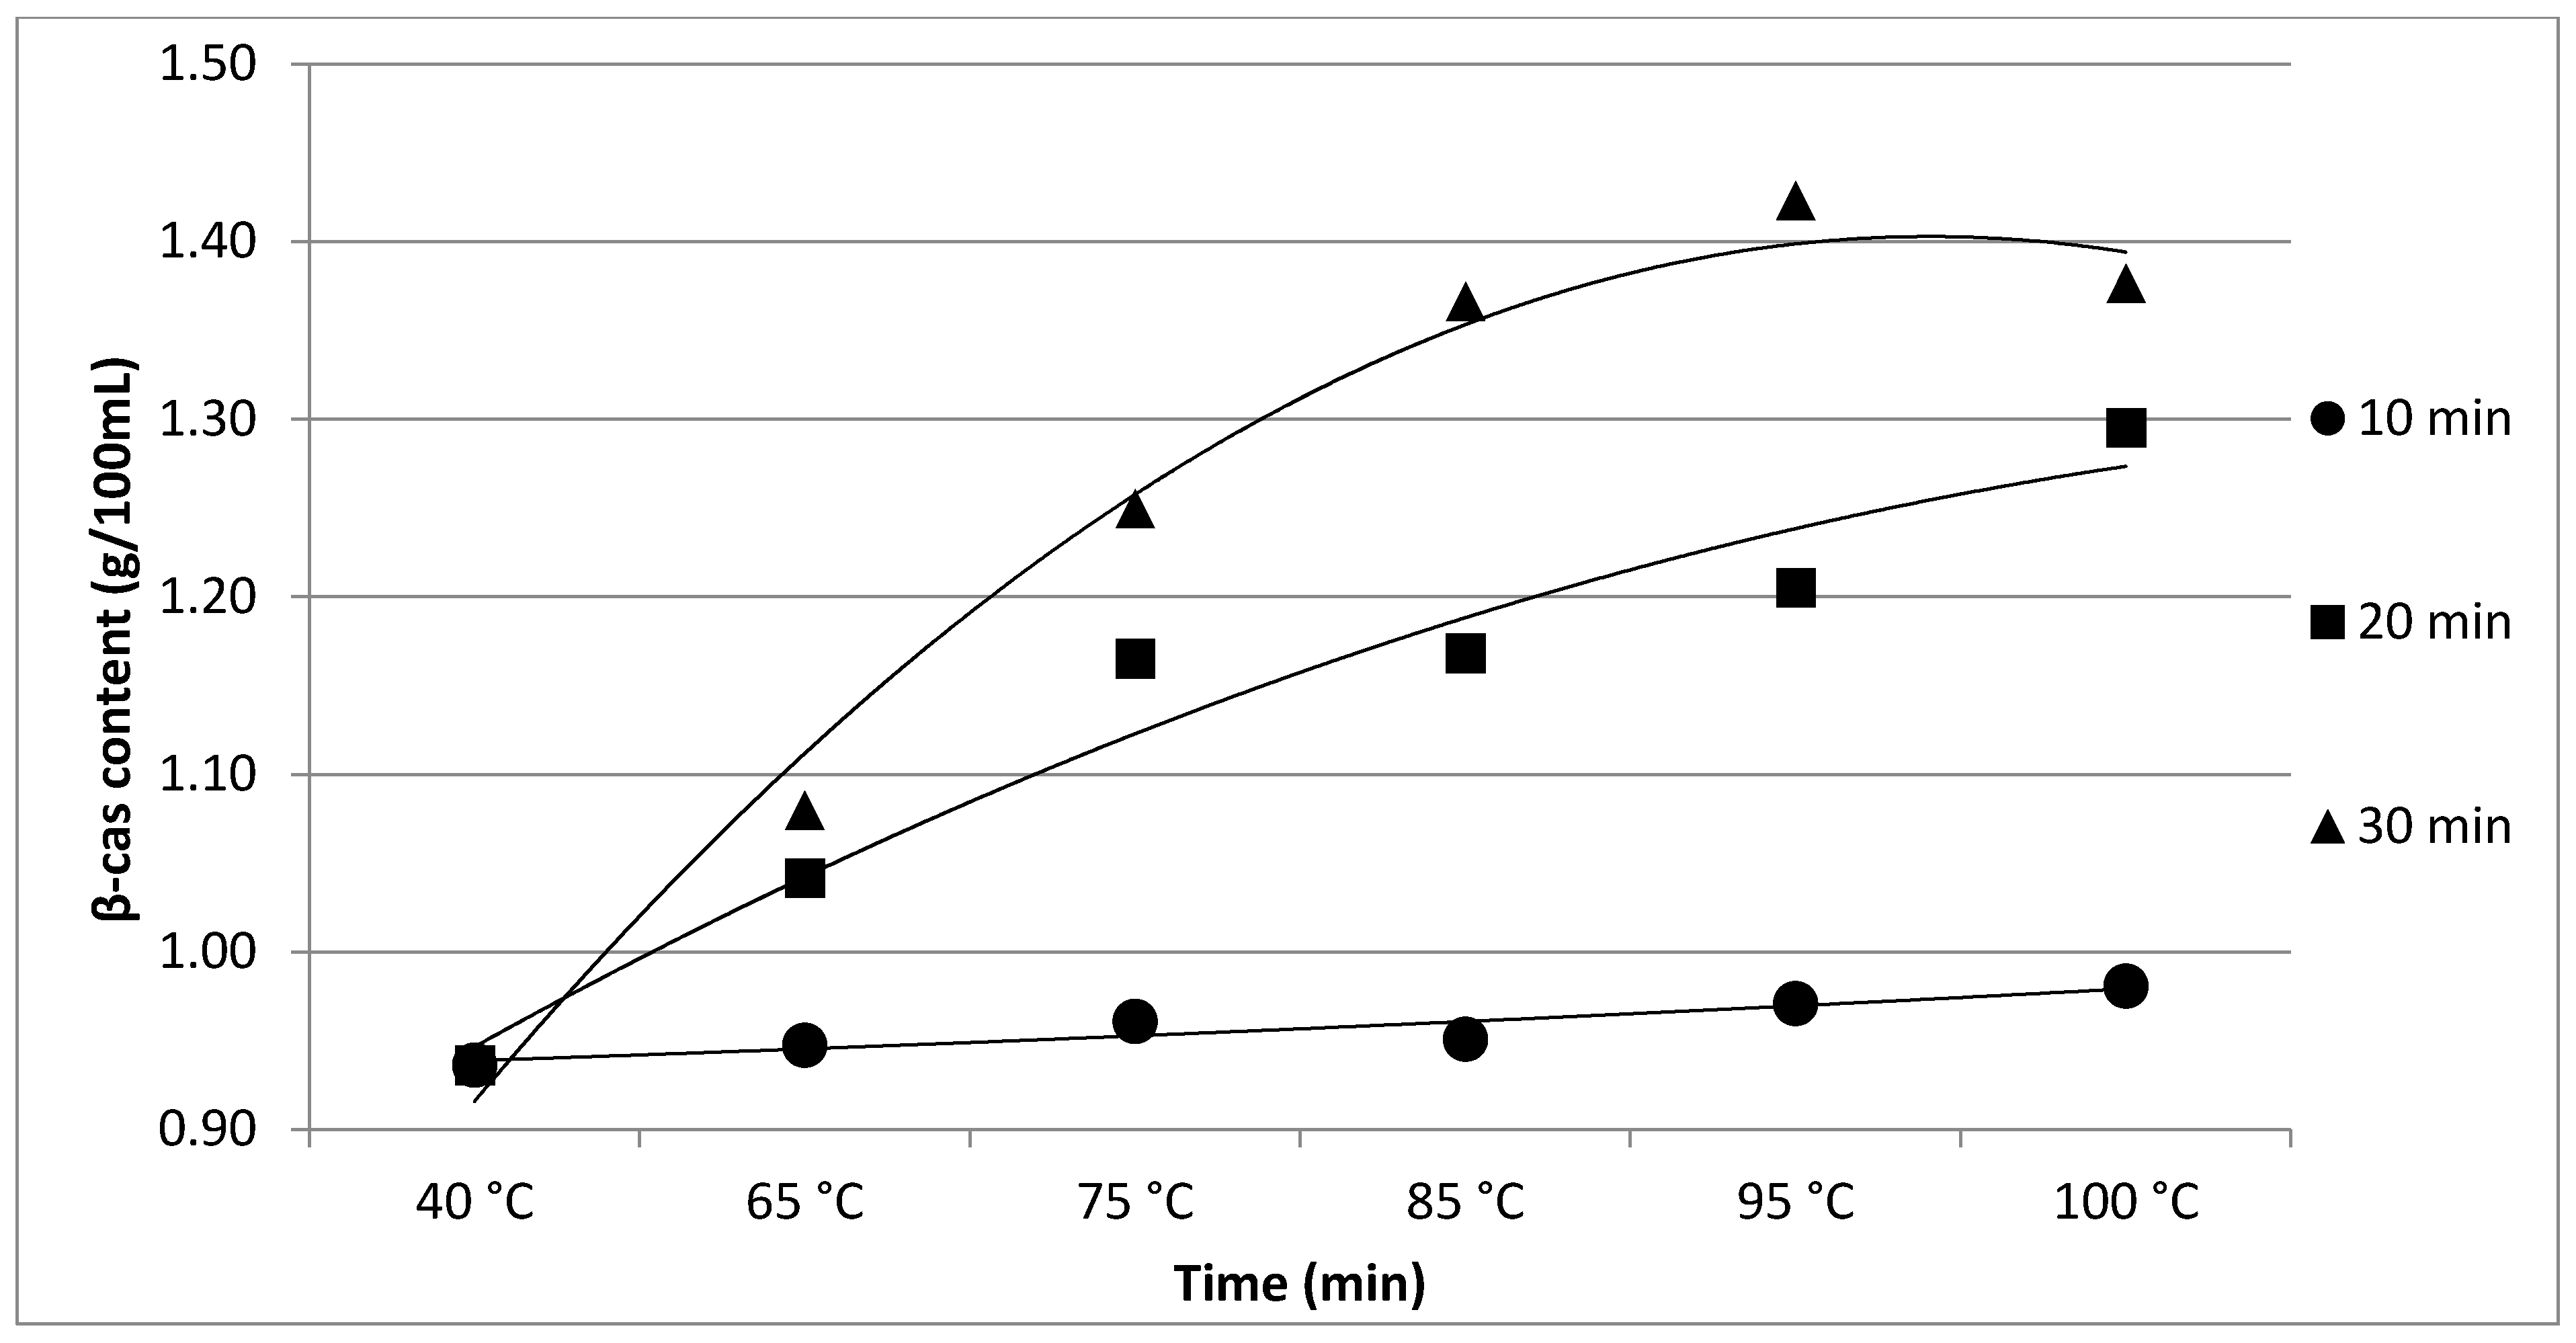
| β-cas | 0.94 c | 0.95 bc | 0.96 abc | 0.95 bc | 0.97 ab | 0.98 a | p < 0.05 | |
| ±0.02 | ±0.03 | ±0.01 | ±0.03 | ±0.01 | ±0.02 | |||
| κ-cas | 0.29 a | 0.28 a | 0.26 ab | 0.22 bc | 0.20 c | 0.20 c | p < 0.05 | |
| ±0.02 | ±0.03 | ±0.02 | ±0.03 | ±0.01 | ±0.02 | |||
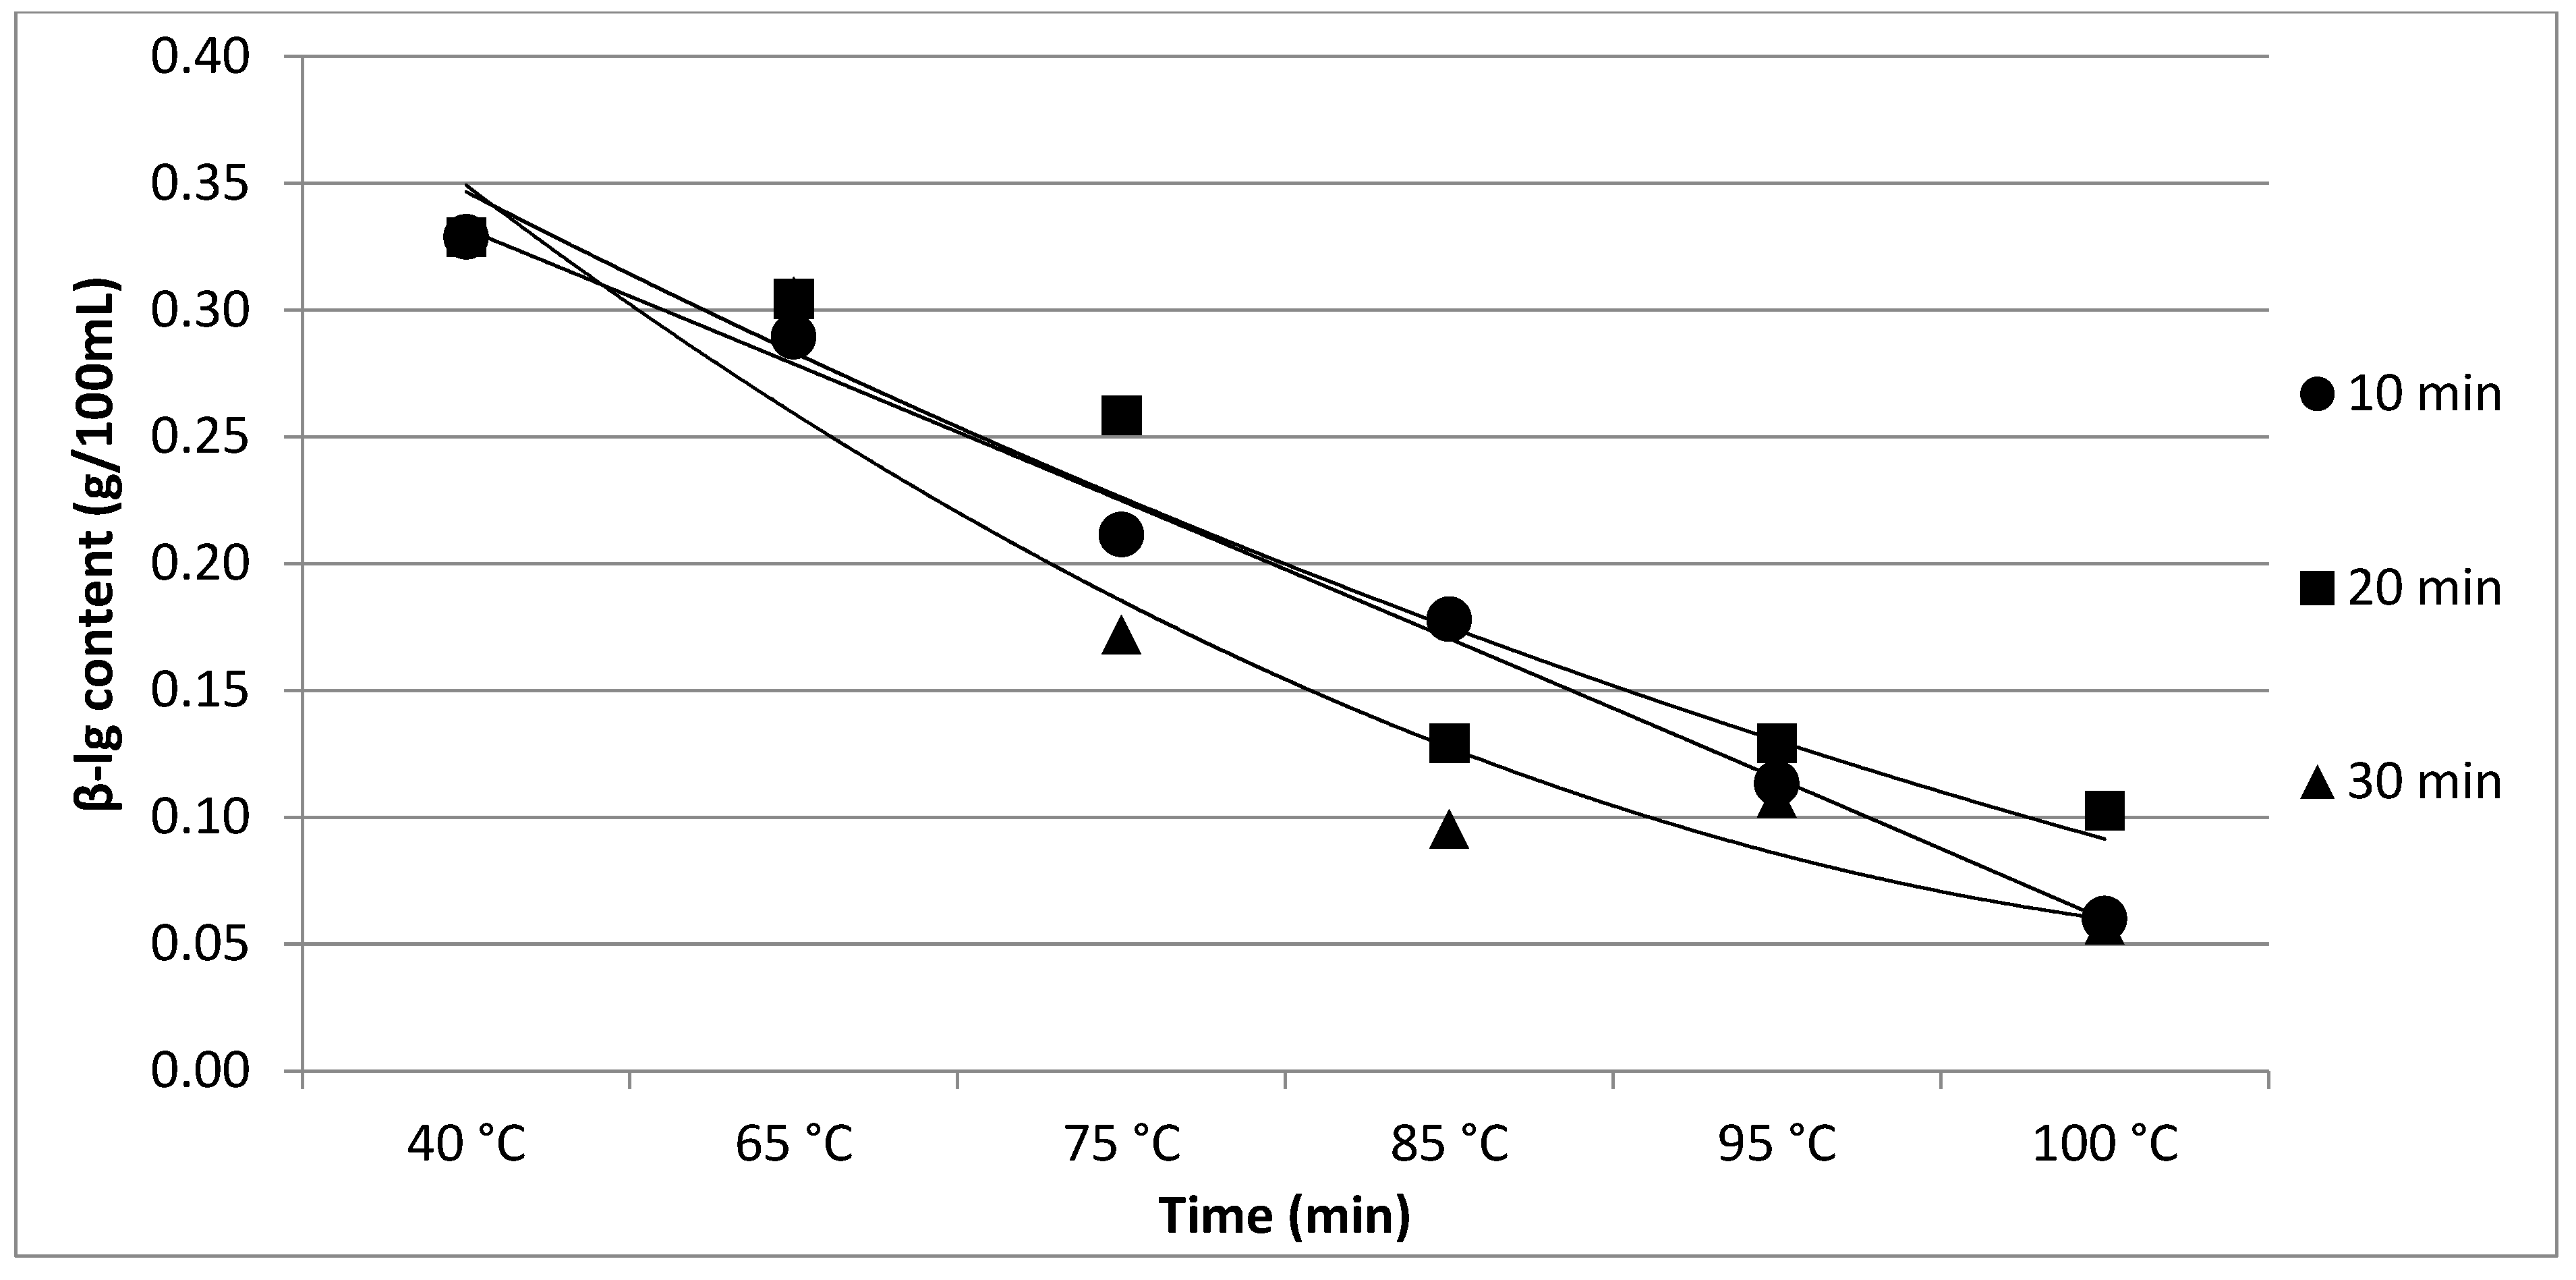
| β-lg | 0.33 a | 0.29 ab | 0.21 bc | 0.18 cd | 0.11 de | 0.06 e | p < 0.05 | |
| ±0.02 | ±0.03 | ±0.04 | ±0.04 | ±0.03 | ±0.05 | |||
| α-la | 0.14 a | 0.13 a | 0.09 b | 0.07 c | 0.03 d | 0.02 d | p < 0.05 | |
| ±0.02 | ±0.03 | ±0.02 | ±0.04 | ±0.01 | ±0.05 | |||
| 20 min | α-cas | 1.60 d | 1.66 cd | 1.71 bcd | 1.78 bc | 1.79 ab | 1.91 a | p < 0.05 |
| ±0.04 | ±0.01 | ±0.01 | ±0.02 | ±0.02 | ±0.02 | |||
| β-cas | 0.94 d | 1.04 c | 1.17 b | 1.17 b | 1.21 b | 1.30 a | p < 0.05 | |
| ±0.02 | ±0.03 | ±0.01 | ±0.04 | ±0.02 | ±0.03 | |||
| κ-cas | 0.29 a | 0.29 a | 0.27 ab | 0.24 bc | 0.21 c | 0.16 d | p < 0.05 | |
| ±0.02 | ±0.02 | ±0.03 | ±0.02 | ±0.01 | ±0.02 | |||
| β-lg | 0.33 a | 0.30 ab | 0.26 abc | 0.13 bc | 0.13 bc | 0.10 c | p < 0.05 | |
| ±0.03 | ±0.02 | ±0.03 | ±0.02 | ±0.05 | ±0.04 | |||
| α-la | 0.14a | 0.13 a | 0.06 b | 0.05 b | 0.03 c | 0.03 c | p < 0.05 | |
| ±0.02 | ±0.02 | ±0.02 | ±0.03 | ±0.02 | ±0.03 | |||
| 30 min | α-cas | 1.60 e | 1.69 d | 1.77 dc | 1.80 c | 2.01 b | 2.13 a | p < 0.05 |
| ±0.02 | ±0.03 | ±0.02 | ±0.03 | ±0.03 | ±0.02 | |||
| β-cas | 0.94 e | 1.08 d | 1.25 c | 1.37 b | 1.42 a | 1.38 b | p < 0.05 | |
| ±0.03 | ±0.03 | ±0.04 | ±0.02 | ±0.04 | ±0.05 | |||
| κ-cas | 0.29 a | 0.30 a | 0.26 a | 0.21 b | 0.08 c | 0.01 d | p < 0.05 | |
| ±0.03 | ±0.02 | ±0.03 | ±0.03 | ±0.02 | ±0.05 | |||
| β-lg | 0.33 a | 0.31 a | 0.17 b | 0.10 b | 0.11 b | 0.06 b | p < 0.05 | |
| ±0.03 | ±0.02 | ±0.03 | ±0.06 | ±0.05 | ±0.04 | |||
| α-la | 0.14 a | 0.12 a | 0.04 b | 0.03 bc | 0.02 bc | 0.01 d | p < 0.05 | |
| ±0.03 | ±0.03 | ±0.04 | ±0.03 | ±0.02 | ±0.04 | |||
| Heating Temperature | Protein Fraction | Heating Time | |||||||
|---|---|---|---|---|---|---|---|---|---|
| Raw Milk | 5 min | 10 min | 15 min | 20 min | 25 min | 30 min | p-Value | ||
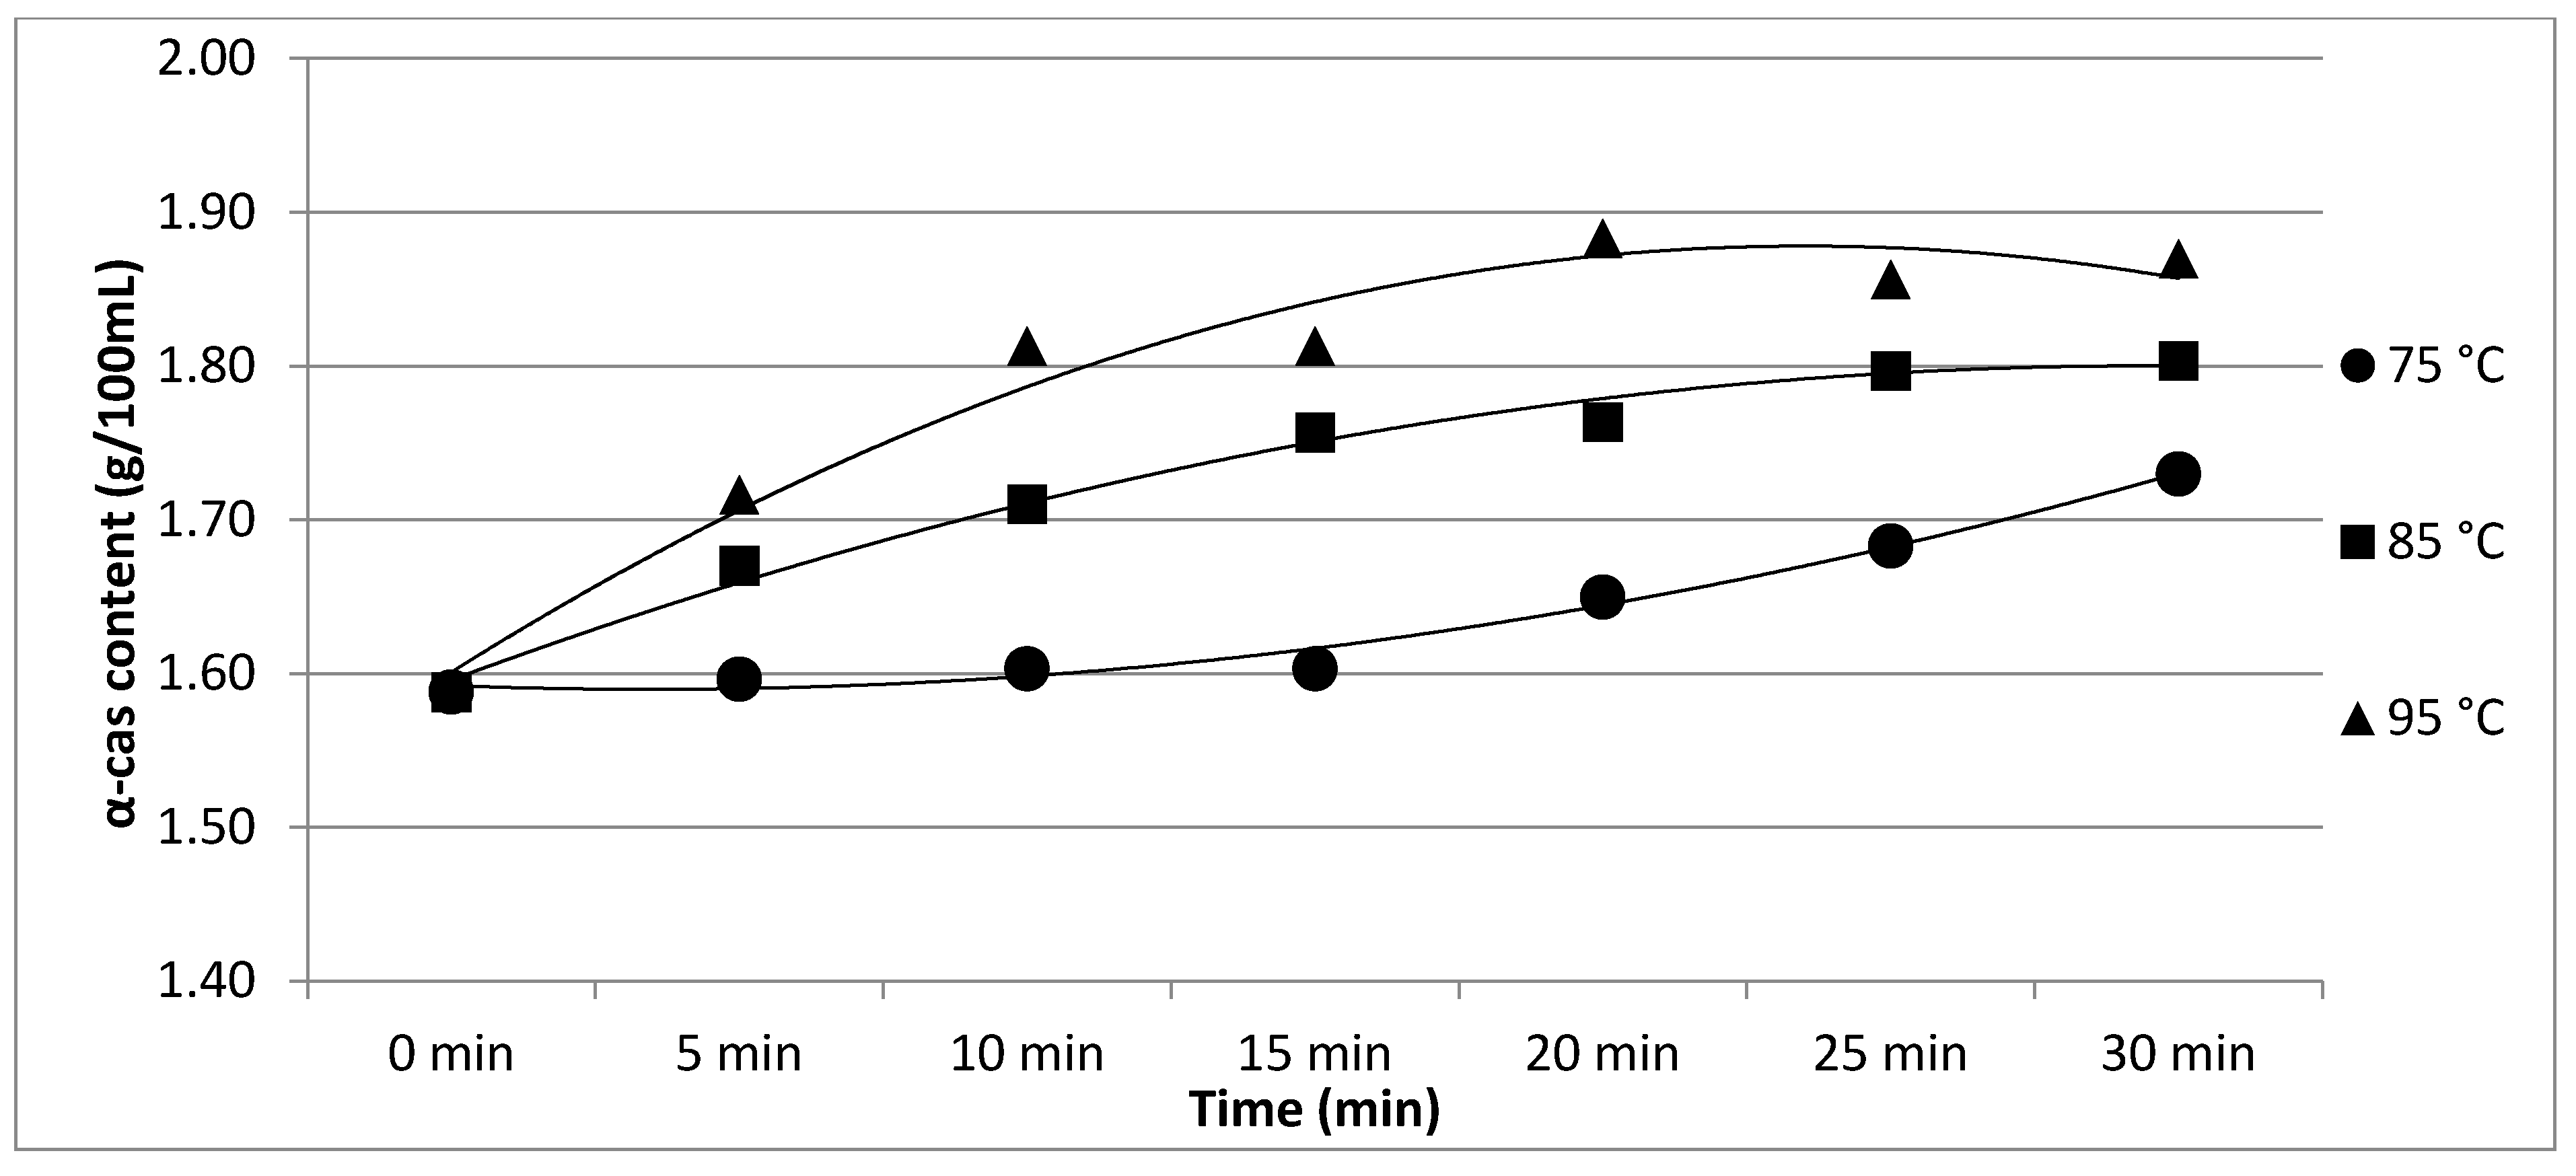
| 75 °C | α-cas | 1.59 b | 1.60 b | 1.60 b | 1.60 b | 1.65 ab | 1.68 ab | 1.73 a | p < 0.05 |
| ±0.07 | ±0.05 | ±0.02 | ±0.04 | ±0.02 | ±0.04 | ±0.07 | |||
| β-cas | 0.94 c | 0.96 c | 0.98 c | 0.98 c | 1.01 bc | 1.08 b | 1.17 a | p < 0.05 | |
| ±0.04 | ±0.04 | ±0.03 | ±0.04 | ±0.03 | ±0.04 | ±0.10 | |||
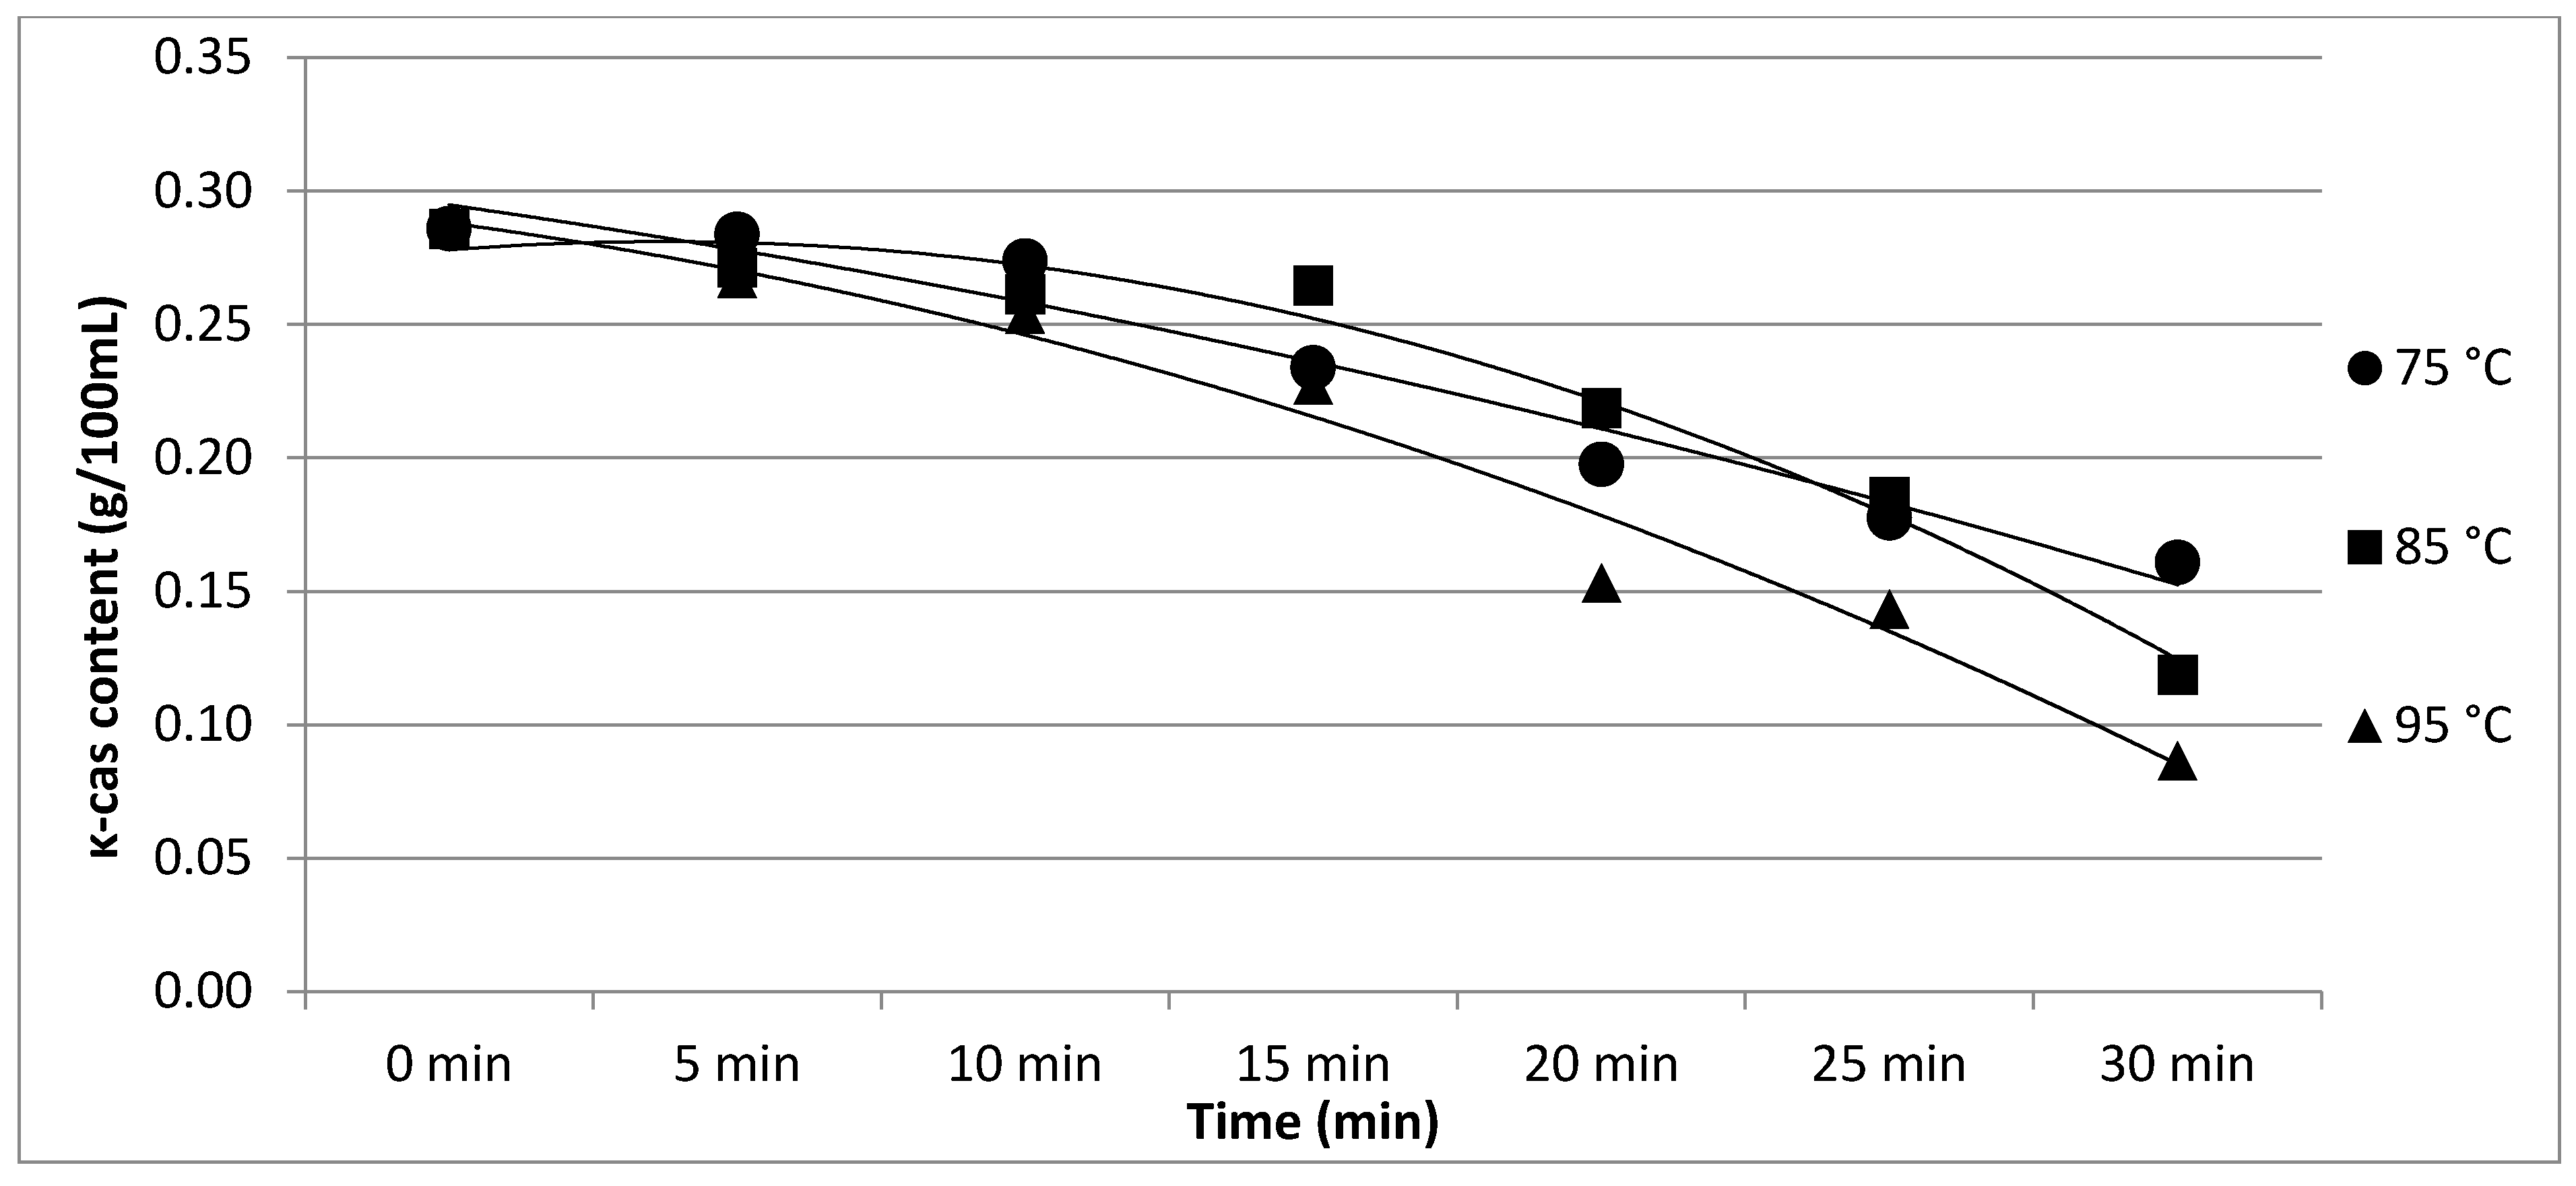
| κ-cas | 0.29 a | 0.28 a | 0.27 a | 0.23 ab | 0.20 bc | 0.18 c | 0.16 c | p < 0.05 | |
| ±0.04 | ±0.04 | ±0.04 | ±0.05 | ±0.05 | ±0.04 | ±0.04 | |||
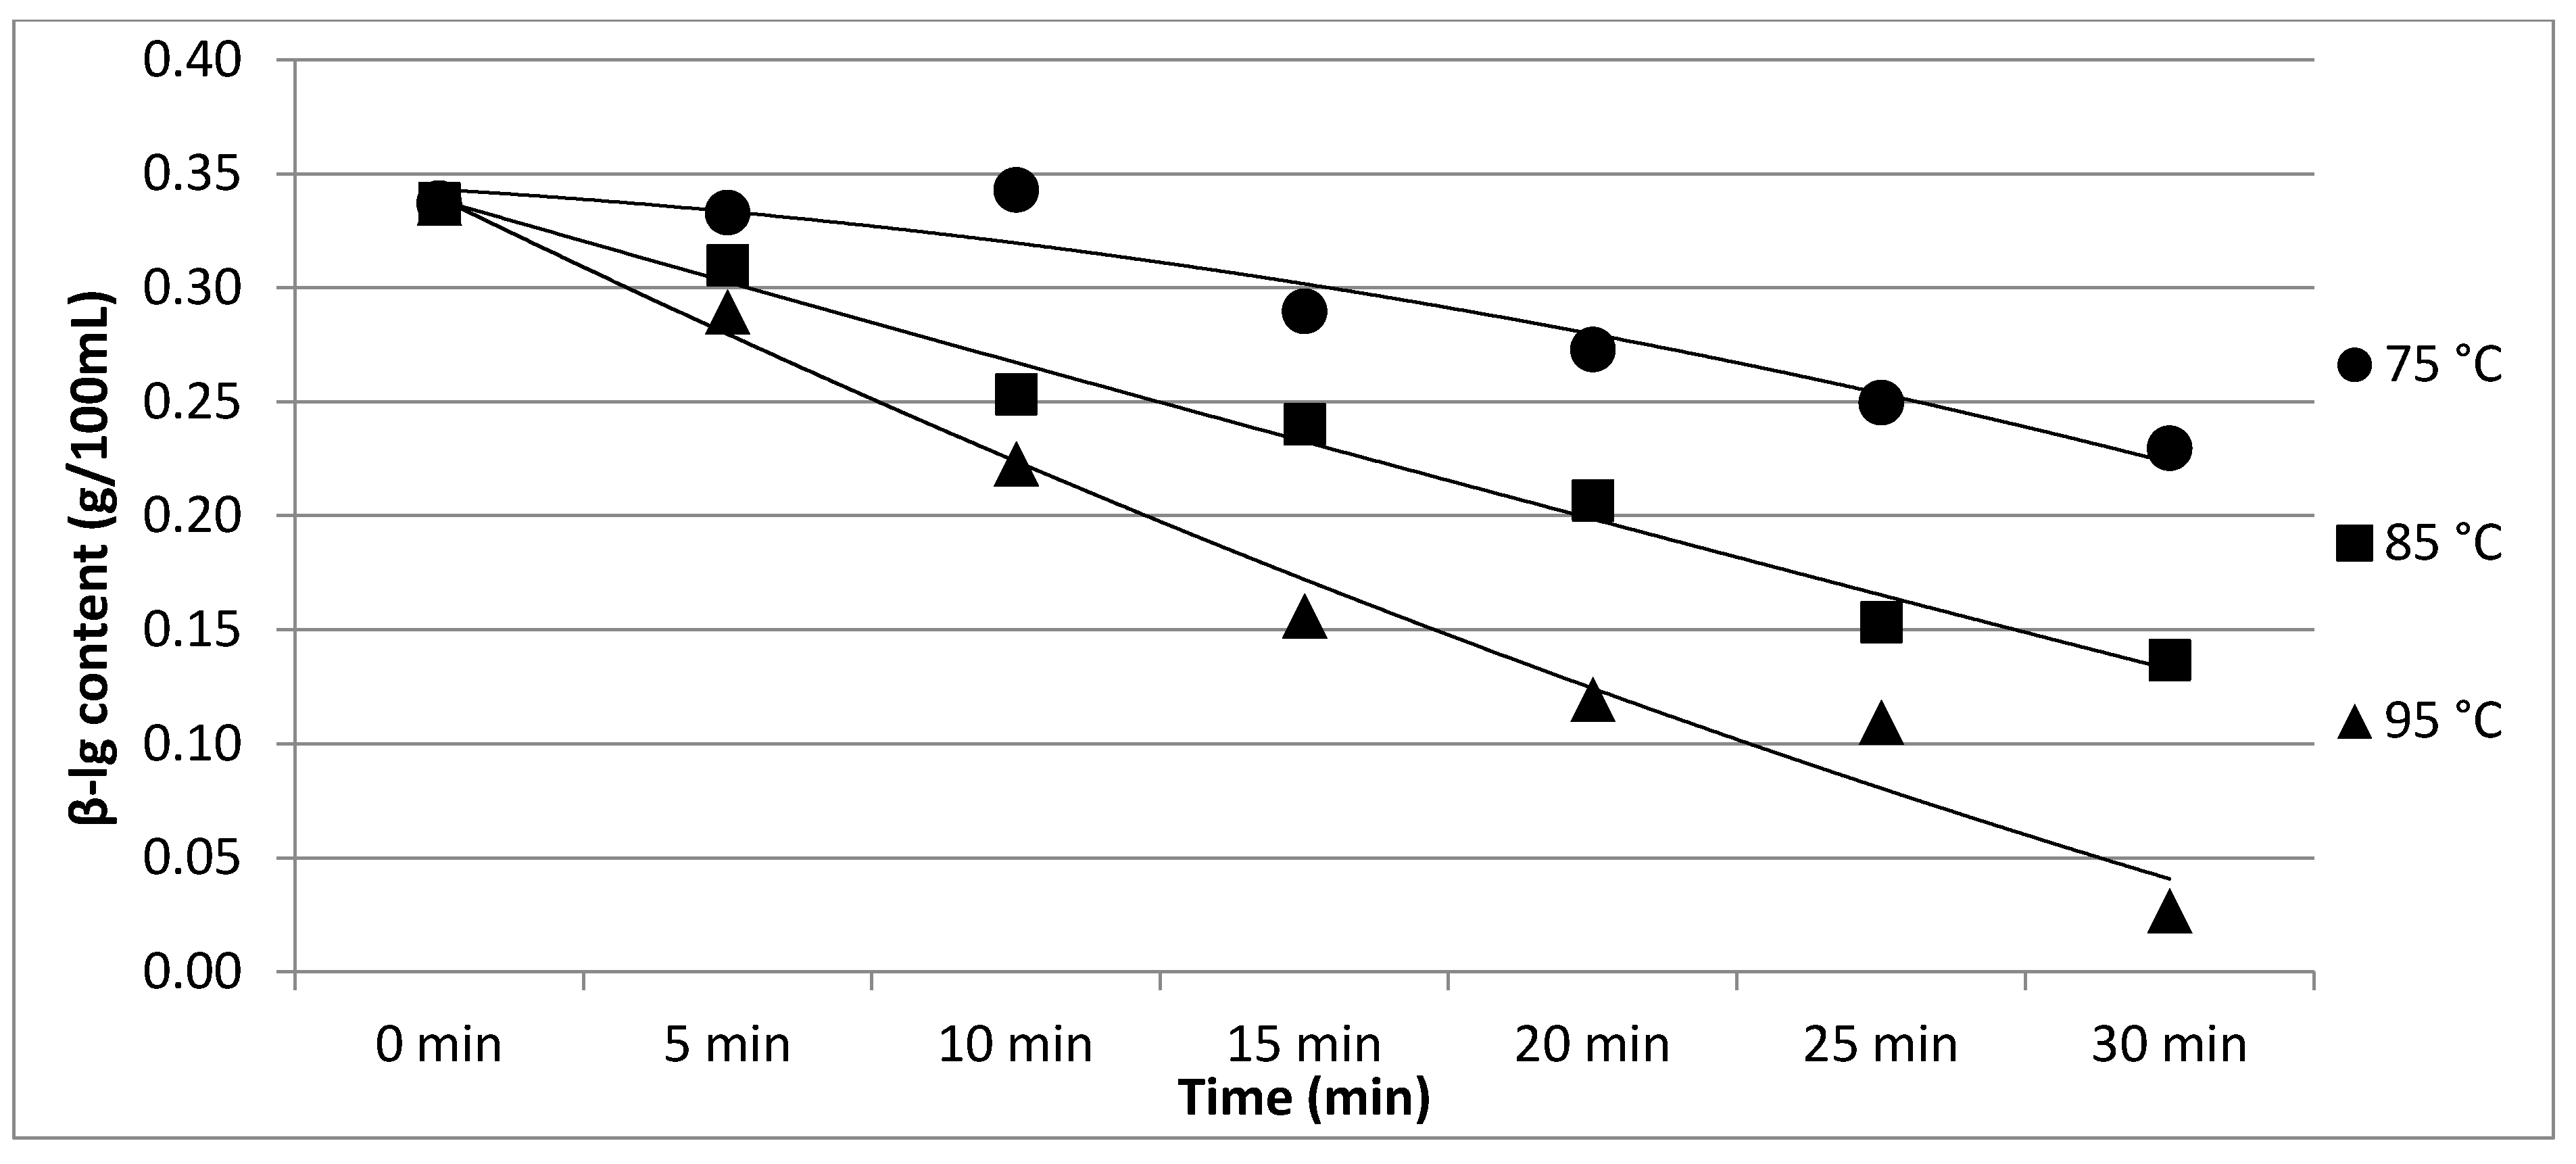
| β-lg | 0.34 a | 0.33 a | 0.34 a | 0.29 b | 0.27 bc | 0.25 cd | 0.23 d | p < 0.05 | |
| ±0.04 | ±0.03 | ±0.03 | ±0.04 | ±0.03 | ±0.04 | ±0.05 | |||
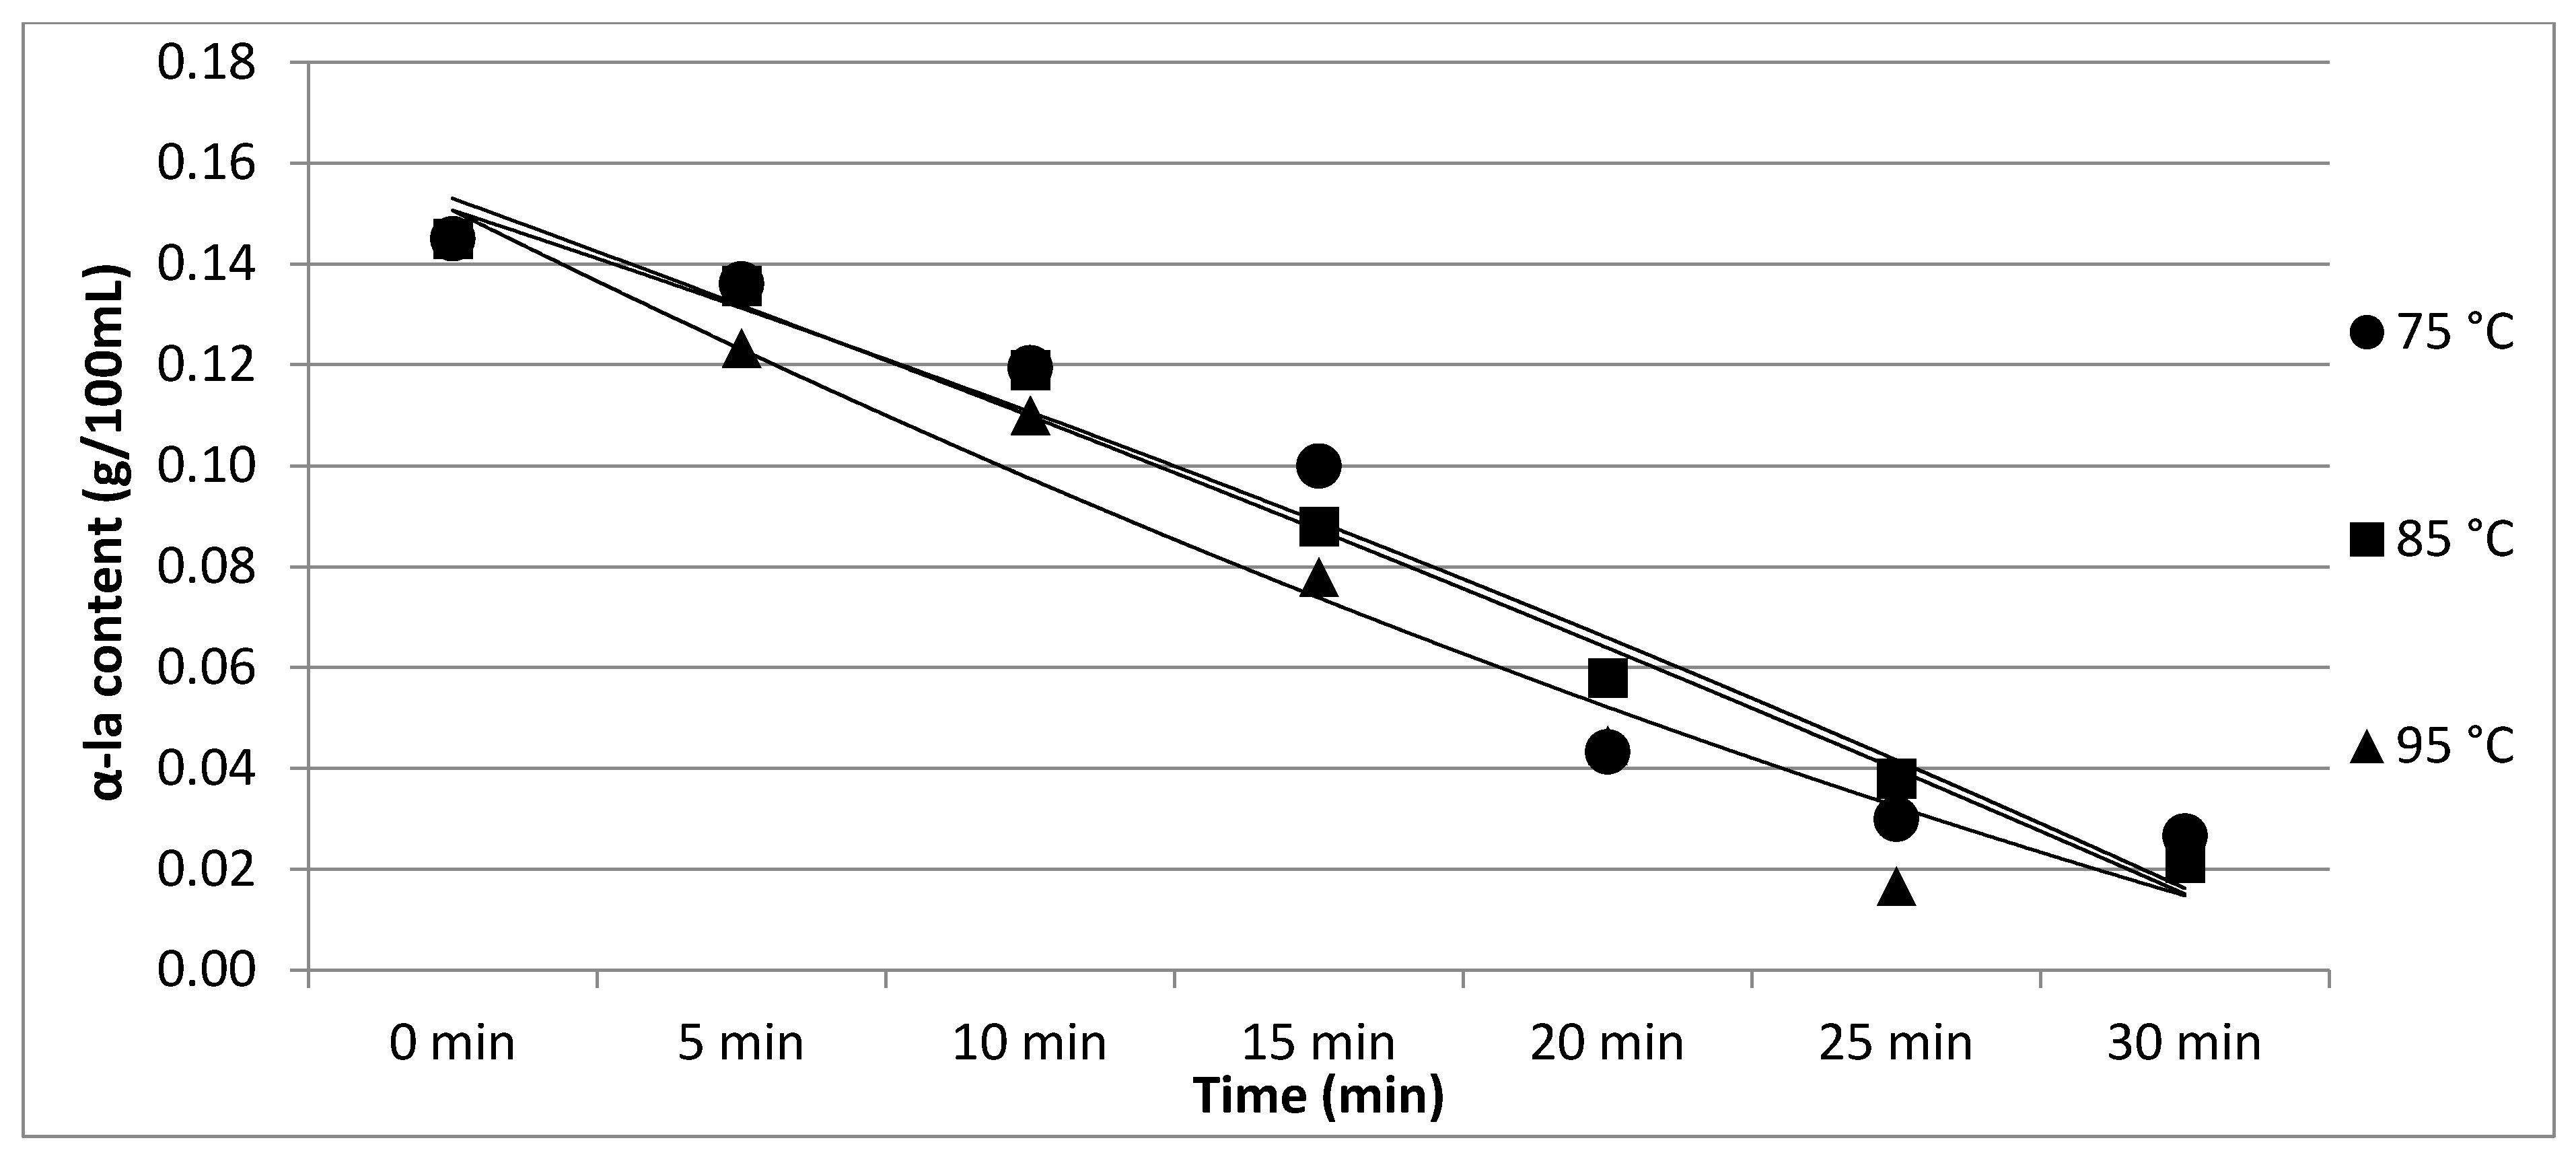
| α-la | 0.15 a | 0.14 a | 0.12 a | 0.10 ab | 0.04 bc | 0.03 c | 0.03 c | p < 0.05 | |
| ±0.03 | ±0.03 | ±0.04 | ±0.03 | ±0.03 | ±0.03 | ±0.02 | |||
| 85 °C | α-cas | 1.59 e | 1.67 d | 1.71 c | 1.76 b | 1.76 b | 1.80 a | 1.80 a | p < 0.05 |
| ±0.04 | ±0.05 | ±0.06 | ±0.04 | ±0.03 | ±0.04 | ±0.03 | |||
| β-cas | 0.94 e | 0.98 d | 0.99 d | 1.06 c | 1.09 b | 1.10 b | 1.13 a | p < 0.05 | |
| ±0.04 | ±0.04 | ±0.03 | ±0.04 | ±0.03 | ±0.05 | ±0.03 | |||
| κ-cas | 0.29 a | 0.27 a | 0.26 a | 0.26 a | 0.22 ab | 0.19 b | 0.12 c | p < 0.05 | |
| ±0.04 | ±0.05 | ±0.03 | ±0.04 | ±0.03 | ±0.04 | ±0.05 | |||
| β-lg | 0.34 a | 0.31 b | 0.25 c | 0.24 c | 0.21 d | 0.15 e | 0.14 e | p < 0.05 | |
| ±0.04 | ±0.04 | ±0.03 | ±0.04 | ±0.04 | ±0.03 | ±0.04 | |||
| α-la | 0.15 a | 0.14 a | 0.12 ab | 0.09 bc | 0.06 cd | 0.04 d | 0.02 d | p < 0.05 | |
| ±0.03 | ±0.03 | ±0.04 | ±0.05 | ±0.04 | ±0.03 | ±0.03 | |||
| 95 °C | α-cas | 1.59 d | 1.72 c | 1.81 b | 1.81 b | 1.88 a | 1.86 a | 1.87 a | p < 0.05 |
| ±0.04 | ±0.05 | ±0.04 | ±0.03 | ±0.04 | ±0.05 | ±0.04 | |||
| β-cas | 0.94 f | 0.98 e | 1.05 d | 1.06 cd | 1.08 bc | 1.10 b | 1.16 a | p < 0.05 | |
| ±0.03 | ±0.03 | ±0.04 | ±0.04 | ±0.04 | ±0.04 | ±0.03 | |||
| κ-cas | 0.29 a | 0.27 ab | 0.25 ab | 0.23 b | 0.15 c | 0.14 c | 0.09 d | p = 0.10 | |
| ±0.05 | ±0.04 | ±0.06 | ±0.04 | ±0.05 | ±0.04 | 0.100 | |||
| β-lg | 0.34 a | 0.29 b | 0.22 c | 0.165 d | 0.12 e | 0.11 e | 0.03 f | p < 0.05 | |
| ±0.04 | ±0.04 | ±0.03 | ±0.04 | ±0.04 | ±0.06 | ±0.05 | |||
| α-la | 0.15 a | 0.12 a | 0.11 a | 0.08 b | 0.04 c | 0.02 c | 0.03 c | p < 0.05 | |
| ±0.03 | ±0.03 | ±0.05 | ±0.03 | ±0.05 | ±0.03 | ±0.05 | |||
| Protein Fraction | Two-Way ANOVA (p-Value) | ||
|---|---|---|---|
| Factor Temperature | Factor Time | Factor Interaction (Temperature × Time) | |
| Experiment 1 | |||
| α-cas | <0.05 (0.00) | <0.05 (0.00) | <0.05 (0.00) |
| β-cas | <0.05 (0.00) | <0.05 (0.00) | <0.05 (0.00) |
| κ-cas | <0.05 (0.00) | <0.05 (0.00) | <0.05 (0.00) |
| β-lg | <0.05 (0.00) | <0.05 (0.00) | <0.05 (0.00) |
| α-la | <0.05 (0.00) | <0.05 (0.00) | <0.05 (0.00) |
| Experiment 2 | |||
| α-cas | <0.05 (0.00) | <0.05 (0.00) | <0.05 (0.00) |
| β-cas | <0.05 (0.00) | <0.05 (0.00) | <0.05 (0.00) |
| κ-cas | <0.05 (0.00) | <0.05 (0.00) | <0.05 (0.00) |
| β-lg | <0.05 (0.00) | <0.05 (0.00) | <0.05 (0.00) |
| α-la | <0.05 (0.00) | <0.05 (0.00) | <0.05 (0.00) |
4. Conclusions
Author Contributions
Funding
Institutional Review Board Statement
Informed Consent Statement
Data Availability Statement
Conflicts of Interest
References
- Kubicová, Ľ.; Predanocyová, K.; Kádeková, Z. The importance of milk and dairy products consumption as a part of rational nutrition. Potrovanirastvo Slovak J. Food Sci. 2019, 13, 234–243. [Google Scholar] [CrossRef] [Green Version]
- Farrell, H.M.; Jimenez-Flores, R., Jr.; Bleck, G.T.; Brown, E.M.; Butler, J.E.; Creamer, L.K.; Hicks, C.L.; Hollar, C.M.; Ng-Kwai-Hang, K.F.; Swaisgood, H.E. Nomenclature of the proteins of cows’ milk-sixth revision. J. Dairy Sci. 2004, 87, 1641–1674. [Google Scholar] [CrossRef] [Green Version]
- Goff, H.D.; Hill, A.R. Chemistry and physics. In Dairy Science and Technology Handbook; VCH Publishers: New York, NY, USA, 1993; pp. 1–82. [Google Scholar]
- Zajác, P.; Beňová, E.; Židek, R.; Čapla, J.; Benešová, L.; Čurlej, J.; Golian, J. Detection of adulteration of traditional Slovak bryndza ewe’s cheese with cow’s lump cheese by isoelectric focusing of gamma caseins. Int. J. Food Prop. 2021, 24, 1034–1060. [Google Scholar] [CrossRef]
- Zajác, P.; Čapla, J.; Vietoris, V.; Zubrická, S.; Čurlej, J. Effects of storage on the major constituents of raw milk. Potrovanirastvo Slovak J. Food Sci. 2015, 9, 375–381. [Google Scholar] [CrossRef] [Green Version]
- Fišera, M.; Kráčmar, S.; Šustová, K.; Tvrzník, P.; Velichová, H.; Fišerová, L.; Kubáň, V. Effects of the lactation period, breed and feed on amino acids profile of mare’s milk. Potrovanirastvo Slovak J. Food Sci. 2020, 14, 562–572. [Google Scholar] [CrossRef]
- Tančin, V.; Mikláš, Š.; Čobirka, M.; Uhrinčať, M.; Mačuhová, L. Factors affecting raw milk quality of dairy cows under practical conditions. Potrovanirastvo Slovak J. Food Sci. 2020, 14, 744–749. [Google Scholar] [CrossRef]
- Del Angel, C.R.; Dalgleish, D.G. Structures and some properties of soluble protein complexes formed by the heating of reconstituted skim milk powder. Food Res. Int. 2006, 39, 472–479. [Google Scholar] [CrossRef]
- Qian, F.; Sun, J.; Cao, D.; Tuo, Y.; Jiang, S.; Mu, G. Experimental and modelling study of the denaturation of milk protein by heat treatment. Korean J. Food Sci. Anim. Resour. 2017, 37, 44–51. [Google Scholar] [CrossRef] [Green Version]
- Boor, K.J.; Wiedmann, M.; Murphy, S.; Alcaine, S. A 100-year review: Microbiology and safety of milk handling. J. Dairy Sci. 2017, 100, 9933–9951. [Google Scholar] [CrossRef] [Green Version]
- Oliver, S.P.; Jayarao, B.M.; Almeida, R.A. Foodborne pathogens in milk and the dairy farm environment: Food safety and public health implications. Foodborne Pathog. Dis. 2005, 2, 115–129. [Google Scholar] [CrossRef] [Green Version]
- Claeys, L.; Cardoen, S.; Daube, G.; De Block, J.; Dewettinck, K.; Dierick, K.; De Zutter, L.; Huyghebaert, A.; Imberechts, H.; Thiange, P.; et al. Raw or heated cow milk consumption: Review of risks and benefits. Food Control 2013, 31, 251–262. [Google Scholar] [CrossRef]
- McKinnon, I.R.; Yap, S.E.; Augustin, M.A.; Memar, Y. Diffusing-wave spectroscopy investigation of heated reconstituted skim milks containing calcium chloride. Food Hydrocoll. 2009, 23, 1127–1133. [Google Scholar] [CrossRef]
- Ševcová, K.; Zajác, P.; Čapla, J.; Čurlej, J. Development of the food act of the Slovak Republic from 1995 to 2021. Potrovanirastvo Slovak J. Food Sci. 2021, 15, 982–994. [Google Scholar] [CrossRef]
- Croguennec, T.; Kennedy, B.T.; Mehra, R. Heat-induced denaturation/aggregation of b-lactoglobulin A and B: Kinetics of the first intermediates formed. Int. Dairy J. 2004, 14, 399–409. [Google Scholar] [CrossRef]
- Donato, L.; Guyomarc’h, F.; Amiot, S.; Dalgleish, D.G. Formation of whey protein/k-casein complexes in heated milk: Preferential reaction of whey protein with k-casein in the casein micelles. Int. Dairy J. 2007, 17, 1161–1167. [Google Scholar] [CrossRef]
- Joyce, A.M.; Brodkorb, A.; Kelly, A.L.; O’Mahony, J.A. Separation of the effects of denaturation and aggregation on whey casein protein interactions during the manufacture of a model infant formula. Dairy Sci. Technol. 2017, 96, 787–806. [Google Scholar] [CrossRef] [Green Version]
- Vasbinder, A.J.; de Kruif, C.G. Casein–whey protein interactions in heated milk: The influence of pH. Int. Dairy J. 2003, 13, 669–677. [Google Scholar] [CrossRef]
- Anema, S.G.; Li, Y. Association of denatured whey proteins with casein micelles in heated reconstituted skim milk and its effect on casein micelle size. J. Dairy Res. 2003, 70, 73–83. [Google Scholar] [CrossRef]
- Donato, L.; Guyomarćh, F. Formation and properties of the whey protein/j-casein complexes in heated skim milk—A review. Dairy Sci. Technol. 2009, 89, 3–29. [Google Scholar] [CrossRef]
- Mulvihill, D.M.; Donovan, M. Whey proteins and their thermal denaturation—A review. Irish J. Food Sci. Technol. 1987, 11, 43–75. [Google Scholar]
- Brodkorb, A.; Croguennec, T.; Bouhallab, S.; Kehoe, J.J. Heat-induced denaturation, aggregation and gelation of whey proteins. In Advanced Dairy Chemistry; Springer: New York, NY, USA, 2016; pp. 155–178. [Google Scholar]
- Anema, S.G.; Lee, S.K.; Klostermeyer, H. Effect of protein, nonsoluble components, and lactose concentrations on the irreversible thermal denaturation of b-lactoglobulin and a-lactalbumin in skim milk. J. Agric. Food Chem. 2006, 54, 7339–7348. [Google Scholar] [CrossRef] [PubMed]
- Liyanaarachchi, W.S.; Vasiljevic, T. Caseins and their interactions that modify heat aggregation of whey proteins in commercial dairy mixtures. Inter. Dairy J. 2018, 83, 43–51. [Google Scholar] [CrossRef]
- Mounsey, J.S.; O’Kennedy, B.T. Heat-stabilisation of beta-lactoglobulin through interaction with sodium caseinate. Milchwissenschaft 2010, 65, 79–83. [Google Scholar]
- Gaspard, S.J.; Auty, M.A.; Kelly, A.L.; O’Mahony, J.A.; Brodkorb, A. Isolation and characterisation of j-casein/whey protein particles from heated milk protein concentrate and role of j-casein in whey protein aggregation. Int. Dairy J. 2017, 73, 98–108. [Google Scholar] [CrossRef]
- Patocka, G.; Jelen, P.; Kalab, M. Thermostability of skim milk with modified casein/whey protein content. Int. Dairy J. 1993, 3, 35–48. [Google Scholar] [CrossRef]
- Chevallier, M.; Riaublanc, A.; Lopez, C.; Hamon, P.; Rousseau, F.; Croguennec, T. Aggregated whey proteins and trace of caseins synergistically improve the heat stability of whey protein-rich emulsions. Food Hydrocoll. 2016, 61, 487–495. [Google Scholar] [CrossRef]
- EC, Commission Regulation (EC). No 676/2008 of 16 July 2008 Registering Certain Names in the Register of Protected Designations of Origin and Protected Geographical Indications (Ail De La Drôme (PGI), Všestarská Cibule (PDO), Slovenská Bryndza (PGI), Ajo Morado De Las Pedroñeras (PGI), Gamoneu or Gamonedo (PDO), Alheira De Vinhais (PGI), Presunto De Vinhais or Presunto Bísaro De Vinhais (PGI)). Off. J. Eur. Union 2008, 51, 19–20. [Google Scholar]
- ISO 707:2011-01; Milk and Milk Products. Guidance on Sampling. International Standard Organization, PTN: Bratislava, Slovakia, 2008.
- Reichardt, W.; Schüler, E. Die quantitative Bestimmung des Proteingehaltes der Milch mittels Ultraviolettspektralphotometrie 2. Mitt. Zur Eignung der Differenz der Absorbanzwerte bei 235 und 280 nm für die quantitative Milchproteinanalytik. Food/Nahrung 1984, 28, 1019–1027. [Google Scholar] [CrossRef]
- SERVA. Product Information. Excellent Gel Kit NF 15% for 1D SDS PAGE. 2021. Available online: https://www.serva.de/www_root/documents/43426%20Excellent%20Gel%20Kit%20NF%2015%20(E)%20Ver%20022021.pdf (accessed on 2 February 2022).
- SERVA. Electrophoresis, Instruction Manual. 2011. Available online: https://www.serva.de/www_root/documents/1D%20SDS%20gels%20Vers%200211.pdf (accessed on 2 February 2022).
- Kelleher, C.M.; Aydogdu, T.; Murphy, K.M.; O’Mahony, J.A.; Kelly, A.L.; O’Callaghan, D.J.; McCarthy, N.A. The effect of protein profile and preheating on denaturation of whey proteins and development of viscosity in milk protein beverages during heat treatment. Int. J. Dairy Technol. 2020, 73, 494–501. [Google Scholar] [CrossRef]
- Ryan, K.N.; Foegeding, E.A. Formation of soluble whey protein aggregates and their stability in beverages. Food Hydrocoll. 2015, 43, 265–274. [Google Scholar] [CrossRef]
- Vasbinder, A.J.; Alting, A.C.; de Kruif, K.G. Quantification of heat-induced casein-whey protein interactions in milk and its relation to gelation kinetics. Colloids Surf. B Biointerfaces 2003, 31, 115–123. [Google Scholar] [CrossRef]
- Fitzsimons, S.M.; Mulvihill, D.M.; Morris, E.R. Denaturation and aggregation processes in thermal gelation of whey proteins resolved by differential scanning calorimetry. Food Hydrocoll. 2007, 21, 638–644. [Google Scholar] [CrossRef]
- Pesic, M.B.; Barac, M.B.; Stanojevic, S. Heat induced casein-whey protein interactions at natural pH of milk: A comparison between caprine and bovine milk. Small Rumin. Res. 2012, 108, 77–86. [Google Scholar] [CrossRef]
- Singh, H.; Roberts, M.S.; Munro, P.A. Acid-induced dissociation of casein micelles in milk: Effects of heat treatment. J. Dairy Sci. 1996, 79, 1340–1346. [Google Scholar] [CrossRef]
- Guyomarch, F.; Law, A.; Dalgleish, D. Formation of soluble and micelle-bound aggregates in heated milk. J. Agric. Food Chem. 2003, 51, 4652–4660. [Google Scholar] [CrossRef]
- Patel, H.A.; Singh, H.; Anema, S.G.; Creamer, L.K. Effects of heat and high hydrostatic pressure treatments on disulfide bonding interchanges among the proteins in skim milk. J. Agric. Food Chem. 2006, 54, 3409–3420. [Google Scholar] [CrossRef]
- Jovanovic, S.; Barac, M.; Macej, O. SDS-PAGE analysis of soluble proteins in reconstituted milk exposed to different heat treatments. Sensors 2007, 7, 371–383. [Google Scholar] [CrossRef] [Green Version]
- Waungana, A.; Singh, H.; Bennett, R.J. Influence of denaturation and aggregation of β-lactoglobulin on rennet coagulation properties of skim milk and ultrafiltered milk. Food Res. Int. 1996, 29, 715–721. [Google Scholar] [CrossRef]


| Experiment 1 | |||||||
| Time | Protein | Temperature | |||||
| 65 °C | 75 °C | 85 °C | 95 °C | 100 °C | - | ||
| 10 min | α-cas | 1.2 | 2.3 | 7.1 | 9.8 | 12.7 | - |
| β-cas | 1.2 | 2.6 | 1.6 | 3.7 | 4.8 | - | |
| κ-cas | −2.0 | −10.0 | −25.0 | −30.7 | −30.7 | - | |
| β-lg | −12.0 | −35.7 | −45.8 | −65.5 | −81.8 | - | |
| α-la | −5.8 | −37.8 | −52.1 | −76.1 | −85.6 | - | |
| 20 min | α-cas | 3.7 | 6.8 | 11.2 | 12.2 | 19.7 | - |
| β-cas | 11.3 | 24.4 | 24.8 | 28.7 | 38.3 | - | |
| κ-cas | −1.7 | −8.6 | −17.8 | −27.0 | −45.4 | - | |
| β-lg | −7.4 | −21.4 | −60.7 | −60.7 | −68.8 | - | |
| α-la | −9.7 | −54.5 | −61.7 | −80.8 | −80.8 | - | |
| 30 min | α-cas | 5.9 | 10.9 | 12.6 | 25.5 | 33.0 | - |
| β-cas | 15.3 | 33.5 | 45.9 | 52.0 | 47.0 | - | |
| κ-cas | 2.4 | −9.3 | −26.5 | −73.6 | −96.6 | - | |
| β-lg | −7.1 | −47.7 | −71.0 | −67.3 | −82.5 | - | |
| α-la | −13.7 | −71.3 | −76.1 | −83.2 | −90.4 | - | |
| Experiment 2 | |||||||
| Temperature | Protein | Time | |||||
| 5 min | 10 min | 15 min | 20 min | 25 min | 30 min | ||
| 75 °C | α-cas | 0.5 | 0.4 | 0.0 | 2.9 | 2.0 | 2.8 |
| β-cas | 2.3 | 2.4 | −0.3 | 3.4 | 6.6 | 8.3 | |
| κ-cas | −0.8 | −3.5 | −14.6 | −15.5 | −10.1 | −9.4 | |
| β-lg | −1.2 | 3.0 | −15.6 | −5.8 | −8.5 | −8.0 | |
| α-la | −6.2 | −12.2 | −16.3 | −56.7 | −30.8 | −11.1 | |
| 85 °C | α-cas | 5.2 | 2.4 | 2.7 | 0.4 | 1.9 | 0.4 |
| β-cas | 4.7 | 1.4 | 6.7 | 3.1 | 0.3 | 3.3 | |
| κ-cas | −5.1 | −3.7 | 1.3 | −17.4 | −15.2 | −35.9 | |
| β-lg | −8.0 | −18.3 | −5.3 | −13.9 | −25.8 | −10.9 | |
| α-la | −6.5 | −12.3 | −26.0 | −34.1 | −34.5 | −43.8 | |
| 95 °C | α-cas | 8.1 | 5.6 | 0.0 | 3.9 | −1.4 | 0.7 |
| β-cas | 4.5 | 7.5 | 0.6 | 2.2 | 1.8 | 5.4 | |
| κ-cas | −6.5 | −5.0 | −10.5 | −32.6 | −6.5 | −39.5 | |
| β-lg | −14.2 | −23.0 | −29.9 | −23.5 | −8.4 | −75.6 | |
| α-la | −14.9 | −10.8 | −29.2 | −42.8 | −62.6 | −60.0 | |
Publisher’s Note: MDPI stays neutral with regard to jurisdictional claims in published maps and institutional affiliations. |
© 2022 by the authors. Licensee MDPI, Basel, Switzerland. This article is an open access article distributed under the terms and conditions of the Creative Commons Attribution (CC BY) license (https://creativecommons.org/licenses/by/4.0/).
Share and Cite
Čurlej, J.; Zajác, P.; Čapla, J.; Golian, J.; Benešová, L.; Partika, A.; Fehér, A.; Jakabová, S. The Effect of Heat Treatment on Cow’s Milk Protein Profiles. Foods 2022, 11, 1023. https://doi.org/10.3390/foods11071023
Čurlej J, Zajác P, Čapla J, Golian J, Benešová L, Partika A, Fehér A, Jakabová S. The Effect of Heat Treatment on Cow’s Milk Protein Profiles. Foods. 2022; 11(7):1023. https://doi.org/10.3390/foods11071023
Chicago/Turabian StyleČurlej, Jozef, Peter Zajác, Jozef Čapla, Jozef Golian, Lucia Benešová, Adam Partika, Alexander Fehér, and Silvia Jakabová. 2022. "The Effect of Heat Treatment on Cow’s Milk Protein Profiles" Foods 11, no. 7: 1023. https://doi.org/10.3390/foods11071023
APA StyleČurlej, J., Zajác, P., Čapla, J., Golian, J., Benešová, L., Partika, A., Fehér, A., & Jakabová, S. (2022). The Effect of Heat Treatment on Cow’s Milk Protein Profiles. Foods, 11(7), 1023. https://doi.org/10.3390/foods11071023