3.1. Experimental Results
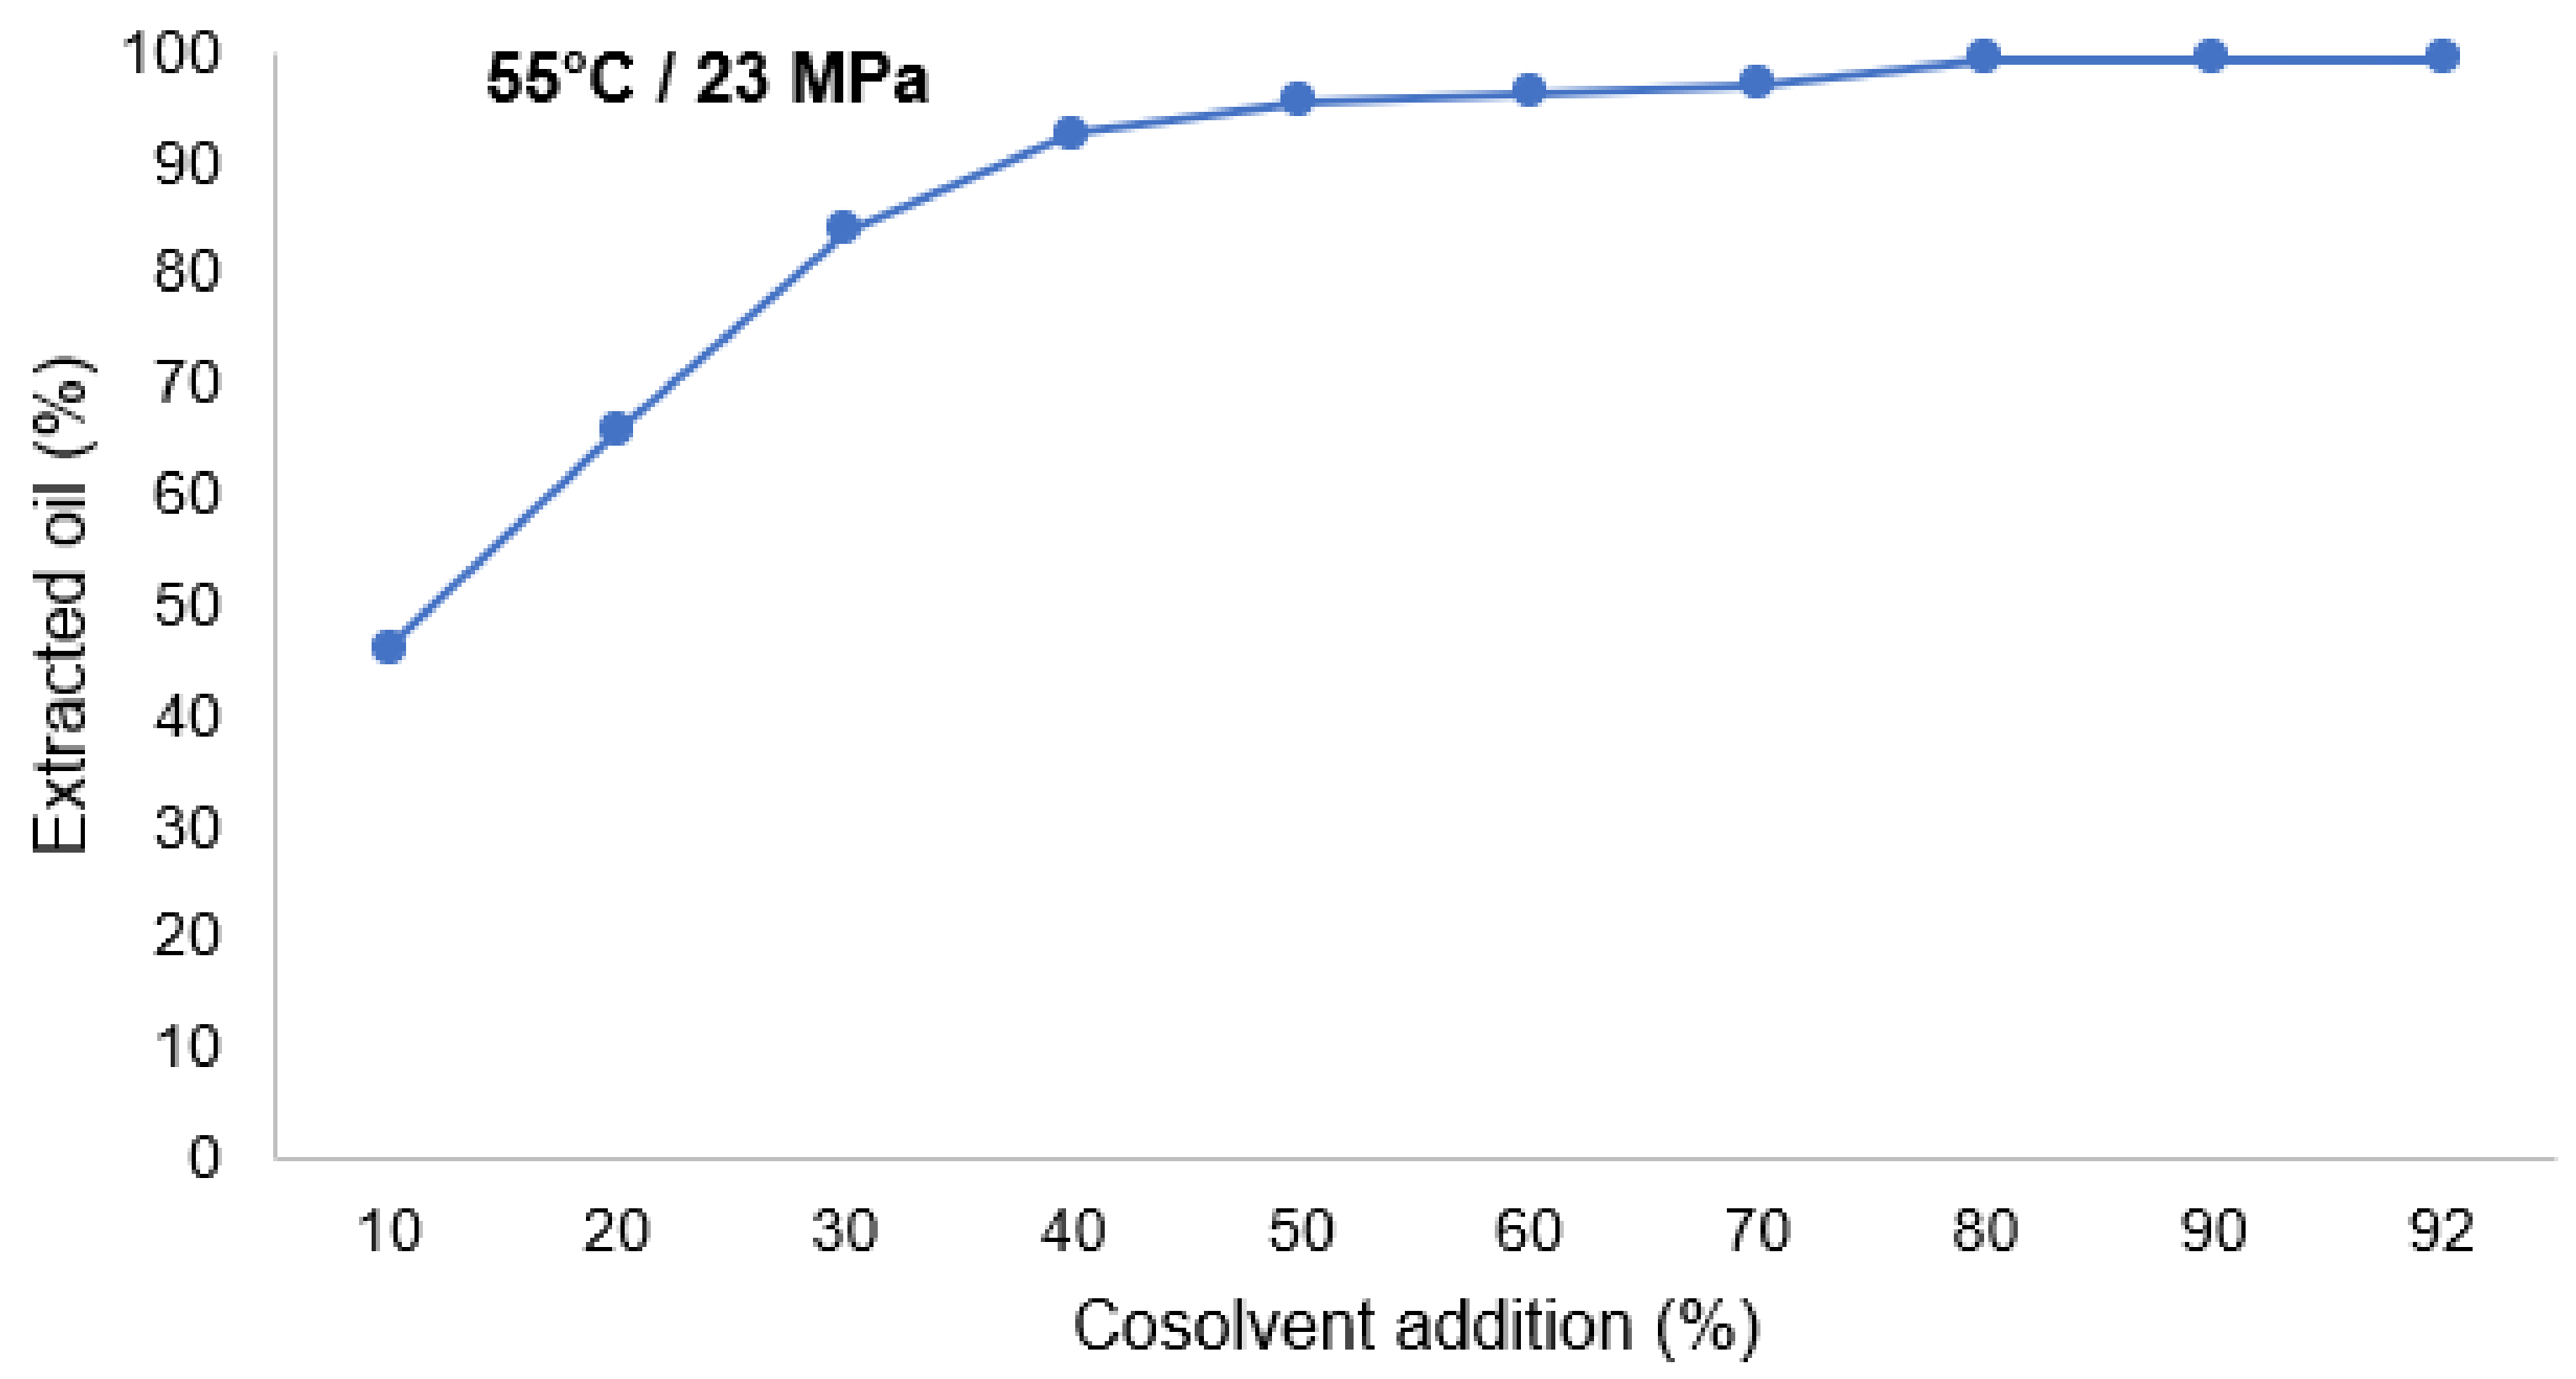
Optimization studies of oil extraction from quinoa flour with SFE using CO
2 were performed, and the quinoa flour had an oil content of 7.0%. The seeds were ground with a mill IKA Basic 11, to obtain particle size of ≤0.5 mm. The effect of the cosolvent on the efficiency of oil extraction from quinoa flour was studied by using ethanol in an amount of 10–92% (weight of the cosolvent with respect to weight of the quinoa flour). The best results were obtained for the cosolvent percentage (range up to 90%), as can be seen in
Figure 4.
As shown in
Table 4, SFE allowed to obtain a higher oil extraction yield (OEY) of 28.49% compared to CSE, and the results are in agreement with previous studies, where values obtained with SFE were higher than those defatted by Soxhlet, with values reported for SFE of approximately 89% of yield [
4,
14]. In terms of nutritional characteristics, in a previous study reported by Estrada et al. [
33], the fatty acid profile obtained by SFE was as follows: C14:0 (0.31%), C16:0 (10.01%), C18:0 (0.68%), C18:1w-9 (25.53%), C18:1-w-7 (0.94%), C18:2w-16 (49.56%), and C18:3w-3 (3.69%), similar to that reported by Wejnerowska and Ciaciuch et al. [
14]: C16.0 (11.2%), C18:1 (28.2%), and C18:2 (50.9%), although it is true that no significant differences were reported in the fatty acid profile of oil obtained by SFE and other conventional methods with organic solvents [
4,
14,
19]. SFE extracted oil may contain significant amounts of tocopherols (vitamin E), according to previous studies [
15]. Additionally, as can be seen in
Table 4, SFE also allows the extraction of phenolic compounds in the defatted quinoa flour stage [
19]. The phenolic compounds were recovered at 34.28 mg GAE/100 g, and similar studies report that the oil obtained by SFE of canola has a higher phenolic content [
34], giving it functional antioxidant properties and improving the stability of the oil in terms of quality [
15].
It is important to emphasize the high nutritional value of quinoa oil in terms of the main components in the oil, which were linoleic acid (~50%), oleic acid (~25%), and palmitic acid (~10%), making up a total of 78% of polyunsaturated fatty acids (oleic acid, linoleic acid, and linolenic acid), with the latter two being considered essential fatty acids, which have functionality and health properties which may help reduce the risk of various diseases [
35], resulting in an oil with high antioxidant potential and a higher market value. The average cost of quinoa oil in the international market is US
$ 33.5 L. Due to its high nutraceutical potential and to increase its productivity, it is desirable to extract it on an industrial scale. Additionally, this also confirms the feasibility of using SFE to obtain defatted quinoa as an intermediate product in food applications, free of solvent residues, and with a technological quality superior to that obtained by conventional organic solvents [
36].
Studies have reported on flavonoid and phenolic acids of quinoa seeds carried out by HPLC, and the main phenolic acids found were gallic acid, p-hydroxybenzoic acid, vanillic acid, p-coumaric acid, caffeic acid, and cinnamic acid, but the main flavonoids found in the seeds were orientin and rutin [
37]. In the present study, the total flavonoids content of QPH was analyzed by the colorimetric method, and a higher amount (86.62% more) of flavonoids expressed as mg RE/g was found in the sample with the CSE process than in the sample with SFE pretreatment, confirming that there are significant differences in the amounts of remaining flavonoids in QPH (
p < 0.05).
Previous studies have shown that the addition of ethanol increases the extraction yield of flavonoids and other biological compounds, and these values are always higher when extracted with water [
4,
14]. In this sense, it can be mentioned that SFE allows the extraction of flavonoids from quinoa flour, achieving a higher degree of purification of the sample and leaving a minimum amount of these compounds in the quinoa protein hydrolysates [
38]. The remaining PC in QPH with the SFE process allows a higher degree of purification of the quinoa flour, reducing it by 85.84%; to date, no similar work has been reported. The QPH yield with SFE was 22% higher than that obtained with CSE, and this may be due to the higher protein yield content reported in the previous research [
19], and other studies also reported similar values [
39,
40]. Therefore, the high antioxidant capacity of the QPH pretreated with SFE is mainly due to the bioactive peptides and not to the phenolic compounds, as is the case in the sample pretreated with CSE. Finally, SFE allowed better overall QPH performance, which was 1.23 times higher compared to CSE (
Table 4).
Additionally, the antioxidant activity value obtained for SFE in our previous study was 1181.64 μmol TE/g protein, and for CSE it was 1448.84 μmol TE/g protein [
19]. Other similar studies report values of 102.9, 15.3, and 60.1 expressed as ascorbic acid µg equivalents/mL of hydrolysate by ABTS using commercial enzymes at 120 min [
41]. This confirms the high antioxidant activity and functionality of QPH, and these have been extensively demonstrated in in vitro and in vivo studies, where dietary intake of antioxidants has been reported to be helpful in protecting the organism from oxidative stress and reducing the risk of chronic diseases related to oxidative stress [
16]. On the other hand, from a nutritional point of view, essential amino acids have been found in quinoa protein, with the main ones being: lysine, leucine, valine, and histidine, which had the highest amounts of 11.7%, 6.73%, 4.17%, and 4.17%, superior to other common cereals [
42,
43]. These amino acids present in hydrolyzed peptides confer antioxidant functionality, such as free radical scavenging; for example, lysine and valine can scavenge hydroxyl radicals by acting as electron donors that generate a hydrophobic microenvironment in the molecule [
44]. Mudgil et al. report a peptide found in quinoa hydrolysate (QHPHGLGALCAAPPST) with multifunctional properties beneficial to health [
45].
3.2. Economic Evaluation of QPH Production
The CSE and SFE processes were simulated using SuperPro Designer 9.0
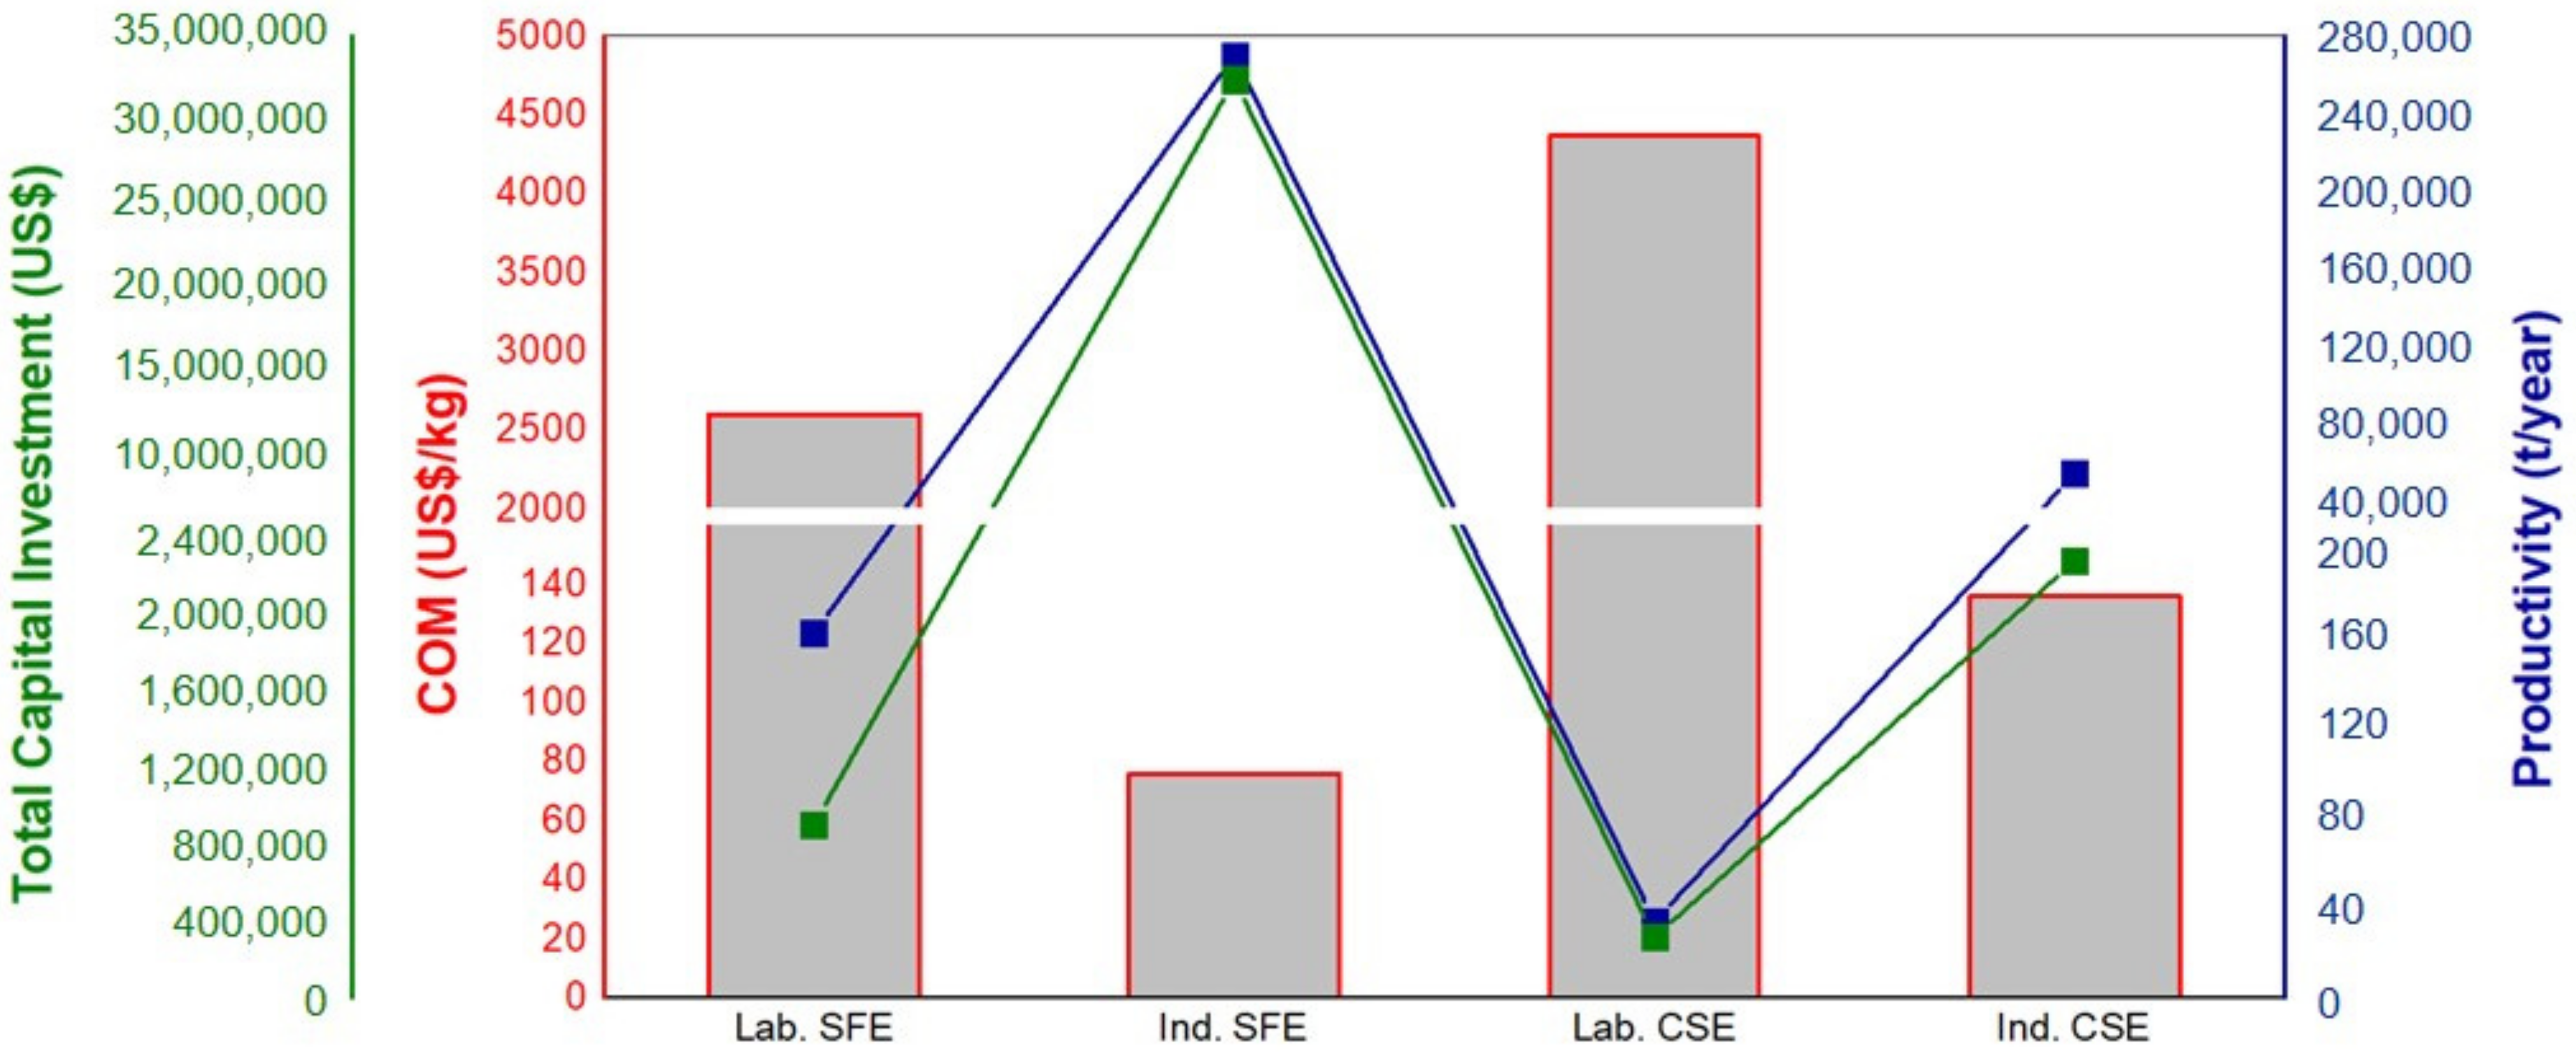
® software in order to determine the COM of the QPH production; for the base simulation, the sale of the two by-products (oil and saponins) was considered. The COM, productivity, and total capital investment were also obtained (
Figure 5) for both process and production scales (1.5 and 2500 kg). For the SFE process, the COM of QPH based on the total amount obtained decreased 90 times, and for the CSE process, the COM decreased 77 times, as the production scale increased. Therefore, considering the plants with the highest production capacities amongst those simulated, the highest productivity and the lowest COM were obtained. In this sense, the 2500 kg plant was the most appropriate amongst those simulated for producing QPH (269,998 tons/year) from quinoa seeds by the SFE process with the lowest COM (US
$ 26.33/kg), compared to the CSE process (57,734 tons/year) with the lowest COM (US
$ 57.06/kg). TCI for CSE and SFE was approximately US
$ 2,300,000.00 and US
$ 32,000,000.00, respectively, and for both cases, these increased with the industrial scale.
The productivity (t/year) represents the sum of accumulated QPH obtained from each production batch (mass basis). The behaviors of COM, productivity, and TCI for different plant capacities are also corroborated by other studies, such as passion fruit extract [
27], curcuminoid powdered extract obtained from turmeric [
46], and sucupira oil from sucupira branca seeds [
47], all of which applied supercritical technology.
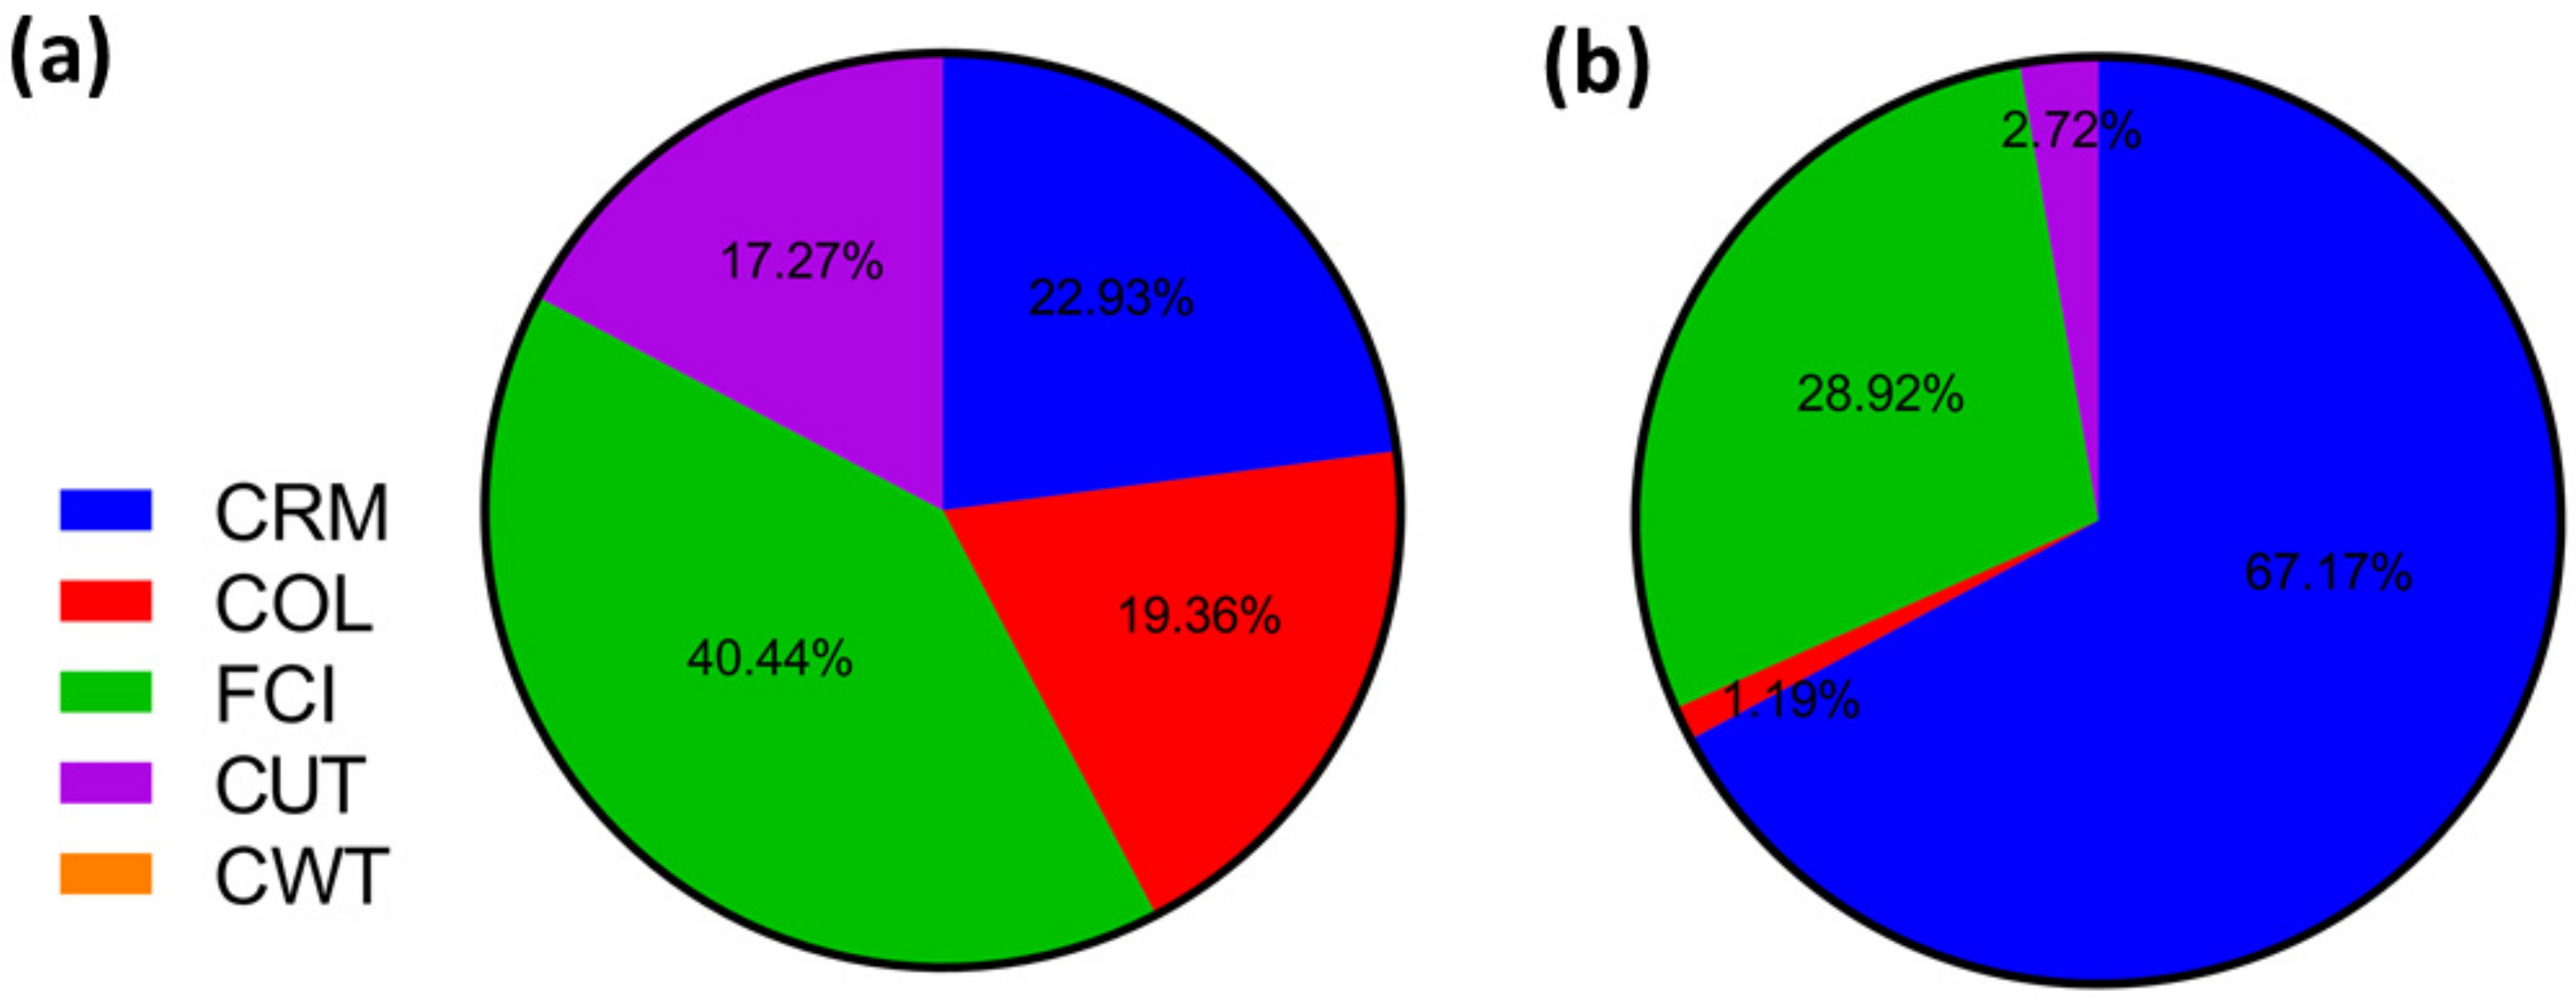
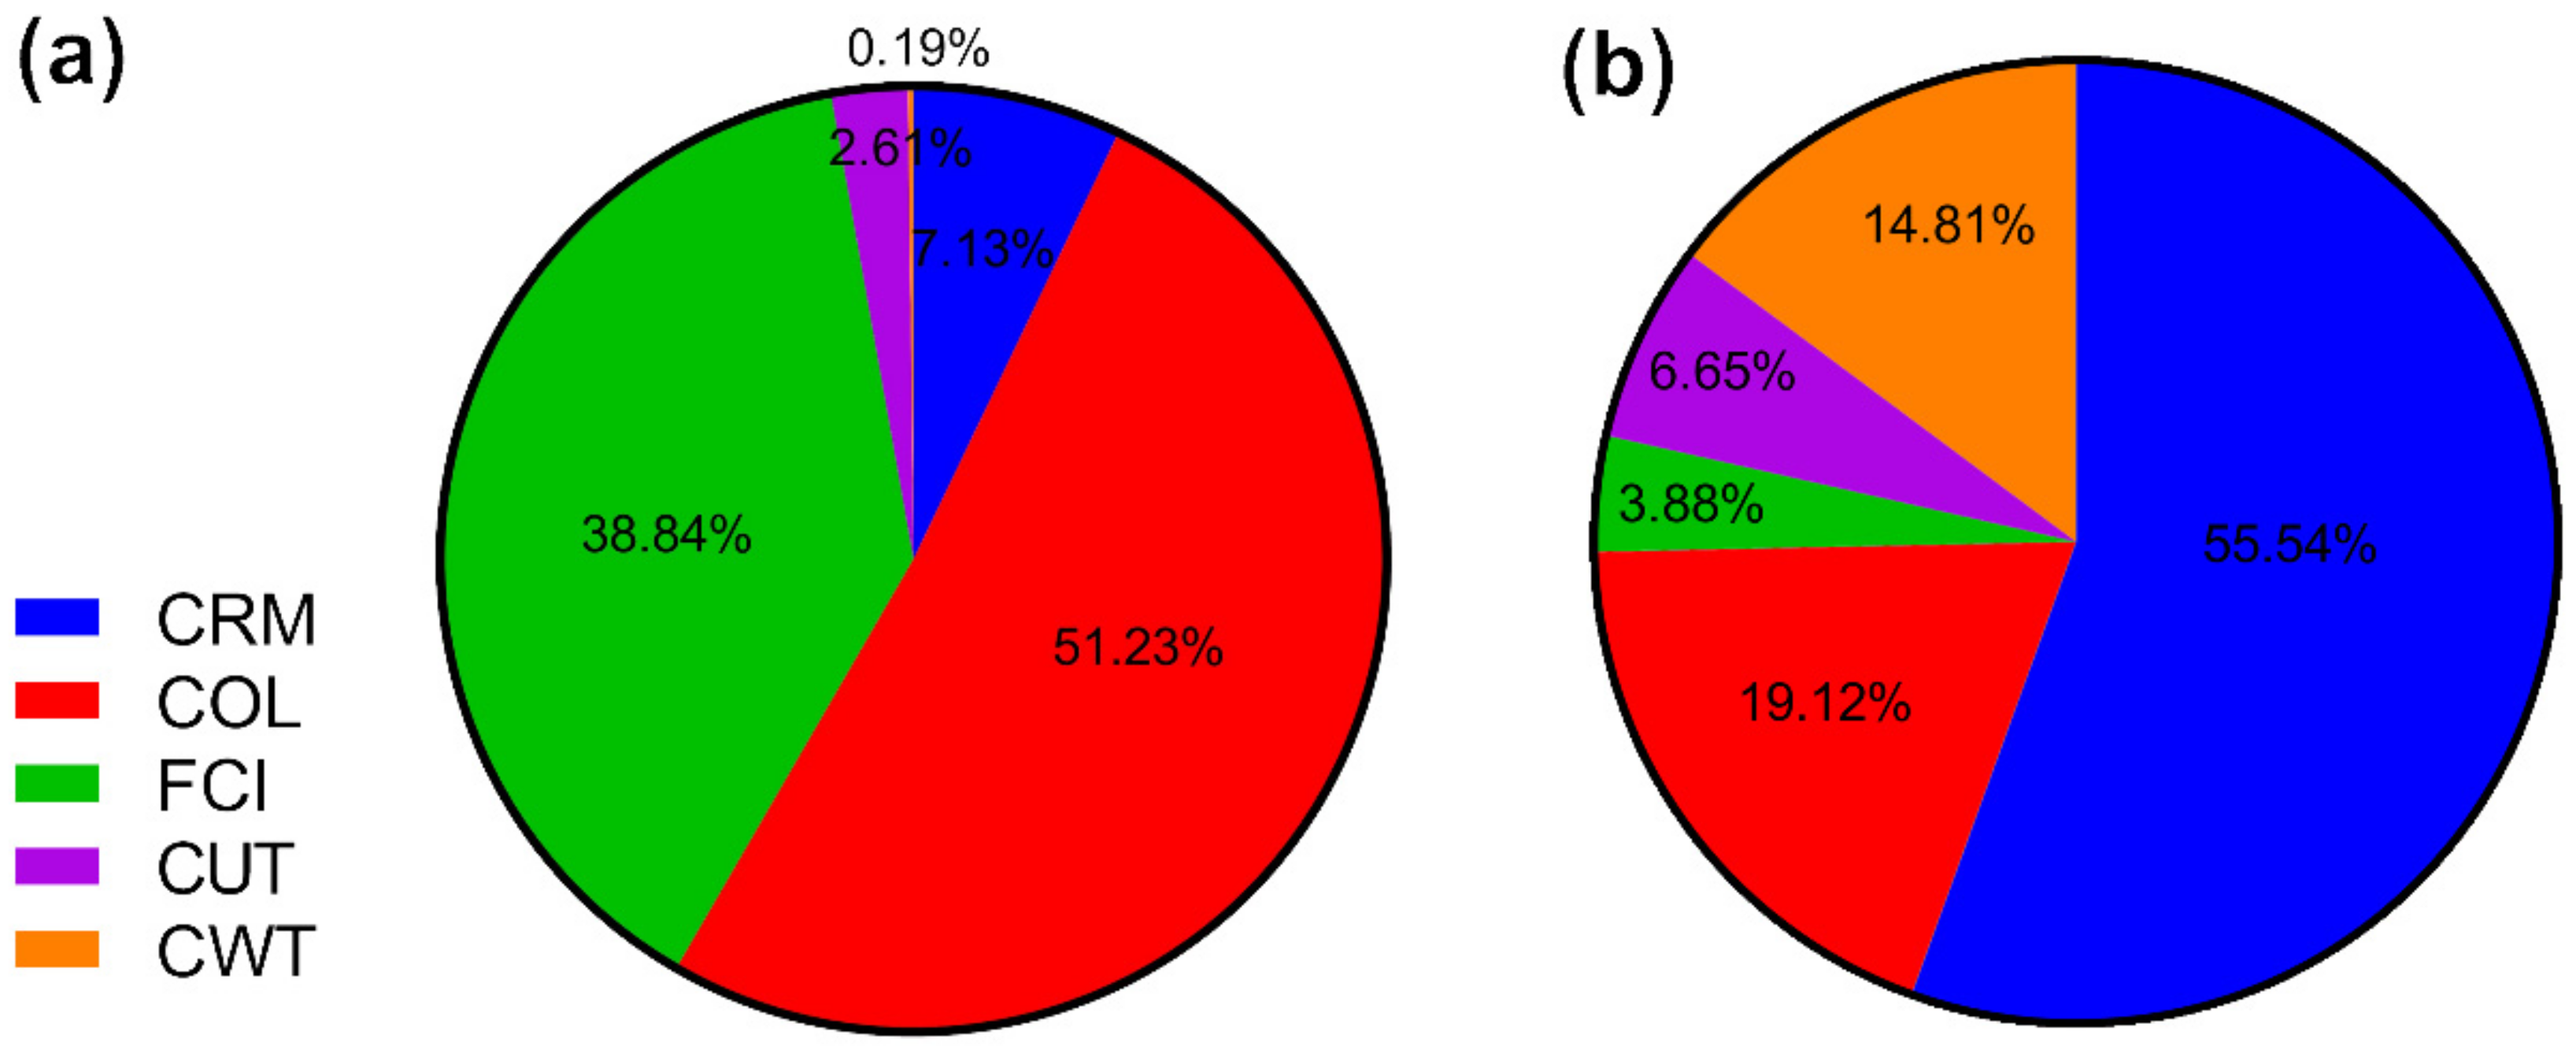
Figure 6 and
Figure 7 show the contributions of the main cost factors (CRM, COL, FCI, CUT, and CWT) on COM for each extraction process. For SFE, the FCI and COL were the components that presented the highest contribution to COM at the laboratory scale, but CRM and FCI were the components that presented the highest contribution to COM at the industrial scale. The increase in CRM with scale-up is related to the increase in the required amount of raw material (1.5 kg/batch quinoa seeds to 2500 kg/batch quinoa seeds), and the largest contribution from the CRM was expected, since the raw material has a considerable cost (US
$ 1.57/kg). A similar result was obtained in other simulations considering short process times for SFE [
39]: FCI decreased with the increase in scale from 40.44% to 28.92%, and this decrease is not considerable because the investment is high, mainly due to the cost of the extraction unit with supercritical fluids which amounts to US
$ 9,828,054.25. In the case of CSE, the FCI and COL were the components that presented the highest contribution to COM at the laboratory scale, but CRM and COL were the components that presented the highest contribution to COM at the industrial scale. The increase in CRM with scale-up is related to the increase in the required amount of raw material. COL decreased with the increase in scale from 51.23% to 19.12%, and this decrease is not considerable because the total operation time, including handling, loading, and unloading of the solvent (petroleum ether), requires 19 h per batch, and a large extraction time results in a minor number of batches per year and, consequently, a greater amount of man-hours [
48].
However, when we compared the two processes on an industrial scale, FCI contributes more in SFE than CSE, the FCI was 164 times higher for SFE compared to CSE. Due to the high cost of the extraction unit with supercritical fluids, in both cases, the cost of the material contributes significantly to the COM, however, CRM impacts 1.2 times more on SFE compared to CSE, due to the shorter extraction time of 4 h compared to 19 h. Finally, the COL value decreases substantially when industrializing the process using both methods, because despite needing the same number of people considering three shifts, the proportion of other elements of the manufacturing cost are higher, so the percentage of this factor with respect to the others decreases. A similar result was obtained in other simulations [
27].
3.3. Sensitivity Analysis and Comparison between Extraction Methods
The sensitivity analysis was performed considering four scenarios. Scenario 1 is the base case, including the sale of QPH and the sale of the two by-products (oil and saponins), scenario 2 is the sale of QPH and only the sale of saponins, scenario 3 is the sale of QPH and only the sale of oil, and scenario 4 is the sale of QPH without the sale of by-products. The four scenarios were considered, both at the laboratory and industrial scale, and for each type of process (SFE and CSE), and the results are shown in
Table 5.
As shown in
Table 5, when the CSE was used, considering the four different scenarios both at the laboratory and industrial scale, the COM of one kg of QPH ranged between US
$ 4367.18 and US
$ 4428.38 for the laboratory scale, and for industrial scale ranged between US
$ 57.06 and US
$ 109.29. At the laboratory scale, the main factor impacting on the COM was the COL, which impacts on approximately 51.23%, but at the industrial scale it was CRM, which impacts on 55.54%. This occurs with the increase in capacity: a higher production rate of QPH will require a higher consumption of quinoa seeds, and the same was observed in previous studies [
46,
49]. The best scenario on an industrial scale occurs when the sale of QPH and by-products such as oil and saponins takes place, decreasing the value of COM by approximately 1.92 times without the sale of by-products, and the parameters of return indicate the feasibility of the process. For instance, the GM and ROI were 42.40% and 155.83%, respectively. The PBT was 0.64 years with an NPV of US
$ 28,159,000.00.
In the same trend, when the SFE was performed, two by-products were obtained in each batch. COM of one kg of QPH ranged from US
$ 2599.68 to US
$ 2660.88 at the laboratory scale, but at the industrial scale ranged from US
$ 28.90 to US
$ 90.10. In general, COM values are a bit higher in CSE than SFE because the production rate of QPH, and hence the productivity, increased significantly. For example, on an industrial scale, the productivity of SFE was 269,998 tons/year, compared to CSE of 57,734 tons/year. For this itemized cost, FCI is contributing to approximately 28.92% of the total cost, being 7.45 times higher compared to CSE. In this process, both CRM and FCI significantly impact on the COM. The COM values of SFE were lower than CSE in all four scenarios; therefore, all financial indicators were also lower, and all scenarios for SFE presented a positive return to the initial capital and operational investment. The best scenario for processing QPH by SFE was achieved by integrating SFE-I-1, which decreased the COM by 3.12 times with respect to the scenario SFE-I-4. In such scenario, the GM and ROI were 67.31% and 85.96%, respectively. The PBT was 1.16 years with an NPV of US
$ 205,006,000 (
Table 5).
As shown in
Table 5, the COM calculated at the industrial scale was lower that the selling price of QPH (US
$ 200/kg) in all four scenarios with the two technologies (CSE-I-1, CSE-I-2, CSE-I-3, CSE-I-4, SFE-I-1, SFE-I-2, SFE-I-3, SFE-I-4), which suggests that both production processes are profitable under those conditions. Raw material can represent up to 80% of the COM when SFE is used [
34]. According to Osorio-Tobón et al. [
46], raw materials, despite their high variability in cost, are generally the components with the highest contribution to COM. In the present study, when scenarios SFE-I-1, SFE-I-2, SFE-I-3, and SFE-I-4 were assessed, the COM was 1.21 times higher on SFE compared to CSE scenarios CSE-I-1, CSE-I-2, CSE-I-3, and CSE-I-4; however, using the first process, CMR had a major impact on the COM. In the latter scenario, our COM for SFE was lower than the COM obtained for the defatting of annatto seeds using supercritical carbon dioxide as a pretreatment for the production of bixin [
50]. Other studies also corroborate the superiority of SFE over conventional oil extraction technologies, with better technological and economical results [
34].
GM evaluates the short-term benefits of the extraction process [
51]: a higher GM indicates that the project is more feasible because this indicator represents the percentage of every dollar of a product sold that the company retains as gross profit [
29,
51]. In general, for both processes of QPH production, the GM was negative in all lab-scale scenarios (CSE-L-1, CSE-L-2, CSE-L-3, CSE-L-4, SFE-L-1, SFE-L-2, SFE-L-3, SFE-L-4) because the COM was higher than the selling price of QPH; however, at the industrial scale, the COM decreased, observing a higher GM in all industrial-scale scenarios (CSE-I-1, CSE-I-2, CSE-I-3, CSE-I-4, SFE-I-1, SFE-I-2, SFE-I-3, SFE-I-4). Similar results were found in [
27], which obtained positive GM values for the extraction from passion fruit by-products, at a selling price higher than US
$ 200/kg. On the other hand, in the SFE, high GM values were obtained during all the evaluated scenarios. However, in the most favorable scenario (SFE-I-1), the GM was significantly higher than that reported for integrated annatto seeds-sugarcane biorefinery using supercritical CO
2 extraction as a first step at a GM of 49.3% [
52].
Another important parameter to evaluate the performance of the extraction processes is the ROI, and the higher this value, the more attractive the project [
53]. However, for a project to be feasible, a minimum ROI between 10% and 15% is acceptable [
51]. Similar to GM, in both extraction processes, ROI increased as COM decreased, reaching its highest value in both extraction processes with scenarios SFE-I-1 and CSE-I-1. When comparing both processes, it was observed that in the case of the CSE, the ROI was more influenced by the costs of the raw material and the cost of labor, while in the SFE, CRM and costs of the plant (FCI) had a higher impact on the ROI due to a higher investment in equipment to carry out this process. ROI values higher than 80% were reported as indicators of good profitability for a pulp oil production plant’s operation from Caryocar Brasiliense using supercritical technology [
54]. An attractive GM of 67.31% was found in scenario SFE-I-1, which corresponds to the highest ROI. This GM value means that approximately 67.31% of the revenue from QHP and by-product sales would come in as gross profit to the company. In the pequi oil extraction project, a value close to the GM of 75% was reported with a projected sales price of US
$ 150.00/kg of oil and productivity of 890,462 kg oil/year [
54].
PBT is also an important parameter in the sensitivity analysis, which allows to assess the time to recover the initial investment. It is estimated that the shorter the PBT, the faster the initial investment will be recovered; however, this depends on the type of company and the investors [
55]. For small and large plants, the PBT should be between 2 to 3 years and 7 to 10 years, respectively [
51]. In the case of the SFE, a time between 1.16 to 1.43 years was obtained when the COM ranged from US
$ 28.90 to US
$ 90.10, which would indicate the feasibility of the process during all the evaluated scenarios. When scenarios SFE-I-1, SFE-I-2, SFE-I-3, and SFE-I-4 were compared with the CSE scenarios CSE-I-1, CSE-I-2, CSE-I-3, and CSE-I-4, they were higher by 1.81, 1.48, 1.80, and 1.46 times, respectively, due to a higher investment in equipment in SFE. A capital recovery time ranging from 0.6 to 1.5 years was calculated in the project where annatto seeds were processed using a 100 L extraction plant [
56]. A longer capital recovery time is consistent with the current findings because larger extraction units require higher capital investment.
Finally, the NPV assesses the present value of all future cash flows generated by a project, including the initial capital investment, allowing to establish which projects could generate the most profit [
55]. A project can be considered feasible if the NPV is positive after generally assuming an interest rate of 7% [
46,
57]. For both processes, all scenarios (CSE-L-1, CSE-L-2, CSE-L-3, CSE-L-4, SFE-L-1, SFE-L-2, SFE-L-3, SFE-L-4) at the laboratory scale were negative, because all COMs were very high. At the industrial scale, in the CSE, all scenarios (CSE-I-1, CSE-I-2, CSE-I-3, CSE-I-4) had a high NPV ranging from US
$ 17,671,000 to US
$ 28,159,000; however, in the SFE, all the evaluated scenarios (SFE-I-1, SFE-I-2, SFE-I-3, SFE-I-4) present a positive NPV value, and these were higher compared to the CSE scenarios, by 7.28, 8.96, 7.34, and 9.1 times, respectively, which indicates that all of them are better. Whenever CSE did not consider the utilization of all by-products, this difference was much higher, and due to the higher productivity of SFE compared to CSE, the higher production flow from QPH allows for a higher sales volume and therefore higher net revenue streams [
27]. However, to perform a more adequate economic evaluation of the cost of production of QPH by the pretreatment methods evaluated in the current study, other factors such as raw material characteristics and seasonality, market size, product demand, and costs related to product quality control, packaging, and distribution must also be considered [
49]. A supercritical plant project’s profitability must seek a balance between technical and economic criteria, aiming at higher profitability [
58].
3.4. Statistical Analysis
When assessing statistical correlation between the two input variables considered (QPH yield and productivity of QPH production plant), on two important economic indicators of the process (COM and NPV), a multifactorial equation was obtained for each of the two indicators evaluated, as shown in Equations (4) and (5) below:
The linear regression equations were obtained by discarding the one with the lowest significance in the model, which represents a dependent variable. The excluded variable for the COM was productivity; however, for the NPV variable, the excluded variable was hydrolysate yield. The results obtained show that the COM maintains a strong relationship with the variable QPH yield and the variable productivity of QPH. These models allow for estimating the main dynamic indicators of the investment for different variations in hydrolysate yield and productivity. In this way, QPH producers can make predictions of the economic behavior of the plant for different scenarios of the two initial variables considered.
The significance of the type of pretreatment (SFE, CSE) was evaluated for each production scale on the COM, and the results are shown in
Table 6. The type of pretreatment showed a significant effect on COM of QPH at the laboratory scale (
p < 0.05); however, the type of pretreatment did not have a significant effect on the COM at the industrial scale. Although no significant differences were found, it can be affirmed that pretreatment with SFE allowed to obtain a lower COM of QPH compared to CSE. The shorter extraction time in SFE allows for a higher QPH production rate and higher productivity [
50]; however, this is counterbalanced by a higher FCI and TCI, and therefore for the mean of the four scenarios, no significant differences were observed [
27]. Accordingly, it is possible to observe that plant cost was the most sensitive parameter [
59].
Many studies have demonstrated the superiority of SFE over conventional extraction methods; in that sense, according to the findings for both processes (SFE and CSE), all four industrial scale scenarios proved to be techno-economically viable. It is important to note that the present work is a preliminary study, and when the process remains promising and the scale-up stage is successfully passed, the process will finally reach the point of being studied under deeper economic evaluations [
58].


 ,
, 


