
Preparation of Highly Substituted Sulfated Alfalfa Polysaccharides and Evaluation of Their Biological Activity

 ,
,
Abstract
:1. Introduction
2. Materials and Methods
2.1. Materials and Reagents
2.2. Preparation and Purification of AP
2.3. Sulfation of AP and Optimal Test Design of Sulfation
2.4. Structural Characterization of AP and SAP
2.4.1. Polysaccharide Chemical Composition Determination
2.4.2. Degree of Substitution (DS)
2.4.3. Component Analysis
2.4.4. FT-IR Analysis
2.4.5. Molecular Weight Determination
2.5. Assay for Biological Activity
2.5.1. Scavenging DPPH Radical Assay
2.5.2. Scavenging Hydroxyl Radical Assay
2.5.3. Ferric Reducing Antioxidant Power (FRAP)
2.5.4. Antimicrobial Capacity Assay
2.5.5. Cell Viability Assay
2.5.6. Animal Experiments
2.6. Statistical Analysis
3. Results
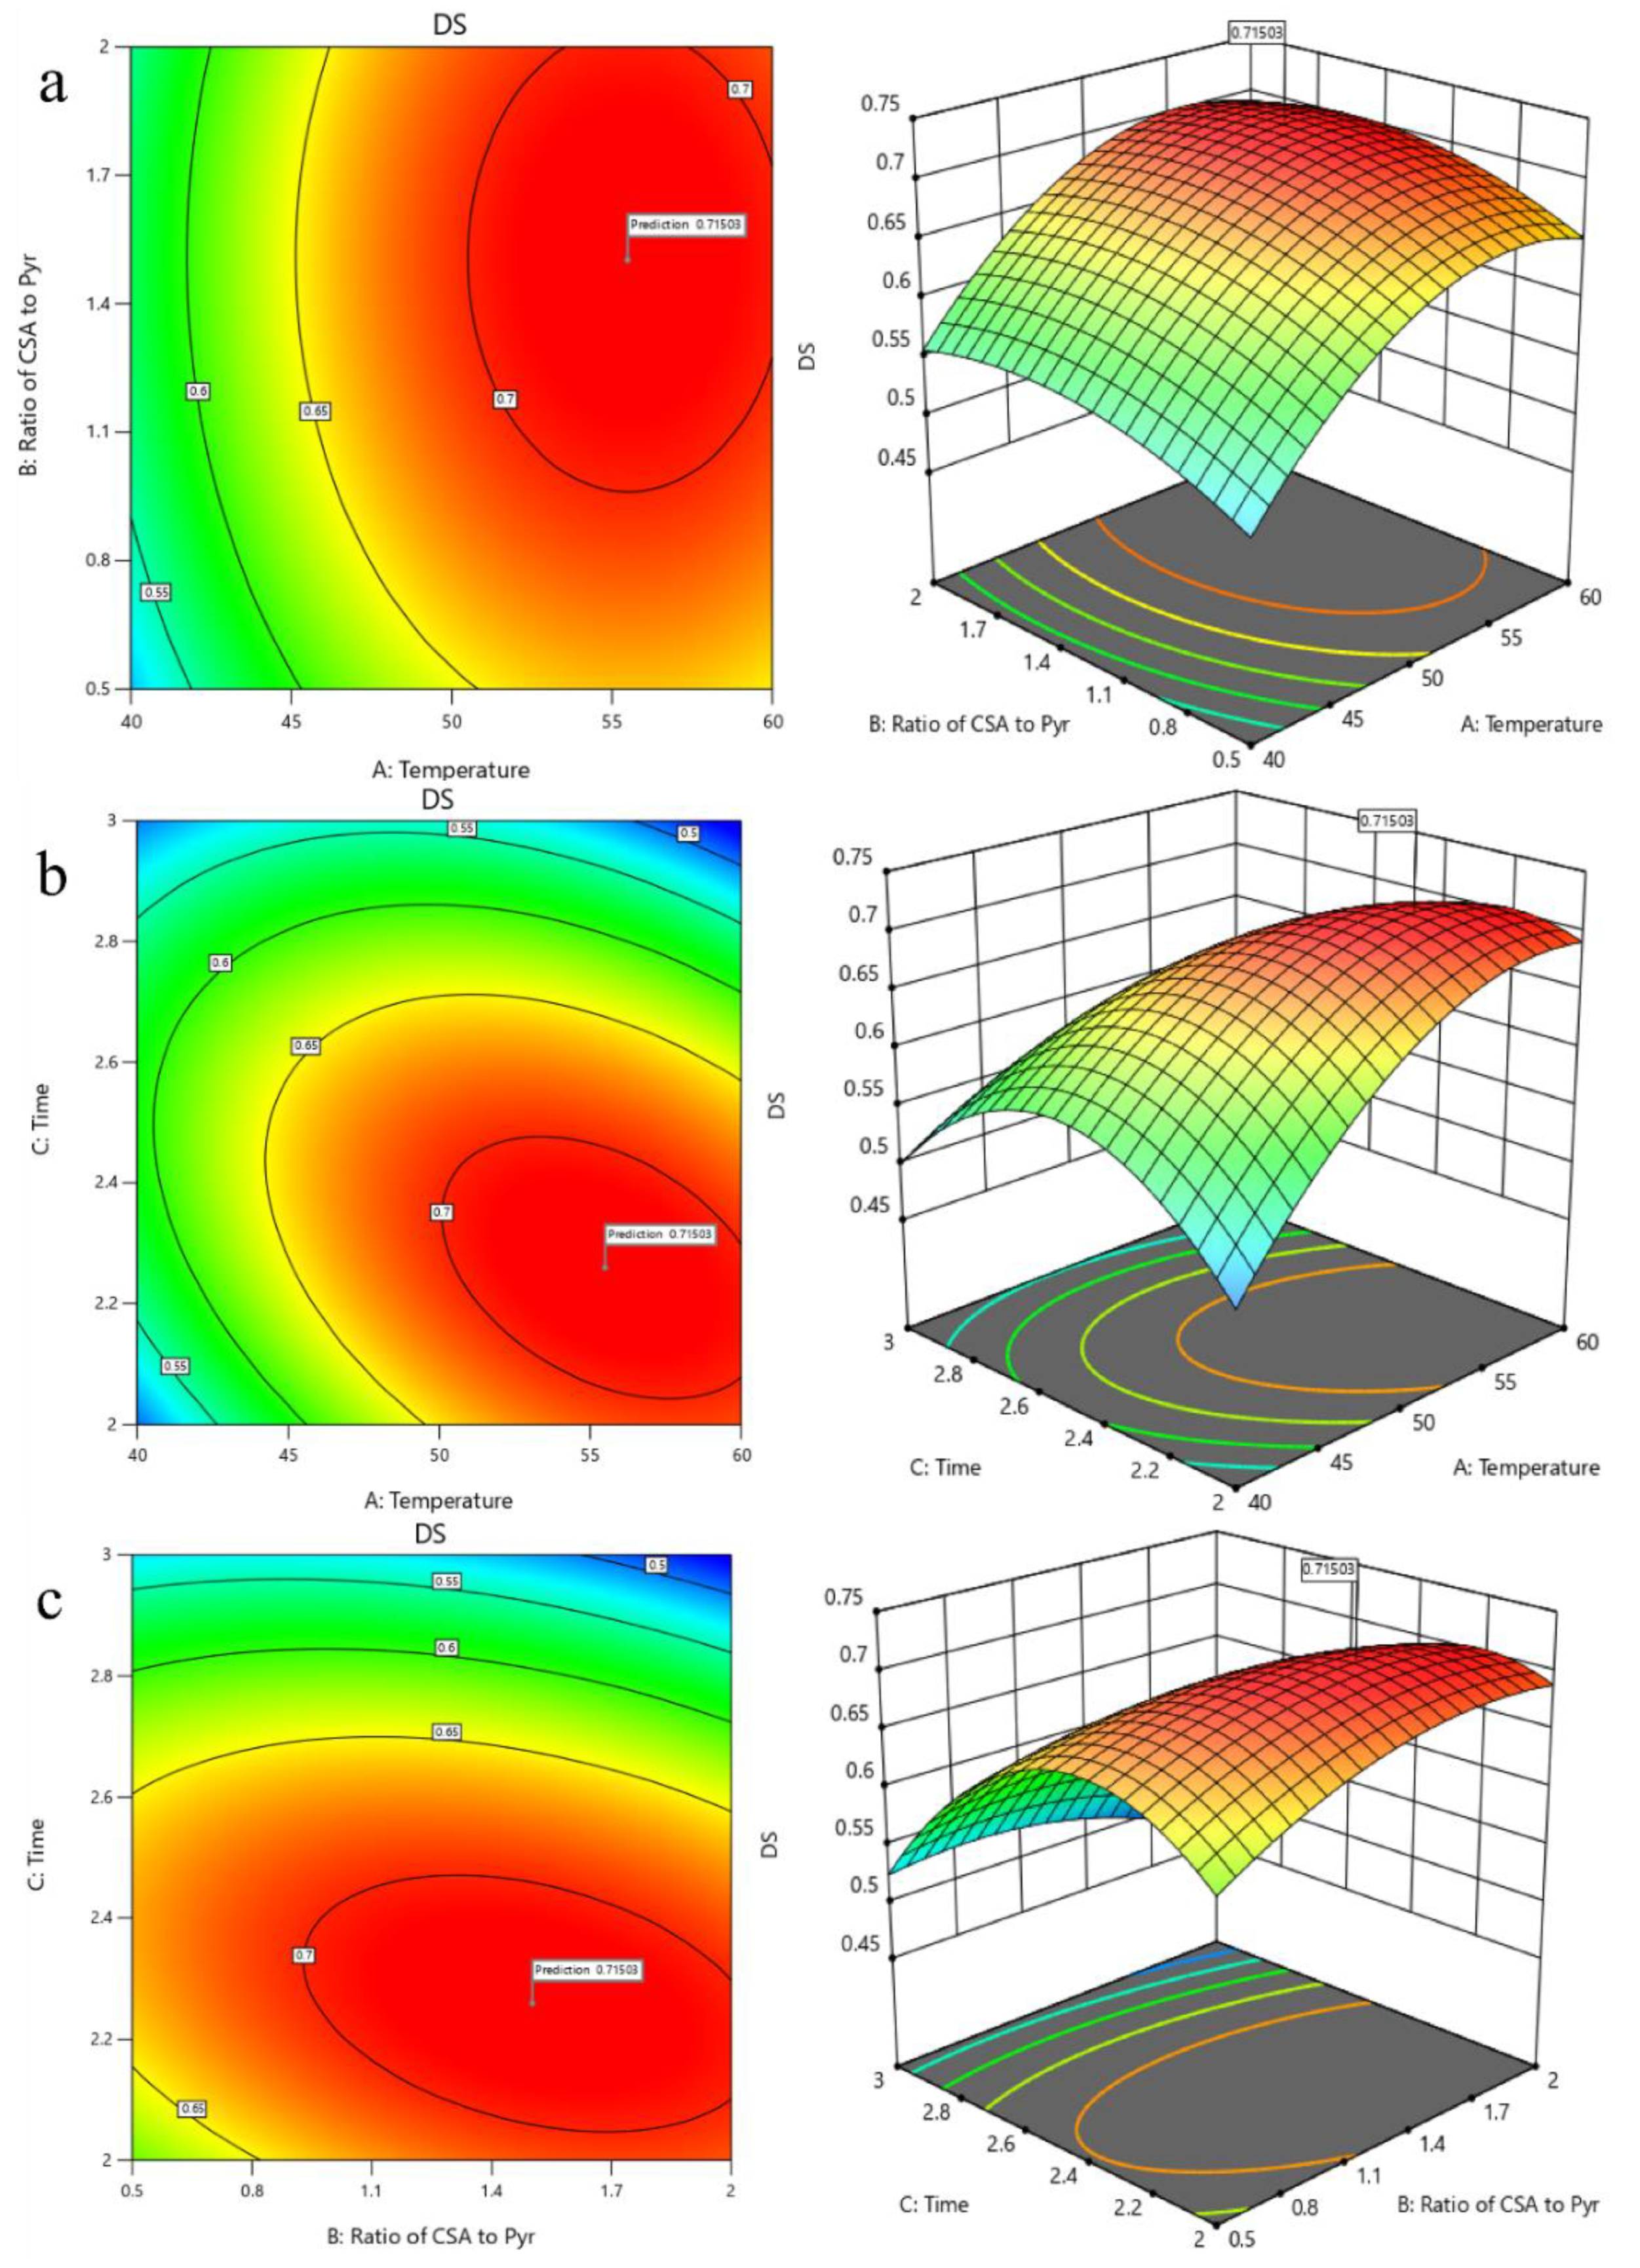
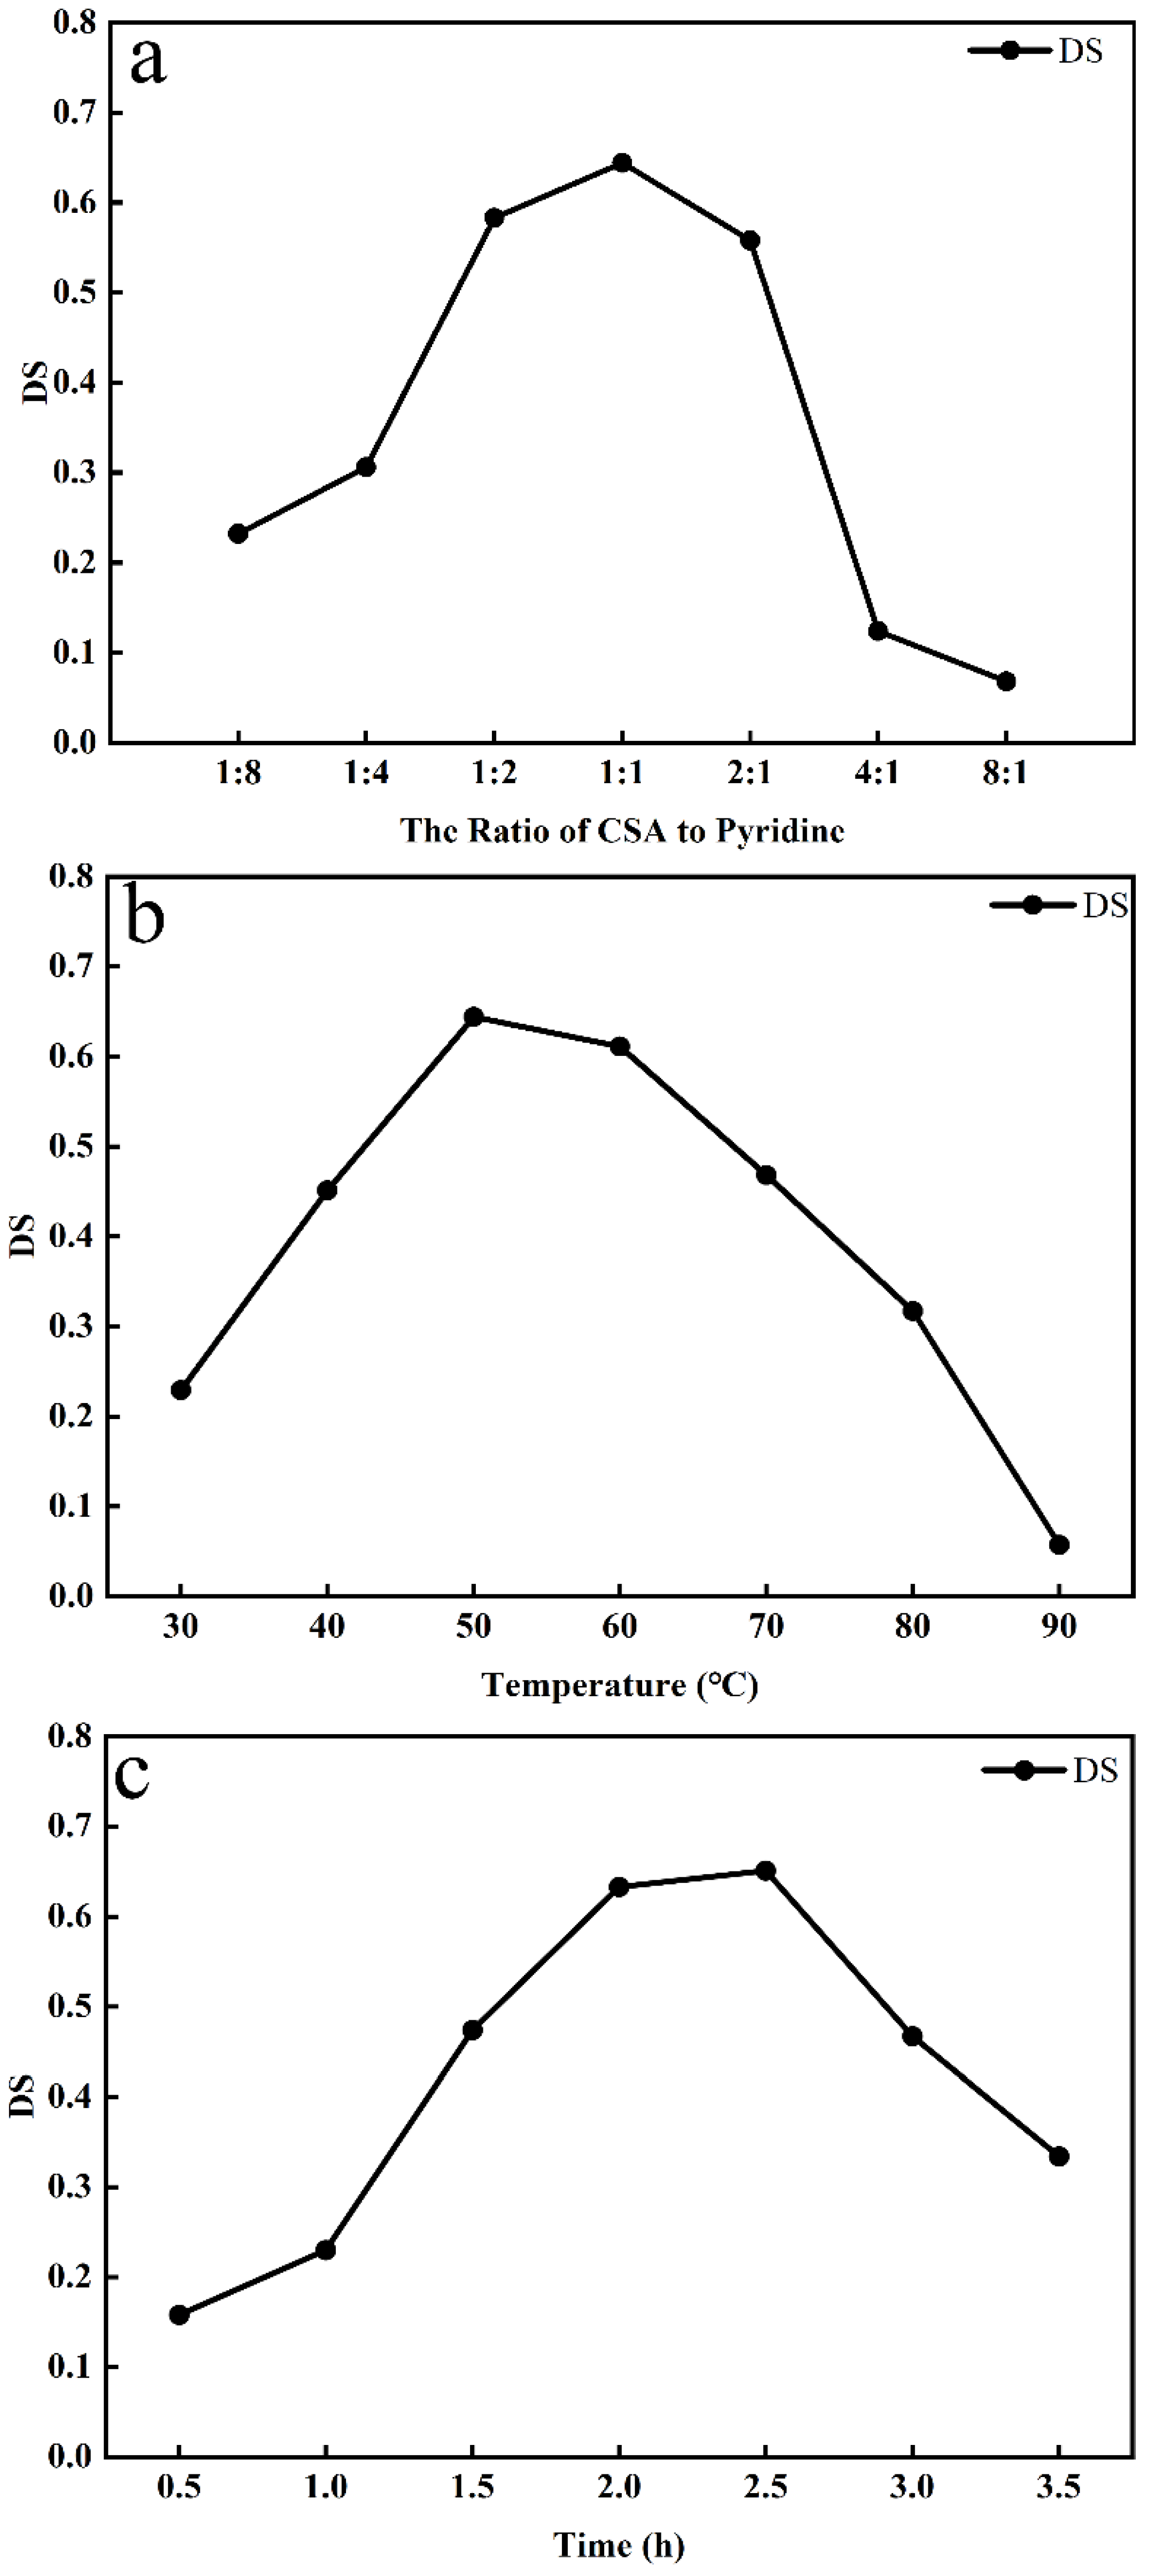
3.1. Sulfation of Alfalfa Polysaccharides
3.2. Model Fit and Predictive
3.3. Structural Characterization
3.3.1. Chemical Analysis
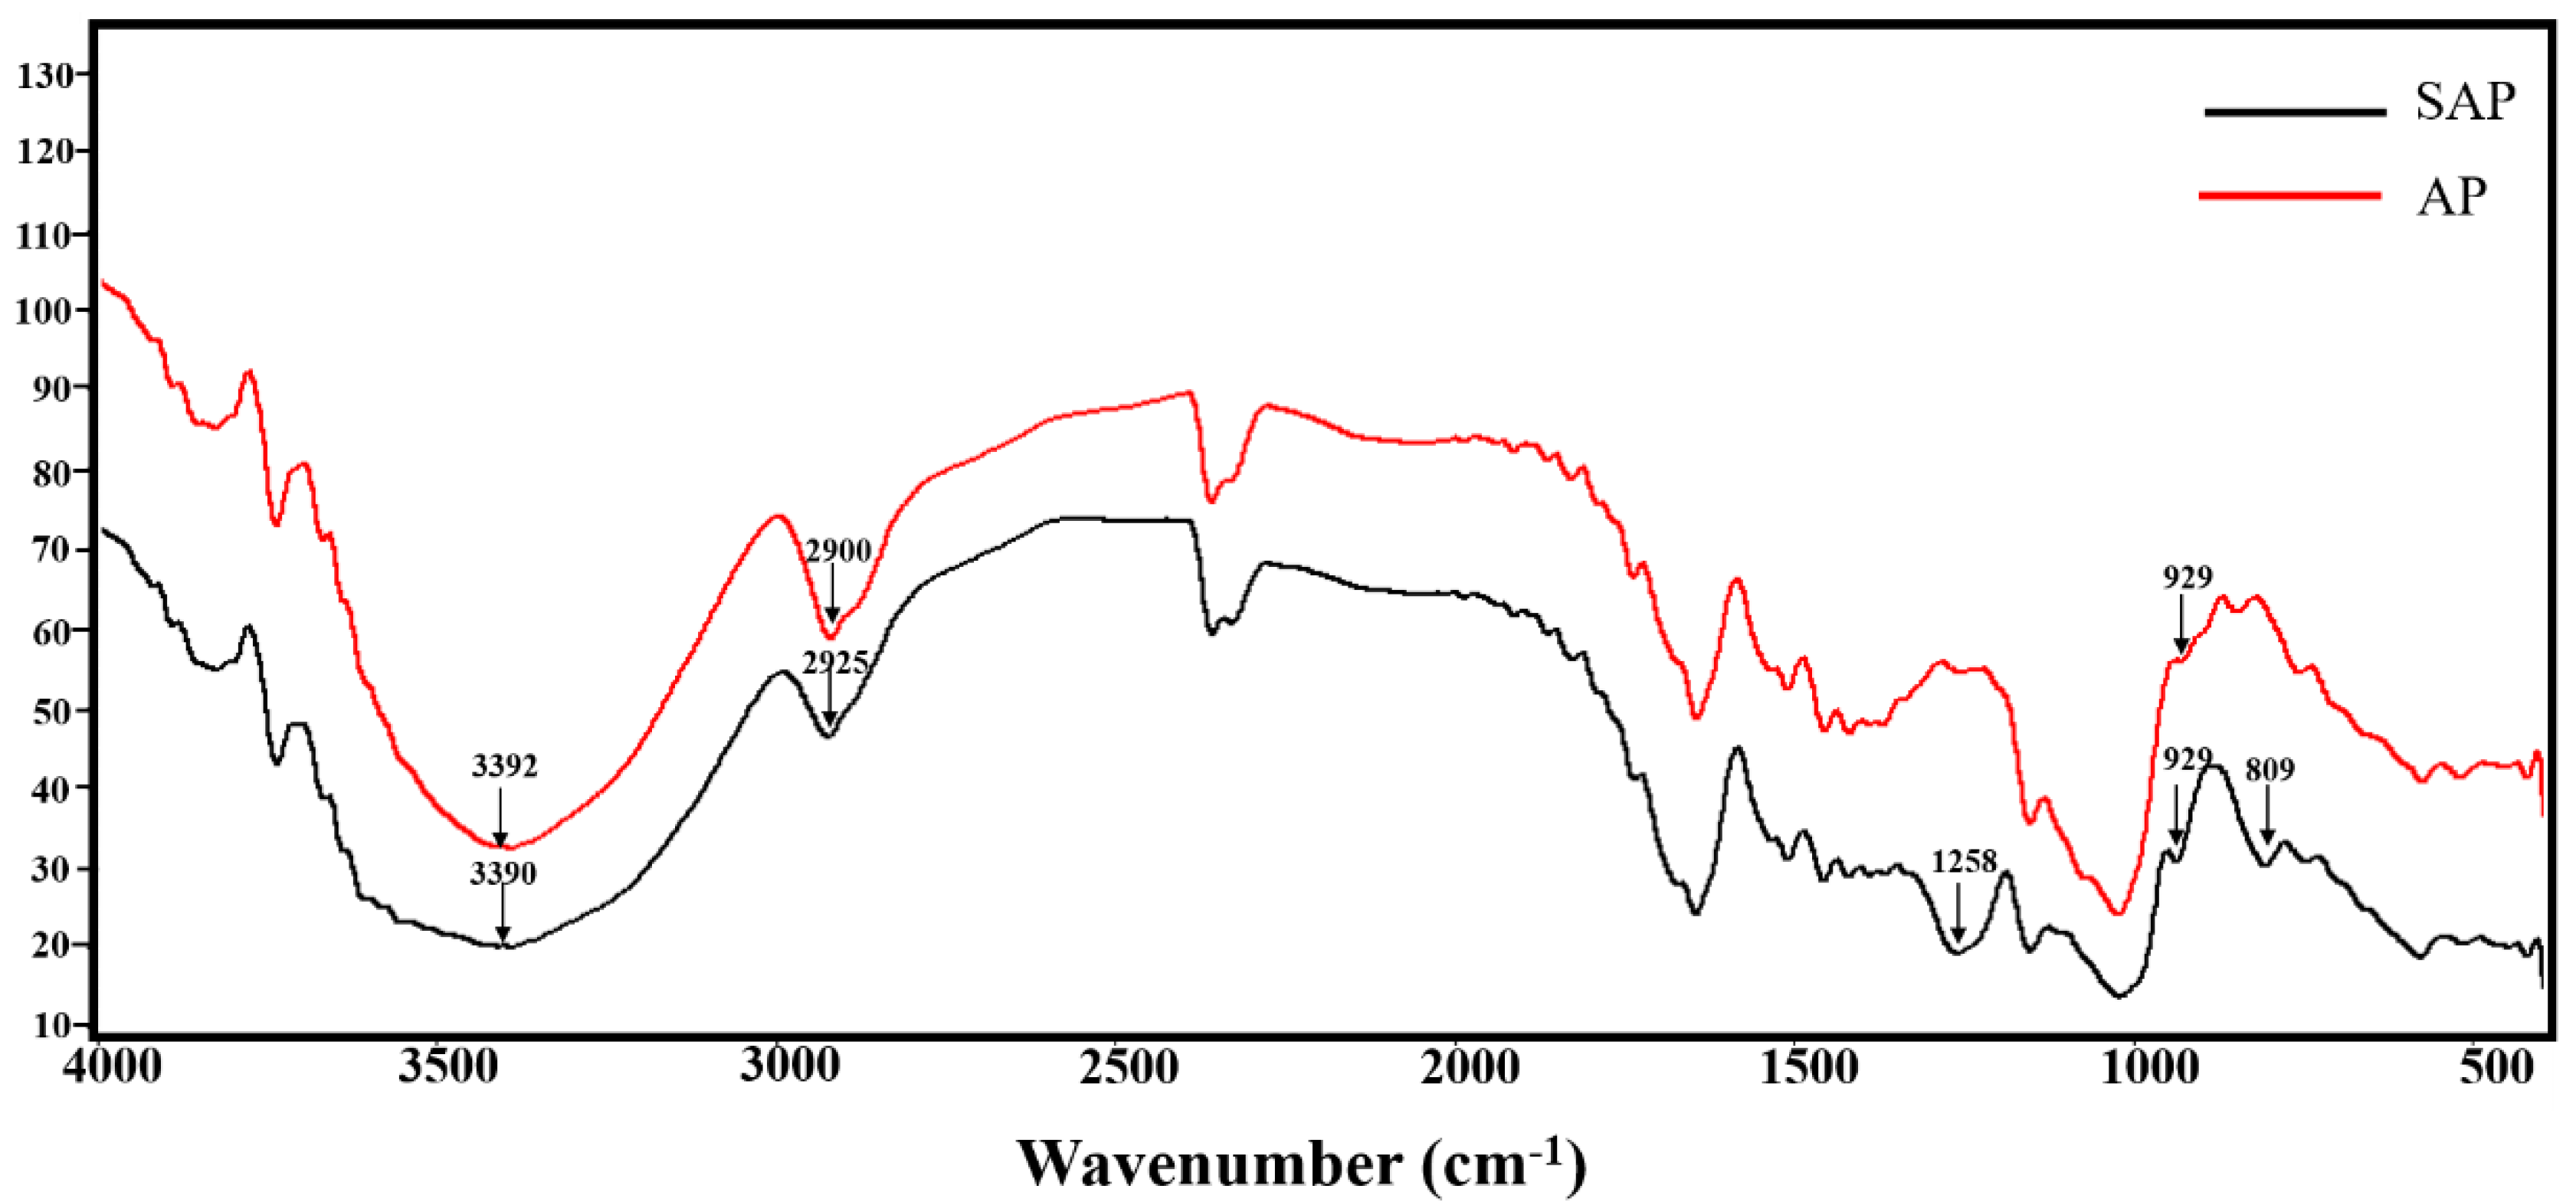
3.3.2. FTIR Analysis
3.3.3. Average Molecular Weight
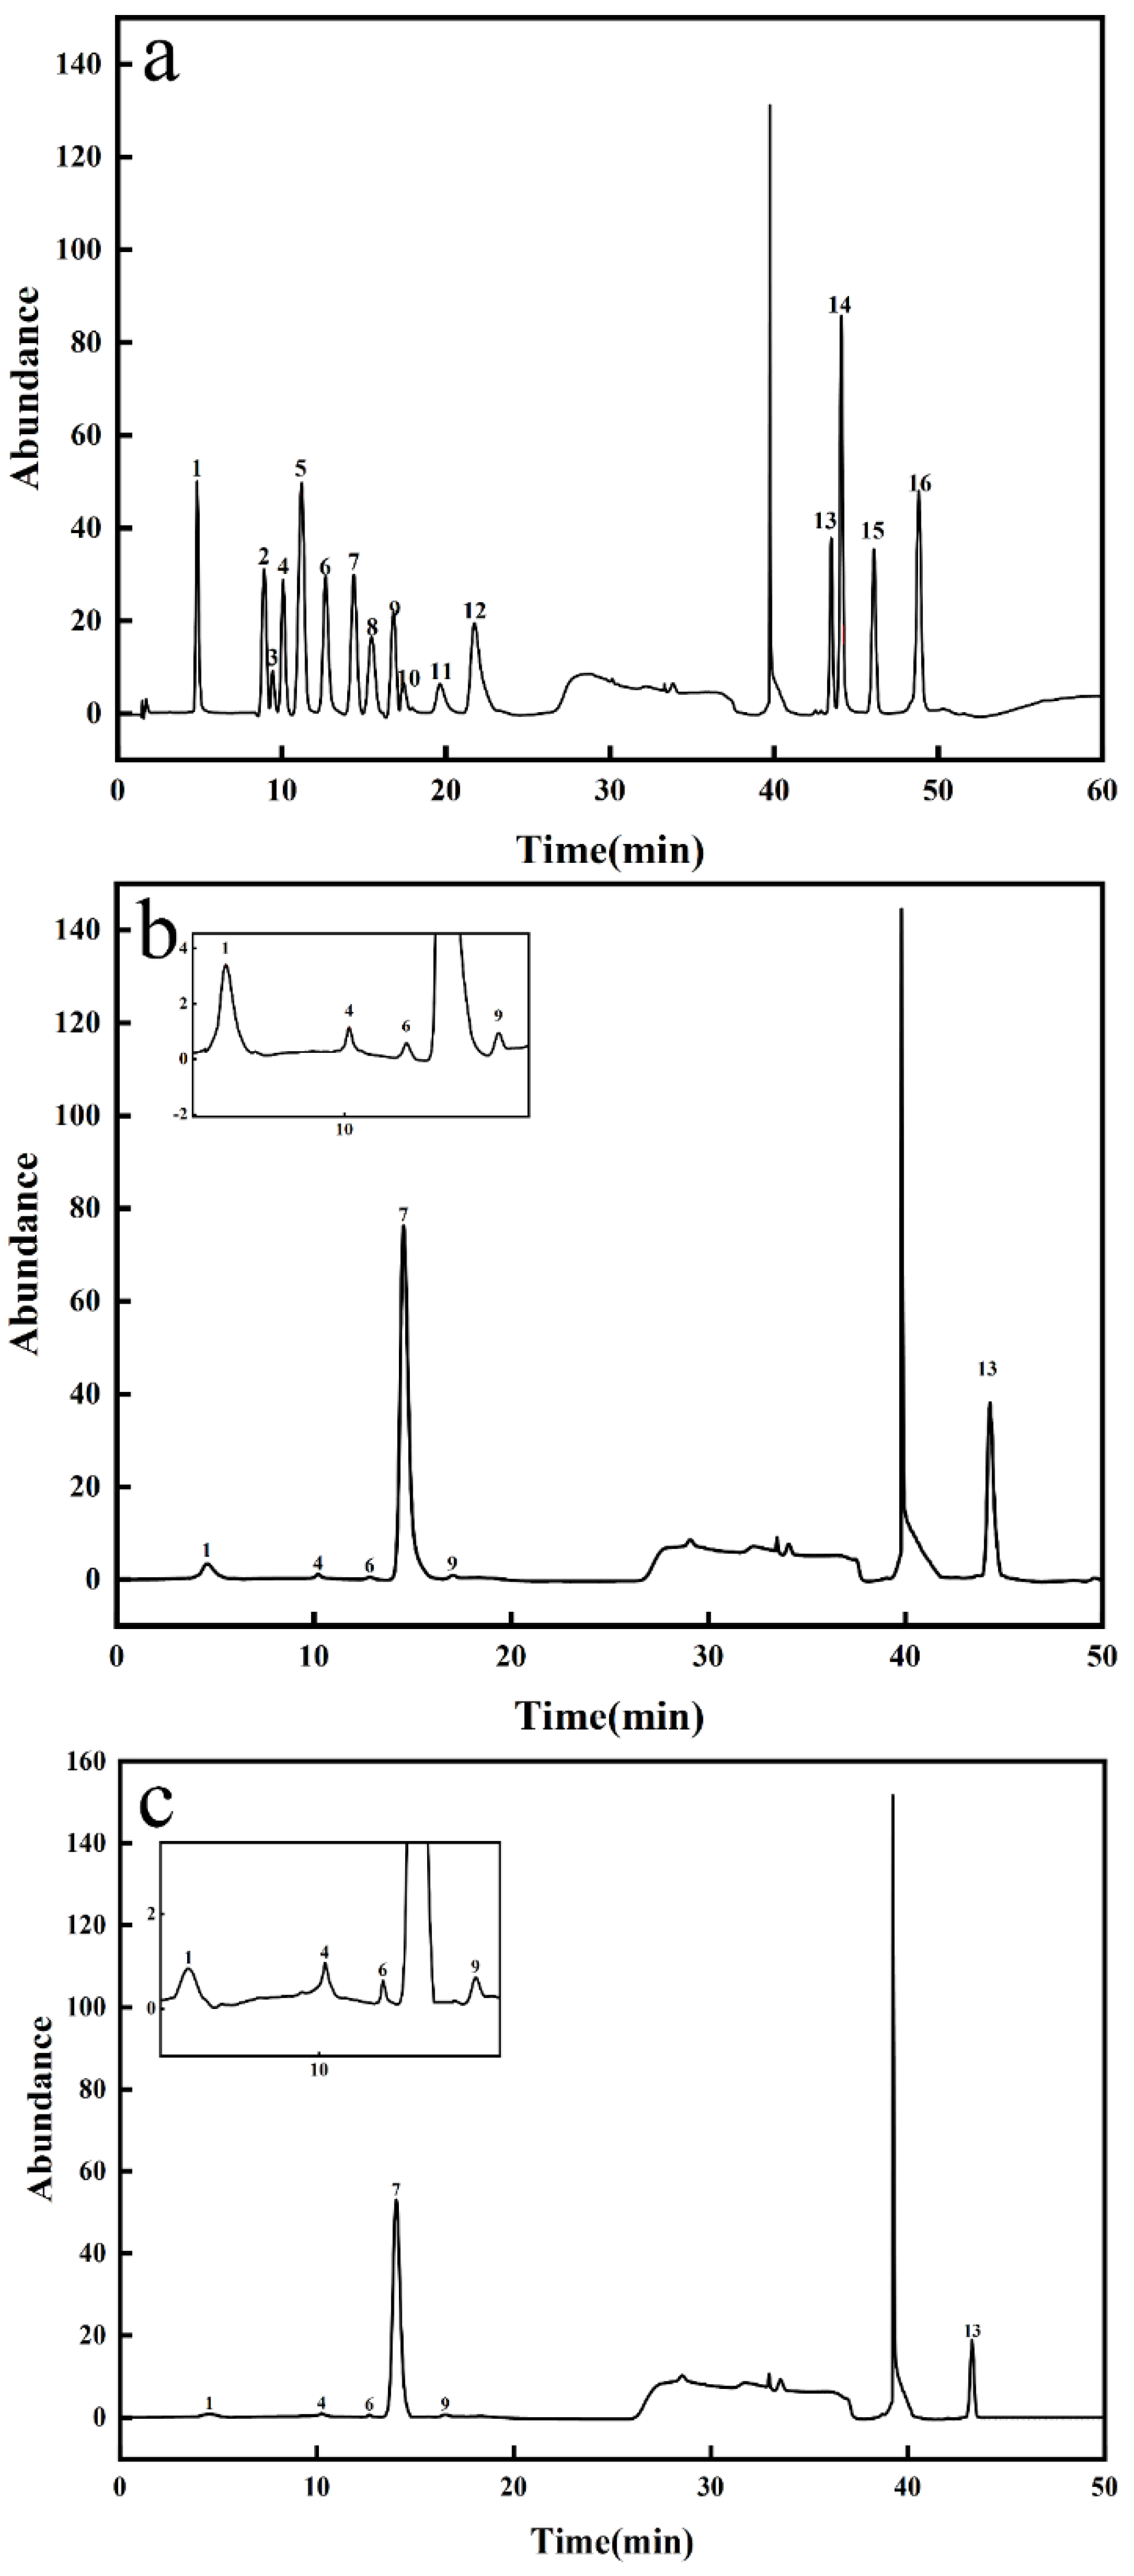
3.3.4. Monosaccharide Composition
3.4. Biological Activity
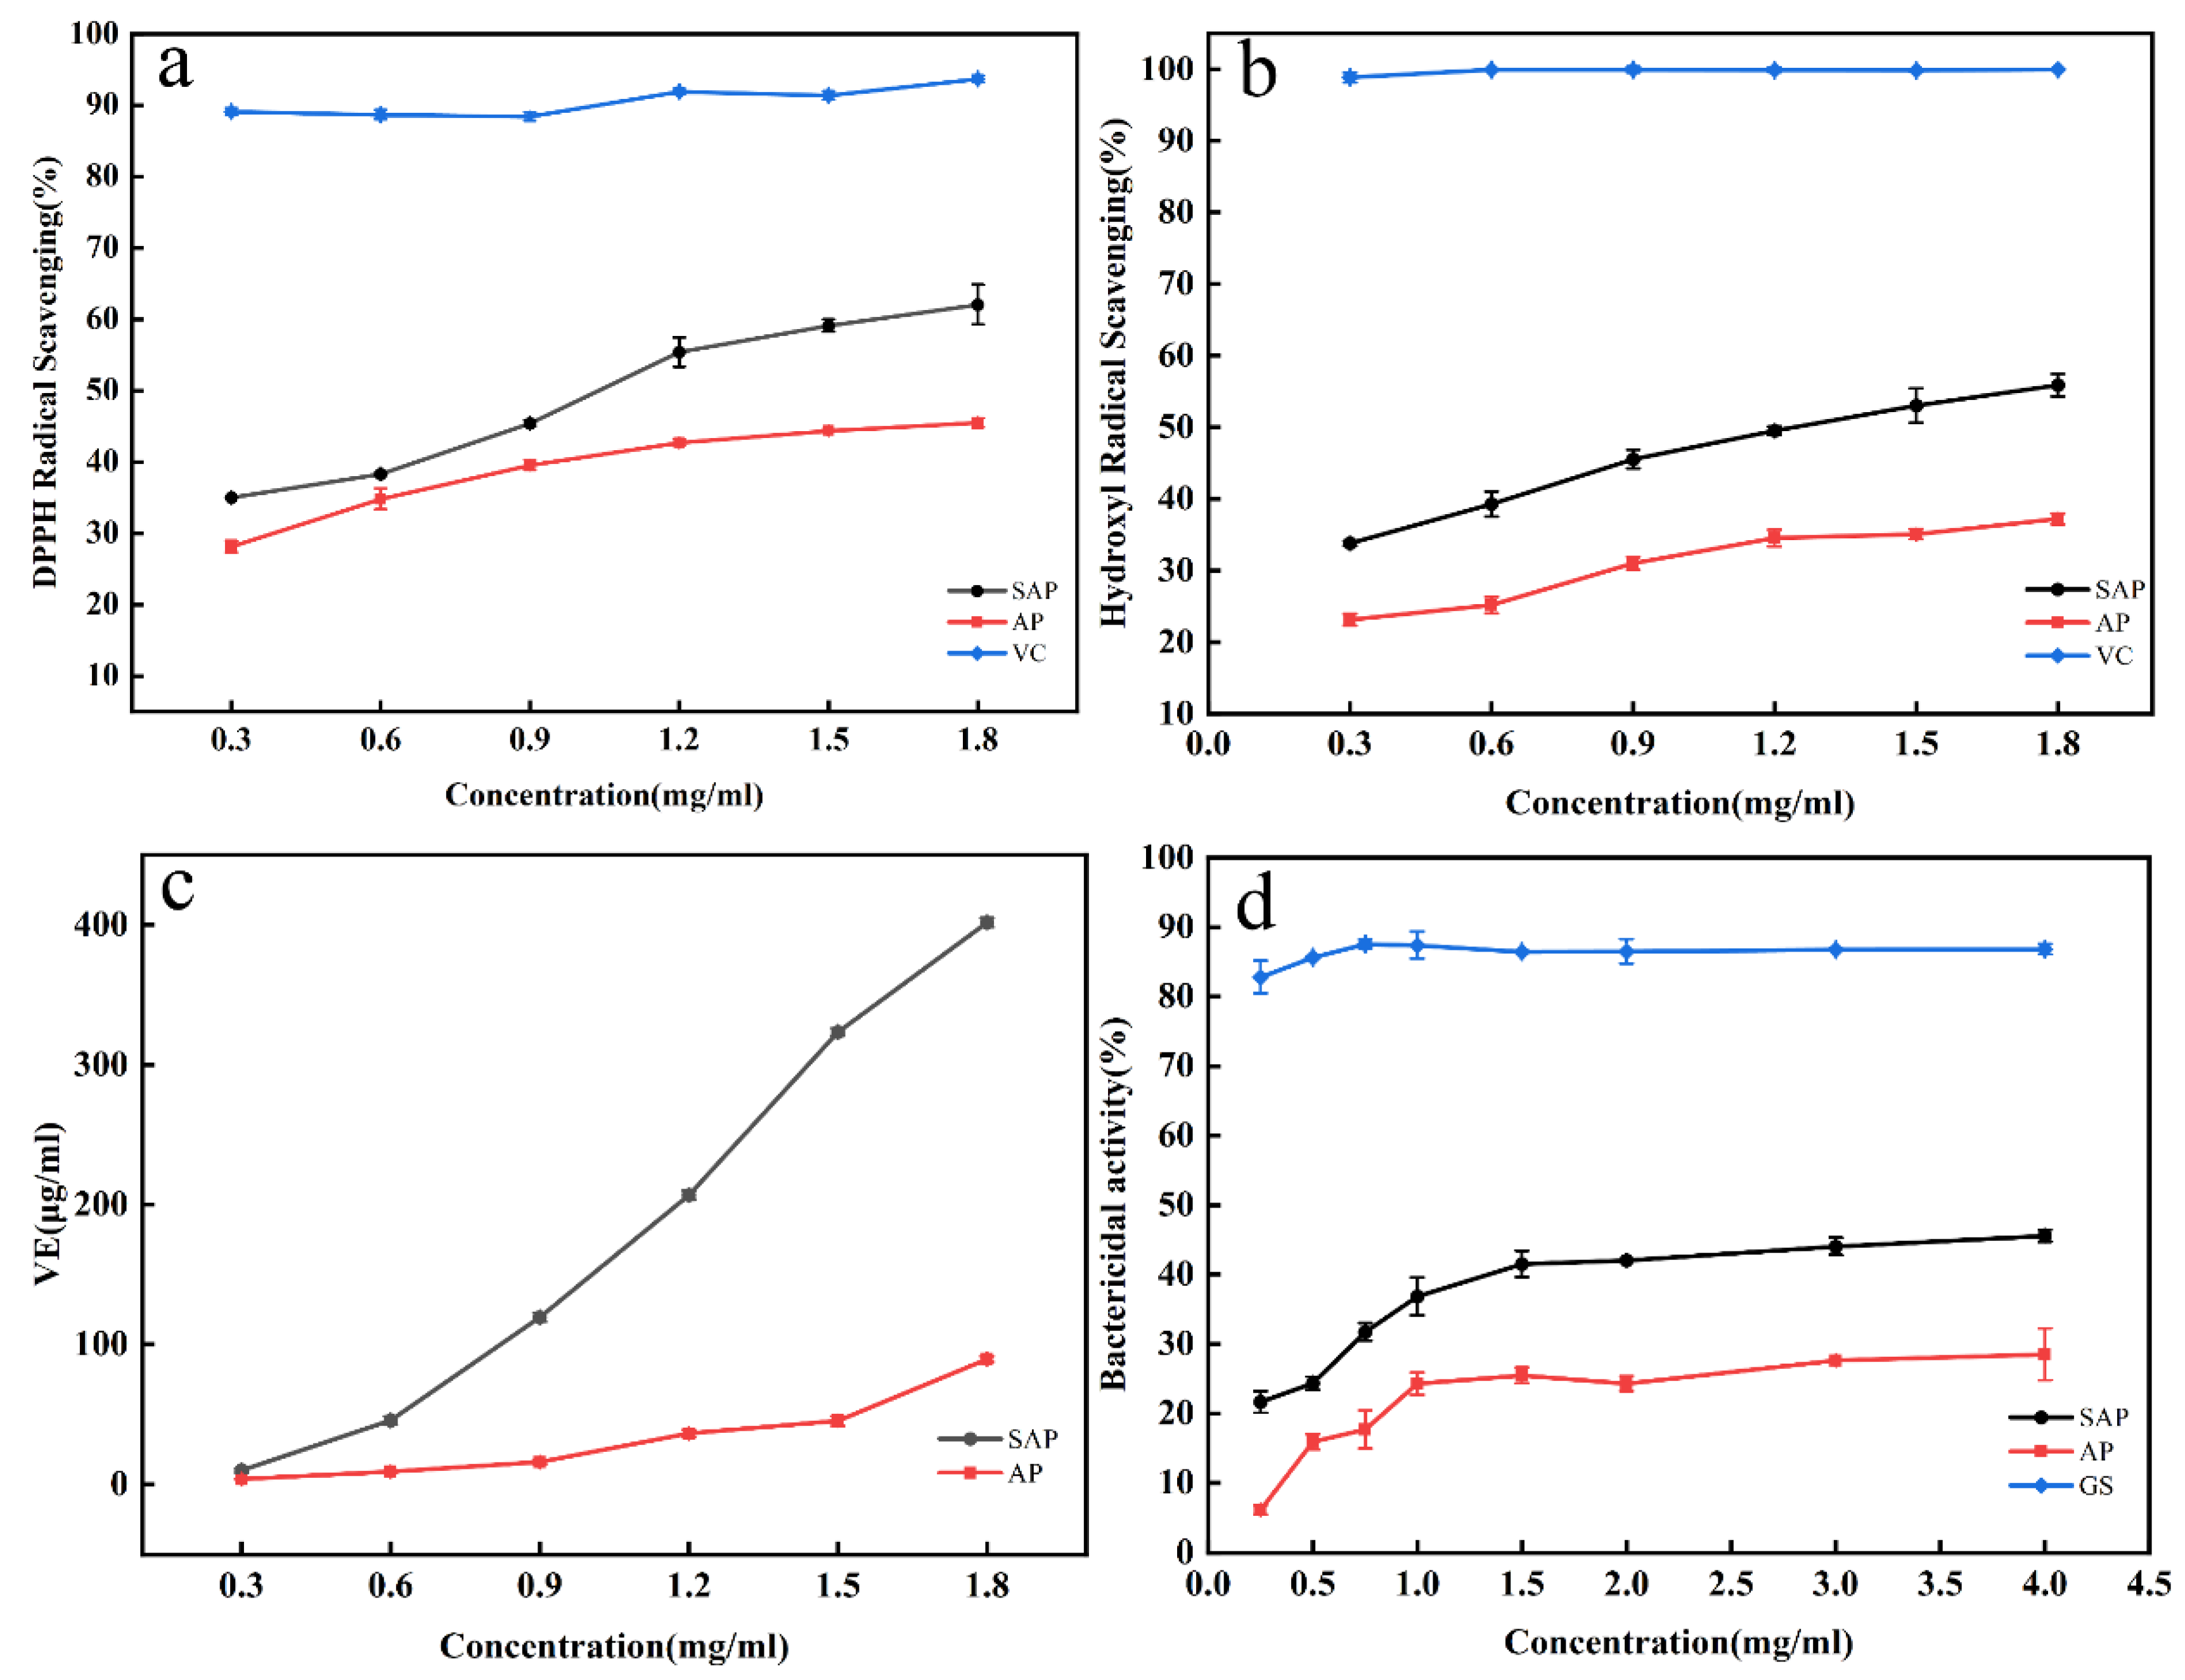
3.4.1. Antioxidant Capacity
3.4.2. Antimicrobial Capacity
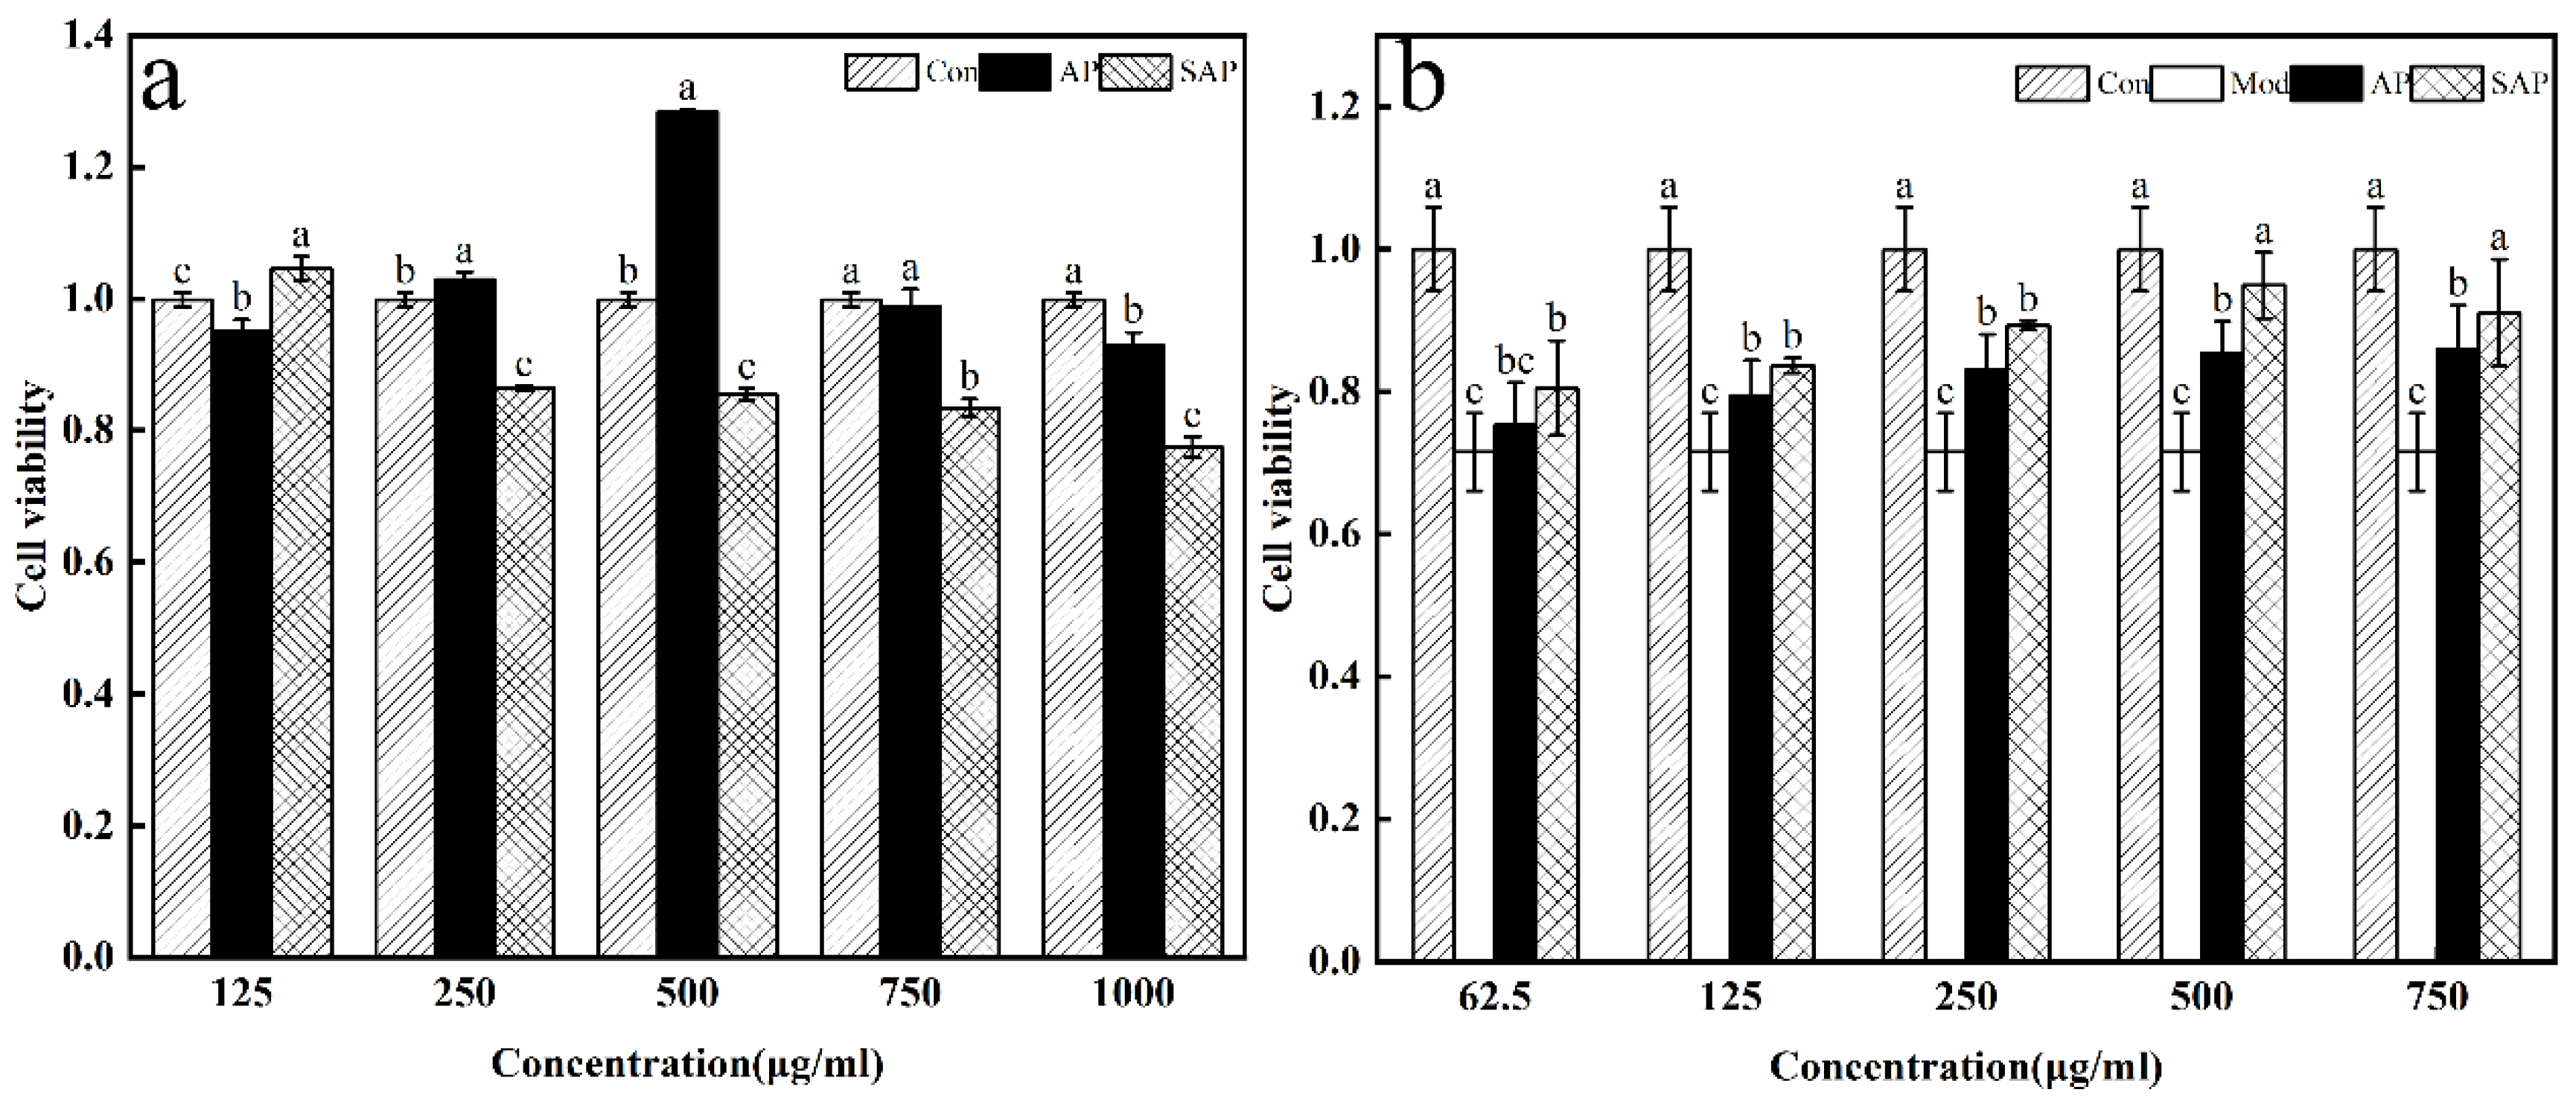
3.4.3. Cell Viability
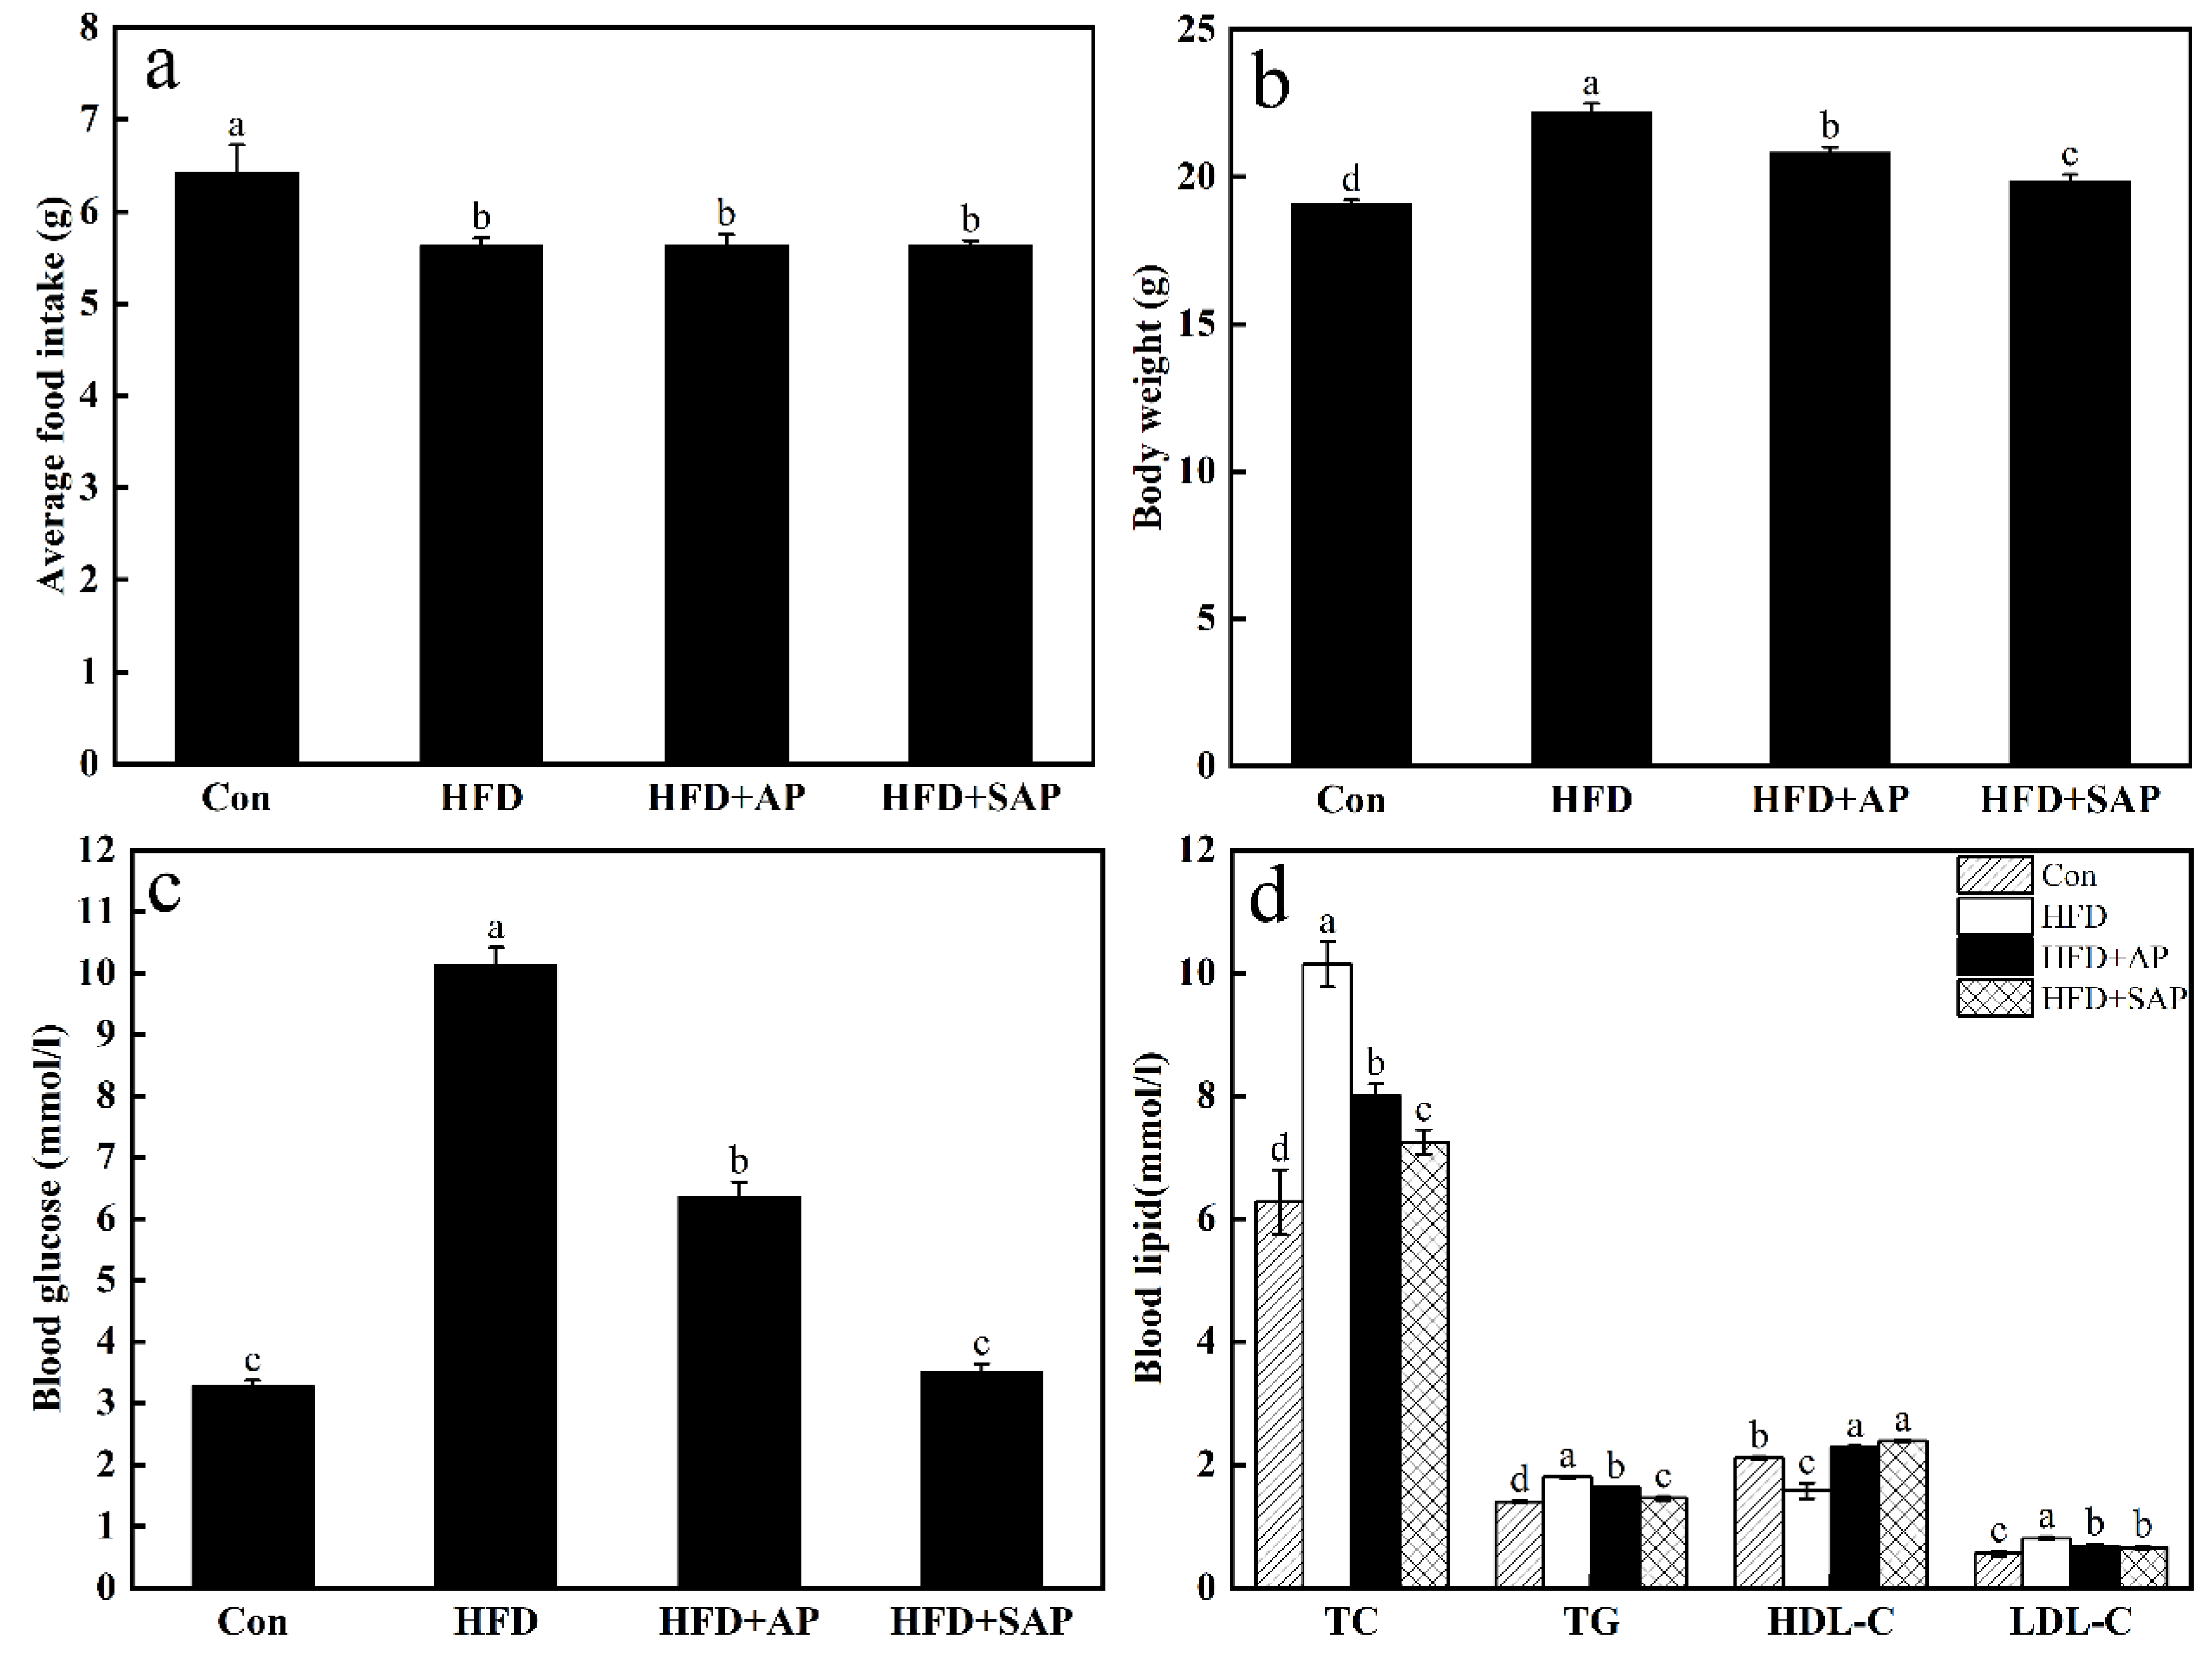
3.4.4. Animal Experiments
4. Discussion
4.1. Sulfation of Alfalfa Polysaccharides
4.2. Structural Characterization
4.3. Biological Activity
5. Conclusions
Author Contributions
Funding
Institutional Review Board Statement
Informed Consent Statement
Data Availability Statement
Conflicts of Interest
References
- Song, Y.R.; Sung, S.K.; Shin, E.J.; Cho, C.W.; Han, C.J.; Hong, H.D. The effect of pectinase-assisted extraction on the physicochemical and biological properties of polysaccharides from aster scaber. Int. J. Mol. Sci. 2018, 19, 2839. [Google Scholar] [CrossRef] [Green Version]
- Salehi, B.; Bayat, M.; Dezfulian, M.; Sabokbar, A.; Tabaraie, B. The assessment of anti-tumoral activity of polysaccharide extracted from terrestrial filamentous fungus. Saudi J. Biol. Sci. 2016, 25, 1236–1241. [Google Scholar] [CrossRef] [PubMed] [Green Version]
- Chen, Y.; Yao, F.K.; Ming, K.; Wang, D.Y.; Hu, Y.L.; Liu, J.G. Polysaccharides from traditional chinese medicines: Extraction, purification, modification, and biological activity. Molecules 2016, 21, 1705. [Google Scholar] [CrossRef] [PubMed]
- Zahran, E.; Risha, E.; AbdelHamid, F.; Mahgoub, H.A.; Ibrahim, T. Effects of dietary astragalus polysaccharides (APS) on growth performance, immunological parameters, digestive enzymes, and intestinal morphology of nile tilapia (Oreochromis Niloticus). Fish Shellfish Immunol. 2014, 38, 149–157. [Google Scholar] [CrossRef] [PubMed]
- Li, X.M.; Ma, Y.L.; Liu, X.J. Effect of the Lycium barbarum polysaccharides on age-related oxidative stress in aged mice. J. Ethnopharmacol. 2007, 111, 504–511. [Google Scholar] [CrossRef] [PubMed]
- Tang, W.M.; Chan, E.; Kwok, C.Y.; Lee, Y.K.; Wu, J.H.; Wan, C.W.; Chan, R.Y.K.; Yu, P.H.F.; Chan, S.W. A review of the anticancer and immunomodulatory effects of Lycium barbarum fruit. Inflammopharmacology 2012, 20, 307–314. [Google Scholar] [CrossRef]
- Li, S.Y.; Yang, D.; Yeung, C.M.; Yu, W.Y.; Chang, R.C.C.; So, K.F.; Wong, D.; Lo, A.C.Y. Lycium barbarum polysaccharides reduce neuronal damage, blood-retinal barrier disruption and oxidative stress in retinal ischemia/reperfusion injury. PLoS ONE 2011, 6, e16380. [Google Scholar] [CrossRef] [Green Version]
- Cor, D.; Hrncic, Z.K.; Hrncic, M.K. Antitumour, antimicrobial, antioxidant and antiacetyl cholinesterase effect of ganoderma lucidum terpenoids and polysaccharides: A review. Molecules 2018, 23, 649. [Google Scholar] [CrossRef] [Green Version]
- Wang, J.Q.; Hu, S.Z.; Nie, S.P.; Yu, Q.; Xie, M.Y. Reviews on mechanisms of in vitro antioxidant activity of polysaccharides. Oxidative Med. Cell. Longev. 2016, 2016, 5692852. [Google Scholar] [CrossRef] [Green Version]
- Chokboribal, J.; Tachaboonyakiat, W.; Sangvanich, P.; Ruangpornvisuti, V.; Jettanacheawchankit, S.; Thunyakitpisal, P. Deacetylation affects the physical properties and bioactivity of acemannan, an extracted polysaccharide from Aloe vera. Carbohydr. Polym. 2015, 133, 556–566. [Google Scholar] [CrossRef]
- Hamuro, J.; Yamashita, Y.; Ohsaka, Y.; Maeda, Y.Y.; Chihara, G. Carboxymethylpachymaran, a new water-soluble polysaccharide with marked antitumour activity. Nature 1971, 233, 486–488. [Google Scholar] [CrossRef] [PubMed]
- Xiong, X.; Huang, G.L.; Huang, H.L. The antioxidant activities of phosphorylated polysaccharide from native ginseng. Int. J. Biol. Macromol. 2019, 126, 842–845. [Google Scholar] [CrossRef] [PubMed]
- Feng, H.B.; Fan, J.; Lin, L.; Liu, Y.J.; Chai, D.K.; Yang, J. Immunomodulatory effects of phosphorylated radix cyathulae officinalis polysaccharides in immunosuppressed mice. Molecules 2019, 24, 4150. [Google Scholar] [CrossRef] [Green Version]
- Zhang, H.; Wang, Z.Y.; Yang, L.; Yang, X.; Wang, X.; Zhang, Z. In vitro antioxidant activities of sulfated derivatives of polysaccharides extracted from Auricularia auricular. Int. J. Mol. Sci. 2011, 12, 3288–3302. [Google Scholar] [CrossRef] [PubMed]
- Li, H.; Xin, X.; Xiong, Q.; Yu, Y.; Peng, L.C. Sulfated modification, characterization, and potential bioactivities of polysaccharide from the fruiting bodies of Russula virescens. Int. J. Biol. Macromol. 2020, 154, 1438–1447. [Google Scholar] [CrossRef] [PubMed]
- Zhao, B.T.; Tao, F.Q.; Wang, J.L.; Zhang, J. The sulfated modification and antioxidative activity of polysaccharides from Potentilla anserine L. New J. Chem. 2020, 44, 4726–4735. [Google Scholar] [CrossRef]
- Gunasekaran, S.; Govindan, S.; Ramani, P. Sulfated modification, characterization and bioactivities of an acidic polysaccharide fraction from an edible mushroom Pleurotus eous (Berk.) Sacc. Heliyon 2021, 7, e05964. [Google Scholar] [CrossRef]
- Zhang, C.; Li, Z.M.; Zhang, C.Y.; Li, M.M.; Lee, Y.; Zhang, G.G. Extract methods, molecular characteristics, and bioactivities of polysaccharide from alfalfa (Medicago sativa L.). Nutrients 2019, 11, 1181. [Google Scholar] [CrossRef] [Green Version]
- Rovkina, K.I.; Krivoshchekov, S.V.; Guryev, A.M.; Yusubov, M.S.; Belousov, M.V. Water-soluble polysaccharides of alfalfa (Medicago sativa (Fabaceae)) of flora of Krasnoyarsk krai. Russ. J. Bioorganic Chem. 2018, 44, 854–859. [Google Scholar] [CrossRef]
- Shang, H.M.; Cao, Z.H.; Zhang, H.X.; Guo, Y.; Zhao, J.C.; Wu, H.X. Physicochemical characterization and in vitro biological activities of polysaccharides from alfalfa (Medicago sativa L.) as affected by different drying methods. Process Biochem. 2020, 103, 39–49. [Google Scholar] [CrossRef]
- Wang, L.X.; Xie, Y.H.; Yang, W.R.; Yang, Z.B.; Jiang, S.Z.; Zhang, C.Y.; Zhang, G.G. Alfalfa polysaccharide prevents H2O2-induced oxidative damage in MEFs by activating MAPK/Nrf2 signaling pathways and suppressing NF-κB signaling pathways. Sci. Rep. 2019, 9, 502–511. [Google Scholar] [CrossRef] [PubMed] [Green Version]
- Dubios, M.; Gilles, K.A.; Hamilton, J.K.; Rebers, P.A.; Smith, F. Colorimetric method for determination of sugar and related substances. Anal. Chem. 1956, 28, 250–256. [Google Scholar] [CrossRef]
- Lott, J.A.; Stephan, V.A.; Pritchard, K.A. Evaluation of the coomassie brilliant blue g-250 method for urinary protein. Clin. Chem. 1983, 29, 1946–1950. [Google Scholar] [CrossRef] [PubMed]
- Song, X.P.; Tang, J. Extraction optimization, preliminary characterization and bioactivities in vitro of Ligularia hodgsonii polysaccharides. Int. J. Mol. Sci. 2016, 17, 788. [Google Scholar] [CrossRef] [PubMed] [Green Version]
- Sun, Y.; Shi, X.D.; Zheng, X.; Nie, S.P.; Xu, X.J. Inhibition of dextran sodium sulfate-induced colitis in mice by baker’s yeast polysaccharides. Carbohydr. Polym. 2018, 207, 371–381. [Google Scholar] [CrossRef] [PubMed]
- Yuan, F.F.; Gao, Z.; Liu, W.B.; Li, H.P.; Zhang, Y.W.; Feng, Y.B.; Song, X.L.; Wang, W.S.; Zhang, J.J.; Huang, C.Y.; et al. Characterization, antioxidant, anti-aging and organ protective effects of sulfated polysaccharides from flammulina velutipes. Molecules 2019, 24, 3517. [Google Scholar] [CrossRef] [Green Version]
- Nie, Z.P.; Wan, C.P.; Chen, C.Y.; Chen, J.Y. Comprehensive evaluation of the postharvest antioxidant capacity of majiayou pomelo harvested at different maturities based on pca. Antioxidants 2019, 8, 136. [Google Scholar] [CrossRef] [Green Version]
- Wootton-Beard, P.C.; Moran, A.; Ryan, L. Stability of the total antioxidant capacity and total polyphenol content of 23 commercially available vegetable juices before and after in vitro digestion measured by FRAP, DPPH, ABTS and Folin–Ciocalteu methods. Food Res. Int. 2011, 44, 217–224. [Google Scholar] [CrossRef]
- Zhang, C.Y.; Gan, L.P.; Du, M.Y.; Shang, Q.H.; Xie, Y.H.; Zhang, G.G. Effects of dietary supplementation of alfalfa polysaccharides on growth performance, small intestinal enzyme activities, morphology, and large intestinal selected microbiota of piglets. Livest. Sci. 2019, 223, 47–52. [Google Scholar] [CrossRef]
- Legan, L.; Retko, K.; Peeters, K.; Knez, F.; Ropret, P. Investigation of proteinaceous paint layers, composed of egg yolk and lead white, exposed to fire-related effects. Sci. Rep. 2020, 10, 1–16. [Google Scholar] [CrossRef]
- Han, Y.; Ouyang, K.; Li, J.; Liu, X.; An, Q.; Zhao, M.; Chen, S.; Li, X.; Ye, X.; Zhao, Z.; et al. Sulfated modification, characterization, immunomodulatory activities and mechanism of the polysaccharides from Cyclocarya paliurus on dendritic cells. Int. J. Biol. Macromol. 2020, 159, 108–116. [Google Scholar] [CrossRef]
- Wang, J.L.; Guo, H.Y.; Zhang, J.; Wang, X.F.; Zhao, B.T.; Yao, J.A.; Wang, Y.P. Sulfated modification, characterization and structure–antioxidant relationships of Artemisia sphaerocephala polysaccharides. Carbohydr. Polym. 2010, 81, 897–905. [Google Scholar] [CrossRef]
- Cacic, M.; Pavic, V.; Molnar, M.; Sarkanj, B.; Has-Schoen, E. Design and synthesis of some new 1,3,4-thiadiazines with coumarin moieties and their antioxidative and antifungal activity. Molecules 2014, 19, 1163–1177. [Google Scholar] [CrossRef] [Green Version]
- Kim, H.M.; Song, Y.; Hwan, G.; Long, N.P.; Fazio, A. Characterization and antioxidant activity determination of neutral and acidic polysaccharides from Panax ginseng c. a. meyer. Molecules 2020, 25, 791. [Google Scholar] [CrossRef] [Green Version]
- Zeng, C.; Luo, S.Y.; Feng, S.L.; Chen, T.; Zhou, L.J.; Yuan, M.; Huang, Y.; Liao, J.Q.; Ding, C.B. Phenolic composition, antioxidant and anticancer potentials of extracts from Rosa banksiae ait. Flowers. Molecules 2020, 25, 3068. [Google Scholar] [CrossRef]
- Sun, N.X.; Liu, H.P.; Liu, S.J.; Zhang, X.Y.; Chen, P.; Li, W.H.; Xu, X.X.; Tian, W.T. Purification, preliminary structure and antitumor activity of exopolysaccharide produced by Streptococcus thermophilus CH9. Molecules 2018, 23, 2898. [Google Scholar] [CrossRef] [Green Version]
- Presa, F.B.; Marques, M.L.M.; Viana, R.L.S.; Nobre, L.T.D.B.; Costa, L.S.; Rocha, H.A.O. The protective role of sulfated polysaccharides from green seaweed udotea flabellum in cells exposed to oxidative damage. Mar. Drugs 2018, 16, 135. [Google Scholar] [CrossRef] [Green Version]
- Van, D.M.N.; Epinette, C.; Loyau, J.; Arnault, L.; Domelier, A.S.; Losfelt, B.; Girard, N.; Quentin, R. Staphylococcus aureus strains isolated from bloodstream infections changed significantly in 2006. J. Clin. Microbiol. 2007, 45, 851–857. [Google Scholar]
- Romulo, A.; Zuhud, E.A.M.; Rondevaldova, J.; Kokoska, L. Screening of in vitro antimicrobial activity of plants used in traditional Indonesian medicine. Pharm. Bio. 2018, 56, 287–293. [Google Scholar] [CrossRef] [Green Version]
- Arokiyaraj, S.; Bharanidharan, R.; Agastian, P.; Shin, H. Chemical composition, antioxidant activity and antibacterial mechanism of action from Marsilea minuta leaf hexane: Methanol extract. Chem. Cent. J. 2018, 12, 1–11. [Google Scholar] [CrossRef]
- He, F.; Yang, Y.; Yang, G.; Yu, L.J. Studies on antibacterial activity and antibacterial mechanism of a novel polysaccharide from Streptomyces virginia H03. Food Control. 2010, 21, 1257–1262. [Google Scholar] [CrossRef]
- Collins, K.H.; Paul, H.A.; Hart, D.A.; Reimer, R.A.; Smith, I.C.; Rios, J.L.; Seerattan, R.A.; Herzog, W. A high-fat high-sucrose diet rapidly alters muscle integrity, inflammation and gut microbiota in male rats. Sci. Rep. 2016, 6, 1–10. [Google Scholar] [CrossRef]
- Li, C.L.; Wu, G.S.; Zhao, H.L.; Dong, N.; Wu, B.W.; Chen, Y.J.; Lu, Q. Natural-derived polysaccharides from plants, mushrooms, and seaweeds for the treatment of inflammatory bowel disease. Front. Pharmacol. 2021, 12, 755. [Google Scholar] [CrossRef]
- Wang, X.F.; Li, Y.L.; Yang, X.J.; Yao, J.H. Astragalus polysaccharide reduces inflammatory response by decreasing permeability of lps-infected CACO2 cells. Int. J. Bio. 2013, 61, 347–352. [Google Scholar] [CrossRef]
- Li, X.Y.; Wang, Z.Y.; Lu, L.; Walid, E.; Hua, H. In vitro antioxidant and anti-proliferation activities of polysaccharides from various extracts of different mushrooms. Int. J. Mol. Sci. 2012, 13, 5801–5817. [Google Scholar] [CrossRef] [Green Version]
- Parra-Riofrío, G.; García-Márquez, J.; Casas-Arrojo, V.; Uribe-Tapia, E.; Abdala-Díaz, R.T. Marine drugs antioxidant and cytotoxic effects on tumor cells of exopolysaccharides from Tetraselmis suecica (Kylin) butcher grown under autotrophic and heterotrophic conditions. Mar. Drugs 2020, 18, 534. [Google Scholar] [CrossRef]
- He, D.; Yan, L.; Ma, X.; Cheng, Y.; Tong, H. Gammairradiation degraded sulfated polysaccharide from a new red algal strain Pyropia yezoensis sookwawon 104 with in vitro antiproliferative activity. Oncol Lett. 2020, 20, 91–99. [Google Scholar] [CrossRef]
- Birse, R.T.; Choi, J.; Reardon, K.; Rodriguez, J.; Graham, S.; Diop, S.; Ocorr, K.; Bodmer, R.; Oldham, S. High-Fat-Diet-Induced Obesity and Heart Dysfunction Are Regulated by the TOR Pathway in Drosophila. Cell Metab. 2010, 12, 533–544. [Google Scholar] [CrossRef] [Green Version]
- Guh, D.P.; Zhang, W.; Bansback, N.; Amarsi, Z.; Anis, A.H. The incidence of co-morbidities related to obesity and overweight: A systematic review and meta-analysis. BMC Public Health 2009, 9, 1–20. [Google Scholar] [CrossRef] [Green Version]
- Kostecka, M.; Bojanowska, M. Problems in bariatric patient care—Challenges for dieticians. Videosurgery Other Miniinvasive Tech. 2017, 12, 207–215. [Google Scholar] [CrossRef] [Green Version]
- Andrea, D.; Giuseppe, A.; Gian, C.T.; Vanessa, P.; Aldo, M.; Fernanda, V. Diet-Derived Antioxidants and Their Role in Inflammation, Obesity and Gut Microbiota Modulation. Antioxidants 2021, 10, 708–730. [Google Scholar]
- Lee, H.S.; Lim, S.M.; Jung, J.I.; Kim, S.M.; Lee, J.K.; Kim, Y.H.; Cha, K.M.; Oh, T.K.; Moon, J.M.; Kim, T.Y.; et al. Gynostemma Pentaphyllum Extract Ameliorates High-Fat Diet-Induced Obesity in C57BL/6N Mice by Upregulating SIRT1. Nutrients 2019, 11, 2475. [Google Scholar] [CrossRef] [PubMed] [Green Version]
- Hong, Y.; Li, B.; Zheng, N.; Wu, G.; Ma, J.; Tao, X.; Chen, L.; Zhong, J.; Sheng, L.; Li, H. Integrated Metagenomic and Metabolomic Analyses of the Effect of Astragalus Polysaccharides on Alleviating High-Fat Diet–Induced Metabolic Disorders. Front. Pharmacol. 2020, 11, 833. [Google Scholar] [CrossRef] [PubMed]
- Roha, H.T.; Sob, W.Y. The effects of aerobic exercise training on oxidant–antioxidant balance, neurotrophic factor levels, and blood–brain barrier function in obese and non-obese men. J. Sport Health Sci. 2017, 6, 447–453. [Google Scholar] [CrossRef] [Green Version]


| Independent Variable | Symbol | Factor Level | |||
|---|---|---|---|---|---|
| Coded | Uncoded | −1 | 0 | 1 | |
| Reaction temperature (°C) | y1 | X1 | 40 | 50 | 60 |
| Ratio of CSA to PYR (mL/mL) | y2 | X2 | 0.5 | 1.25 | 2 |
| Reaction time (h) | y3 | X3 | 2 | 2.5 | 3 |
| Experiment | A:temperature (°C) | B: The Ratio of CSA to PYR (mL/mL) | C: Time (h) | Reality DS | Predicted DS |
|---|---|---|---|---|---|
| 1 | 50 | 1.25 | 2.5 | 0.683 | 0.688 |
| 2 | 50 | 1.25 | 2.5 | 0.701 | 0.688 |
| 3 | 50 | 0.5 | 3 | 0.542 | 0.552 |
| 4 | 60 | 1.25 | 2 | 0.682 | 0.666 |
| 5 | 40 | 0.5 | 2.5 | 0.573 | 0.560 |
| 6 | 50 | 1.25 | 2.5 | 0.691 | 0.688 |
| 7 | 60 | 1.25 | 3 | 0.486 | 0.477 |
| 8 | 40 | 1.25 | 2 | 0.471 | 0.470 |
| 9 | 40 | 1.25 | 3 | 0.513 | 0.519 |
| 10 | 50 | 1.25 | 2.5 | 0.708 | 0.688 |
| 11 | 60 | 0.5 | 2.5 | 0.635 | 0.638 |
| 12 | 50 | 0.5 | 2 | 0.583 | 0.579 |
| 13 | 60 | 2 | 2.5 | 0.632 | 0.643 |
| 14 | 50 | 1.25 | 2.5 | 0.681 | 0.688 |
| 15 | 50 | 2 | 3 | 0.489 | 0.492 |
| 16 | 40 | 2 | 2.5 | 0.572 | 0.568 |
| 17 | 50 | 2 | 2 | 0.666 | 0.653 |
| Source | Sum of Squares | df | Mean Square | F-Value | p-Value |
|---|---|---|---|---|---|
| Model | 0.1093 | 9 | 0.0121 | 50.77 | <0.0001 |
| A | 0.0117 | 1 | 0.0117 | 48.95 | 0.0002 |
| B | 0.0001 | 1 | 0.0001 | 0.3534 | 0.5709 |
| C | 0.0173 | 1 | 0.0173 | 72.34 | <0.0001 |
| AB | 1.0 × 10⁻⁶ | 1 | 1.0 × 10⁻⁶ | 0.0042 | 0.9502 |
| AC | 0.0142 | 1 | 0.0142 | 59.22 | 0.0001 |
| BC | 0.0046 | 1 | 0.0046 | 19.34 | 0.0032 |
| A² | 0.0156 | 1 | 0.0156 | 65.31 | <0.0001 |
| B² | 0.0035 | 1 | 0.0035 | 14.71 | 0.0064 |
| C² | 0.0371 | 1 | 0.0371 | 155.26 | <0.0001 |
| Lack of Fit | 0.0011 | 3 | 0.0003 | 2.82 | 0.1708 |
| Physicochemical Properties | AP | SAP |
|---|---|---|
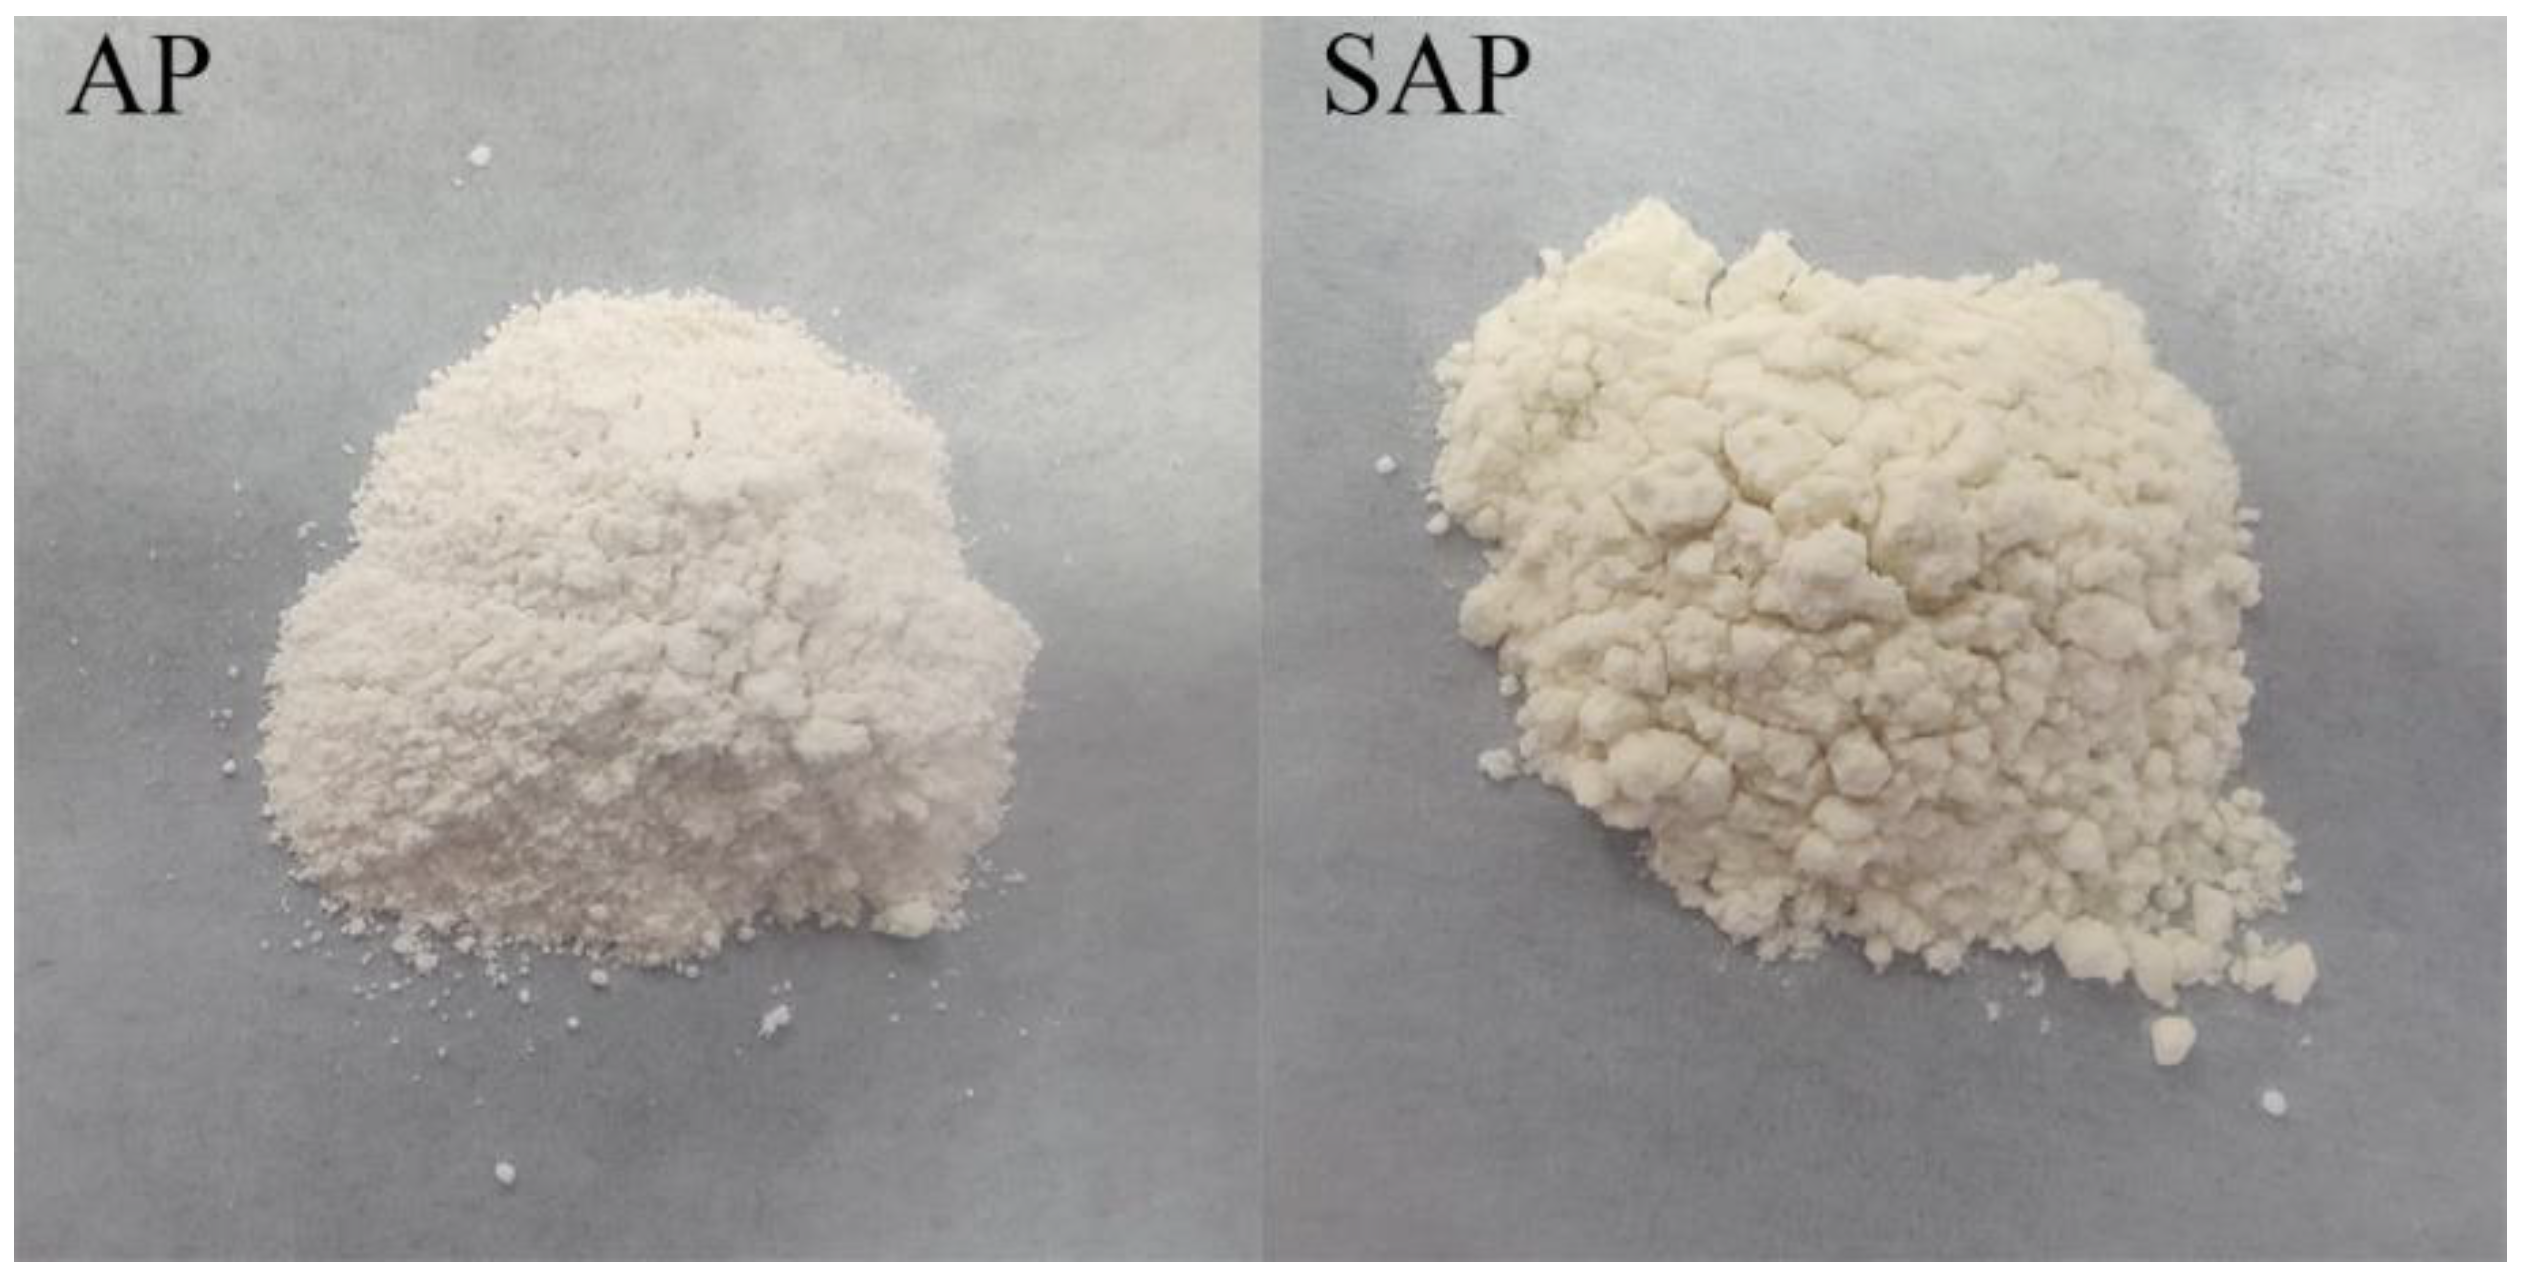
| Color observation | white | light yellow |
| Solubility | soluble | easily soluble |
| Carbohydrate (%) | 91.45% | 71.54% |
| Protein (%) | 0.11% | 0.024% |
| S (%) | none | 9.82% |
| DS | none | 0.724 |
Publisher’s Note: MDPI stays neutral with regard to jurisdictional claims in published maps and institutional affiliations. |
© 2022 by the authors. Licensee MDPI, Basel, Switzerland. This article is an open access article distributed under the terms and conditions of the Creative Commons Attribution (CC BY) license (https://creativecommons.org/licenses/by/4.0/).
Share and Cite
Li, Z.; Wei, Y.; Wang, Y.; Zhang, R.; Zhang, C.; Wang, C.; Yan, X. Preparation of Highly Substituted Sulfated Alfalfa Polysaccharides and Evaluation of Their Biological Activity. Foods 2022, 11, 737. https://doi.org/10.3390/foods11050737
Li Z, Wei Y, Wang Y, Zhang R, Zhang C, Wang C, Yan X. Preparation of Highly Substituted Sulfated Alfalfa Polysaccharides and Evaluation of Their Biological Activity. Foods. 2022; 11(5):737. https://doi.org/10.3390/foods11050737
Chicago/Turabian StyleLi, Zhiwei, Yuanhao Wei, Yawen Wang, Ran Zhang, Chuanjie Zhang, Caixing Wang, and Xuebing Yan. 2022. "Preparation of Highly Substituted Sulfated Alfalfa Polysaccharides and Evaluation of Their Biological Activity" Foods 11, no. 5: 737. https://doi.org/10.3390/foods11050737
APA StyleLi, Z., Wei, Y., Wang, Y., Zhang, R., Zhang, C., Wang, C., & Yan, X. (2022). Preparation of Highly Substituted Sulfated Alfalfa Polysaccharides and Evaluation of Their Biological Activity. Foods, 11(5), 737. https://doi.org/10.3390/foods11050737