Abstract
This work intends to determine the effect on the aroma profile, phenolic content and antioxidant activity of prickly pear vinegars produced by the surface culture at two different fermentation temperatures and using different acetic acid bacteria (AAB) inocula. Prickly pear wine was fermented at two temperature levels (30 and 37 °C) by using bacteria inocula containing Acetobacter, Gluconobacter or a mixture of bacteria isolated from Sherry vinegars. Eighty-five individual volatile compounds from different families and sixteen polyphenolic compounds have been identified. It was confirmed that the highest temperature tested (37 °C) resulted in a lower concentration of volatile compounds, while no significant effect on the vinegars’ volatile composition could be associated with the AAB inoculum used. Contrariwise, the highest content of polyphenolic compounds was detected in those vinegars produced at 37 °C and their concentration was also affected by the type of AAB inoculum used. Prickly pear wine displayed greater antioxidant activity than juices or vinegars, while the vinegars obtained through the mixture of AAB from Sherry vinegar showed higher antiradical activity than those obtained through either of the two AAB genera used in this study. It can be therefore concluded that, although the volatile content of vinegars decreased when fermented at a higher temperature, vinegars with a higher content in polyphenols could be obtained by means of partial fermentations at 37 °C, as long as thermotolerant bacteria were employed.
1. Introduction
Opuntia ficus-indica (L). Mill. is a plant that belongs to the Cactaceae family and can grow in arid and semi-arid climates. Its common name is prickly pear, nopal cactus or cactus pear. It originally comes from tropical or subtropical American regions, but it has already been naturalized on all continents [1]. In Morocco, around one hundred and fifty thousand hectares of area are cultivated with O. ficus-indica and the annual production of prickly pear under optimal conditions can reach up to 20 tons dry matter/hectare/per year [2]. The prickly pear fruit pulp is considered to be the most edible and interesting part to be processed for alimentary purposes. These fruits contain health-promoting substances, since they are a good source of nutrients such as polyphenols and betalains [3]. The biochemical composition of cactus fruits changes over their development and ripening. This depends not only on the plant variety but also on the color, number of seeds, size, sugars, fats, proteins, pectins and non-volatile organic acids contents [4].
Vinegar is a food condiment that is worldwide produced from a variety of raw materials, that can be vegetables, fruits or grains. Many types of vinegar are currently commercialized, including balsamic, rice, wine or black vinegar. These vinegar varieties present unique characteristics, flavors and tastes depending on the raw material used for their production, the fermenting procedures and the microorganisms involved in the process [5].
Prickly pear juice, because of its high sugar content and low acid blend, seems to be an interesting alternative for the production of vinegar [2]. Obtaining vinegar from cactus pear juice would be a new way to valorize cactus fruit through a simple process that can be performed at different industrial scales [6]. Two vinegar production methods are generally recognized, the slow traditional or surface method and the quick industrial or submerged one [7]. Both the method employed, as well as the fermentation time allowed, have an impact on vinegar quality. Vinegars obtained through the traditional method usually have a better sensory quality, with particularly richer aromas than those of the vinegars elaborated using the industrial method. On the other hand, the submerged method is a more economical process that leads to greater yields and is therefore generally preferred by industrial producers [8,9]. Vinegar quality is the end result of a number of factors, such as raw material, acetification conditions and acetic acid bacteria metabolism, which involves the production of acetic acid from ethanol as well as other transformation processes such as oxidations or the formations of esters, among others [10].
A number of studies have already revealed how important the production method is with respect to the vinegar’s final aroma profile and hence to their organoleptic qualities [9,11]. Beside the production method, there are other parameters that exert an influence on the proportion of certain compounds, such as volatile and phenolic compounds, which are key to determining vinegar quality—certain acetification parameters, such as the amount of oxygen, the optimum temperature and the substrate loading, are some of these key indicators [12]. In order to control and optimize vinegar quality, some recent studies on fruit vinegar production have focused on the isolation of certain acetic acid bacteria, on the processing conditions and on the vinegars’ phenolic and aromatic profiles [13]. Apart from the above-mentioned parameters, vinegar production using different bacteria strains, depending on their tolerance to acetic acid high concentrations, has been tested [14]; thus, at lower concentrations of acetic acid in the medium, certain species of the Acetobacter genus predominate, where Acetobacter aceti is generally the most often employed for vinegar production [15]; however, when the acetic acid content reaches over 5%, the species from the Gluconacetobacter genus are more effective [14,16,17]. Moreover, both high temperature and high ethanol concentrations have an evident effect on vinegar fermentation processes; thus, thermotolerant and ethanol-resistant strains are expected to become feasible technologies for effective vinegar fermentation under unfavorable acetification conditions.
Each vinegar's sensory characteristics, as well as its different flavors and aromas, are determined by the pungent flavor of the acetic acid used for its production. Organic acids, essential amino acids, vitamins, minerals, volatile compounds and other fermentation products also play a major role regarding the organoleptic properties of vinegars [18].
Vinegar aroma, in particular, which depends on a large number of volatile compounds, is one of its most determinant characteristics with regard to food quality and consumer acceptance. These compounds may either be present in the raw material itself or may be generated over the production process [19]. In the particular case of prickly pear fruit vinegar, alcohols and esters are considered to be key aroma substances, responsible for its characteristic faint melon or cucumber-like aroma. 2-(E/Z)-2,6-nonadien-1-ol and 2-methylbutanoic acid methyl ester have been identified as the volatile compounds that confer cactus fruit vinegar with their distinctive aroma [20]; however, in a recent study, Farag et al. reported that the predominant volatile compounds in this fruit were short-chain aldehydes (25–32%) and acids (25–29%) [21].
Phenolic compounds, on the other hand, seem to be secondary metabolites that are closely related to the color and flavor traits of fruits, juices, and wines [22]. Some recent studies on Opuntia spp. stated that cactus pear fruit is a good candidate to develop new healthy food, because of their high content of biofunctional polyphenolic compounds [23,24]; thus, the polyphenolic fingerprint of prickly pear products is mainly characterized by the presence of flavonols and phenolic acids [25,26]. Particularly, among the minor compounds in O. ficus-indica, betalains and polyphenols seem to be the most valuable antioxidants with regard to the nutritional quality of prickly pears and of their transformation products [27]. Other studies have reported that prickly pear juice is rich in phenolic compounds that act as effective radical scavengers [28]. Several polyphenolic compounds, mainly represented by ferulic acid derivative, rutin, gallic acid and catechin, have been identified in prickly pear pulp [29,30]. A simple way to evaluate the global antioxidant potential of a food, due to the presence of the different bioactive substances present such as polyphenols, is the determination of its antioxidant activity. Although there are clear differences between the antioxidant activity in vitro and in vivo [31], the in vitro measurement could give an initial idea of the possible healthy character of a certain food product.
In view of all the above said, this study intends to investigate and evaluate, on the one hand, the effect of different fermentation temperatures and bacteria inocula on the concentration of volatile and phenolic compounds in final prickly pear vinegars, and, on the other, to determine the antioxidant activity of a number of prickly pear samples. In the present study, three types of acetic acid bacteria inocula have been used to accomplish the fermentation of a Moroccan prickly pear wine to produce prickly pear vinegar under two temperatures (30 and 37 °C), all of them according to a surface culture production method. To the best of our knowledge, this is the first work that deals with the analytical characterization of prickly pear vinegars produced under different surface culture conditions.
2. Materials and Methods
2.1. Fruit
The prickly pear fruits (yellow-orange color) from wild cultivars grown in Marrakesh-Safi-Morocco region (coordinates: 31°37′ N 8°0′ W) were harvested during August (2019). Each fruit piece was manually peeled off and the pulp was weighed and preserved under frozen storage (−80 °C) until further procedures. The prickly pear fruit pulps were mechanically crushed using a conventional household blender. Then, the pulp mixture was homogenized and filtrated using a colander (0.5 mm mesh size) in order to separate the juice from the seeds. The juice was stored at 4 °C until its analysis. The °Brix, °Baumé, pH and density values of the final juice were measured at 20 °C by means of a DMA 4500 M densimeter (Anton Paar, Graz, Austria).
2.2. Alcoholic Fermentation
The alcoholic fermentation was performed at a pilot scale using stainless-steel tanks covered by mosquito nets to avoid any contamination by insects. Twenty-five liters of the final prickly pear juice were fermented in duplicate (50 L total volume) and the fermentation temperature was maintained at a constant 22 °C to avoid any losses of volatile compounds during the process. 60 mg/L of total sulfur dioxide (potassium metabisulphite, Agrovin, Spain) was added to prevent the growth of undesirable microorganisms. A total of 0.35 g/L of diammonium phosphate was also added as a nutrient to the matrix; 0.20 g/L of Saccharomyces cerevisiae active dry yeast, previously activated at 35 °C for 20 min were also inoculated to start the fermentation process (Enartis Ferm SB, Trecate, Italy). The process was monitored by measuring the sugar content in the substrate. After the fermentation had been started, the sugar content was increased until 14 °Brix degrees was reached (equal to the initial °Brix value of the juice) by adding commercial white refined beet sugar (AB Azucarera Iberia, Madrid, Spain) suitable for human intake, to rise the final alcoholic degree. Then, the prickly pear wine produced was centrifuged at 15,000× g for 10 min and stored at 4 °C.
2.3. Acetic Fermentation
2.3.1. Bacterial Preparation
Ten thermo-ethanol tolerant strains (5 Acetobacter and 5 Gluconobacter; AAB) were previously isolated from Moroccan prickly pear fruit following the procedure described in the previous work [32]. Further, a mixture of strains from an unfiltered Sherry vinegar (Jerez, Spain) was used in order to compare the different acetification profiles obtained from different bacteria inocula. The selected AAB were precultured in a broth medium and incubated at 30 °C for 24 h with continuous and vigorous agitation in order to initiate the acetic acid bacterial cells' rapid proliferation. When the measured optical density (OD 600 nm) of the suspension reached over 1.2, the cells with 10% (v/v) of inoculum were transferred into the prickly pear wine to start the acetic fermentation according to the traditional method.
2.3.2. Surface Culture Acetification
The acetification of the prickly pear wine through surface culture was carried out in 500 mL Erlenmeyer flasks which had been previously sterilized and covered with cotton sheets. The flasks were filled with 250 mL of prickly pear wine and each one of them was then inoculated with 10% (v/v) of the different types of AAB inocula. The experiments were conducted at 30 °C and 37 °C in duplicate and the flasks were not agitated to allow the atmospheric oxygen to diffuse slowly into the fermenting medium. A temperature of 37 °C showed the best results in terms of production of acetic acid by thermotolerant bacteria in a previous work [32] and it was compared with the usual acetification temperature (30 °C). The content in each flask was sampled every three weeks and each sample’s total acidity was determined by titration with NaOH using phenolphthalein indicator. The total acidity content was expressed as g of acetic acid/100 mL of vinegar. When the acidity content stopped increasing, the fermentation process was considered as completed.
2.4. Analysis of Volatile Compounds
2.4.1. Sample Preparation
The samples were analyzed by SBSE/GC-MS according to the method described by Durán Guerrero et al. [19]. The volatile compounds from the vinegar samples, were extracted by means of commercially available polydimethylsiloxane stirs bars, 10 mm length x 0.5 mm film thickness (supplied by Gerstel, Mülheim a/d Ruhr, Germany). For each stir bar sorptive extraction (SBSE) analysis, a volume of 25 mL of the sample was pipetted and placed into a 100-mL Erlenmeyer flask and 5.85 g of NaCl (Scharlau, Barcelona, Spain) was added and dissolved by agitation. Then, 84 µL of 4-methyl-2-pentanol solution (Sigma, Steinheim, Germany) (2.27 g/L in Milli-Q water containing 80 g/L of acetic acid) were also added to the sample. The Erlenmeyer flasks were placed on a magnetic stirrer (Gerstel), and they were stirred at 1250 rpm at 25 °C for 120 min. Then, the stir bars were removed from the vinegar samples and placed for a few seconds in distilled water, in order to remove the NaCl as well as any remains of prickly pear pulp that might have stuck onto them. They were then gently dried using a lint-free tissue. Finally, the dried stir bars were transferred into a glass thermal desorption tube and they were thermally desorpted.
2.4.2. Instrumentation
The thermal desorption system used for the coated stir bars was a commercial TDS-2 thermal desorption unit (Gerstel) connected to a programmed-temperature vaporization (PTV) injector CIS-4 (Gerstel) through a heated transfer line. The PTV was installed onto the chromatographic system. The thermo-desorption unit was equipped with an MPS 2L autosampler (Gerstel) with the capacity to handle 98 coated stir bars. The desorption temperature was configured to go from 40 °C up to 300 °C (held for 10 min) at 60 °C/min under a 75 mL/min helium flow and the desorbed analytes were cryofocused using the PTV system with liquid nitrogen at −140 °C. Finally, the PTV system was configured to go from −140 °C up to 300 °C (held for 5 min) at 10 °C/s and the analytes were analyzed by Gas Chromatography–Mass Spectrometry (GC-MS). An Agilent 6890 GC-5973N MS system (Agilent, Little Falls, DE, USA), equipped with a DB-Wax capillary column (J&W Scientific, Folsom, CA, USA), 60 m × 0.25 mm i.d. with a 0.25 µm coating, which was used on the electron impact mode to perform the capillary GC–MS analysis. A 1.0 mL/min helium flow was used as the carrier gas. The peaks were identified by means of the Wiley library according to their mass spectra analogies (>85% matching) and confirmed by the retention times of the standards, when available, or by the retention data found in the literature. The linear retention index of each one of the compounds was determined by means of a DB-Wax polar column and compared against those reported in the literature [33,34,35]. The semi-quantitative data were obtained by measuring the relative base of the ion peak area in relation to that of 4-methyl-2-pentanol, as the internal standard. All the analyses were performed in duplicate.
2.5. Analysis of Phenolic Compounds
The phenolic compounds in the prickly pear samples were identified and quantified by means of a Waters Acquity UPLC system (Waters Corps. Milford, MA, USA), equipped with a diode array detector (DAD) and following the method proposed by Schwarz et al. [36]. An Acquity UPLC BEH C18 column (100 × 2.1 mm/ID, with 1.7 μm particle size), also from Waters, was used. All the samples (juice, wine and vinegars) were previously filtered through 0.22 μm nylon filters manufactured by Scharlab (Barcelona, Spain).
The phenolic compounds were identified by comparing retention times and ultraviolet-visible (UV-VIS) spectra against those of their corresponding commercial standards (Fluka, Buchs, Switzerland; Sigma, Steinheim, Germany; and East Kodak, Rochester, NY, USA). Each identified compound was quantified by comparison against the calibration curve obtained from their corresponding standard at 280 nm (for gallic acid, hydroxy-tyrosol, epigallocatechin, catechin, tyrosol, vanillic acid, syringic acid, ethyl gallate, m-coumaric acid, hesperidin and naringenin), 320 nm (for protocatechualdehyde, p-coumaric acid, ferulic acid, quercetin and cinnamic acid) and 255 nm (for p-hydroxybenzoic acid) at seven concentration levels, except for hydroxy-tyrosol, which was quantified as tyrosol. All the analyses were conducted in duplicate.
2.6. Analysis of the Antioxidant Activity
The antioxidant activity levels of the prickly pear juice, the wine and the different vinegars were determined by DPPH (1,1-diphenyl-2-picrylhydrazyl) according to the method reported by Carmona-Jiménez et al. [37]. A total of 200 µL of sample or ethanol (blank) were added into vials containing 3.3 mL of a 50 µM solution of DPPH in ethanol prepared daily (0.069 ppm of the initial DPPH). Then, the mixture was allowed to sit at room temperature for 3 h, the absorbance at 515 nm was measured using a Cary 50 Bio spectrophotometer (Varian, Australia). All the measurements were conducted in duplicate. The exact concentration (ppm) of the DPPH solution in the different samples was calculated spectrophotometrically based on a calibration curve that was determined by linear regression:
y = 0.0284[DPPH] − 0.011, R2 = 0.9997
The inhibition percentage of DPPH of each sample at the steady state was determined according to the following equation:
I (%) = [(Abs blank − Abs sample)/Abs blank] × 100
2.7. Statistical Analysis
An analysis of variance (ANOVA) with Tukey’s test was used to initially determine any significant data differences between the groups of samples. This was followed by a principal component analysis (PCA) for an easier and more thorough understanding of any possible relationships between the studied samples regarding their phenolic and volatile compounds contents. Further, a cluster analysis (CA) was carried out to detect any similarities between the samples. The statistical significance was set at p < 0.05 and the results were processed using the software Statistica 12.5 (StatSoft, Inc., Tulsa, OK, USA).
3. Results and Discussion
3.1. Vinegar Production
The juice employed for the production of prickly pear vinegar, was first characterized. The initial sugar content was equivalent to 14.24 °Brix or 7.92 °Baumé, with 6.06 pH, a density of 1.055 g/mL and a total acidity of 0.82 g/100 mL expressed as citric acid. When the alcoholic fermentation was accomplished, the alcohol content was 5.27% (v/v) and the °Brix value was around 1°. At that moment, the sugar content was increased until 14 °Brix degrees was reached (the same as the juice initial °Brix value) in order to obtain a greater final alcohol content. The final alcohol content of prickly pear wine was 8.7% (v/v).
The acetic acid bacteria (AAB) strains that had presented thermo-ethanol tolerance characteristics in a previous study [32] were selected to be used as the starter culture for the acetic fermentation of the prickly pear wine at two different temperatures: 30 °C and 37 °C. The wine at 30 °C was fermented for 2 months, whereas the one at 37 °C was fermented for three months. The prickly pear vinegar produced by the surface culture at 30 °C reached a higher acidity value compared to that reached by the vinegar produced at 37 °C. This was probably due to the fact that at 30 °C all the bacteria from the Acetobacter genus had the capacity to produce acetic acid, which resulted in a mean value of 5.87 g/100 mL. These bacteria produced vinegars with a lower acidity compared to that of the vinegars that had been elaborated using bacteria from the Gluconobacter genus or with the mixture of bacteria obtained from Sherry vinegar (7.46 g/100 mL and 7.56 g/100 mL, respectively). Contrariwise, at 37 °C none of these bacteria strains or combinations of strains produced high concentrations of acetic acid, so that the acetobacter strains, the gluconobacter strains and the mixed strains obtained from Sherry vinegar achieved similar concentrations of just 1.88, 1.90 and 1.89 g/100 mL, respectively. Several reasons could explain this lower productivity, such as the effect of the high temperature on the viability of the acetic acid bacteria even if the two genera displayed thermotolerant characteristics in a previous study [32]. Other reasons could be the greater evaporation of ethanol during the fermentation at the highest temperature or a poor tolerance to a large ethanol concentration in the wine (8.7%) when at a high temperature. These are considered to be stressful conditions for acetic bacteria growth [15]. Saeki et al. demonstrated that bacterial growth at 37 °C seemed to be almost impossible and that ethanol consumption was largely delayed. In fact, the acetic bacteria did not grow at 39 °C in a medium containing over 3% ethanol [38]. Perumpuli et al. indicated that in the static fermentation processes, the lower oxygen availability in the liquid culture could negatively affect the production of acetic acids [39].
3.2. Volatile Compounds
In the present study, a total of 85 individual volatile compounds from different families have been determined and identified in different prickly pear samples (juice, wine and vinegars) by Stir Bar Sorptive Extraction coupled to Gas Chromatography–Mass Spectrometry (SBSE/GC-MS). In order to determine any statistical differences between the prickly pear samples regarding their composition of volatile compounds, the data were submitted to analysis of variance (ANOVA, p < 0.05).
Table 1 indicates the mean relative areas of all the studied compounds in the three studied matrices as well as the results from the ANOVA. ANOVA indicates if the variable under study (matrix) has a significant effect on the concentration of the studied compounds, but this statistical analysis does not indicate neither if there are differences in the concentrations of the compounds for all the levels of the studied variable, nor which level presents the higher or lower value. To obtain that information, a post hoc test such as the Tukey test was employed. This test compares all possible pairs of means and indicates which ones are different compared with each other. These results are also presented in the table by showing different letters in the same row for each analyzed compound.

Table 1.
Retention times (RT), mean relative areas and standard deviations (SD) of volatile compounds identified by SBSE-GC-MS in different prickly pear matrices (juice, wine, vinegar). Results of analysis of variance taking into account the matrix.
Some of the volatile compounds identified in this research had been previously identified in other fruit vinegars such as lemon vinegar [33], orange vinegar [40], tomato vinegar [41], strawberry vinegar or persimmon vinegar [42], among others.
From a general point of view, almost all the volatile compounds showed significant differences according to the matrix (p < 0.05). This was an expected result because during the vinegar production, two different fermentation processes take place (alcoholic and acetic fermentation), and many compounds are produced and modified other than ethanol and acetic acid [15]. Some of the compounds, such as certain alcohols and esters such as 2-methyl-1-butanol, 3-methyl-1-butanol, 2-methyl-1-propanol, isobutyl acetate or hexanoic acid ethyl ester, among others, increased significantly during the alcoholic fermentation and when the acetic fermentation was accomplished, they decreased. These results are in accordance with those reported by previous research works [33,40,41]. On the other hand, other compounds such as nonenal, 2-octanone, acetic acid pentyl ester, E-3-hexenyl acetate, 2 octenal and 2,4-decadienal among others, disappeared during the transformation process from prickly pear juice into prickly pear vinegar. It should also be noted that many compounds are normally degraded during the acetic fermentation process that produces vinegar [15]. It was found that some volatile compounds such as hexanal, 1-pentanol, hexyl acetate or β-citronellol were the majority compounds in prickly pear juice, which would explain them being detected in the prickly pear vinegar, although at a lower content. Their presence in the prickly pear vinegar could also be due to the lesser degradation of compounds that takes place during acetic fermentation in surface culture processes when compared to the submerged culture method [15]. On the other hand, some of the compounds that were not detected in prickly pear juice were formed during the acetic fermentation. Some of them were trans-linalol oxide, dihydromethyl jasmonate, benzenepropanol, butanedioic acid diethyl ester, octanoic acid ethyl ester and benzenepropanoic acid ethyl ester, among others. Other authors who studied the production of strawberry or persimmon vinegar also found an increase in certain volatile compounds resulting from the influence of the microorganisms employed in the fermentation process [42]. Furthermore, the production of certain volatile compounds could be favored by the employment of inoculated yeasts for the alcoholic fermentation, instead of native yeasts [43]. The results obtained in this study on the volatile composition of prickly pear juice were in agreement with those reported by Arena et al. [20]. These researchers found that the major class of volatile compounds in prickly pear fruit were the alcohols represented by trans-2-hexen-1-ol and n-hexanol, even though numerous esters and carbonyl compounds were also present at low concentrations. No data on prickly pear wine or vinegar regarding their volatile composition have been found in the literature.
In order to corroborate the differences that took place during the vinegar production process, the data obtained were submitted to a multivariate statistical study (principal component analysis—PCA). This analysis allowed us to identify eight PCs that could explain 94.61% of the total variability (eigenvalues > 1). Figure 1 represents the distribution of the samples on the plane defined by the first two PCs.
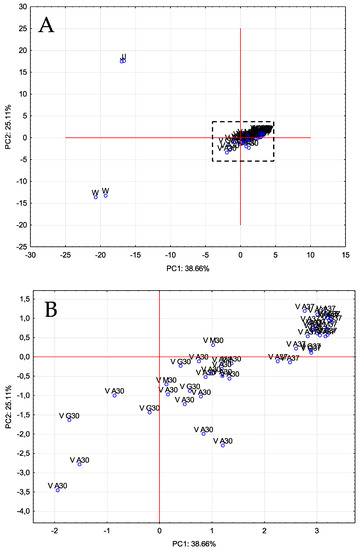
Figure 1.
PCA of volatile compounds. Distribution of all samples onto the plane defined by the first two PCs. (A): original graph; (B): zoomed area. J: prickly pear juice; W: prickly pear wine; V: prickly pear vinegar.
As can be seen, PC1 allowed to distinguish vinegar samples (V) from juice (J) and wine (W), whereas PC2 was able to separate the three prickly pear matrixes. The volatile compounds that contributed more and with a greater influence on PC1 were as follows: methyl salicylate, 1-hexanol, 1-heptanol, 2-octanone, 1-pentanol, trans-2-cis-6-nonadienal and 3-hexen-1-ol (E). Regarding to PC2, these ones were: 3-hexen-1-ol acetate (Z), trans-2-decenol, trans, cis-2,6-nonadien-1-ol, 2-octenoic acid, 2-hexen-1-ol acetate (E), 2-hexen-1-ol (E) and nonenal.
To study the effect from certain parameters, such as fermentation temperature and acetic acid bacteria on the volatile composition of the prickly pear vinegar, the prickly pear wine was inoculated with a different genus of acetic acid bacteria (Acetobacter, Gluconobacter and a mixture of bacteria from Sherry vinegar) and incubated at 30 °C and 37 °C. Table 2 shows the results from the analysis of variance considering temperature and genus as the independent variables and volatile compounds as the dependent ones. As can be seen, most of the volatile compounds were significantly affected by fermentation temperature, whereas no significant differences between the volatile composition of the vinegars produced by the different bacteria inoculum were detected. Hence, the type of acetic acid bacteria inoculated does not seem to be relevant with respect to the volatile composition of the vinegars. Other studies have reported slight differences in the taste of vinegars produced using Gluconobacter genus bacteria when compared to those produced using Acetobacter, since the former ones generate greater amounts of gluconate [44]. Kim et al. observed that the production of certain metabolites in tomato vinegar depended on the strain of acetic acid bacteria used and that the fermentation temperature also had a significant influence on the production of such metabolites [45].
Table 2.
Analysis of variance considering the effect of temperature (30 °C/37 °C) and bacteria inoculum (Acetobacter (A)/Gluconobacter (G)/Mixture of bacteria (M)) on volatile compounds of prickly pear vinegar produced by surface culture.
Table 3 indicates the mean relative areas of the volatile compounds in the vinegars produced at 30 °C and at 37 °C. It can be observed that most of the volatile compounds reached higher concentration values in the vinegar that had been produced at 30 °C compared to those corresponding to the vinegar produced at 37 °C. According to Liu et al., the aroma compounds and their concentrations were influenced by the fermentation temperature, so that as the temperature was increased, the number of volatiles would decrease [46]. Consequently, certain compounds, such as 1,3-dioxolane, 2,4,5-trimethyl-, 1-hexanol, 3-hexen-1-ol (E), 3-hexen-1-ol (Z), cyclopentene or trans-2-cis-6-nonadienal, would even disappear when the acetic fermentation was conducted at 37 °C. These changes in the concentration of certain compounds could be explained by their possible reduction by evaporation when submitted to high temperatures (37 °C), which, in some cases, might lead to their total disappearance [15]. For example, cyclopentene and 1,3-dioxolane have boiling points at atmospheric pressure of 44 °C and 74 °C, respectively; however, the mean relative area detected for some compounds, such as trans-linalooloxide, cis-linalooloxide, 1-hexanol 2-ethyl-, benzaldehyde, 1-nonanol and dihydromethyl jasmonate among others was greater at 37 °C than at 30 °C. This was probably due to changes in the metabolism of the bacteria as the temperature varied. Thus, the production of 2,3-butanediol and butanoic acid during the elaboration of tomato vinegar at different temperatures was studied by Kim et al. [45] and 2,3-butanediol was detected at greater concentrations in those vinegars produced at a higher temperature (34 °C), whereas butanoic acid was only found in the vinegars produced at 30 °C. In the present study, similar behavior by both of these compounds was observed. Although the increment of the fermentation temperature led, as expected, to a general reduction in the volatile content in the vinegars, partial fermentations were accomplished at 37 °C even if the optimal growth temperature for acetic acid bacteria is between 25 and 30 °C [15].
Table 3.
Mean relative areas and standard deviations of volatile identified by SBSE-GC-MS in Prickly pear Vinegar produced by surface culture method at 30 °C and 37 °C.
The resulting data were submitted to a multivariate statistical study (principal component analysis, PCA), which allowed us to identify 11 PCs that explained 92.7% of the total variability (eigenvalues > 1). Figure 2 shows the distribution of all the vinegar samples on the plane defined by PC1 and PC2. As it can be seen, PC1 separated the vinegars produced at 37 °C from some of the vinegars fermented at 30 °C, which were mainly those vinegars that had been fermented using gluconobacter. PC2, on the other hand, was able to separate all the vinegars fermented at 37 °C from those fermented at 30 °C. PC1 was mainly related to the presence of acids, such as hexanoic acid, nonanoic acid, isovaleric acid, isobutyric acid and acetic acid, while PC2 was related to certain alcohols, such as 1-octanol, linalool, 3-methyl-1-butanol, 3-hexen-1-ol (Z) or 1-pentanol.
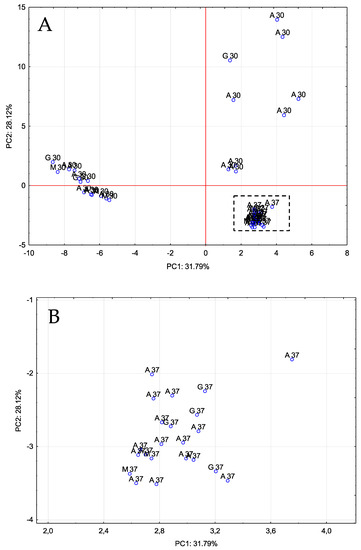
Figure 2.
PCA on volatile compounds. Distribution of all vinegar samples onto the plane defined by the first two PCs. (A): original graph; (B): zoomed area. A 30/A 37: Acetobacter at 30 °C and 37 °C, G 30/G 37: Gluconobacter at 30 °C and 37 °C, M 30/M 37: Mixture of bacteria at 30 °C and 37 °C.
To corroborate these results, the set of data was also submitted to a hierarchical agglomerative cluster analysis (Figure 3). The squared Euclidean distance as metric and the Ward method as the amalgamation rule were employed to set up the clusters. As illustrated, three groups were obtained: vinegars produced by acetobacter at 30 °C and 37 °C (A 30 and A 37), vinegars produced by the three types of bacteria inoculum at 37 °C (A/G/M 37) and vinegars produced by the three types of bacteria inoculum at 30 °C (A/G/M 30). These groupings revealed that the influence that the acetification temperature exerted on the vinegars’ volatile profiles was quite high and even more significant than that corresponding to the particular acetic acid bacteria inocula employed.
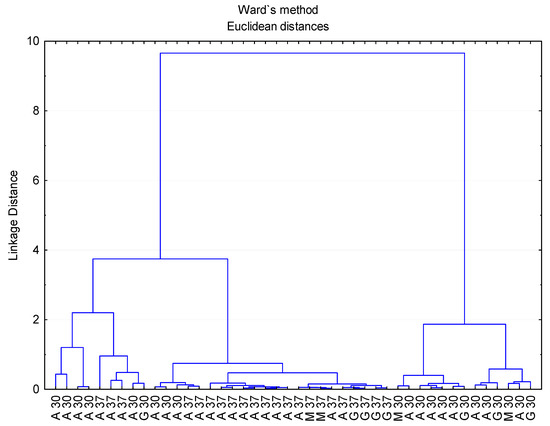
Figure 3.
Cluster analysis taking into consideration the composition of volatile compounds of vinegar samples. A 30/A 37: Acetobacter at 30 °C and 37 °C, G 30/G 37: Gluconobacter at 30 °C and 37 °C, M 30/M 37: Mixture of bacteria at 30 °C and 37 °C.
3.3. Phenolic Compounds and Antioxidant Activity
3.3.1. Phenolic Composition
In the present study, a total of 16 polyphenolic compounds in prickly pear samples (juice, wine and vinegar) have been studied. To determine the statistical differences between prickly pear samples regarding their polyphenolic compounds content, the data were submitted to analysis of variance (ANOVA, p < 0.05). Table 4 displays the mean concentrations of the different polyphenolic compounds depending on the matrix.
Table 4.
Mean concentrations (ppm) and standard deviations of phenolic compounds identified by UPLC-DAD in different prickly pear matrices (juice, wine, vinegar). Results of analysis of variance taking into account the matrix.
Some of the compounds among those identified in prickly pear samples were hydroxycinnamic and benzoic acids, such as ferulic acid, gallic acid, caffeic acid and cinnamic acid as well as and flavanones, such as hesperidin and naringin. These compounds had been previously identified as the major compounds in orange samples (juice, wine and vinegar) [40]. Seven compounds presented similar concentrations in the three studied matrices, such as gallic acid, hydroxy-tyrosol, tyrosol or ferulic acid. The rest of the phenolic compounds studied showed significantly different contents when the matrix was transformed from prickly pear juice into prickly pear vinegar. A few compounds (epigallocatechin, syringic acid, protocatechualdehyde and cinnamic acid) increased their concentrations gradually during the elaboration process of the vinegar. On the other hand, just two compounds (ethyl gallate and p-hydroxybenzoic acid) decreased their concentration as the juice was transformed into vinegar. Other authors have also reported decreases of phenolic compounds over the production of pomegranate vinegars [47,48]. In our case, hesperidin’s concentration decreased significantly during the alcoholic fermentation and later on increased when the acetic fermentation was accomplished, whereas m-coumaric acid disappeared as the transformation process from prickly pear juice into prickly pear vinegar took place. Caffeic acid and vanillic acid were not detected in prickly pear juice or wine, but they were present after the acetic fermentation process, and epigallocatechin and cinnamic acid were not detected in the juice stage, but were identified in the following stages. A possible hypothesis could be that these compounds were produced and/or released during the fermentation processes. In fact, it has been previously reported that by the selection of the bacteria strain employed in the fermentation process, some bioactive components could be promoted to the final product [15]. Tyrosol was the main compound found in all the samples and it was actually detected at a high concentration in juice, which would explain its presence in the vinegar. This is not in agreement with the results from certain previous studies on other fruit vinegars, where an increase in tyrosol content after the alcoholic fermentation was reported [33,41]. With regard to gallic acid, a previous study reported that it was the main phenolic compound at variable concentrations in a number of varieties of prickly pear juice, except for the juice obtained from Tapona fruit, where no gallic was detected. Syringic acid was the second most abundant phenolic compound in the juices, although it was not identified in the juice from two of the studied varieties [49]. No other investigations concerning the phenolic composition of prickly pear wine or vinegar have been found in the literature.
In order to gain further insight into the evolution of the process, the polyphenolic data obtained were also submitted to multivariate statistical study (principal component analysis, PCA and cluster analysis, CA). Thus, four PCs were detected that were able to explain 78.92% of the total variability according to the Kaiser criterion (eigenvalues > 1). By attending to just the first two components, 61.99% of the variability could be explained. Figure 4 shows the plot, including the samples on the plane defined by PC1 and PC2.
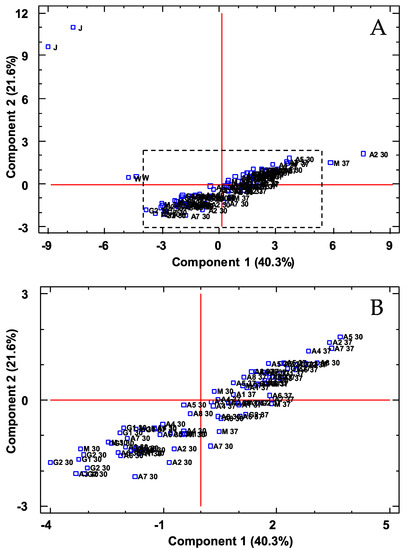
Figure 4.
PCA on phenolic compounds. Distribution of all the samples onto the plane defined by the first two PCs. (A): original graph; (B): zoomed area. J: prickly pear juice; W: prickly pear wine; A/G/M: prickly pear vinegar.
As can be seen, PC1 was able to separate the three prickly pear matrices, whereas PC2 separated the juice samples from the wine and vinegar ones. The polyphenolic compounds that contributed more and with a greater influence on PC1 were as follows: epigallocatechin, tyrosol, syringic acid, protocatechualdehyde and caffeic acid, whereas PC2 was affected mainly by ethyl gallate, m-coumaric acid, hesperidin and p-hydroxybenzoic acid. Regarding the CA, the squared Euclidean distance as metric and the Ward method as the amalgamation rule were employed to set up the clusters. As can be seen (Figure 5), three groups were obtained as follows: juice and wine; vinegars produced at 30 °C and vinegars produced at 37 °C.
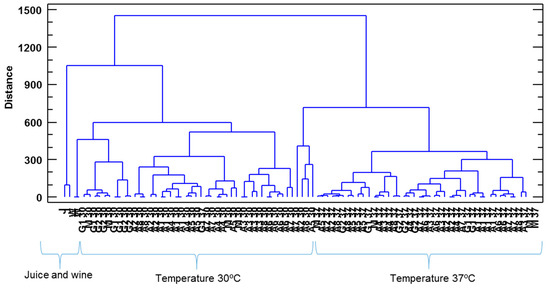
Figure 5.
Cluster analysis taking into consideration the composition of polyphenolic compounds of the three prickly pear matrixes. J: prickly pear juice; W: prickly pear wine; A/G/M: prickly pear vinegar.
Table 5 shows the results from the Analysis of Variance on the polyphenolic composition of prickly pear vinegars according to temperature and bacteria inoculum differences. As can be seen, the concentration of polyphenolic compounds was significantly affected by both fermentation temperature and acetic acid bacteria inoculum. Except for gallic and vanillic acid, the concentration levels of all the polyphenolic compounds identified in prickly pear vinegars were affected by fermentation temperature changes, so that temperature was confirmed as the most important variable. Similar results, regarding other analytes, had been obtained by Kim et al. when elaborating tomato vinegar [45].
Table 5.
Analysis of variance considering the effect of temperature (30 °C/37 °C) and bacteria inoculum (Acetobacter (A)/Gluconobacter (G)/Mixture of bacteria (M)) on phenolic compounds of prickly pear vinegar produced by surface culture.
Table 6 includes the mean concentrations of the polyphenolic composition of the vinegars produced at 30 °C and at 37 °C and using the three types of bacteria inocula. It can be seen that contrarily to the behavior exhibited by their volatile composition, the vinegar that had been produced at 37 °C presented significantly higher concentrations of most phenolic compounds, except for gallic acid, hydroxy-tyrosol, vanillic acid, quercetin, cinnamic acid and p-hydroxybenzoic acid. It could, therefore, be said that, in terms of polyphenolic composition and considering the beneficial antioxidant effect from polyphenols reported by other studies on fruit vinegars, the vinegars produced at higher temperatures might be healthier than those produced at 30 °C [15]. Regarding the type of bacteria inoculum employed, no clear trend has been revealed in terms of a higher or lower concentration of polyphenolic compounds associated with the particular bacteria inoculum used to produce the vinegars (Table 6).
Table 6.
Mean concentrations (ppm) and standard deviations of phenolic compounds identified by UPLC-DAD in prickly pear vinegar produced by surface culture method at 30 °C and 37 °C, and for the three types of bacteria.
These data on vinegar polyphenol content were submitted to a multivariate statistical study (PCA) and three PCs were identified that were able to explain 73.28% of the total variability (eigenvalues > 1). Figure 6 illustrates which of the vinegar samples were located on the plane defined by PC1 and PC2. Thus, it could be observed that these two components were capable of separating all the vinegars produced at 30 °C from those fermented at 37 °C, with 37 °C-elaborated vinegars located at the positive values of PC1, whereas the 30 °C-elaborated vinegars were located at the negative value area of the same PC. The compounds that contributed the most to the first principal component (PC1) were epigallocatechin, tyrosol and protocatechualdehyde, while for PC2, gallic acid, hydroxy-tyrosol, vanillic acid and p-hydroxybenzoic acid.
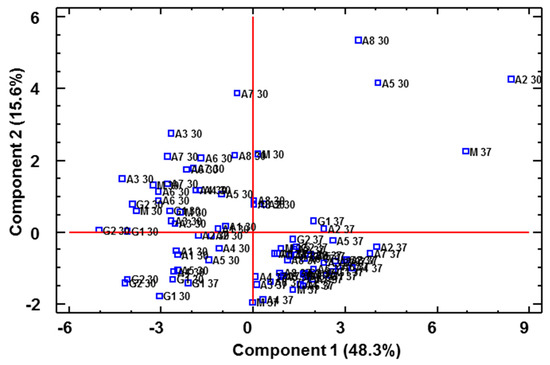
Figure 6.
PCA on phenolic compounds. Distribution of all the vinegar samples onto the plane defined by the first two PCs. A 30/A 37: Acetobacter at 30 °C and 37 °C, G 30/G 37: Gluconobacter at 30 °C and 37 °C, M 30/M 37: Mixture of bacteria at 30 °C and 37 °C.
3.3.2. Antioxidant Activity
The antioxidant activity of prickly pear samples (juice, wine and vinegars) was determined by means of DPPH radical scavenging (expressed as EC20). This is a fast, simple, economical and widely used method to measure the overall antioxidant capacity and the free radical scavenging activity of fruits and vegetable juices. This method is carried out in a mixture methanol/water, which facilitates the extraction of antioxidant compounds from the sample. Moreover, DPPH is allowed to react with the whole sample and sufficient time given in the method allows DPPH to react slowly even with weak antioxidants; however, this method is limited because DPPH radical interacts with other radicals and some problems of linearity can be found with different ratios of antioxidant/DPPH. In addition, DPPH is sensitive to some Lewis bases and solvent types, as well as oxygen, and it can only be soluble in organic solvents. Another drawback is that the absorbance of DPPH in methanol and acetone decreases under light [50]. In spite of these drawbacks, this methodology is nowadays commonly employed thanks to the above-mentioned advantages.
Depending on the matrix, the results revealed that there was a clear difference with respect to the antioxidant activity corresponding to juice, wine or vinegars (0.618 ± 0.000 mg/mL, 0.456 ± 0.035 mg/mL, 1.459 ± 0.055 mg/mL, respectively). Although there is no clear evidence that in vitro antioxidant activity values have relation to a biological significance after the consumption of any food, it could provide an initial idea about their possible healthy character. The DPPH antioxidant scavenging capacity of prickly pear juice from Moroccan O. ficus indica in our study was similar to that registered for Tunisian O. ficus indica pulp [51]. As can be seen, the highest antiradical activity was exhibited by the prickly pear wine with the lowest EC20 values, which might be explained by the solubility of the polymerized polyphenols in ethanol, that resulted in antioxidant compounds concentration increments as the content of ethanol increased over the alcoholic fermentation. The results obtained in our study are in contradiction with those obtained by Kongkiattikajorn [52], who reported that the total antioxidant activity of Roselle vinegar was significantly higher than that of Roselle juice and wine because of a greater number of anthocyanins in the vinegar in relation to that found in the wine and juice. A previous study on the evolution of the antioxidant capacity of fermenting persimmon juice determined by DPPH assays, showed that the antioxidant capacity went up during the alcoholic fermentation and acetification, which is in line with the presence of a greater amount of flavan-3-ols and condensed tannins [53].
Regarding the antioxidant activity of vinegars produced by inoculating different bacteria genus, the data revealed that the vinegars produced by the bacteria mixture from Sherry vinegar displayed a greater activity (0.833 ± 0.0440 mg/mL) than those produced by means of either Gluconobacter (1.018 ± 0.030 mg/mL) or Acetobacter genus (1.636 ± 0.061 mg/mL). This may be explained by a combination of a greater amount of certain bioactive compounds such as hydroxy-tyrosol or p-hydroxybenzoic acid in the vinegar produced by the mixture of bacteria found in Sherry vinegar lees, compared to those obtained by Gluconobacter and Acetobacter, in decreasing order (Table 6). These two phenolic compounds have been previously related to the high antioxidant activity of other vegetal matrices such as Jasminum species [54]. In addition, hydroxy-tyrosol is also considered the main responsible for the bioactivity of olives and olive pits [55].
4. Conclusions
Prickly pear vinegar has been produced by the surface culture at different temperatures and with different AAB inocula. The yields from fermentations at 30 °C ranged between 67.47% and 86.89%, whereas the yields at 37 °C did not reach over 21.83% in any case. Eighty-five separate volatile compounds from different families and sixteen polyphenolic compounds have been identified in the vinegars. By observing the effect of the acetification temperature on volatile compounds, it was concluded that at the highest temperature tested (37 °C), the concentration of these compounds decreased; however, the highest content of polyphenolic compounds was detected when the vinegars were produced at 37 °C. Further, a greater antioxidant activity was exhibited by prickly pear wine than by juice or vinegars. The vinegar produced by a mixture of AAB from Sherry vinegar displayed the highest antiradical activity compared to those corresponding to the vinegars elaborated using other AAB inocula. It can be concluded that changes in the temperature levels during the fermentation of prickly pear to produce vinegar can have a significant impact on the polyphenolic and volatile composition of the final vinegars, and although their volatile content decreases when fermented at higher temperature, partial fermentations could be carried out at 37 °C as long as thermotolerant bacteria are employed, so that the final vinegar would be richer in polyphenols.
Author Contributions
Conceptualization, E.D.-G. and R.C.; methodology, E.D.-G.; software, R.C.; validation, Y.C.-J.; formal analysis, I.E.-s. and Y.C.-J.; investigation, I.E.-s.; resources, R.C.; data curation, I.E.-s.; writing—original draft preparation, I.E.-s.; writing—review and editing, E.D.-G.; visualization, R.Z.; supervision, E.D.-G.; project administration, R.Z.; funding acquisition, R.C. All authors have read and agreed to the published version of the manuscript.
Funding
This research received no external funding.
Data Availability Statement
Data is contained within the article.
Conflicts of Interest
The authors declare no conflict of interest.
References
- Sáenz, C.; Berger, H.; Rodríguez-Félix, A.; Galletti, L.; García, J.C.; Sepúlveda, E.; Teresa, M.; Víctor, V.; De Cortázar, G.; Cuevas García, R.; et al. Agro-Industrial Utilization of Cactus Pear; FAO: Rome, Italy, 2013; ISBN 978-92-5-107987-4 (PDF). [Google Scholar]
- Kumar, K.; Singh, D.; Singh, R.S. Cactus Pear: Cultivation and Uses; M/s Royal Offset Printers: New Delhi, India, 2018. [Google Scholar]
- Coria Cayupán, Y.S.; Ochoa, M.J.; Nazareno, M.A. Health-promoting substances and antioxidant properties of Opuntia sp. fruits. Changes in bioactive-compound contents during ripening process. Food Chem. 2011, 126, 514–519. [Google Scholar] [CrossRef]
- Kuti, J.O. Growth and compositional changes during the development of prickly pear fruit. J. Hortic. Sci. 1992, 67, 861–868. [Google Scholar] [CrossRef]
- Ho, C.W.; Lazim, A.M.; Fazry, S.; Zaki, U.K.H.H.; Lim, S.J. Varieties, production, composition and health benefits of vinegars: A review. Food Chem. 2017, 221, 1621–1630. [Google Scholar] [CrossRef]
- Prieto, C.; Silva, P.; Loyola, E. Balsamic Type Vinegar from Colored Ecotypes of Cactus Pear (Opuntia ficus-indica). Acta Hortic. 2009, 811, 123–126. [Google Scholar] [CrossRef]
- Cejudo-Bastante, C.; Durán-Guerrero, E.; García-Barroso, C.; Castro-Mejías, R. Comparative study of submerged and surface culture acetification process for orange vinegar. J. Sci. Food Agric. 2018, 98, 1052–1060. [Google Scholar] [CrossRef] [PubMed]
- Ünal Turhan, E.; Canbaş, A. Chemical and Sensory Properties of Vinegar from Dimrit Grape by Submerged and Surface Method. Gida J. Food 2016, 41, 1–7. [Google Scholar] [CrossRef]
- Callejón, R.M.; Tesfaye, W.; Torija, M.J.; Mas, A.; Troncoso, A.M.; Morales, M.L. Volatile compounds in red wine vinegars obtained by submerged and surface acetification in different woods. Food Chem. 2009, 113, 1252–1259. [Google Scholar] [CrossRef]
- Mas, A.; Torija, M.J.; García-Parrilla, M.C.; Troncoso, A.M. Acetic acid bacteria and the production and quality of wine vinegar. Sci. World J. 2014, 2014, 394671. [Google Scholar] [CrossRef] [PubMed]
- Morales, M.L.; González, G.A.; Casas, J.A.; Troncoso, A.M. Multivariate analysis of commercial and laboratory produced Sherry wine vinegars: Influence of acetification and aging. Eur. Food Res. Technol. 2001, 212, 676–682. [Google Scholar] [CrossRef]
- Tesfaye, W.; Morales, M.L.; García-Parrilla, M.C.; Troncoso, A.M. Wine vinegar: Technology, authenticity and quality evaluation. Trends Food Sci. Technol. 2002, 13, 12–21. [Google Scholar] [CrossRef]
- Lu, S.; Cao, Y.; Yang, Y.; Jin, Z.; Luo, X. Effect of fermentation modes on nutritional and volatile compounds of Huyou vinegar. J. Food Sci. Technol. 2018, 55, 2631–2640. [Google Scholar] [CrossRef]
- Vegas, C.; Mateo, E.; González, Á.; Jara, C.; Guillamón, J.M.; Poblet, M.; Torija, M.J.; Mas, A. Population dynamics of acetic acid bacteria during traditional wine vinegar production. Int. J. Food Microbiol. 2010, 138, 130–136. [Google Scholar] [CrossRef]
- Luzón-Quintana, L.M.; Castro, R.; Durán-Guerrero, E. Biotechnological processes in fruit vinegar production. Foods 2021, 10, 945. [Google Scholar] [CrossRef] [PubMed]
- Hidalgo, C.; Mateo, E.; Mas, A.; Torija, M.J. Identification of yeast and acetic acid bacteria isolated from the fermentation and acetification of persimmon (Diospyros kaki). Food Microbiol. 2012, 30, 98–104. [Google Scholar] [CrossRef] [PubMed]
- Hidalgo, C.; Torija, M.J.; Mas, A.; Mateo, E. Effect of inoculation on strawberry fermentation and acetification processes using native strains of yeast and acetic acid bacteria. Food Microbiol. 2013, 34, 88–94. [Google Scholar] [CrossRef]
- Ozturk, I.; Caliskan, O.; Tornuk, F.; Ozcan, N.; Yalcin, H.; Baslar, M.; Sagdic, O. Antioxidant, antimicrobial, mineral, volatile, physicochemical and microbiological characteristics of traditional home-made Turkish vinegars. LWT Food Sci. Technol. 2015, 63, 144–151. [Google Scholar] [CrossRef]
- Guerrero, E.D.; Marín, R.N.; Mejías, R.C.; Barroso, C.G. Optimisation of stir bar sorptive extraction applied to the determination of volatile compounds in vinegars. J. Chromatogr. A 2006, 1104, 47–53. [Google Scholar] [CrossRef]
- Arena, E.; Campisi, S.; Fallico, B.; Lanza, M.C.; Maccarone, E. Aroma value of volatile compounds of prickly pear (Opuntia ficus indica (L.) mill. Cactaceae). Ital. J. Food Sci. 2001, 13, 311–319. [Google Scholar]
- Farag, M.A.; Maamoun, A.A.; Ehrlich, A.; Fahmy, S.; Wesjohann, L.A. Assessment of sensory metabolites distribution in 3 cactus Opuntia ficus-indica fruit cultivars using UV fingerprinting and GC/MS profiling techniques. LWT Food Sci. Technol. 2017, 80, 145–154. [Google Scholar] [CrossRef]
- Andlauer, W.; Stumpf, C.; Fürst, P. Influence of the Acetification Process on Phenolic Compounds. J. Agric. Food Chem 2000, 48, 3533–3536. [Google Scholar] [CrossRef]
- Butera, D.; Tesoriere, L.; Di Gaudio, F.; Bongiorno, A.; Allegra, M.; Pintaudi, A.M.; Rohen, K.; Livrea, M.A. Antioxidant Activities of Sicilian Prickly Pear (Opuntia ficus indica) Fruit Extracts and Reducing Properties of Its Betalains: Betanin and Indicaxanthin. J. Agric. Food Chem. 2002, 50, 6895–6901. [Google Scholar] [CrossRef] [PubMed] [Green Version]
- Kuti, J.O. Antioxidant compounds from four Opuntia cactus pear fruit varieties. Food Chem. 2004, 85, 527–533. [Google Scholar] [CrossRef]
- Fernández-López, J.A.; Almela, L.; Obón, J.M.; Castellar, R. Determination of Antioxidant Constituents in Cactus Pear Fruits. Plant. Foods Hum. Nutr. 2010, 65, 253–259. [Google Scholar] [CrossRef] [PubMed]
- Mata, A.; Ferreira, J.P.; Semedo, C.; Serra, T.; Duarte, C.M.M.; Bronze, M.R. Contribution to the characterization of Opuntia spp. juices by LC-DAD-ESI-MS/MS. Food Chem. 2016, 210, 558–565. [Google Scholar] [CrossRef] [PubMed]
- Khatabi, O.; Hanine, H.; Elothmani, D.; Hasib, A. Extraction and determination of polyphenols and betalain pigments in the Moroccan Prickly pear fruits (Opuntia ficus indica). Arab. J. Chem. 2011, 9, S278–S281. [Google Scholar] [CrossRef] [Green Version]
- Galati, E.M.; Mondello, M.R.; Giuffrida, D.; Dugo, G.; Miceli, N.; Pergolizzi, S.; Taviano, M.F. Chemical characterization and biological effects of sicilian Opuntia ficus indica (L.) Mill. fruit juice: Antioxidant and antiulcerogenic activity. J. Agric. Food Chem. 2003, 51, 4903–4908. [Google Scholar] [CrossRef]
- Mena, P.; Tassotti, M.; Andreu, L.; Nuncio-Jáuregui, N.; Legua, P.; Del Rio, D.; Hernández, F. Phytochemical characterization of different prickly pear (Opuntia ficus-indica (L.) Mill.) cultivars and botanical parts: UHPLC-ESI-MSn metabolomics profiles and their chemometric analysis. Food Res. Int. 2018, 108, 301–308. [Google Scholar] [CrossRef] [PubMed]
- Abdel-Hameed, E.-S.S.; Nagaty, M.A.; Salman, M.S.; Bazaid, S.A. Phytochemicals, nutritionals and antioxidant properties of two prickly pear cactus cultivars (Opuntia ficus indica Mill.) growing in Taif, KSA. Food Chem. 2014, 160, 31–38. [Google Scholar] [CrossRef]
- Slatnar, A.; Jakopic, J.; Stampar, F.; Veberic, R.; Jamnik, P. The Effect of Bioactive Compounds on In Vitro and In Vivo Antioxidant Activity of Different Berry Juices. PLoS ONE 2012, 7, e47880. [Google Scholar] [CrossRef] [Green Version]
- Es-sbata, I.; Lakhlifi, T.; Yatim, M.; El-abid, H.; Belhaj, A.; Hafidi, M.; Zouhair, R. Screening and molecular characterization of new thermo- and ethanol-tolerant Acetobacter malorum strains isolated from two biomes Moroccan cactus fruits. Biotechnol. Appl. Biochem. 2020, 68, 476–485. [Google Scholar] [CrossRef]
- Leonés, A.; Durán-Guerrero, E.; Carbú, M.; Cantoral, J.M.; Barroso, C.G.; Castro, R. Development of vinegar obtained from lemon juice: Optimization and chemical characterization of the process. LWT Food Sci. Technol. 2019, 100, 314–321. [Google Scholar] [CrossRef]
- Chanivet, M.; Durán-Guerrero, E.; Rodríguez-Dodero, M.C.; Barroso, C.G.; Castro, R. Application of accelerating energies to the maceration of sherry vinegar with citrus fruits. J. Sci. Food Agric. 2020, 101, 2235–2246. [Google Scholar] [CrossRef]
- Bruna-Maynou, F.J.; Castro, R.; Rodríguez-Dodero, M.C.; Barroso, C.G.; Durán-Guerrero, E. Flavored Sherry vinegar with citric notes: Characterization and effect of ultrasound in the maceration of orange peels. Food Res. Int. 2020, 133, 11. [Google Scholar] [CrossRef]
- Schwarz, M.; Rodríguez, M.C.; Guillén, D.A.; Barroso, C.G. Development and validation of UPLC for the determination of phenolic compounds and furanic derivatives in Brandy de Jerez. J. Sep. Sci. 2009, 32, 1782–1790. [Google Scholar] [CrossRef] [PubMed]
- Carmona-Jiménez, Y.; García-Moreno, M.V.; Igartuburu, J.M.; Barroso, C.G. Simplification of the DPPH assay for estimating the antioxidant activity of wine and wine by-products. Food Chem. 2014, 165, 198–204. [Google Scholar] [CrossRef] [PubMed]
- Saeki, A.; Theeragool, G.; Matsushika, A.; Toyama, H.; Lotong, N.; Adachi, O. Development of Thermotolerant Acetic Acid Bacteria Useful for Vinger Fermentation at Higher Temperature. Biosci. Biotechnol. Biochem. 1997, 61, 138–145. [Google Scholar] [CrossRef]
- Perumpuli, P.A.B.N.; Watanabe, T.; Toyama, H. Identification and characterization of thermotolerant acetic acid bacteria strains isolated from coconut water vinegar in Sri Lanka. Biosci. Biotechnol. Biochem. 2014, 78, 533–541. [Google Scholar] [CrossRef] [PubMed] [Green Version]
- Cejudo-Bastante, C.; Castro-Mejías, R.; Natera-Marín, R.; García-Barroso, C.; Durán-Guerrero, E. Chemical and sensory characteristics of orange based vinegar. J. Food Sci. Technol. 2016, 53, 3147–3156. [Google Scholar] [CrossRef] [Green Version]
- Cejudo-Bastante, C.; Durán-Guerrero, E.; García-Barroso, C.; Castro-Mejías, R. Volatile Compounds, Polyphenols and Sensory Quality in the Production of Tomato Vinegar. J. Food Nutr. Res. 2017, 5, 391–398. [Google Scholar] [CrossRef]
- Ubeda, C.; Callejón, R.M.; Hidalgo, C.; Torija, M.J.; Mas, A.; Troncoso, A.M.; Morales, M.L. Determination of major volatile compounds during the production of fruit vinegars by static headspace gas chromatography-mass spectrometry method. Food Res. Int. 2011, 44, 259–268. [Google Scholar] [CrossRef]
- Duarte, W.F.; Dias, D.R.; De Melo Pereira, G.V.; Gervásio, I.M.; Schwan, R.F. Indigenous and inoculated yeast fermentation of gabiroba (Campomanesia pubescens) pulp for fruit wine production. J. Ind. Microbiol. Biotechnol. 2009, 36, 557–569. [Google Scholar] [CrossRef]
- Saeki, A. Application of gluconobacter oxydans subsp. sphaericus IFO 12467 to vinegar production. J. Ferment. Bioeng. 1993, 75, 232–234. [Google Scholar] [CrossRef]
- Kim, E.J.; Cho, K.M.; Kwon, S.J.; Seo, S.H.; Park, S.E.; Son, H.S. Factors affecting vinegar metabolites during two-stage fermentation through metabolomics study. LWT Food Sci. Technol. 2021, 135, 110081. [Google Scholar] [CrossRef]
- Liu, M.; Yang, K.; Qi, Y.; Zhang, J.; Fan, M.; Wei, X. Fermentation temperature and the phenolic and aroma profile of persimmon wine. J. Inst. Brew. 2018, 124, 269–275. [Google Scholar] [CrossRef] [Green Version]
- Kharchoufi, S.; Gomez, J.; Lasanta, C.; Castro, R.; Sainz, F.; Hamdi, M. Benchmarking laboratory-scale pomegranate vinegar against commercial wine vinegars: Antioxidant activity and chemical composition. J. Sci. Food Agric. 2018, 98, 4749–4758. [Google Scholar] [CrossRef]
- Ordoudi, S.A.; Mantzouridou, F.; Daftsiou, E.; Malo, C.; Hatzidimitriou, E.; Nenadis, N.; Tsimidou, M.Z. Pomegranate juice functional constituents after alcoholic and acetic acid fermentation. J. Funct. Foods 2014, 8, 161–168. [Google Scholar] [CrossRef]
- Zenteno-Ramírez, G.; Juárez-Flores, B.I.; Aguirre-Rivera, J.R.; Monreal-Montes, M.; García, J.M.; Serratosa, M.P.; Santos, M.Á.V.; Pérez, M.D.O.; Rendón-Huerta, J.A. Juices of prickly pear fruits (Opuntia spp.) as functional foods. Ital. J. Food Sci. 2018, 30, 614–627. [Google Scholar]
- Kedare, S.B.; Singh, R.P. Genesis and development of DPPH method of antioxidant assay. J. Food Sci. Technol. 2011, 48, 412–422. [Google Scholar] [CrossRef] [PubMed] [Green Version]
- Yeddes, N.; Chérif, J.K.; Guyot, S.; Sotin, H.; Ayadi, M.T. Comparative study of antioxidant power, polyphenols, flavonoids and betacyanins of the peel and pulp of three Tunisian Opuntia forms. Antioxidants 2013, 2, 37–51. [Google Scholar] [CrossRef] [Green Version]
- Kongkiattikajorn, J. Antioxidant Properties of Roselle Vinegar Production by Mixed Culture of Acetobacter aceti and Acetobacter cerevisiae. Kasetsart J. 2014, 48, 980–988. [Google Scholar]
- Zou, B.; Wu, J.; Yu, Y.; Xiao, G.; Xu, Y. Evolution of the antioxidant capacity and phenolic contents of persimmon during fermentation. Food Sci. Biotechnol. 2017, 26, 563–571. [Google Scholar] [CrossRef] [PubMed]
- El-Hawary, S.S.; EL-Hefnawy, H.M.; Osman, S.M.; EL-Raey, M.A.; Mokhtar Ali, F.A. Phenolic profiling of different Jasminum species cultivated in Egypt and their antioxidant activity. Nat. Prod. Res. 2021, 35, 4663–4668. [Google Scholar] [CrossRef] [PubMed]
- Reis, R.; Sipahi, H.; Zeybekoglu, G.; Celik, N.; Kirmizibekmez, H.; Kaklikkaya, N.; Aydin, A. Hydroxytyrosol: The Factor Responsible for Bioactivity of Traditionally used Olive Pits. Euroasian J. Hepatogastroenterol. 2018, 8, 126–132. [Google Scholar] [CrossRef] [PubMed]
Publisher’s Note: MDPI stays neutral with regard to jurisdictional claims in published maps and institutional affiliations. |
© 2022 by the authors. Licensee MDPI, Basel, Switzerland. This article is an open access article distributed under the terms and conditions of the Creative Commons Attribution (CC BY) license (https://creativecommons.org/licenses/by/4.0/).