
“Unhealthy = Tasty”: How Does It Affect Consumers’ (Un)Healthy Food Expectations?

 , , and
Abstract
1. Introduction
2. Materials and Methods
2.1. Study Design
2.2. Participants
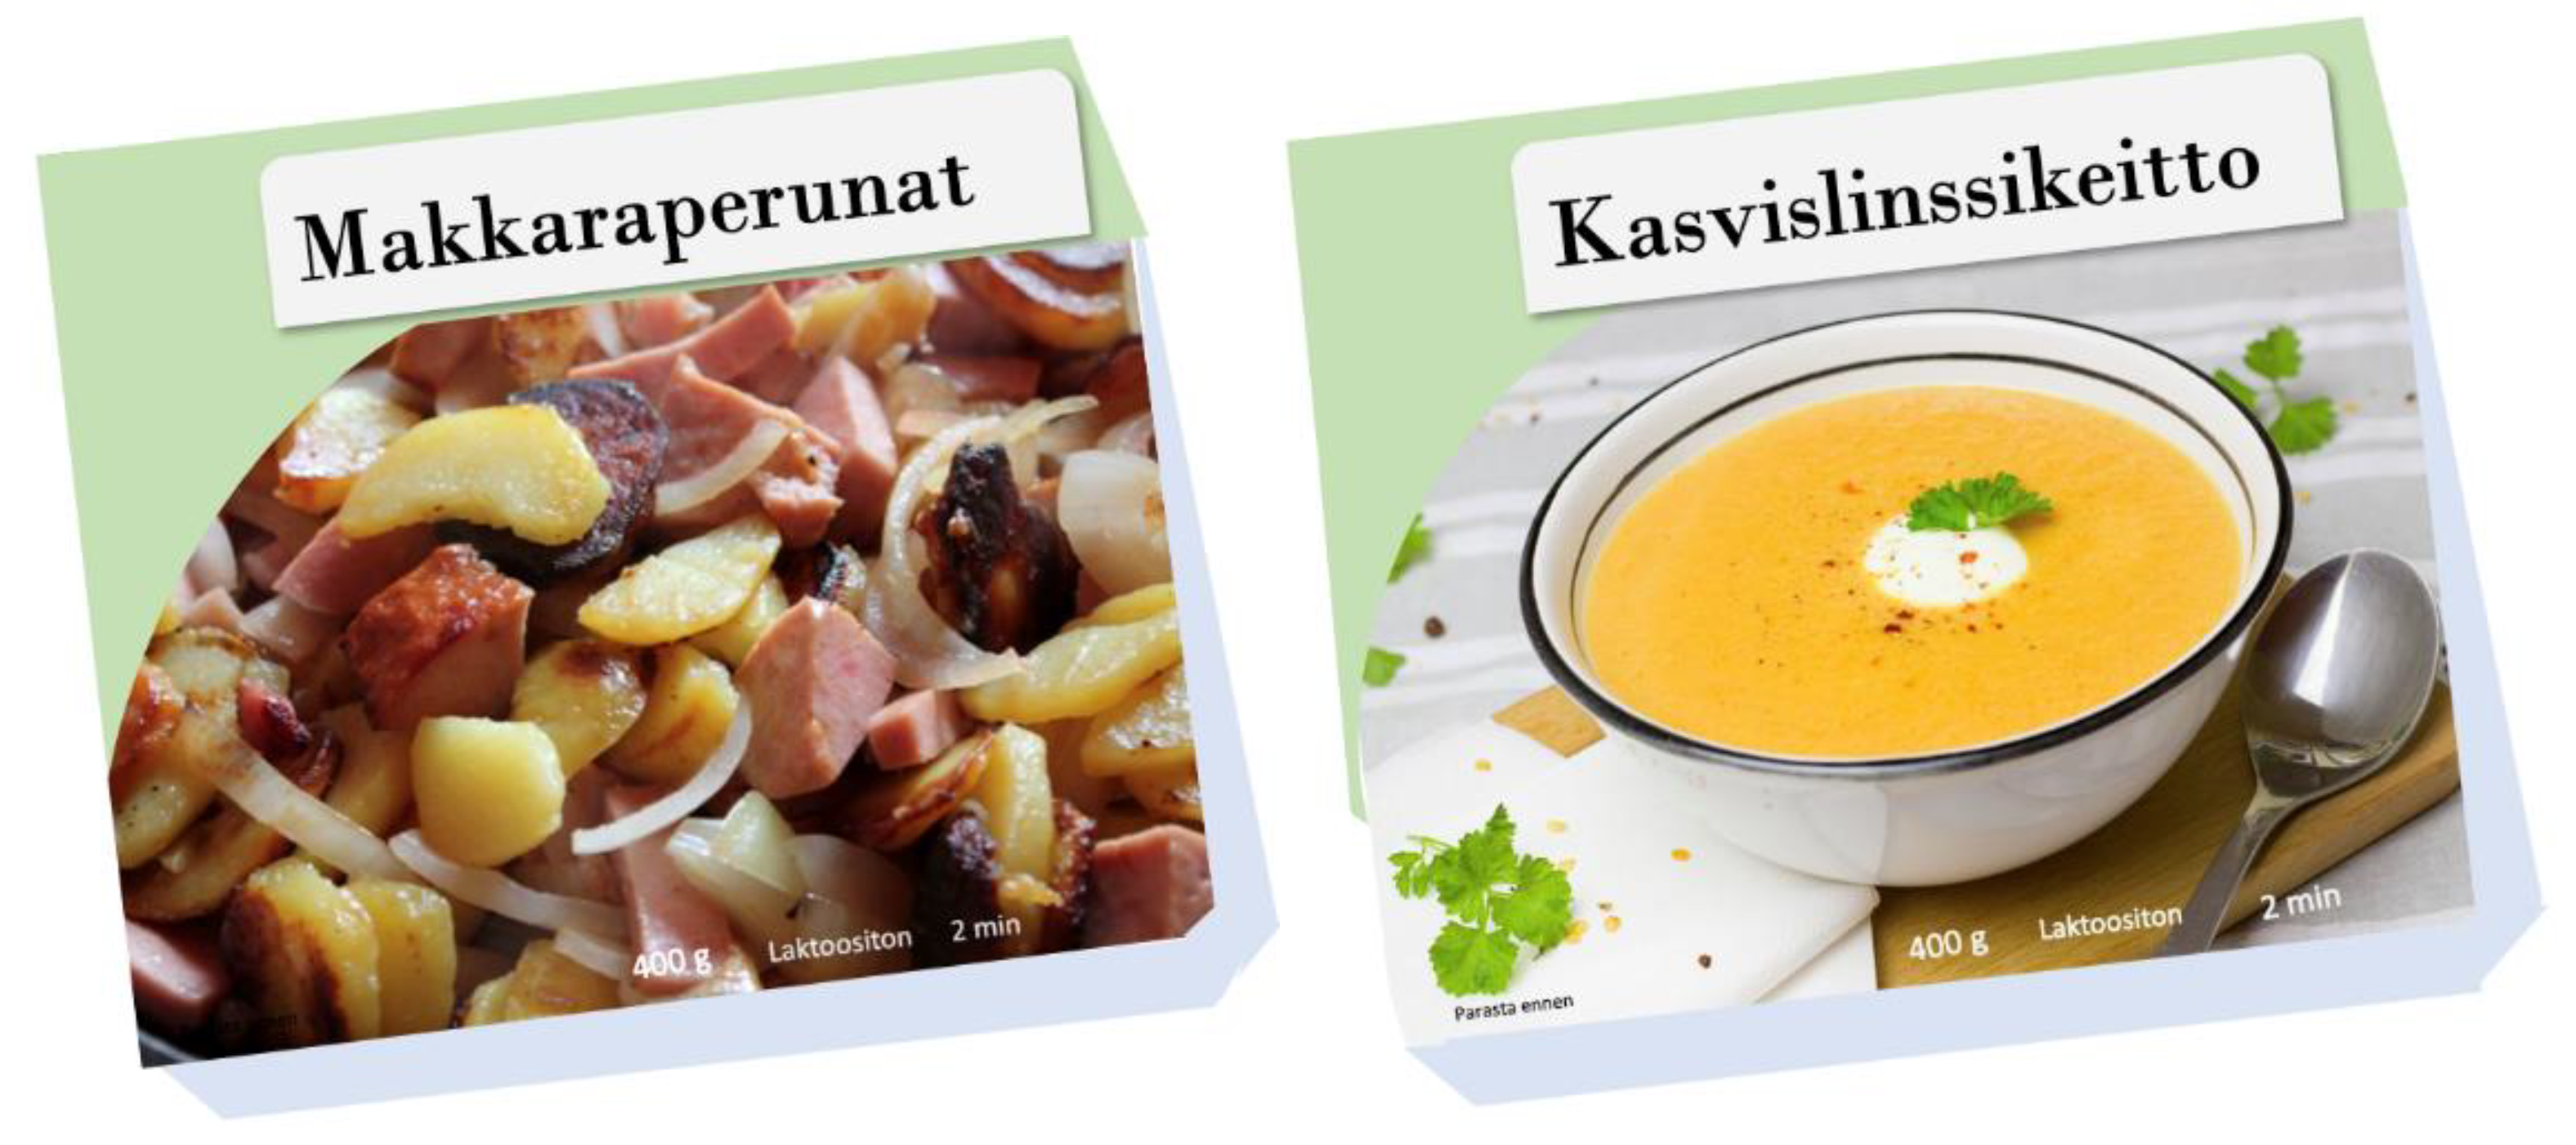
2.3. Samples
2.4. Questionnaire
2.5. Data Analysis
3. Results
3.1. The Strength of UT Belief (Study A)
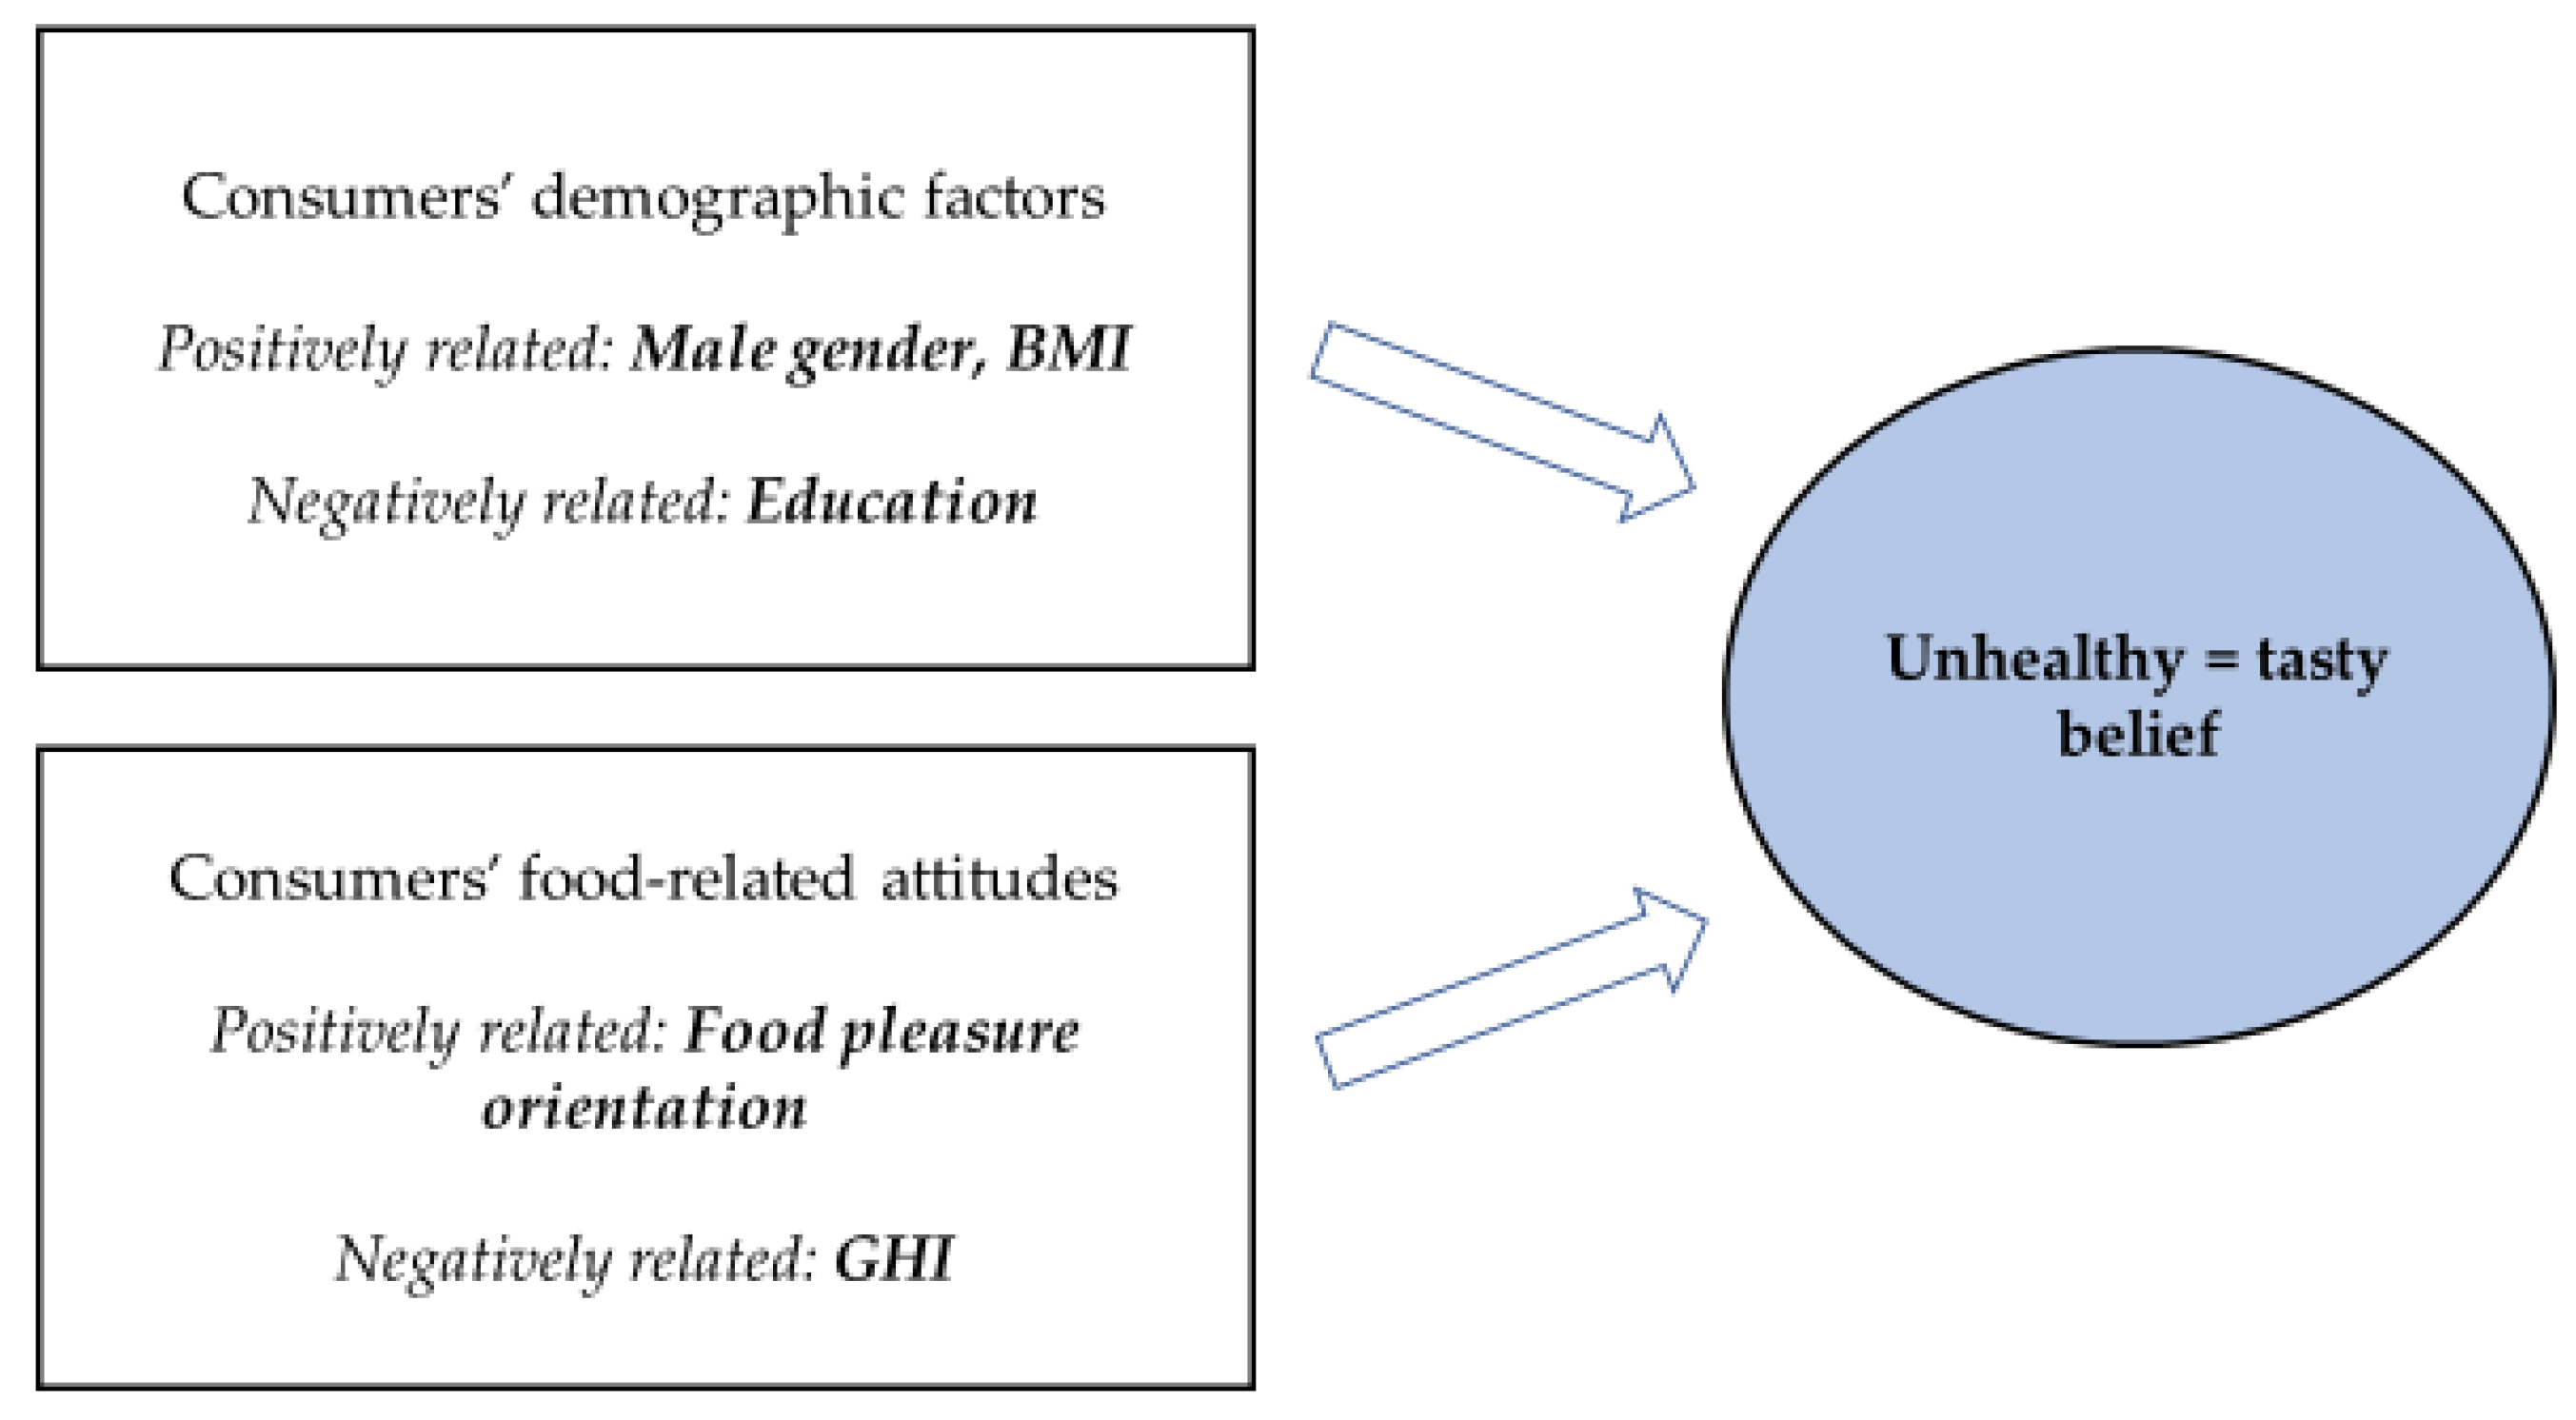
3.2. The Factors Related to UT Belief (Study A)
3.3. The Difference between Sample Products Representing Different Health Images (Study B)
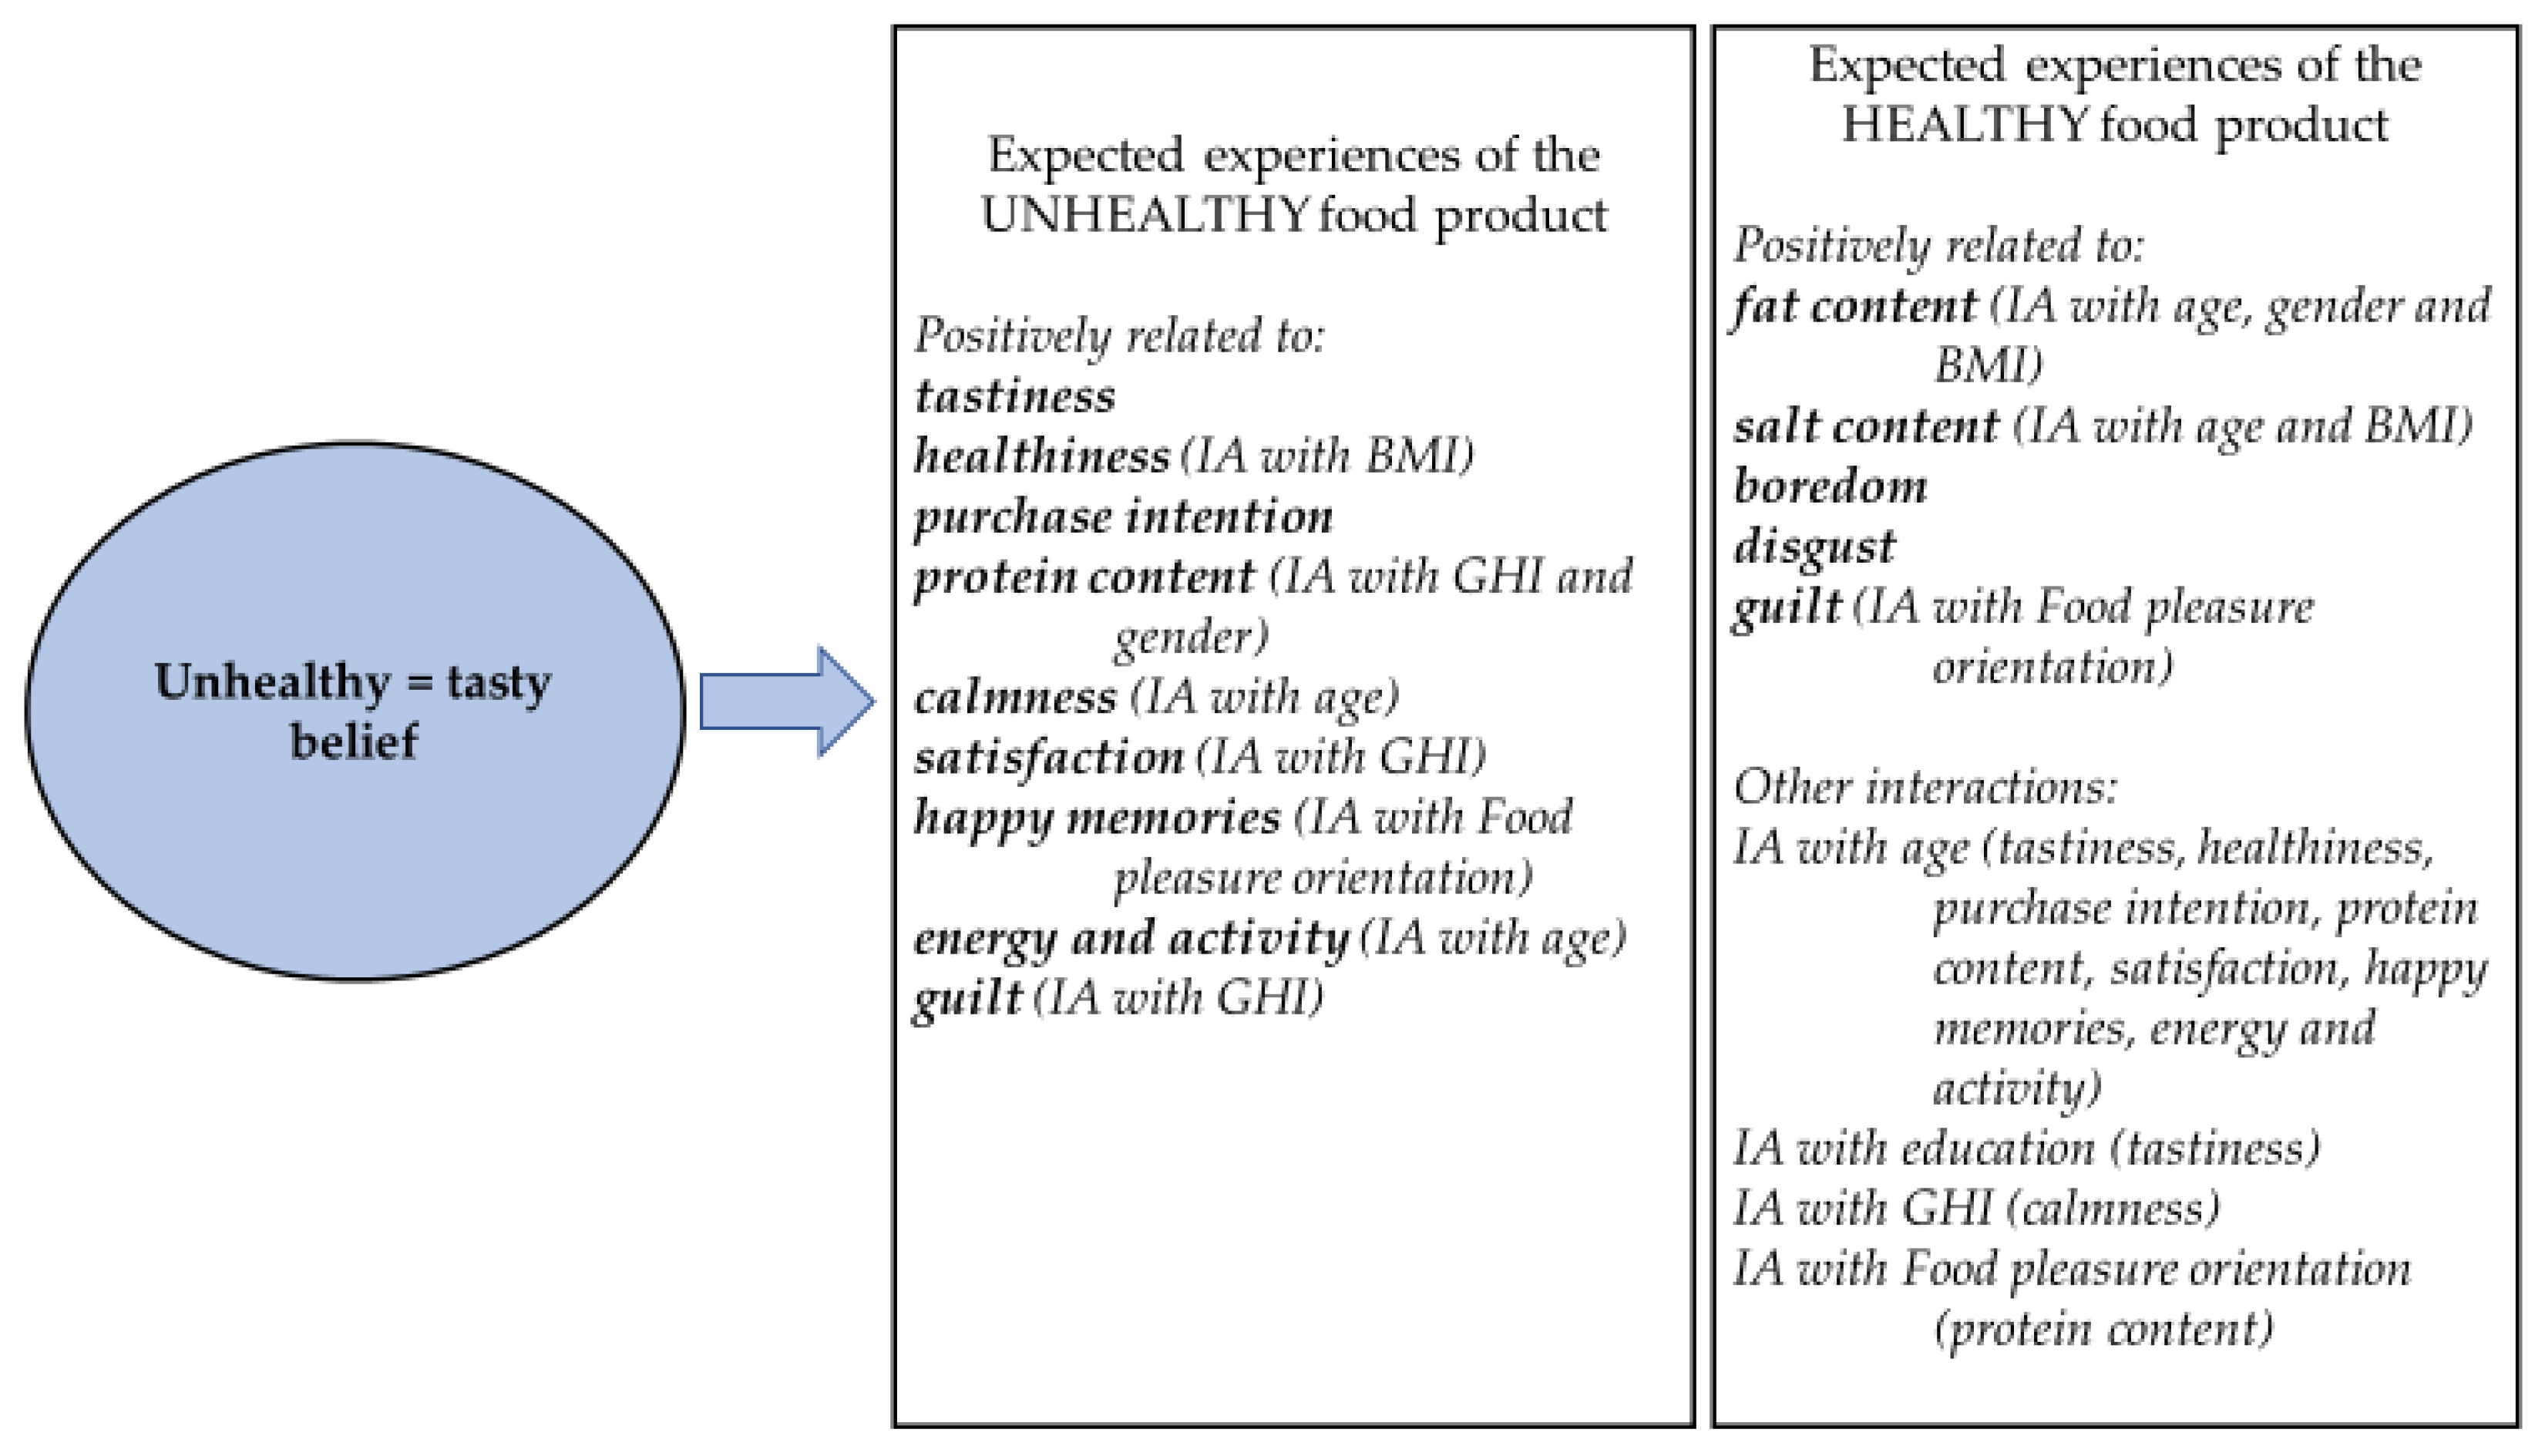
3.4. The Effect of UT Belief on the Expected Attributes of Products Having Either an Unhealthy or a Healthy Image (Study B)
3.4.1. The Effect of UT Belief on the Expected Tastiness, Healthiness, and Purchase Intention
3.4.2. The Effect of UT Belief on Expected Nutrient Content
3.4.3. The Effect of UT Belief on Expected Food-Associated Emotions
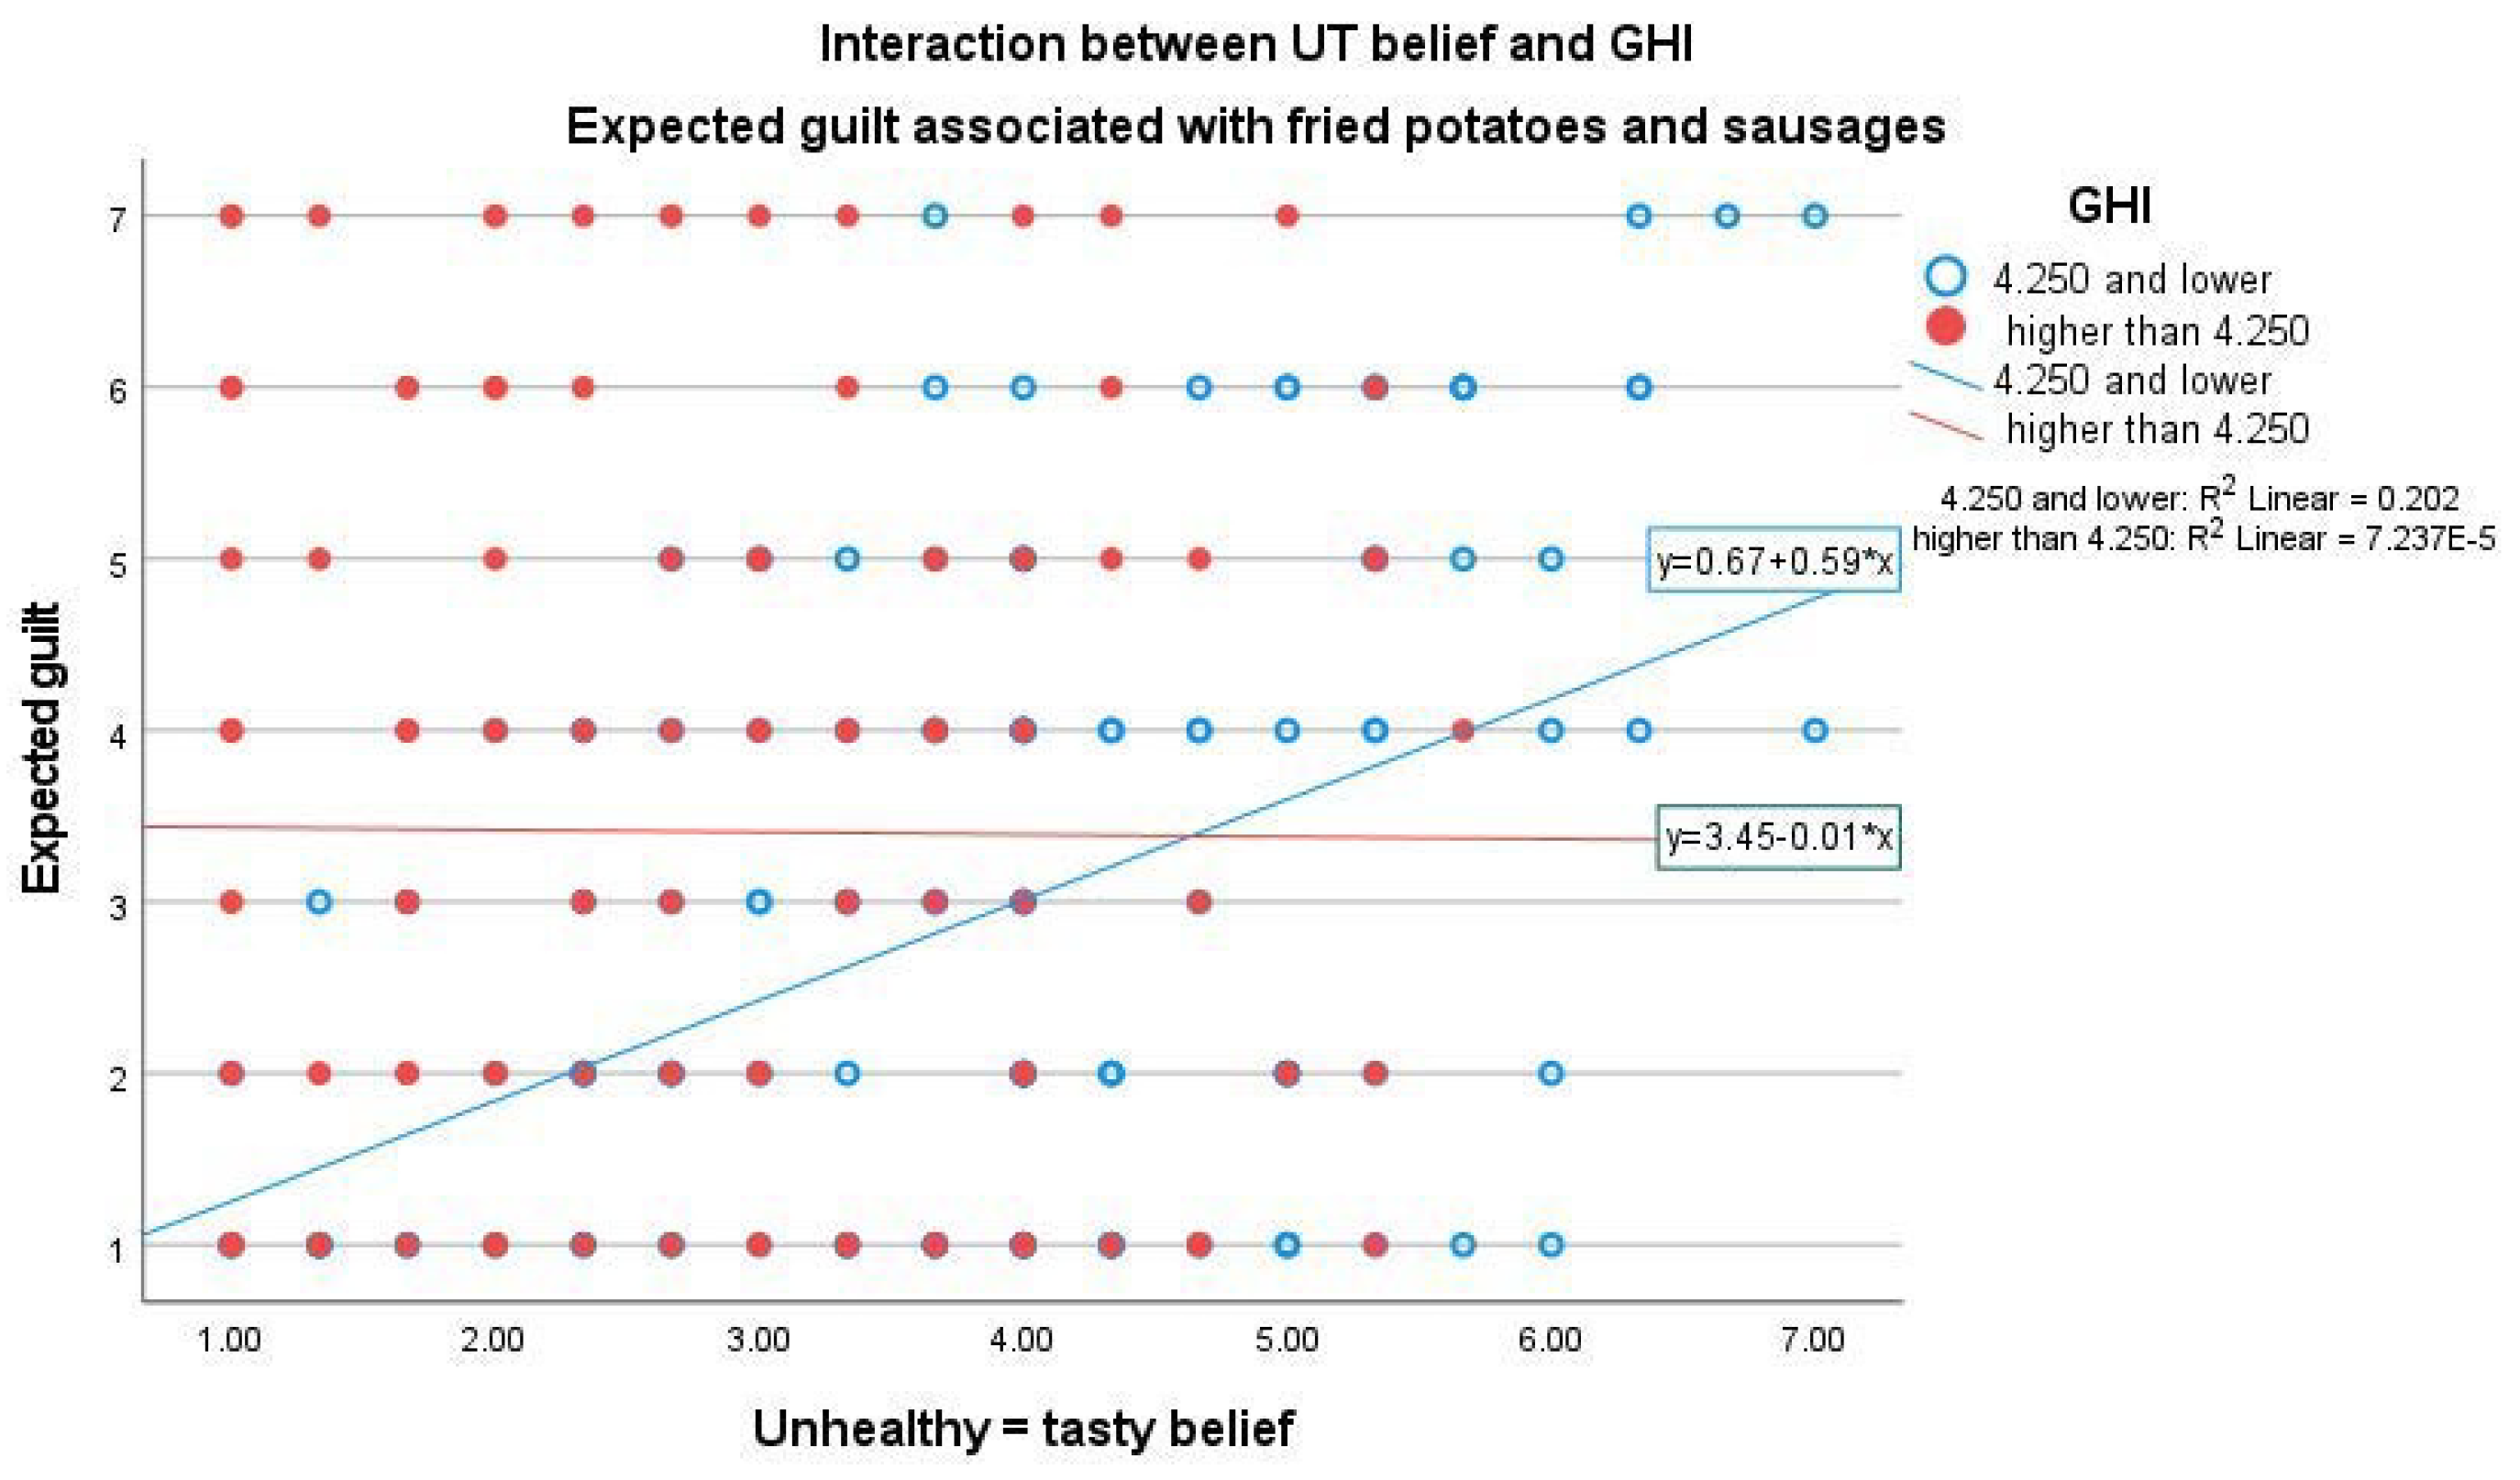
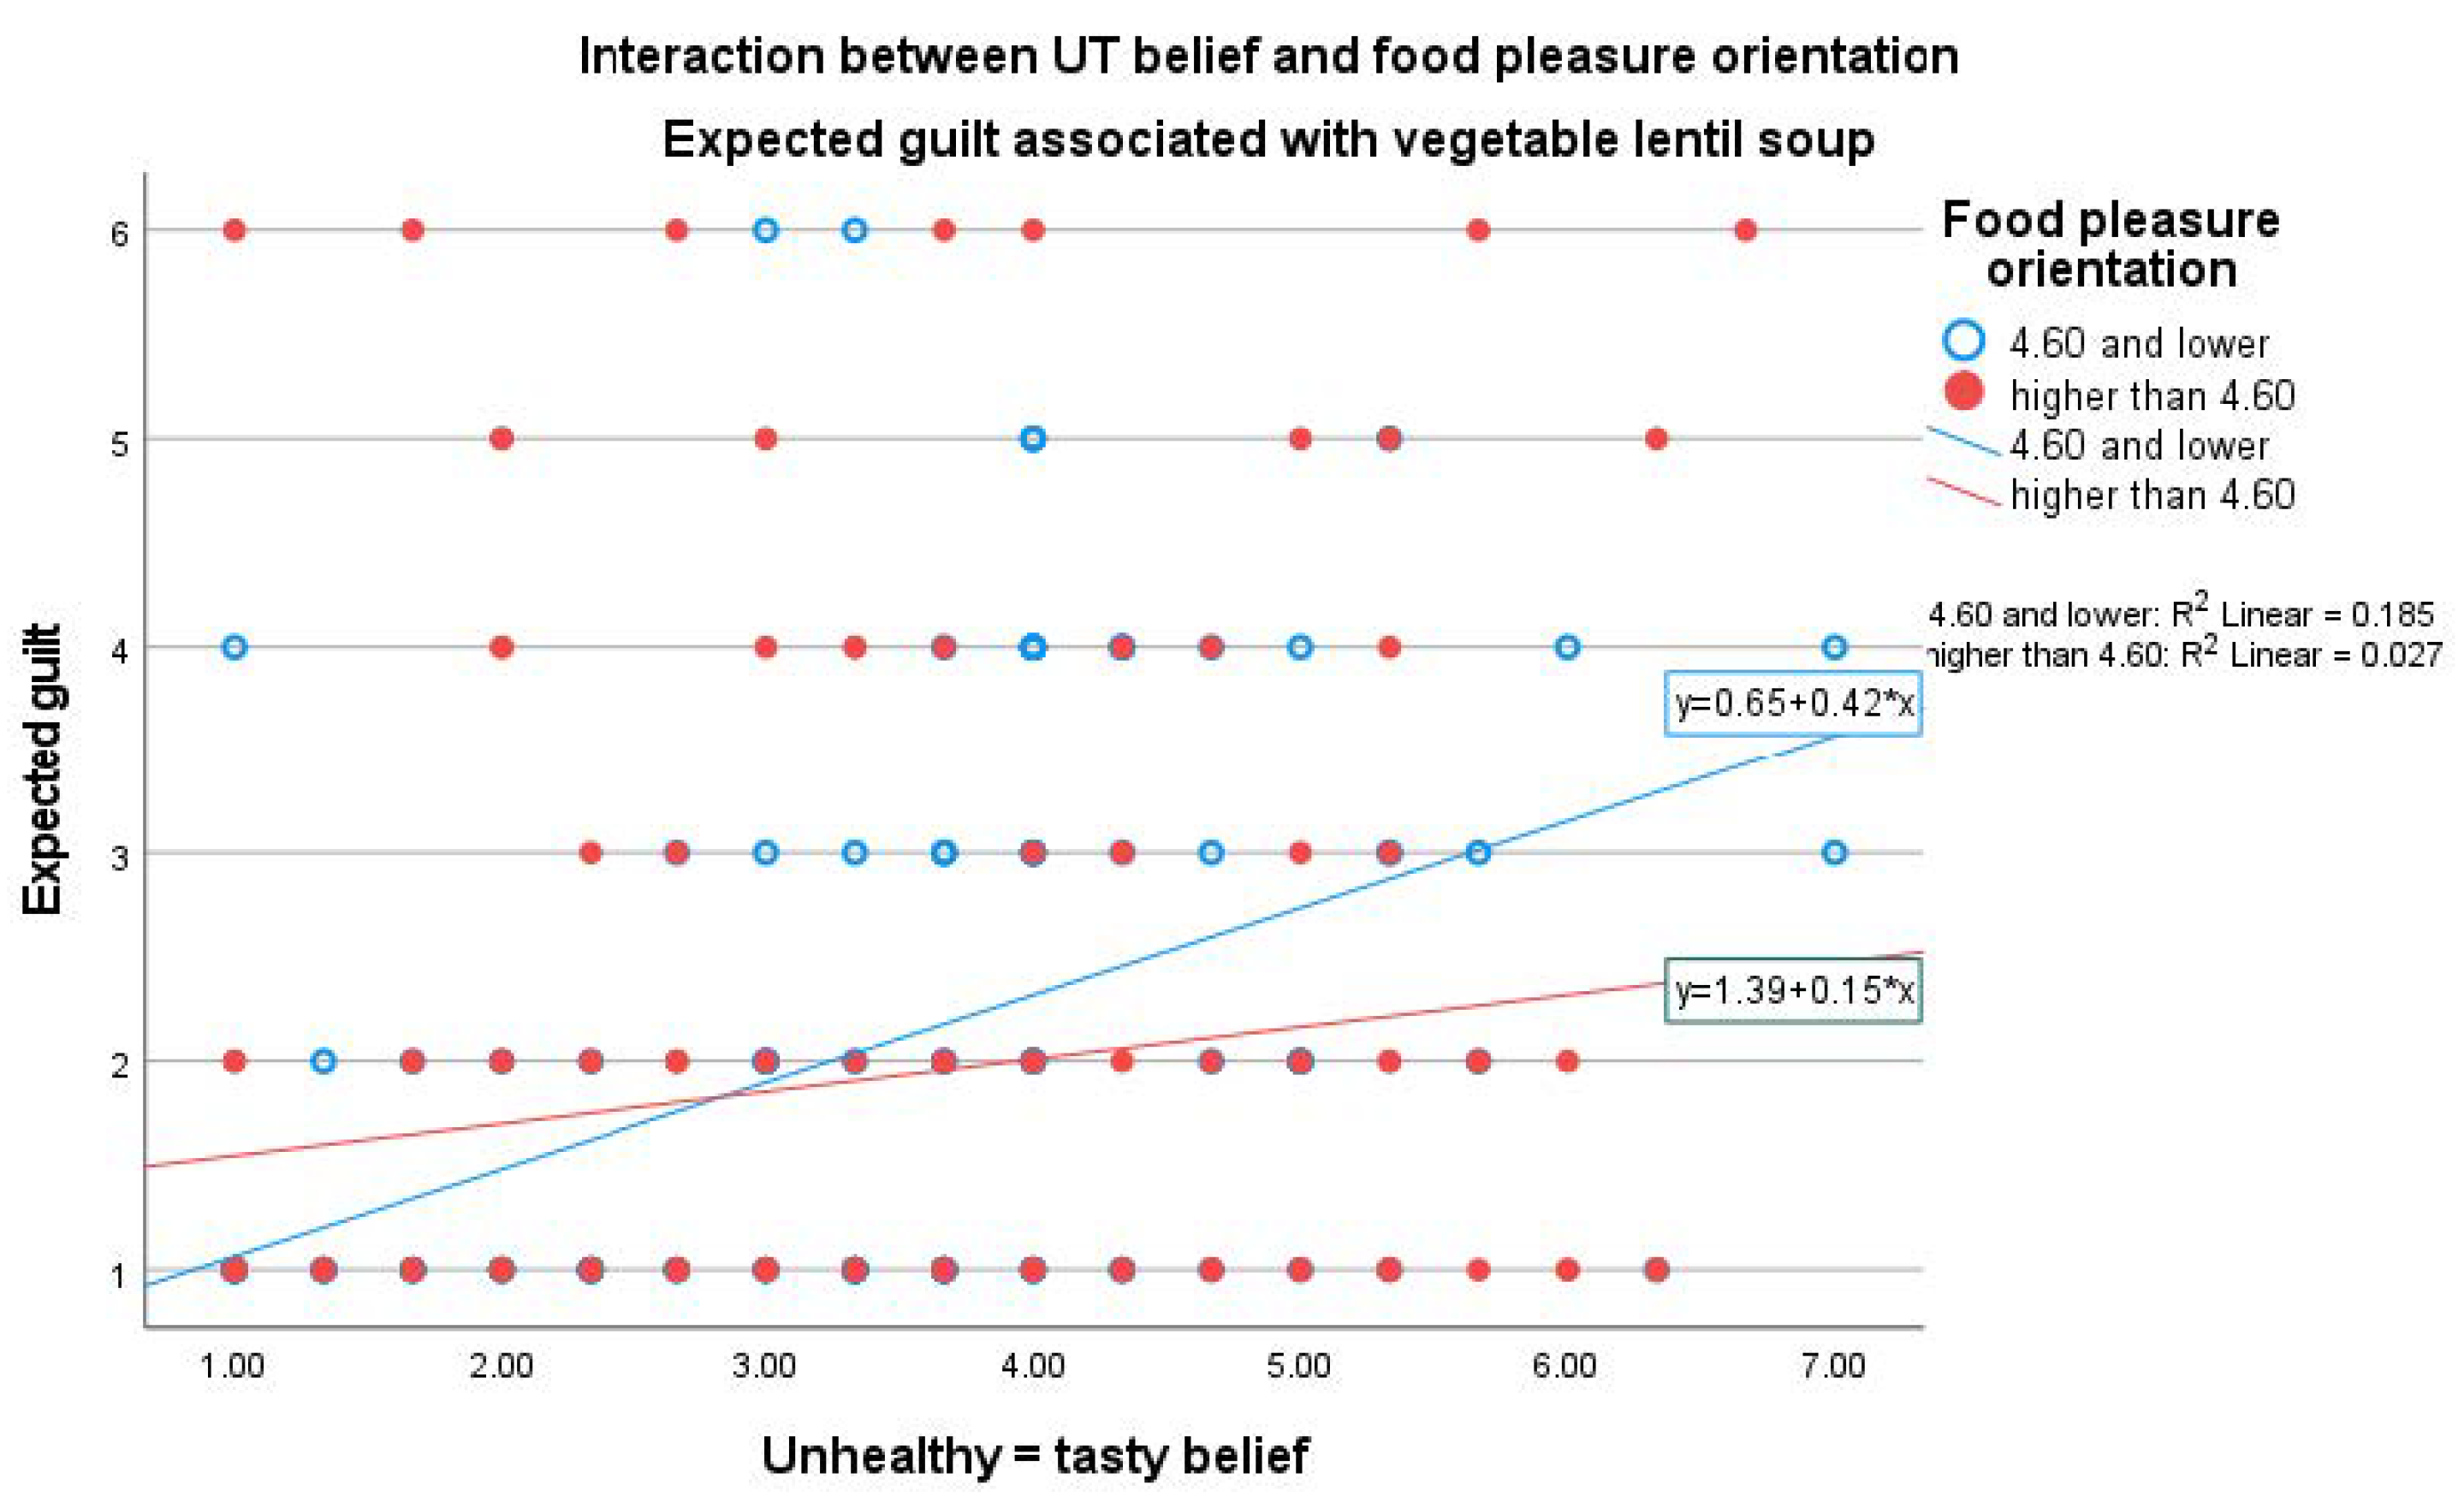
3.4.4. The Effect of UT Belief on Expected Food-Associated Guilt
4. Discussion
4.1. The Strength of UT Belief
4.2. The Factors Related to UT Belief
4.3. The Effect of UT Belief on the Expectations of Food Products with Different Health Images
4.4. The Effect of UT Belief on Expected Food-Associated Guilt
4.5. Interactions between Age and Gender and UT Belief
4.6. Suggestions for Further Studies
5. Conclusions
Supplementary Materials
Author Contributions
Funding
Data Availability Statement
Acknowledgments
Conflicts of Interest
References
- Imamura, F.; Micha, R.; Khatibzadeh, S.; Fahimi, S.; Shi, P.; Powles, J.; Mozaffarian, D. Dietary quality among men and women in 187 countries in 1990 and 2010: A systematic assessment. Lancet Glob. Health 2015, 3, e132–e142. [Google Scholar] [CrossRef]
- Bédard, A.; Lamarche, P.-O.; Grégoire, L.-M.; Trudel-Guy, C.; Provencher, V.; Desroches, S.; Lemieux, S. Can eating pleasure be a lever for healthy eating? A systematic scoping review of eating pleasure and its links with dietary behaviors and health. PLoS ONE 2020, 15, e0244292. [Google Scholar] [CrossRef]
- World Health Organization. Healthy Diet. Available online: https://www.who.int/news-room/fact-sheets/detail/healthy-diet (accessed on 8 August 2022).
- Finnish Food Authority. Nutrition and Food Recommendations. Available online: https://www.ruokavirasto.fi/en/themes/healthy-diet/nutrition-and-food-recommendations/ (accessed on 8 August 2022).
- Kaartinen, N.; Tapanainen, H.; Reinivuo, H.; Virtanen, S.; Ali-Kovero, K.; Valsta, L. Elintarvikkeiden kulutus [Food Consumption]. In Nutrition in Finland—The National FinDiet 2017 Survey; Valsta, L., Kaartinen, N., Tapanainen, H., Männistö, S., Sääksjärvi, K., Eds.; Finnish Institute for Health and Welfare (THL), THL Raportti 12/2018; PunaMusta Oy: Helsinki, Finland, 2018; pp. 49–58. [Google Scholar]
- Helakorpi, S.; Uutela, A.; Puska, P. Health behaviour and related trends. In The North Karelia Project: From North Karelia to National Action; Puska, P., Vartiainen, E., Laatikainen, T., Jousilahti, P., Paavola, M., Eds.; National Institute for Health and Welfare (THL), in Collaboration with the North Karelia Project Foundation; Helsinki University Printing House: Helsinki, Finland, 2009; pp. 85–101. [Google Scholar]
- Pietinen, P.; Valsta, L.; Paturi, M. Dietary changes. In The North Karelia Project: From North Karelia to National Action; Puska, P., Vartiainen, E., Laatikainen, T., Jousilahti, P., Paavola, M., Eds.; National Institute for Health and Welfare (THL), in Collaboration with the North Karelia Project Foundation; Helsinki University Printing House: Helsinki, Finland, 2009; pp. 103–108. [Google Scholar]
- Valsta, L.; Tapanainen, H.; Kaartinen, N.; Reinivuo, H.; Aalto, S.; Ali-Kovero, K.; Männistö, S. Ravintoaineiden saanti ruoasta ja ravintoaineiden lähteet [Nutrient intake from food and nutrient sources]. In Nutrition in Finland—The National FinDiet 2017 Survey; Valsta, L., Kaartinen, N., Tapanainen, H., Männistö, S., Sääksjärvi, K., Eds.; Finnish Institute for Health and Welfare (THL), THL Raportti 12/2018; PunaMusta Oy: Helsinki, Finland, 2018; pp. 59–134. [Google Scholar]
- Chen, P.-J.; Antonelli, M. Conceptual Models of Food Choice: Influential Factors Related to Foods, Individual Differences, and Society (Review). Foods 2020, 9, 1898. [Google Scholar] [CrossRef]
- Goukens, C.; Klesse, A.K. Internal and external forces that prevent (vs. Facilitate) healthy eating: Review and outlook within consumer psychology. Curr. Opin. Psychol. 2022, 46, 101328. [Google Scholar] [CrossRef]
- Briers, B.; Huh, Y.E.; Chan, E.; Mukhopadhyay, A. The unhealthy = tasty belief is associated with BMI through reduced consumption of vegetables: A cross-national and mediational analysis. Appetite 2020, 150, 104639. [Google Scholar] [CrossRef]
- Mai, R.; Hoffmann, S. How to combat the Unhealthy = Tasty Intuition: The influencing role of health consciousness. J. Public Policy Mark. 2015, 34, 63–83. [Google Scholar] [CrossRef]
- Tepper, B.J.; Trail, A.C. Taste or health: A study on consumer acceptance of corn chips. Food Qual. Prefer. 1998, 9, 267–272. [Google Scholar] [CrossRef]
- Sullivan, N.; Hutcherson, C.; Harris, A.; Rangel, A. Dietary self-control is related to the speed with which attributes of healthfulness and tastiness are processed. Psychol. Sci. 2015, 26, 122–134. [Google Scholar] [CrossRef]
- Raghunathan, R.; Naylor, R.W.; Hoyer, W.D. The Unhealthy = Tasty Intuition and its effects on taste inferences, enjoyment, and choice of food products. J. Mark. 2006, 70, 170–184. [Google Scholar] [CrossRef]
- Werle, C.O.C.; Trendel, O.; Ardito, G. Unhealthy food is not tastier for everybody: The “healthy = tasty’’ French intuition. Food Qual. Prefer. 2013, 28, 116–121. [Google Scholar] [CrossRef]
- Cooremans, K.; Geuens, M.; Pandelaere, M. Cross-national investigation of the drivers of obesity: Re-assessment of past findings and avenues for the future. Appetite 2017, 114, 360–367. [Google Scholar] [CrossRef] [PubMed]
- Haasova, S.; Florack, A. Practicing the (un)healthy=tasty intuition: Toward an ecological view of the relationship between health and taste in consumer judgments. Food Qual. Prefer. 2019, 75, 39–53. [Google Scholar] [CrossRef]
- Januszewska, R.; Pieniak, Z.; Verbeke, W. Food choice questionnaire revisited in four countries. Does it still measure the same? Appetite 2011, 57, 94–98. [Google Scholar] [CrossRef] [PubMed]
- Huang, Y.; Wu, J. Food pleasure orientation diminishes the “healthy = less tasty” intuition. Food Qual. Prefer. 2016, 54, 75–78. [Google Scholar] [CrossRef]
- Thomson, D.M.H.; Crocker, C.; Marketo, C.G. Linking sensory characteristics to emotions: An example using dark chocolate. Food Qual. Prefer. 2010, 21, 1117–1125. [Google Scholar] [CrossRef]
- Desmet, P.M.A.; Schifferstein, H.N.J. Sources of positive and negative emotions in food experience. Appetite 2008, 50, 290–301. [Google Scholar] [CrossRef]
- Spinelli, S.; Masi, C.; Dinnella, C.; Zoboli, G.P.; Monteleone, E. How does it make you feel? A new approach to measuring emotions in food product experience. Food Qual. Prefer. 2014, 37, 109–122. [Google Scholar] [CrossRef]
- King, S.C.; Meiselman, H.L. Development of a method to measure consumer emotions associated with foods. Food Qual. Prefer. 2010, 21, 168–177. [Google Scholar] [CrossRef]
- Schouteten, J.J.; De Steur, H.; De Pelsmaeker, S.; Lagast, S.; De Bourdeaudhuij, I.; Gellynck, X. An integrated method for the emotional conceptualization and sensory characterization of food products: The EmoSensory® Wheel. Food Res. Int. 2015, 78, 96–107. [Google Scholar] [CrossRef]
- Dalenberg, J.R.; Gutjar, S.; ter Horst, G.J.; de Graaf, K.; Renken, R.J.; Jager, G. Evoked emotions predict food choice. PLoS ONE 2014, 9, e115388. [Google Scholar] [CrossRef]
- Köster, E.P.; Mojet, J. From mood to food and from food to mood: A psychological perspective on the measurement of food-related emotions in consumer research (Review). Food Res. Int. 2015, 76, 180–191. [Google Scholar] [CrossRef]
- Nestrud, M.A.; Meiselman, H.L.; King, S.C.; Lesher, L.L.; Cardello, A.V. Development of EsSense25, a shorter version of the EsSense Profile®. Food Qual. Prefer. 2016, 48, 107–117. [Google Scholar] [CrossRef]
- Baumeister, R.F.; Stillwell, A.M.; Heatherton, T.F. Guilt: An Interpersonal Approach. Psychol. Bull. 1994, 115, 243–267. [Google Scholar] [CrossRef] [PubMed]
- Hur, J.; Jang, S. Anticipated guilt and pleasure in a healthy food consumption context. Int. J. Hosp. Manag. 2015, 48, 113–123. [Google Scholar] [CrossRef]
- Yu, H.; Chambers, E.; Koppel, K. Exploration of the food-related guilt concept. J. Sens. Stud. 2021, 36, e12622. [Google Scholar] [CrossRef]
- Elder, R.S.; Mohr, G.S. Guilty displeasures: How imagined guilt dampens consumer enjoyment. Appetite 2020, 150, 104641. [Google Scholar] [CrossRef]
- Statistics Finland, Finland in Figures. Available online: https://www.stat.fi/tup/suoluk/index_en.html (accessed on 8 August 2022).
- Roininen, K.; Lähteenmäki, L.; Tuorila, H. Quantification of consumer attitudes to health and hedonic characteristics of foods. Appetite 1999, 33, 71–88. [Google Scholar] [CrossRef]
- Rozin, P.; Fischler, C.; Imada, S.; Sarubin, A.; Wrzesniewski, A. Attitudes to food and the role of food in life in the U.S.A., Japan, Flemish Belgium and France: Possible implications for the diet–health debate. Appetite 1999, 33, 163–180. [Google Scholar] [CrossRef]
- van der Heijden, A.; te Molder, H.; de Graaf, C.; Jagera, G. Healthy is (not) tasty? Implicit and explicit associations between food healthiness and tastiness in primary school-aged children and parents with a lower socioeconomic position. Food Qual. Prefer. 2020, 84, 103939. [Google Scholar] [CrossRef]
- Landry, M.; Lemieux, S.; Lapointe, A.; Bédard, A.; Bélanger-Gravel, A.; Bégin, C.; Provencher, V.; Desroches, S. Is eating pleasure compatible with healthy eating? A qualitative study on Quebecers′ perceptions. Appetite 2018, 125, 537–547. [Google Scholar] [CrossRef]
- Wardle, J.; Haase, A.M.; Steptoe, A.; Nillapun, M.; Jonwutiwes, K.; Bellisle, F. Gender differences in food choice: The contribution of health beliefs and dieting. Ann. Behav. Med. 2004, 27, 107–116. [Google Scholar] [CrossRef] [PubMed]
- Richetin, J.; Demartini, E.; Gaviglio, A.; Ricci, E.C.; Stranieri, S.; Banterle, A.; Perugini, M. The biasing effect of evocative attributes at the implicit and explicit level: The tradition halo and the industrial horn in food products evaluations. J. Retail. Consum. Serv. 2021, 61, 101890. [Google Scholar] [CrossRef]
- Apaolaza, V.; Hartmann, P.; Echebarria, C.; Barrutia, J.M. Organic label’s halo effect on sensory and hedonic experience of wine: A pilot study. J. Sens. Stud. 2017, 32, e12243. [Google Scholar] [CrossRef]
- De Young, K.P.; Zander, M.; Towne, T.; Della Longa, N.M.; Hovrud, L.; Murtha-Berg, E. The relation of dietary restraint and affect with food choice and the experience of guilt after eating. Curr. Psychol. 2019, 38, 92–99. [Google Scholar] [CrossRef]
- Oliveira, J.; Colombarolli, M.S.; Figueredo, L.S.; Cordás, T.A. Cognitive restraint directed at carbohydrates in individuals on low-carb diet with binge eating: The role of guilt about food cravings. Einstein 2021, 19, eAO5599. [Google Scholar] [CrossRef]
- Rejman, K.; Kaczorowska, J.; Halicka, E.; Laskowski, W. Do Europeans consider sustainability when making food choices? A survey of Polish city-dwellers. Public Health Nutr. 2019, 22, 1330–1339. [Google Scholar] [CrossRef]
- Zakowska-Biemans, S.; Pieniak, Z.; Kostyra, E.; Gutkowska, K. Searching for a measure integrating sustainable and healthy eating behaviors. Nutrients 2019, 11, 95. [Google Scholar] [CrossRef]
- Turnwald, B.P.; Crum, A.J. Smart food policy for healthy food labeling: Leading with taste, not healthiness, to shift consumption and enjoyment of healthy foods. Prev. Med. 2019, 119, 7–13. [Google Scholar] [CrossRef]


| Unstandardized | Standardized | Sig. | CI (95.0%) for β | ||
|---|---|---|---|---|---|
| β | β | Lower Bound | Upper Bound | ||
| (Constant) | 4.315 | <0.001 | 3.779 | 4.851 | |
| Gender (0 = female; 1 = male) | 0.500 | 0.168 *** | <0.001 | 0.364 | 0.637 |
| Age (years) | −0.002 | −0.022 | 0.371 | −0.007 | 0.003 |
| BMI (kg/m2) | 0.012 | 0.048 * | 0.042 | 0.000 | 0.023 |
| Education (0 = no; 1= academic degree) | −0.170 | −0.057 * | 0.015 | −0.307 | −0.033 |
| GHI | −0.463 | −0.361 *** | <0.001 | −0.525 | −0.402 |
| Food pleasure orientation | 0.111 | 0.076 ** | 0.001 | 0.044 | 0.177 |
Publisher’s Note: MDPI stays neutral with regard to jurisdictional claims in published maps and institutional affiliations. |
© 2022 by the authors. Licensee MDPI, Basel, Switzerland. This article is an open access article distributed under the terms and conditions of the Creative Commons Attribution (CC BY) license (https://creativecommons.org/licenses/by/4.0/).
Share and Cite
Paakki, M.; Kantola, M.; Junkkari, T.; Arjanne, L.; Luomala, H.; Hopia, A. “Unhealthy = Tasty”: How Does It Affect Consumers’ (Un)Healthy Food Expectations? Foods 2022, 11, 3139. https://doi.org/10.3390/foods11193139
Paakki M, Kantola M, Junkkari T, Arjanne L, Luomala H, Hopia A. “Unhealthy = Tasty”: How Does It Affect Consumers’ (Un)Healthy Food Expectations? Foods. 2022; 11(19):3139. https://doi.org/10.3390/foods11193139
Chicago/Turabian StylePaakki, Maija, Maija Kantola, Terhi Junkkari, Leena Arjanne, Harri Luomala, and Anu Hopia. 2022. "“Unhealthy = Tasty”: How Does It Affect Consumers’ (Un)Healthy Food Expectations?" Foods 11, no. 19: 3139. https://doi.org/10.3390/foods11193139
APA StylePaakki, M., Kantola, M., Junkkari, T., Arjanne, L., Luomala, H., & Hopia, A. (2022). “Unhealthy = Tasty”: How Does It Affect Consumers’ (Un)Healthy Food Expectations? Foods, 11(19), 3139. https://doi.org/10.3390/foods11193139