

Quantitative Bio-Mapping of Salmonella and Indicator Organisms at Different Stages in a Commercial Pork Processing Facility
 , , ,
, , ,
Abstract
1. Introduction
2. Materials and Methods
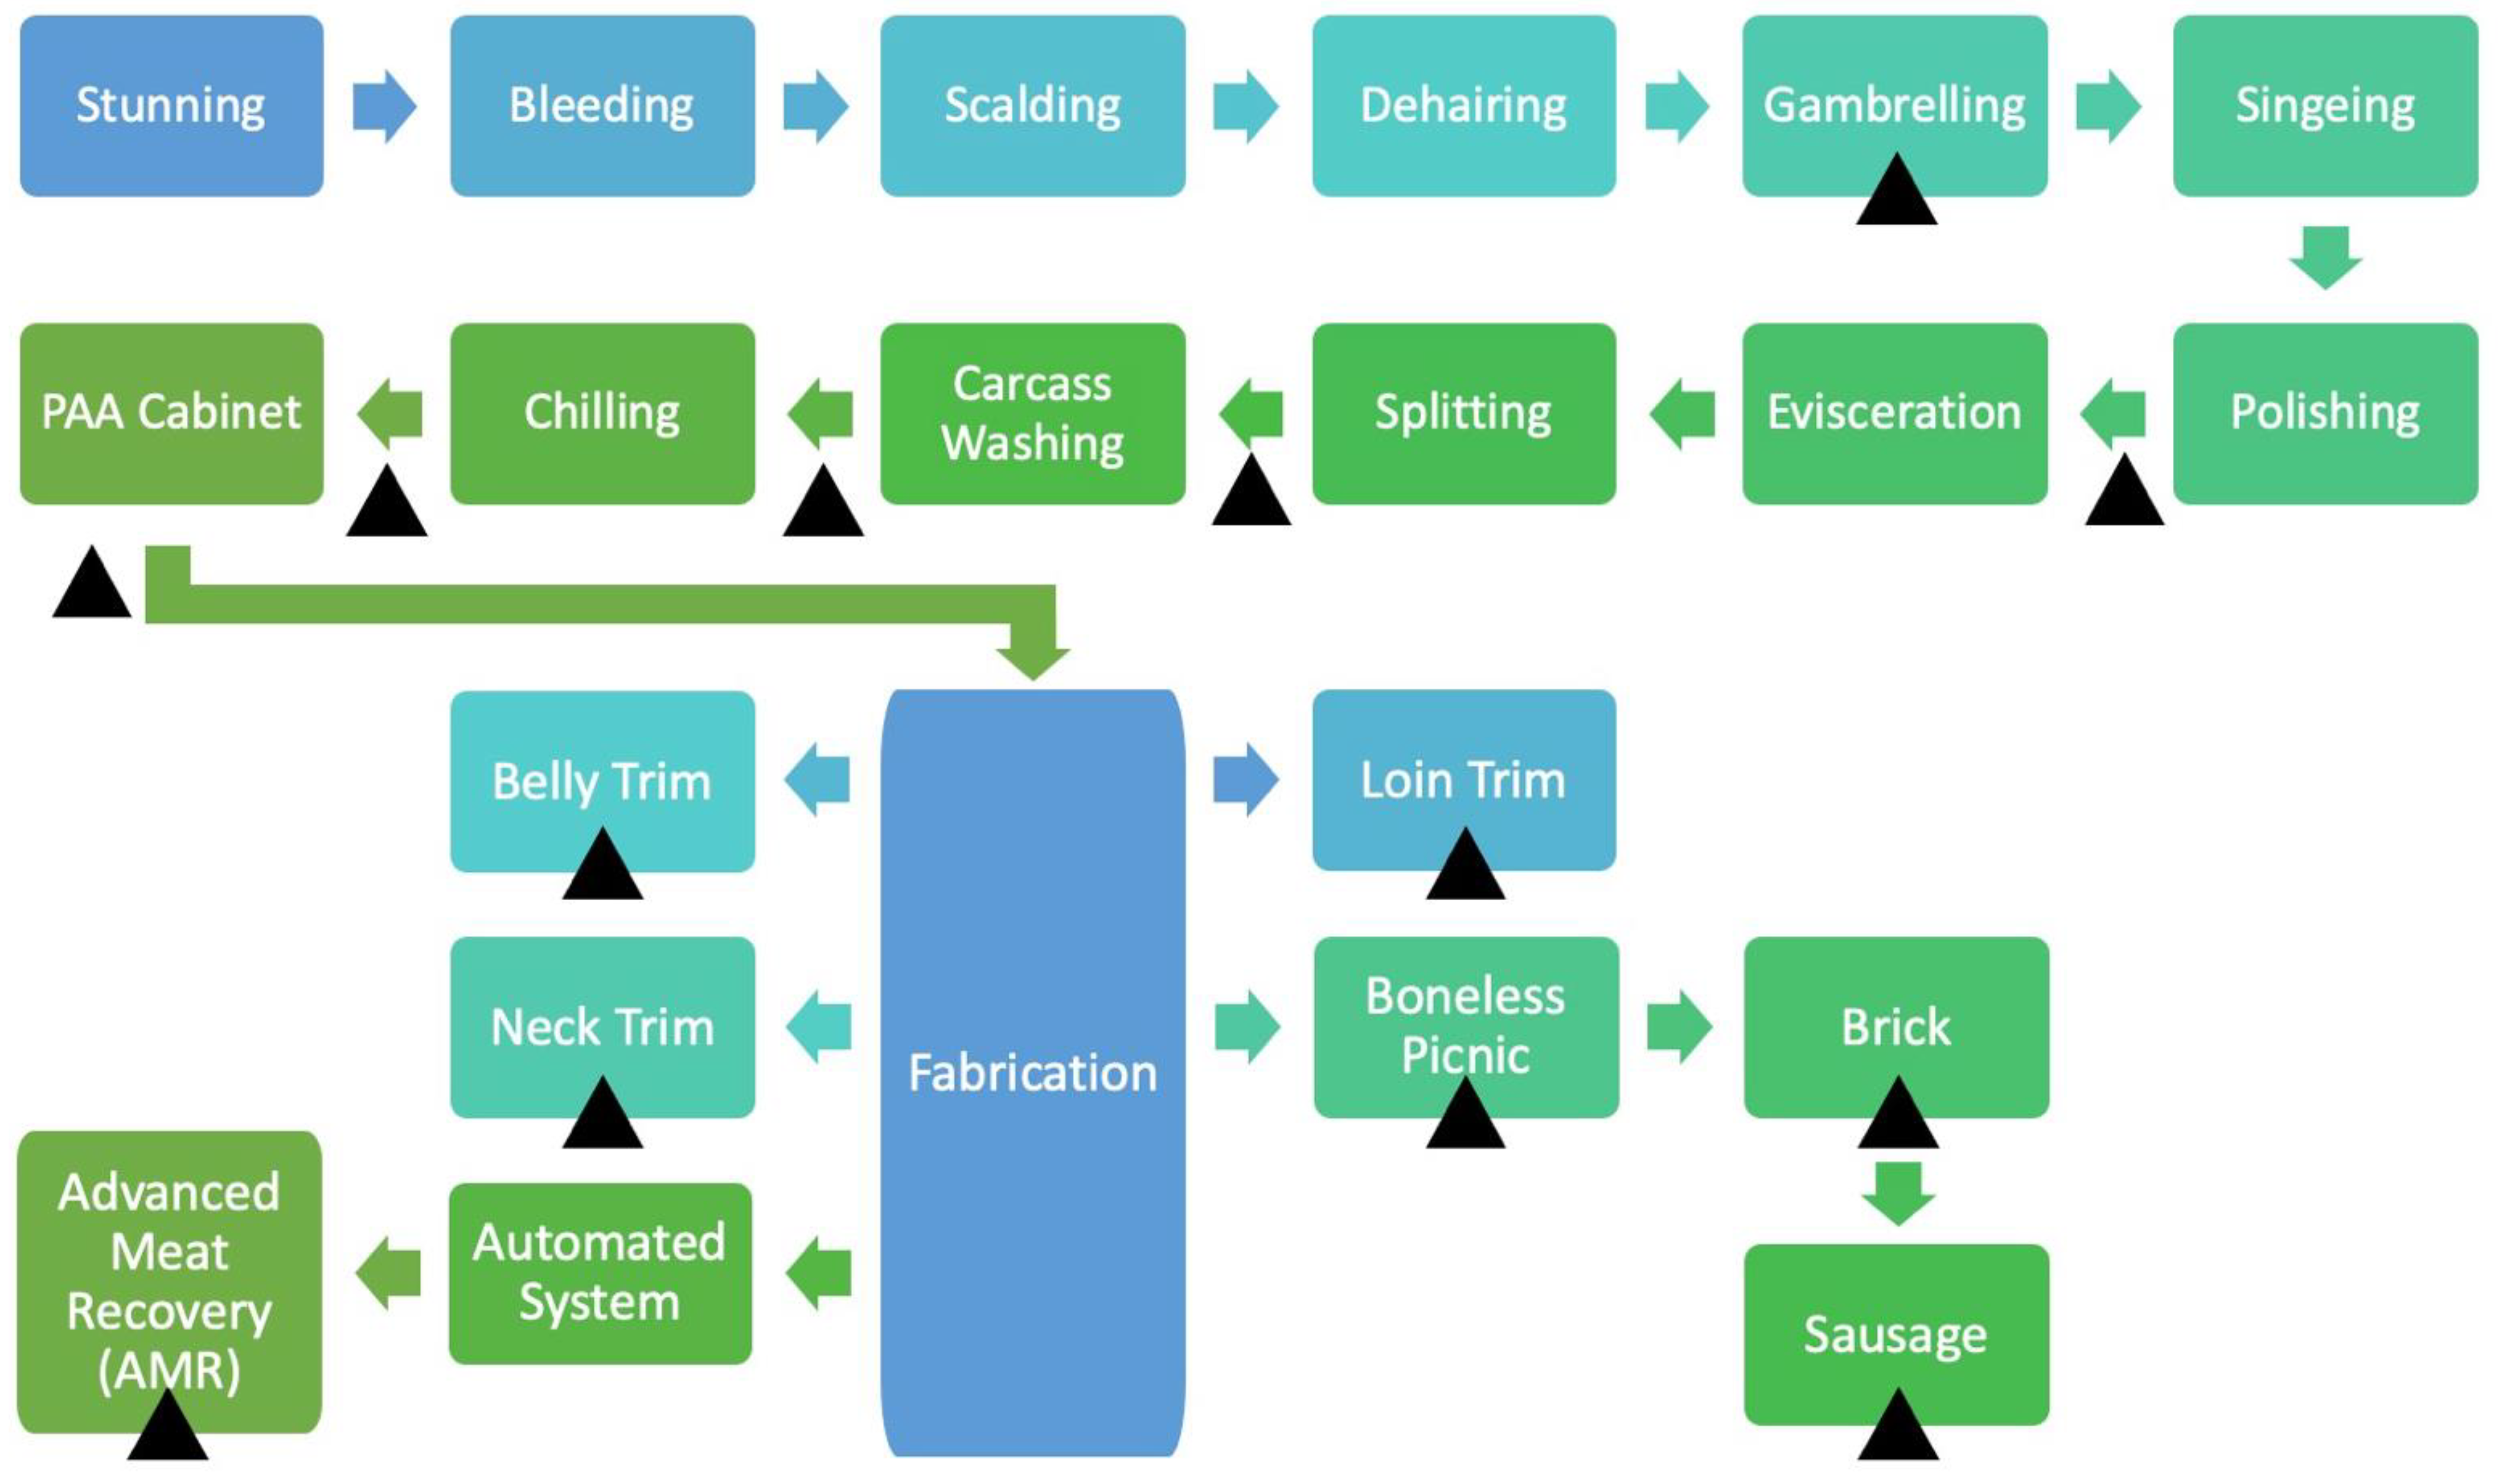
2.1. Sample Collection
2.2. Sample Processing
2.3. Microbial Indicators Enumeration
2.4. Salmonella Enumeration and Prevalence
2.5. Statistical Analysis
3. Results
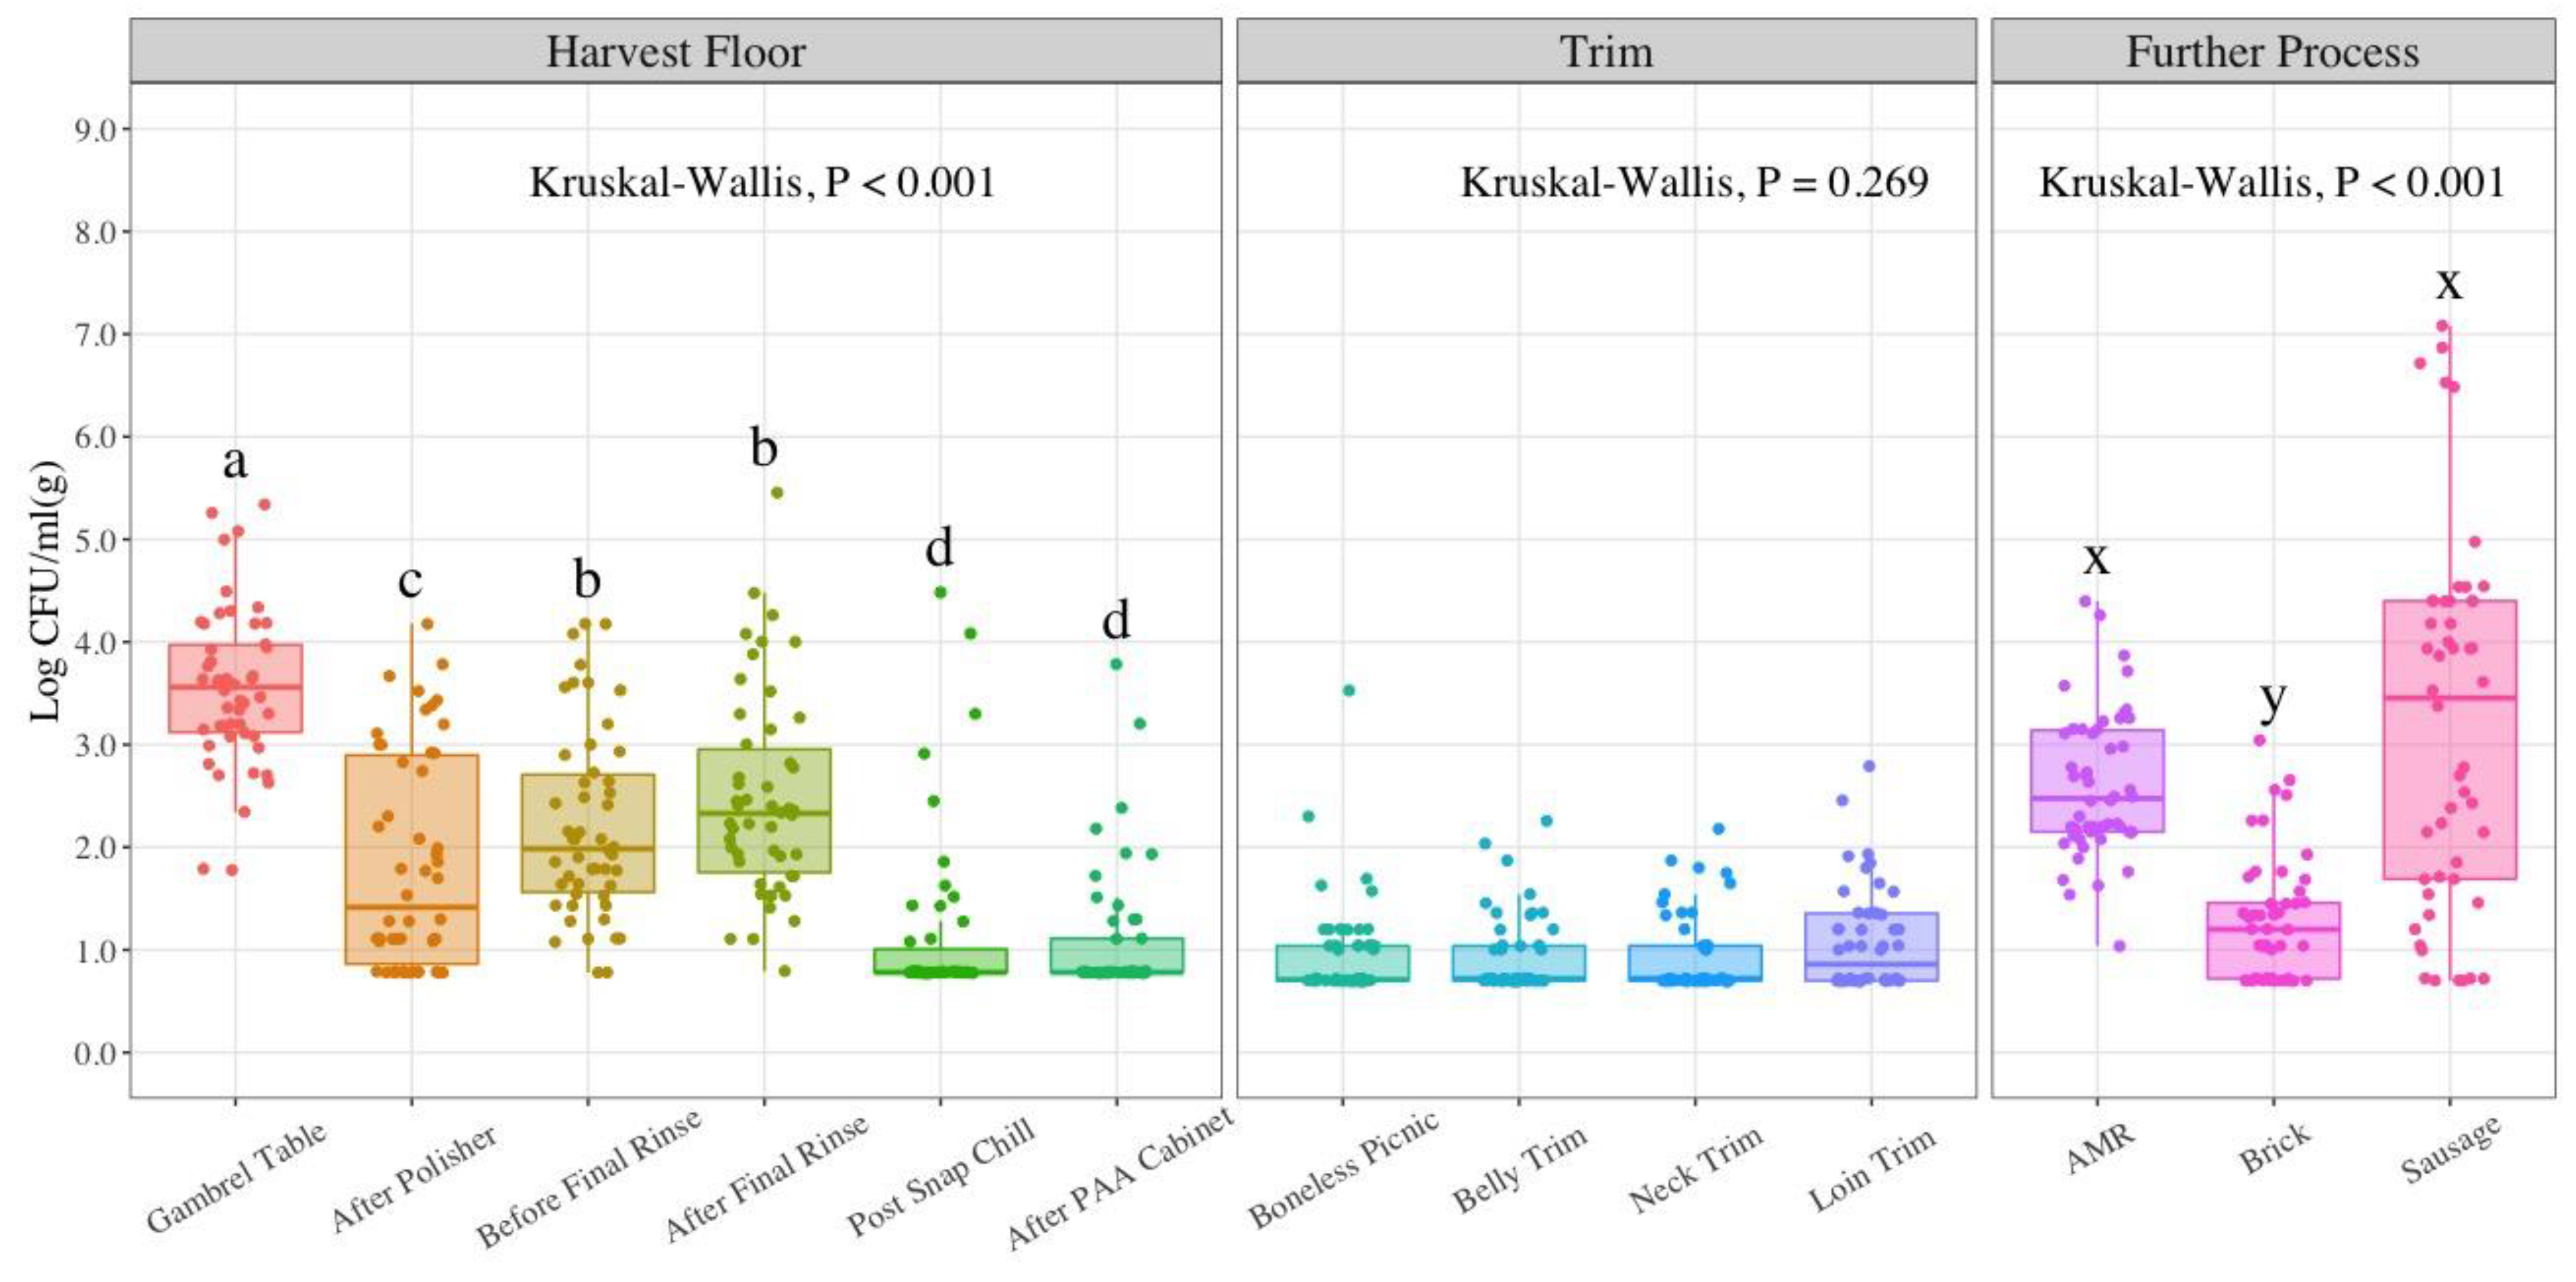
3.1. Aerobic Counts (AC)
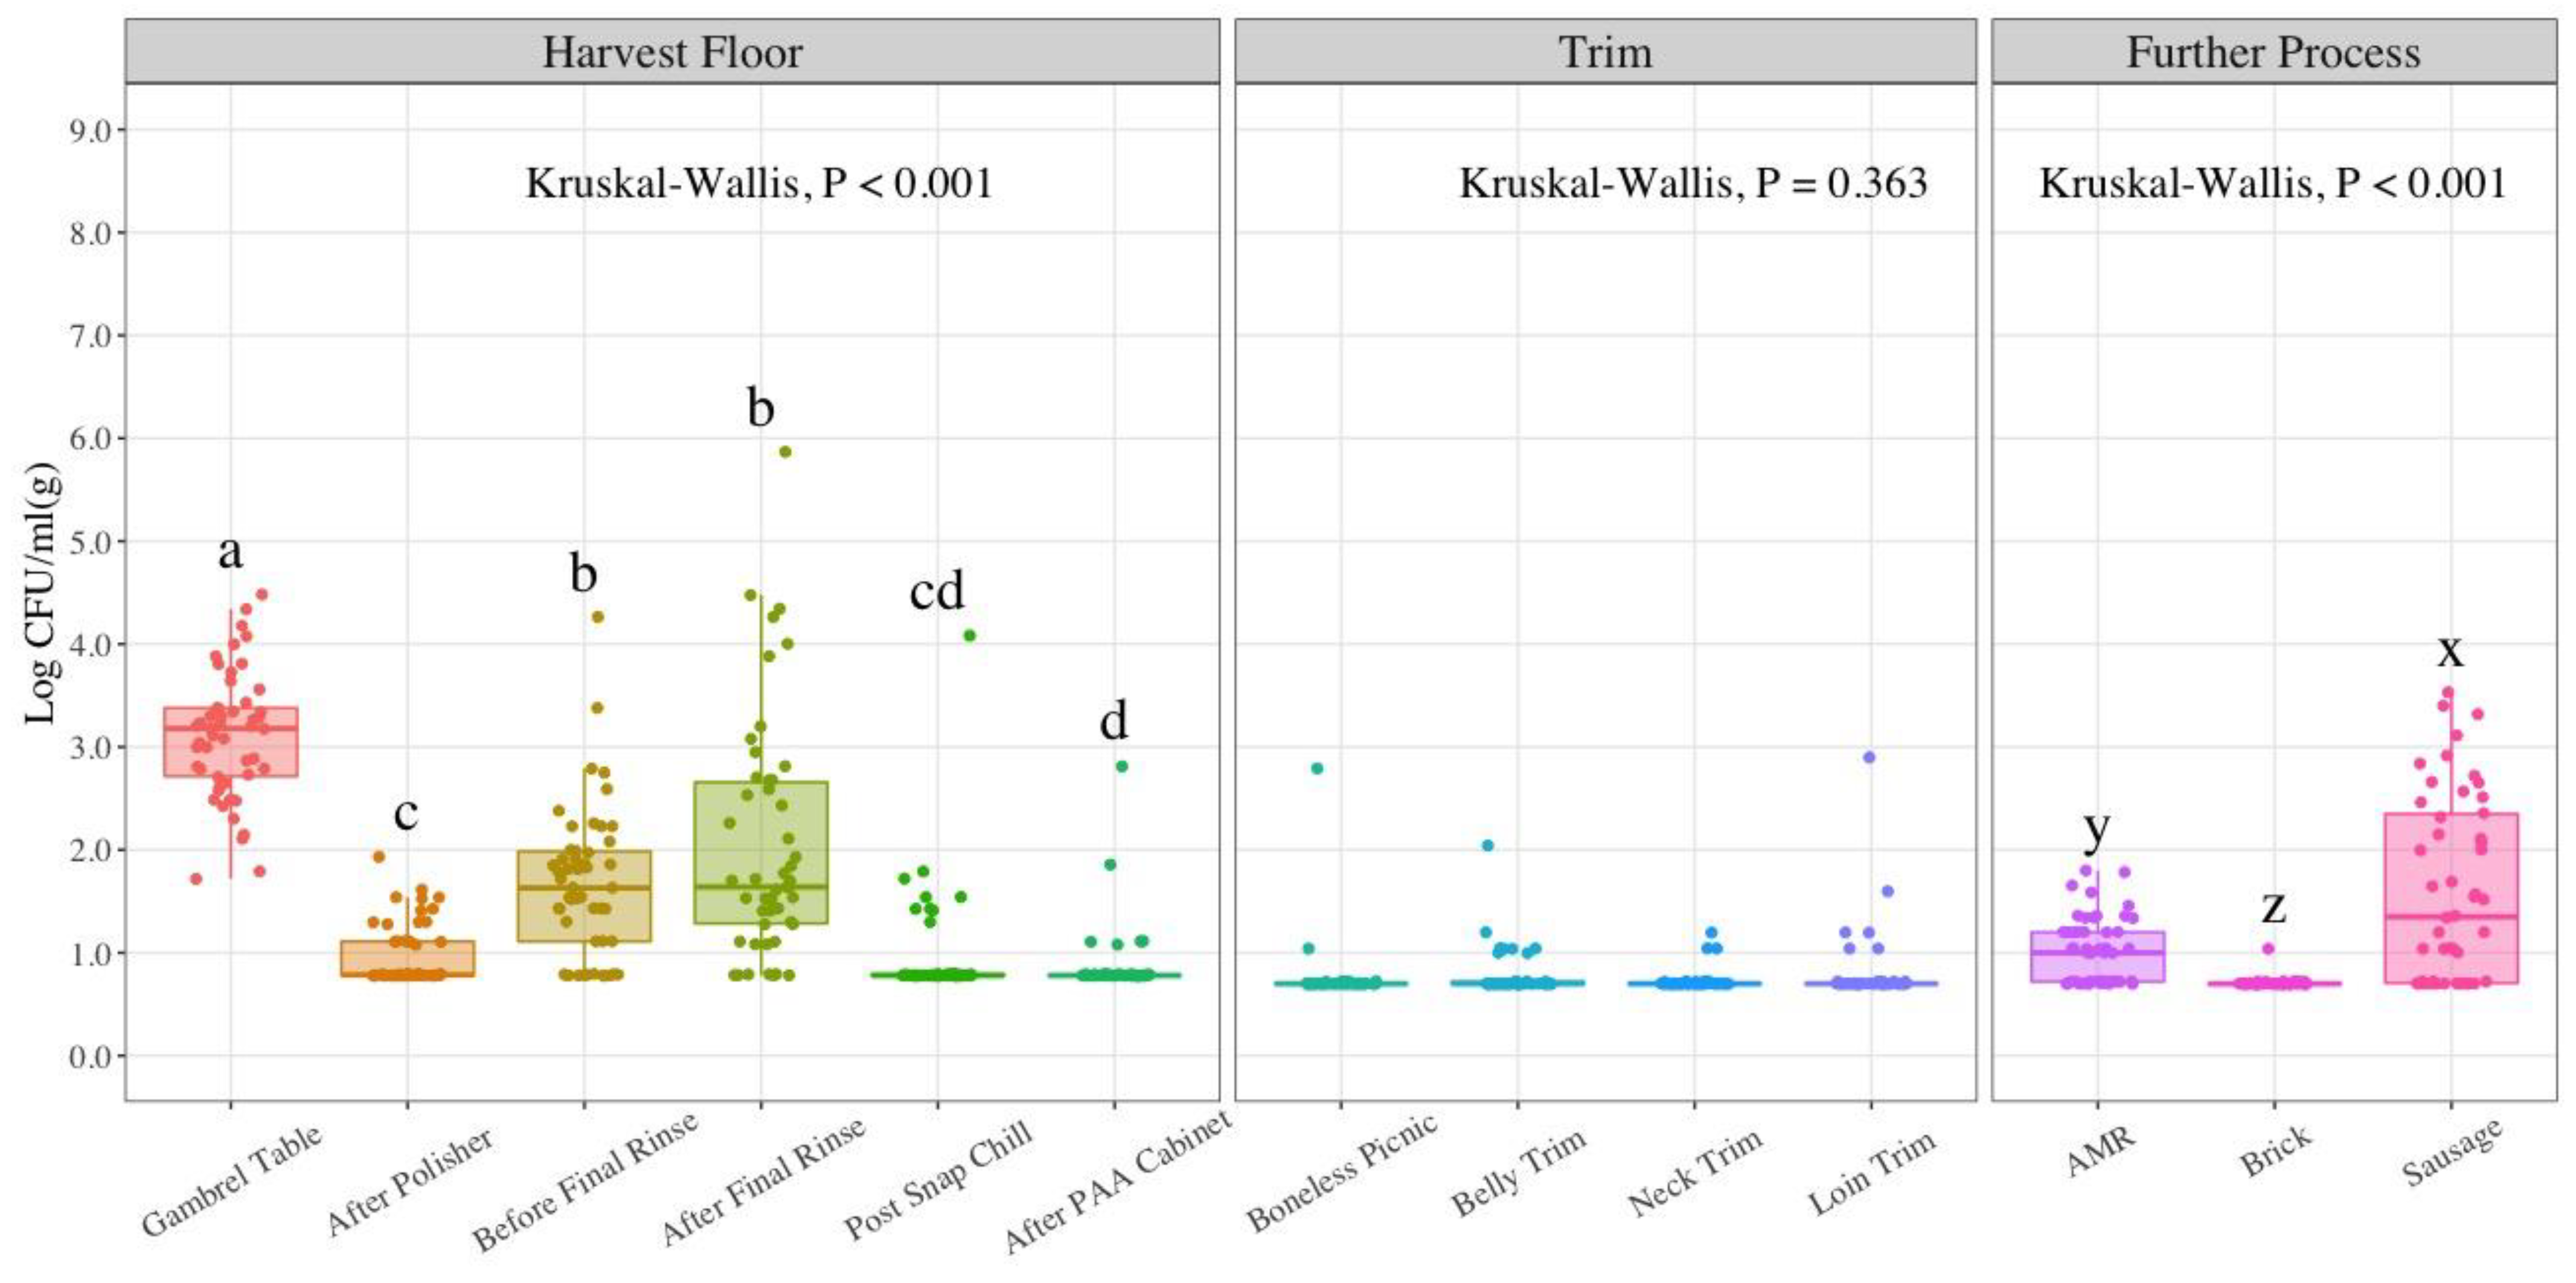
3.2. Enterobacteriaceae (EB) Counts
3.3. Generic E. coli (EC) Counts
3.4. Salmonella Detection and Enumeration
4. Discussion
4.1. Aerobic Counts (AC)
4.2. Enterobacteriaceae (EB) Counts
4.3. Generic E. coli (EC) Counts
4.4. Salmonella
5. Conclusions
Author Contributions
Funding
Institutional Review Board Statement
Informed Consent Statement
Data Availability Statement
Acknowledgments
Conflicts of Interest
References
- Shahbandeh, M. Meat Consumption Worldwide from 1990 to 2021, by Meat Type. Available online: https://www.statista.com/statistics/274522/global-per-capita-consumption-of-meat/ (accessed on 21 March 2022).
- Shahbandeh, M.U.S. Total Pork Production from 2000 to 2020 (in Million Pounds). Available online: https://www.statista.com/statistics/194696/us-total-pork-production-since-2000/ (accessed on 21 March 2022).
- Shahbandeh, M. Per Capita Consumption of Pork in the United States from 2015 to 2031 (in Pounds). Available online: https://www.statista.com/statistics/183616/per-capita-consumption-of-pork-in-the-us-since-2000/ (accessed on 21 March 2022).
- National Pork Producers Council Pork Facts. Available online: https://nppc.org/pork-facts/ (accessed on 21 March 2022).
- United States Department of Agriculture. Foreign Agricultural Service Pork 2020 Export Highlights. Available online: https://www.fas.usda.gov/pork-2020-export-highlights (accessed on 21 March 2022).
- Christen, C. Top Pork Producing States: Who Is the Largest Pork Producer in the U.S.? Available online: https://sentientmedia.org/top-pork-producing-states/ (accessed on 21 March 2022).
- Scallan, E.; Hoekstra, R.M.; Angulo, F.J.; Tauxe, R.v.; Widdowson, M.-A.; Roy, S.L.; Jones, J.L.; Griffin, P.M. Foodborne Illness Acquired in the United States—Major Pathogens. Emerg. Infect. Dis. 2011, 17, 7–15. [Google Scholar] [CrossRef] [PubMed]
- Hoffmann, S.; Maculloch, B.; Batz, M. Economic Burden of Major Foodborne Illnesses Acquired in the United States; Economic Information Bulletin Number 140; United States Department of Agriculture—Economic Research Service: Washington, DC, USA, 2015.
- Interagency Food Safety Analytics Collaboration. Foodborne Illness Source Attribution Estimates for 2019 for Salmonella, Escherichia Coli O157, Listeria Monocytogenes, and Campylobacter Using Multi-Year Outbreak Surveillance Data, United States; U.S. Department of Health and Human Services Centers for Disease Control and Prevention: Atlanta, GA, USA; U.S. Food and Drug Administration: Silver Spring, MD, USA; U.S. Department of Agriculture Food Safety and Inspection Service: Washington, DC, USA, 2021.
- United States Department of Agriculture. Title 9—Chapter III, Subchapter E, Part 417 Hazard Analysis and Critical Control Point (HACCP) Systems; Food Safety and Inspection Service: Washington, DC, USA, 1996.
- United States Department of Agriculture. The Nationwide Microbiological Baseline Data Collection Program: Market Hogs Survey August 2010–August 2011; Food Safety and Inspection Service: Washington, DC, USA, 2011.
- United States Department of Agriculture. Roadmap to Reducing Salmonella: Driving Change through Science-Based Policy; Food Safety and Inspection Service: Washington, DC, USA, 2020.
- United States Department of Agriculture. Changes to the Salmonella Verification Testing Program: Proposed Performance Standards for Salmonella in Raw Comminuted Pork and Intact or Non-Intact Pork Cuts and Related Agency Verification Procedures; Food Safety and Inspection Service: Washington, DC, USA, 2022.
- United States Department of Agriculture. Food Safety and Inspection Service Raw Pork Products Exploratory Sampling Program. Available online: https://www.fsis.usda.gov/science-data/sampling-program/raw-pork-products-exploratory-sampling-program (accessed on 3 April 2022).
- United States Department of Agriculture. Food Safety and Inspection Service HACCP-Based-Inspection Models Project. Available online: https://www.fsis.usda.gov/inspection/compliance-guidance/haacp/haccp-based-inspection-models-project (accessed on 3 April 2022).
- United States Department of Agriculture. Evaluation of HACCP Inspection Models Project (HIMP) for Market Hogs; Food Safety and Inspection Service: Washington, DC, USA, 2014.
- United States Department of Agriculture. Modernization of Swine Slaughter Inspection; Food Safety and Inspection Service: Washington, DC, USA, 2019.
- United States Department of Agriculture. USDA Modernizes Swine Slaughter Inspection for the First Time in Over 50 Years; Food Safety and Inspection Service: Washington, DC, USA, 2019.
- Jolley, C. What’s behind the New Swine Slaughter Inspection System. Available online: https://www.foodsafetynews.com/2020/01/whats-behind-the-new-swine-slaughter-inspection-system/ (accessed on 3 April 2022).
- United States Department of Agriculture. FSIS Nationwide Market Hogs Microbiological Baseline: Data Collection Program—Study Design for Technical Consultation; Food Safety and Inspection Service: Washington, DC, USA, 2011.
- Swanenburg, M.; Urlings, H.A.P.; Snijders, J.M.A.; Keuzenkamp, D.A.; van Knapen, F. Salmonella in Slaughter Pigs: Prevalence, Serotypes and Critical Control Points during Slaughter in Two Slaughterhouses. Int. J. Food Microbiol. 2001, 70, 243–254. [Google Scholar] [CrossRef]
- United States Department of Agriculture. Food Safety Inspection Service FSIS Notice 65–20 Raw Pork Products Sampling Program. Available online: https://www.fsis.usda.gov/sites/default/files/media_file/2021-03/65-20.pdf (accessed on 3 April 2022).
- Haynes, W. Benjamini–Hochberg Method. In Encyclopedia of Systems Biology; Springer New York: New York, NY, USA, 2013; p. 78. [Google Scholar]
- Cheremisinoff, N.P. Shewhart Control Chart. In Condensed Encyclopedia of Polymer Engineering Terms; Elsevier: Amsterdam, The Netherlands, 2001; pp. 268–300. [Google Scholar]
- Navidi, W. Statistics for Engineers and Scientists—Chapter 10: Statistical Quality Control, 3rd ed.; McGraw-Hill: New York, NY, USA, 2011. [Google Scholar]
- Jarvis, B. Statistical Aspects of the Microbiological Examination of Foods, 3rd ed.; Elsevier: London, UK, 2016. [Google Scholar]
- Vargas, D.A.; Rodríguez, K.M.; Betancourt-Barszcz, G.K.; Ajcet-Reyes, M.I.; Dogan, O.B.; Randazzo, E.; Sánchez-Plata, M.X.; Brashears, M.M.; Miller, M.F. Bio-Mapping of Microbial Indicators to Establish Statistical Process Control Parameters in a Commercial Beef Processing Facility. Foods 2022, 11, 1133. [Google Scholar] [CrossRef] [PubMed]
- Casas, D.E.; Vargas, D.A.; Randazzo, E.; Lynn, D.; Echeverry, A.; Brashears, M.M.; Sanchez-Plata, M.X.; Miller, M.F. In-Plant Validation of Novel On-Site Ozone Generation Technology (Bio-Safe) Compared to Lactic Acid Beef Carcasses and Trim Using Natural Microbiota and Salmonella and E. Coli O157:H7 Surrogate Enumeration. Foods 2021, 10, 1002. [Google Scholar] [CrossRef] [PubMed]
- Vargas, D.A.; Casas, D.E.; Chávez-Velado, D.R.; Jiménez, R.L.; Betancourt-Barszcz, G.K.; Randazzo, E.; Lynn, D.; Echeverry, A.; Brashears, M.M.; Sánchez-Plata, M.X.; et al. In-Plant Intervention Validation of a Novel Ozone Generation Technology (Bio-Safe) Compared to Lactic Acid in Variety Meats. Foods 2021, 10, 2106. [Google Scholar] [CrossRef] [PubMed]
- de Villena, J.F.; Vargas, D.A.; Bueno López, R.; Chávez-Velado, D.R.; Casas, D.E.; Jiménez, R.L.; Sanchez-Plata, M.X. Bio-Mapping Indicators and Pathogen Loads in a Commercial Broiler Processing Facility Operating with High and Low Antimicrobial Intervention Levels. Foods 2022, 11, 775. [Google Scholar] [CrossRef] [PubMed]
- United States Department of Agriculture. Compliance Guideline for Controlling Salmonella in Market Hogs; Food Safety and Inspection Service: Washington, DC, USA, 2013.
- D’Aoust, J.-Y.; Maurer, J.; Bailey, J.S. Salmonella Species. In Food Microbiology: Fundamentals and Frontiers; Doyle, M.P., Beuchat, L.R., Montville, T.J., Eds.; ASM Press: Washington, DC USA, 2001; pp. 141–178. [Google Scholar]
- Forsythe, S.T. The Microbiology of Safe Food; Blackwell Science: Oxford, UK, 2000. [Google Scholar]
- Bourassa, D.V.; Lapidus, J.L.; Kennedy-Smith, A.E.; Morey, A. Efficacy of Neutralizing Buffered Peptone Water for Recovery of Salmonella, Campylobacter, and Enterobacteriaceae from Broiler Carcasses at Various Points along a Commercial Immersion Chilling Process with Peroxyacetic Acid. Poult. Sci. 2019, 98, 393–397. [Google Scholar] [CrossRef]
- Handley, J.A.; Park, S.H.; Kim, S.A.; Ricke, S.C. Microbiome Profiles of Commercial Broilers Through Evisceration and Immersion Chilling During Poultry Slaughter and the Identification of Potential Indicator Microorganisms. Front. Microbiol. 2018, 9, 345. [Google Scholar] [CrossRef]
- Blevins, R.E.; Kim, S.A.; Park, S.H.; Rivera, R.; Ricke, S.C. Historical, Current, and Future Prospects for Food Safety in Poultry Product Processing Systems. In Food and Feed Safety Systems and Analysis; Elsevier: Amsterdam, The Netherlands, 2018; pp. 323–345. [Google Scholar]
- United States Department of Agriculture. Sampling Requirements to Demonstrate Process Control in Slaughter Operations; Food Safety and Inspection Service: Washington, DC, USA, 2020.
- Hong, C.-H.; Todd, E.C.D.; Bahk, G.-J. Aerobic Plate Counts as a Measure of Hazard Analysis Critical Control Point Effectiveness in a Pork Processing Plant. J. Food Prot. 2008, 71, 1248–1252. [Google Scholar] [CrossRef]
- Warriner, K.; Aldsworth, T.G.; Kaur, S.; Dodd, C.E.R. Cross-Contamination of Carcasses and Equipment during Pork Processing. J. Appl. Microbiol. 2002, 93, 169–177. [Google Scholar] [CrossRef]
- Pearce, R.A.; Bolton, D.J.; Sheridan, J.J.; McDowell, D.A.; Blair, I.S.; Harrington, D. Studies to Determine the Critical Control Points in Pork Slaughter Hazard Analysis and Critical Control Point Systems. Int. J. Food Microbiol. 2004, 90, 331–339. [Google Scholar] [CrossRef]
- Visciano, P.; Schirone, M.; Olivastri, A.M.A.; Verdecchia, E.; Paparella, A. Levels of Microbial Contamination of Swine Carcasses along the Slaughtering Process Line. J. Consum. Prot. Food Saf. 2020, 15, 271–276. [Google Scholar] [CrossRef]
- Spescha, C.; Stephan, R.; Zweifel, C. Microbiological Contamination of Pig Carcasses at Different Stages of Slaughter in Two European Union–Approved Abattoirs. J. Food Prot. 2006, 69, 2568–2575. [Google Scholar] [CrossRef]
- van Ba, H.; Seo, H.-W.; Seong, P.-N.; Kang, S.-M.; Cho, S.-H.; Kim, Y.-S.; Park, B.-Y.; Moon, S.-S.; Kang, S.-J.; Choi, Y.-M.; et al. The Fates of Microbial Populations on Pig Carcasses during Slaughtering Process, on Retail Cuts after Slaughter, and Intervention Efficiency of Lactic Acid Spraying. Int. J. Food Microbiol. 2019, 294, 10–17. [Google Scholar] [CrossRef]
- Duffy, E.A.; Belk, K.E.; Sofos, J.N.; Bellinger, G.R.; Pape, A.; Smith, G.C. Extent of Microbial Contamination in United States Pork Retail Products. J. Food Prot. 2001, 64, 172–178. [Google Scholar] [CrossRef]
- Duggan, S.J.; Mannion, C.; Prendergast, D.M.; Leonard, N.; Fanning, S.; Gonzales-Barron, U.; Egan, J.; Butler, F.; Duffy, G. Tracking the Salmonella Status of Pigs and Pork from Lairage through the Slaughter Process in the Republic of Ireland. J. Food Prot. 2010, 73, 2148–2160. [Google Scholar] [CrossRef]
- Chang, V.P.; Mills, E.W.; Cutter, C.N. Reduction of Bacteria on Pork Carcasses Associated with Chilling Method. J. Food Prot. 2003, 66, 1019–1024. [Google Scholar] [CrossRef]
- Lenahan, M.; Crowley, H.; O’Brien, S.B.; Byrne, C.; Sweeney, T.; Sheridan, J.J. The Potential Use of Chilling to Control the Growth of Enterobacteriaceae on Porcine Carcasses and the Incidence of E. coli O157:H7 in Pigs. J. Appl. Microbiol. 2009, 106, 1512–1520. [Google Scholar] [CrossRef]
- Barco, L.; Belluco, S.; Roccato, A.; Ricci, A. Escherichia coli and Enterobacteriaceae Counts on Pig and Ruminant Carcasses along the Slaughterline, Factors Influencing the Counts and Relationship between Visual Faecal Contamination of Carcasses and Counts: A Review; EFSA: Parma, Italy, 2014. [Google Scholar]
- Corbellini, L.G.; Júnior, A.B.; de Freitas Costa, E.; Duarte, A.S.R.; Albuquerque, E.R.; Kich, J.D.; Cardoso, M.; Nauta, M. Effect of Slaughterhouse and Day of Sample on the Probability of a Pig Carcass Being Salmonella-Positive According to the Enterobacteriaceae Count in the Largest Brazilian Pork Production Region. Int. J. Food Microbiol. 2016, 228, 58–66. [Google Scholar] [CrossRef]
- Namvar, A.; Warriner, K. Application of Enterobacterial Repetitive Intergenic Consensus–Polymerase Chain Reaction to Trace the Fate of Generic Escherichia coli within a High Capacity Pork Slaughter Line. Int. J. Food Microbiol. 2006, 108, 155–163. [Google Scholar] [CrossRef]
- Belluco, S.; Barco, L.; Roccato, A.; Ricci, A. Variability of Escherichia coli and Enterobacteriaceae Counts on Pig Carcasses: A Systematic Review. Food Control 2015, 55, 115–126. [Google Scholar] [CrossRef]
- Gill, C.O.; Landers, C. Proximate Sources of Bacteria on Boneless Loins Prepared from Routinely Processed and Detained Carcasses at a Pork Packing Plant. Int. J. Food Microbiol. 2004, 97, 171–178. [Google Scholar] [CrossRef] [PubMed]
- Nesbakken, T.; Eckner, K.; Røtterud, O.-J. The Effect of Blast Chilling on Occurrence of Human Pathogenic Yersinia Enterocolitica Compared to Campylobacter spp. and Numbers of Hygienic Indicators on Pig Carcasses. Int. J. Food Microbiol. 2008, 123, 130–133. [Google Scholar] [CrossRef]
- Broadway, P.R.; Brooks, J.C.; Mollenkopf, D.F.; Calle, M.A.; Loneragan, G.H.; Miller, M.F.; Carroll, J.A.; Sanchez, N.C.B.; Wittum, T.E. Prevalence and Antimicrobial Susceptibility of Salmonella Serovars Isolated from U.S. Retail Ground Pork. Foodborne Pathog. Dis. 2021, 18, 219–227. [Google Scholar] [CrossRef] [PubMed]
- Algino, R.J.; Badtram, G.A.; Ingham, B.H.; Ingham, S.C. Factors Associated with Salmonella Prevalence on Pork Carcasses in Very Small Abattoirs in Wisconsin. J. Food Prot. 2009, 72, 714–721. [Google Scholar] [CrossRef]
- Barron, U.; Soumpasis, I.; Butler, F.; Prendergast, D.; Duggan, S.; Duffy, G. Estimation of Prevalence of Salmonella on Pig Carcasses and Pork Joints, Using a Quantitative Risk Assessment Model Aided by Meta-Analysis. J. Food Prot. 2009, 72, 274–285. [Google Scholar] [CrossRef] [PubMed]
- Botteldoorn, N.; Heyndrickx, M.; Rijpens, N.; Grijspeerdt, K.; Herman, L. Salmonella on Pig Carcasses: Positive Pigs and Cross Contamination in the Slaughterhouse. J. Appl. Microbiol. 2003, 95, 891–903. [Google Scholar] [CrossRef][Green Version]
- Tamplin, M.L.; Feder, I.; Palumbo, S.A.; Oser, A.; Yoder, L.; Luchansky, J.B. Salmonella spp. and Escherichia coli Biotype I on Swine Carcasses Processed under the Hazard Analysis and Critical Control Point–Based Inspection Models Project. J. Food Prot. 2001, 64, 1305–1308. [Google Scholar] [CrossRef]
- Weissman, M.A.; Carpenter, J.A. Incidence of Salmonellae in Meat and Meat Products. Appl. Microbiol. 1969, 17, 899–902. [Google Scholar] [CrossRef]
- Côté, S.; Letellier, A.; Lessard, L.; Quessy, S. Distribution of Salmonella in Tissues Following Natural and Experimental Infection in Pigs. Can. J. Vet. Res. Rev. Can. De Rech. Vet. 2004, 68, 241–248. [Google Scholar]
- Møller, C.O.A.; Nauta, M.J.; Christensen, B.B.; Dalgaard, P.; Hansen, T.B. Modelling Transfer of Salmonella Typhimurium DT104 during Simulation of Grinding of Pork. J. Appl. Microbiol. 2012, 112, 90–98. [Google Scholar] [CrossRef] [PubMed]


| Sampling Location | Processing Stage | Log CFU/mL(g) LCL 1 | Log CFU/mL(g) UCL 2 | |
|---|---|---|---|---|
| Gambrel Table | Harvest | 5.69 ± 0.77 a | 4.60 | 6.78 |
| After Polisher | Harvest | 4.45 ± 1.35 b | 2.52 | 6.38 |
| Before Final Rinse | Harvest | 4.05 ± 1.07 b | 2.53 | 5.57 |
| After Final Rinse | Harvest | 4.52 ± 0.99 b | 3.11 | 5.93 |
| Post Snap Chill | Harvest | 2.92 ± 1.20 c | 1.20 | 4.64 |
| After PAA 3 Cabinet | Harvest | 3.42 ± 0.96 c | 2.05 | 4.79 |
| Boneless Picnic | Trim | 2.51 ± 0.77 | 1.41 | 3.61 |
| Belly Trim | Trim | 2.55 ± 0.62 | 1.67 | 3.43 |
| Neck Trim | Trim | 2.83 ± 0.58 | 2.01 | 3.65 |
| Loin Trim | Trim | 2.80 ± 0.89 | 1.53 | 4.07 |
| AMR 4 | Further Process | 3.86 ± 0.63 y | 2.97 | 4.75 |
| Brick | Further Process | 3.11 ± 0.50 z | 2.39 | 3.83 |
| Sausage | Further Process | 5.28 ± 1.58 x | 3.02 | 7.54 |
| Sampling Location | Processing Stage | Log CFU/mL(g) LCL 1 | Log CFU/mL(g) UCL 2 | |
|---|---|---|---|---|
| Gambrel Table | Harvest | 3.55 ± 0.77 a | 2.46 | 4.64 |
| After Polisher | Harvest | 1.84 ± 1.05 c | 0.35 | 3.33 |
| Before Final Rinse | Harvest | 2.21 ± 0.91 b | 0.91 | 3.51 |
| After Final Rinse | Harvest | 2.47 ± 0.99 b | 1.06 | 3.88 |
| Post Snap Chill | Harvest | 1.15 ± 0.85 d | 0.00 | 2.36 |
| After PAA 3 Cabinet | Harvest | 1.09 ± 0.64 d | 0.17 | 2.01 |
| Boneless Picnic | Trim | 0.97 ± 0.50 | 0.26 | 1.68 |
| Belly Trim | Trim | 0.93 ± 0.38 | 0.39 | 1.47 |
| Neck Trim | Trim | 0.93 ± 0.39 | 0.37 | 1.49 |
| Loin Trim | Trim | 1.08 ± 0.50 | 0.37 | 1.79 |
| AMR 4 | Further Process | 2.60 ± 0.70 x | 1.60 | 3.60 |
| Brick | Further Process | 1.27 ± 0.60 y | 0.41 | 2.13 |
| Sausage | Further Process | 3.19 ± 1.80 x | 0.62 | 5.76 |
| Sampling Location | Processing Stage | Log CFU/mL(g) LCL 1 | Log CFU/mL(g) UCL 2 | |
|---|---|---|---|---|
| Gambrel Table | Harvest | 3.11 ± 0.62 a | 2.23 | 3.99 |
| After Polisher | Harvest | 0.98 ± 0.30 c | 0.55 | 1.41 |
| Before Final Rinse | Harvest | 1.67 ± 0.72 b | 0.64 | 2.70 |
| After Final Rinse | Harvest | 2.03 ± 1.14 b | 0.40 | 3.66 |
| Post Snap Chill | Harvest | 0.97 ± 0.53 d | 0.21 | 1.73 |
| After PAA 3 Cabinet | Harvest | 0.87 ± 0.33 d | 0.40 | 1.34 |
| Boneless Picnic | Trim | 0.75 ± 0.30 | 0.32 | 1.18 |
| Belly Trim | Trim | 0.78 ± 0.22 | 0.47 | 1.09 |
| Neck Trim | Trim | 0.73 ± 0.10 | 0.59 | 0.87 |
| Loin Trim | Trim | 0.80 ± 0.35 | 0.30 | 1.30 |
| AMR 4 | Further Process | 1.01 ± 0.32 y | 0.55 | 1.47 |
| Brick | Further Process | 0.71 ± 0.05 z | 0.64 | 0.78 |
| Sausage | Further Process | 1.60 ± 0.90 x | 0.32 | 2.88 |
| Observed SalQuant™ Result (LogCFU/50 mL) | Observed Prevalence Result | Reported SalQuant™ Result (LogCFU/50 mL) | Reported Prevalence Result |
|---|---|---|---|
| Quant Negative | Negative | 0 | Negative |
| Quant Negative | Positive | 0.35 | Positive |
| Less than 0.70 | NA 1 | 0.35 | Positive |
| More or equal than 0.70 | NA 1 | Observed SalQuant Result | Positive |
| Observed SalQuant™ Result (LogCFU/50 g) | Observed Prevalence Result | Reported SalQuant™ Result (LogCFU/50 g) | Reported Prevalence Result |
|---|---|---|---|
| Quant Negative | Negative | 0 | Negative |
| Quant Negative | Positive | 0.35 | Positive |
| Less than 0.70 | NA 1 | 0.35 | Positive |
| More or equal than 0.70 | NA 1 | Observed SalQuant Result | Positive |
| Location | Processing Stage | Prevalence % (Positive/n) |
|---|---|---|
| Gambrel Table | Harvest | 68% (34/50) |
| After Polisher | Harvest | 8% (4/50) |
| Before Final Rinse | Harvest | 18% (9/50) |
| After Final Rinse | Harvest | 32% (16/50) |
| Post Snap Chill | Harvest | 0% (0/50) |
| After PAA 1 Cabinet | Harvest | 2% (1/50) |
| Boneless Picnic | Trim | 24% (12/50) |
| Belly Trim | Trim | 8% (4/50) |
| Neck Trim | Trim | 26% (13/50) |
| Loin Trim | Trim | 0% (0/50) |
| AMR 2 | Further Process | 12% (6/50) |
| Brick | Further Process | 28% (14/50) |
| Sausage | Further Process | 24% (12/50) |
Publisher’s Note: MDPI stays neutral with regard to jurisdictional claims in published maps and institutional affiliations. |
© 2022 by the authors. Licensee MDPI, Basel, Switzerland. This article is an open access article distributed under the terms and conditions of the Creative Commons Attribution (CC BY) license (https://creativecommons.org/licenses/by/4.0/).
Share and Cite
Bueno López, R.; Vargas, D.A.; Jimenez, R.L.; Casas, D.E.; Miller, M.F.; Brashears, M.M.; Sanchez-Plata, M.X. Quantitative Bio-Mapping of Salmonella and Indicator Organisms at Different Stages in a Commercial Pork Processing Facility. Foods 2022, 11, 2580. https://doi.org/10.3390/foods11172580
Bueno López R, Vargas DA, Jimenez RL, Casas DE, Miller MF, Brashears MM, Sanchez-Plata MX. Quantitative Bio-Mapping of Salmonella and Indicator Organisms at Different Stages in a Commercial Pork Processing Facility. Foods. 2022; 11(17):2580. https://doi.org/10.3390/foods11172580
Chicago/Turabian StyleBueno López, Rossy, David A. Vargas, Reagan L. Jimenez, Diego E. Casas, Markus F. Miller, Mindy M. Brashears, and Marcos X. Sanchez-Plata. 2022. "Quantitative Bio-Mapping of Salmonella and Indicator Organisms at Different Stages in a Commercial Pork Processing Facility" Foods 11, no. 17: 2580. https://doi.org/10.3390/foods11172580
APA StyleBueno López, R., Vargas, D. A., Jimenez, R. L., Casas, D. E., Miller, M. F., Brashears, M. M., & Sanchez-Plata, M. X. (2022). Quantitative Bio-Mapping of Salmonella and Indicator Organisms at Different Stages in a Commercial Pork Processing Facility. Foods, 11(17), 2580. https://doi.org/10.3390/foods11172580