
Characterization of Extracts of Coffee Leaves (Coffea arabica L.) by Spectroscopic and Chromatographic/Spectrometric Techniques

 , ,
, ,  ,
,  , ,
, ,  , and
, and
Abstract
:1. Introduction
2. Materials and Methods
2.1. Chemicals and Reagents
2.2. Plant Material Collection, Pre-Treatment and Extraction
2.3. Nuclear Magnetic Resonance (NMR) Experiments
2.4. Chromatographic Conditions
2.5. HPLC-MSn Methodology for Qualitative and Quantitative Analysis of the Extracts
3. Results and Discussion
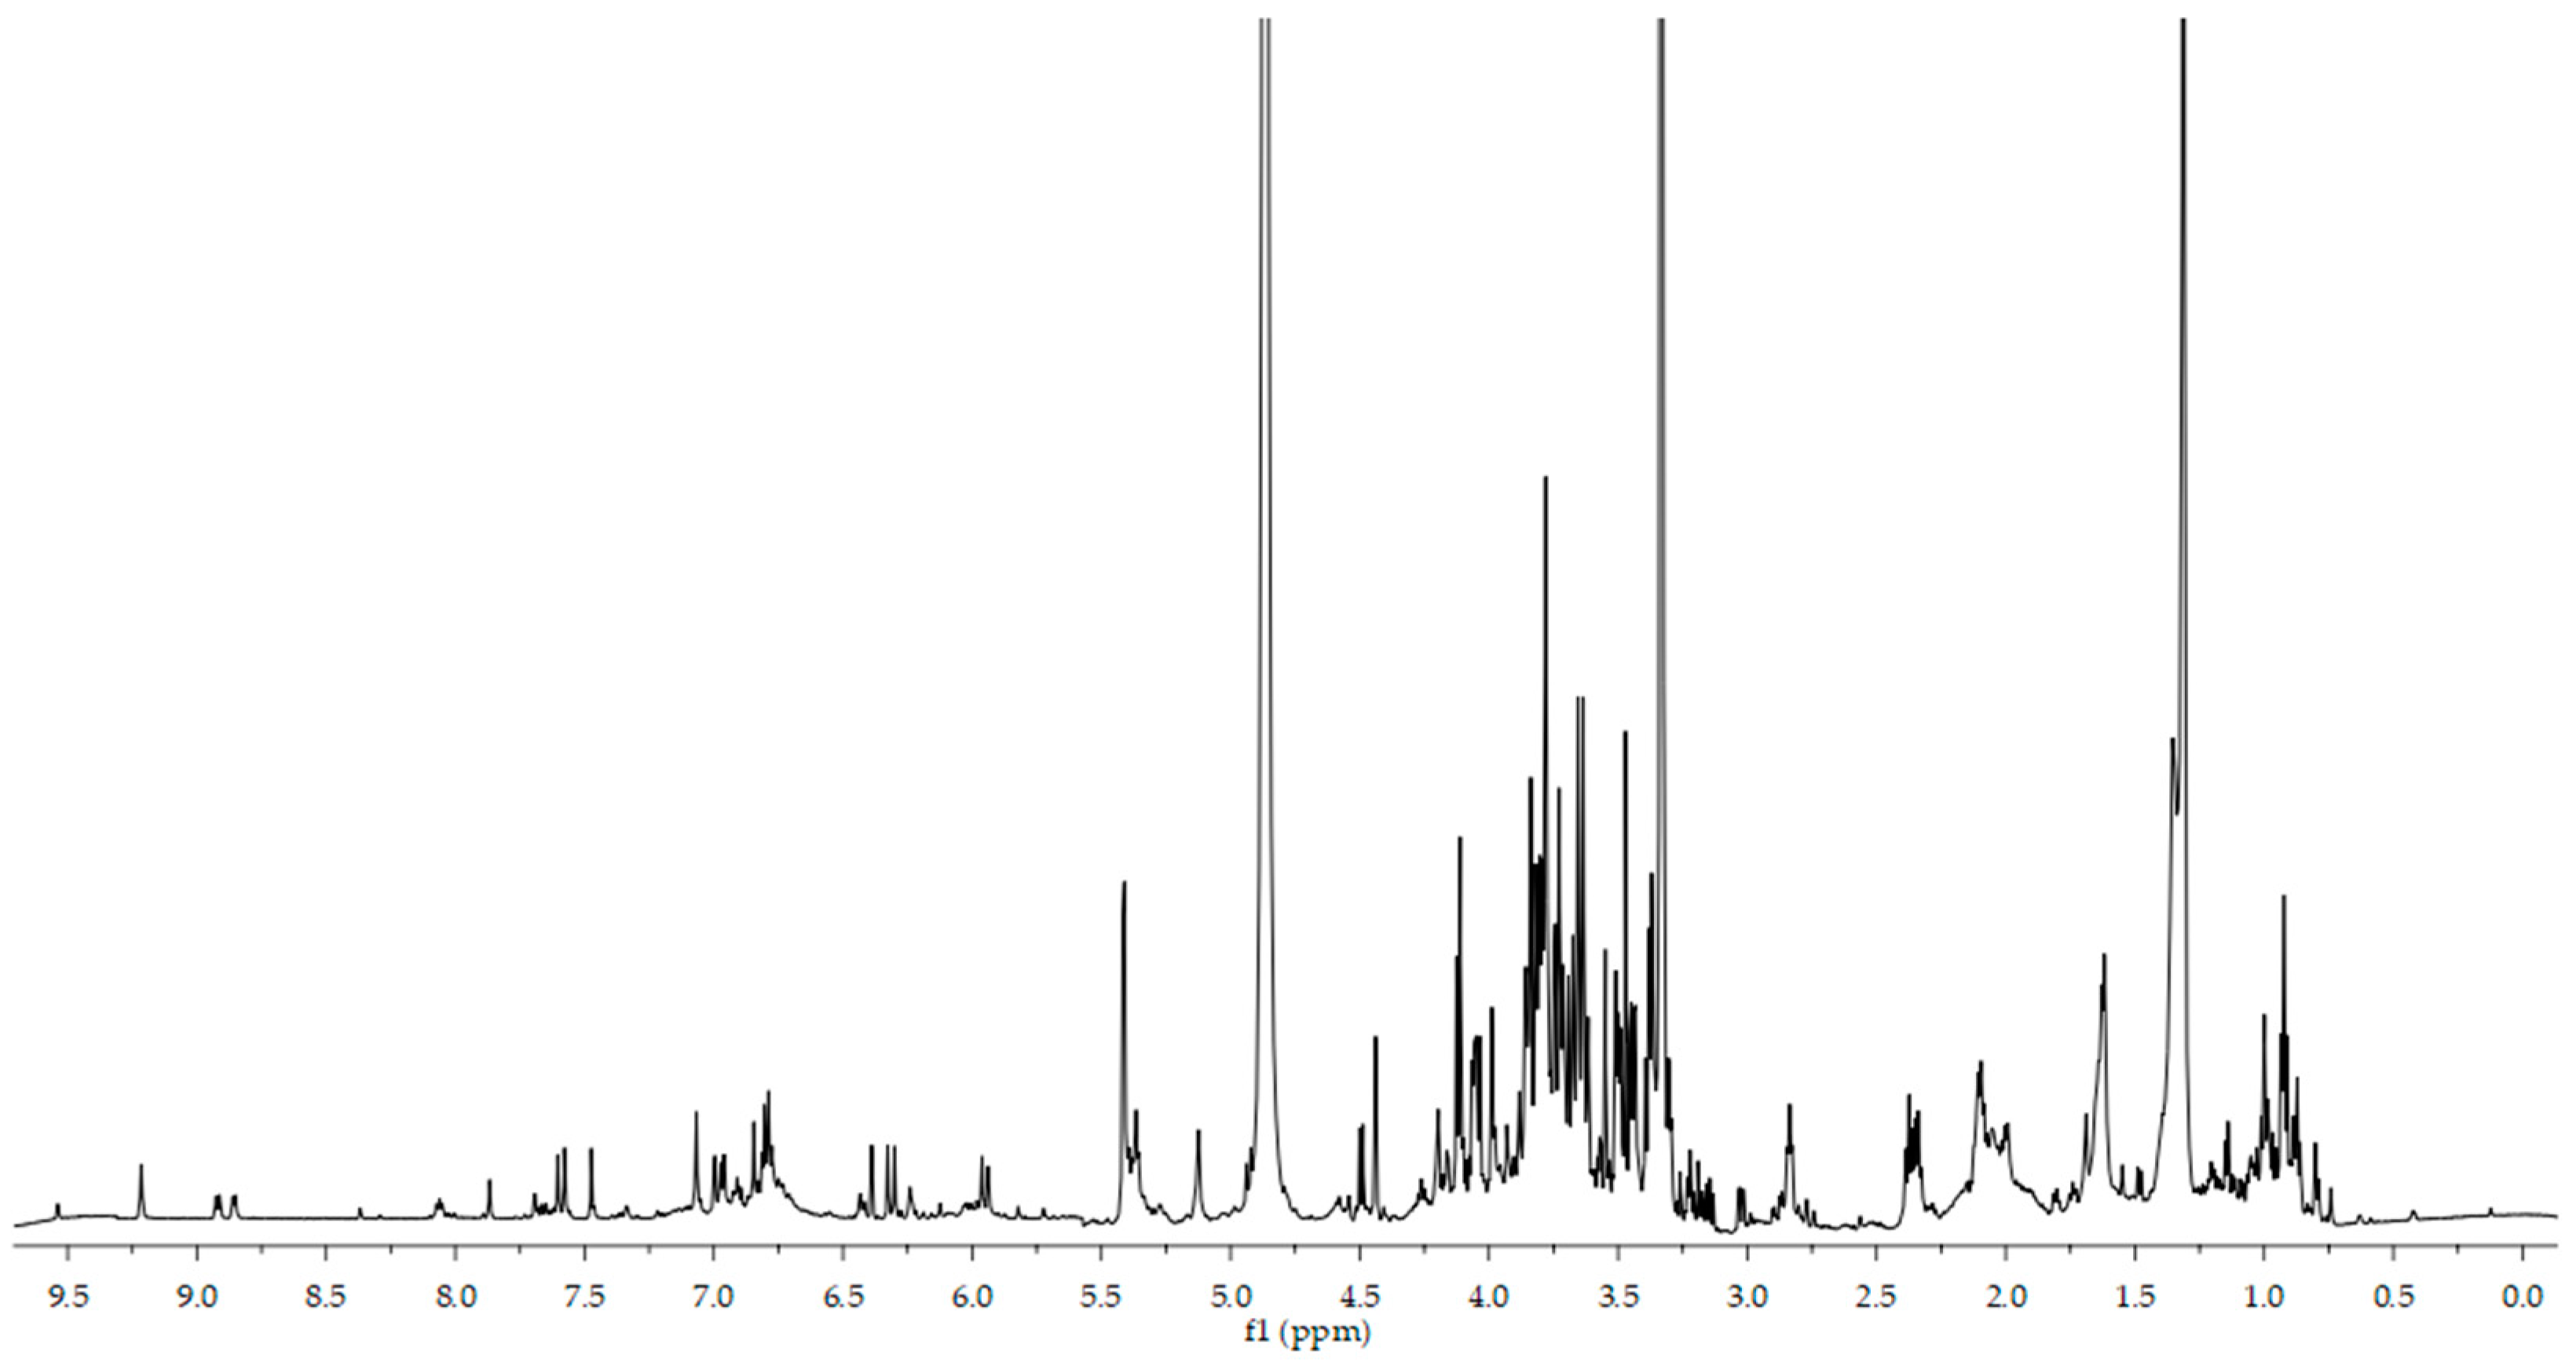
3.1. 1H NMR Analysis of Coffea Arabica Leaves Extract
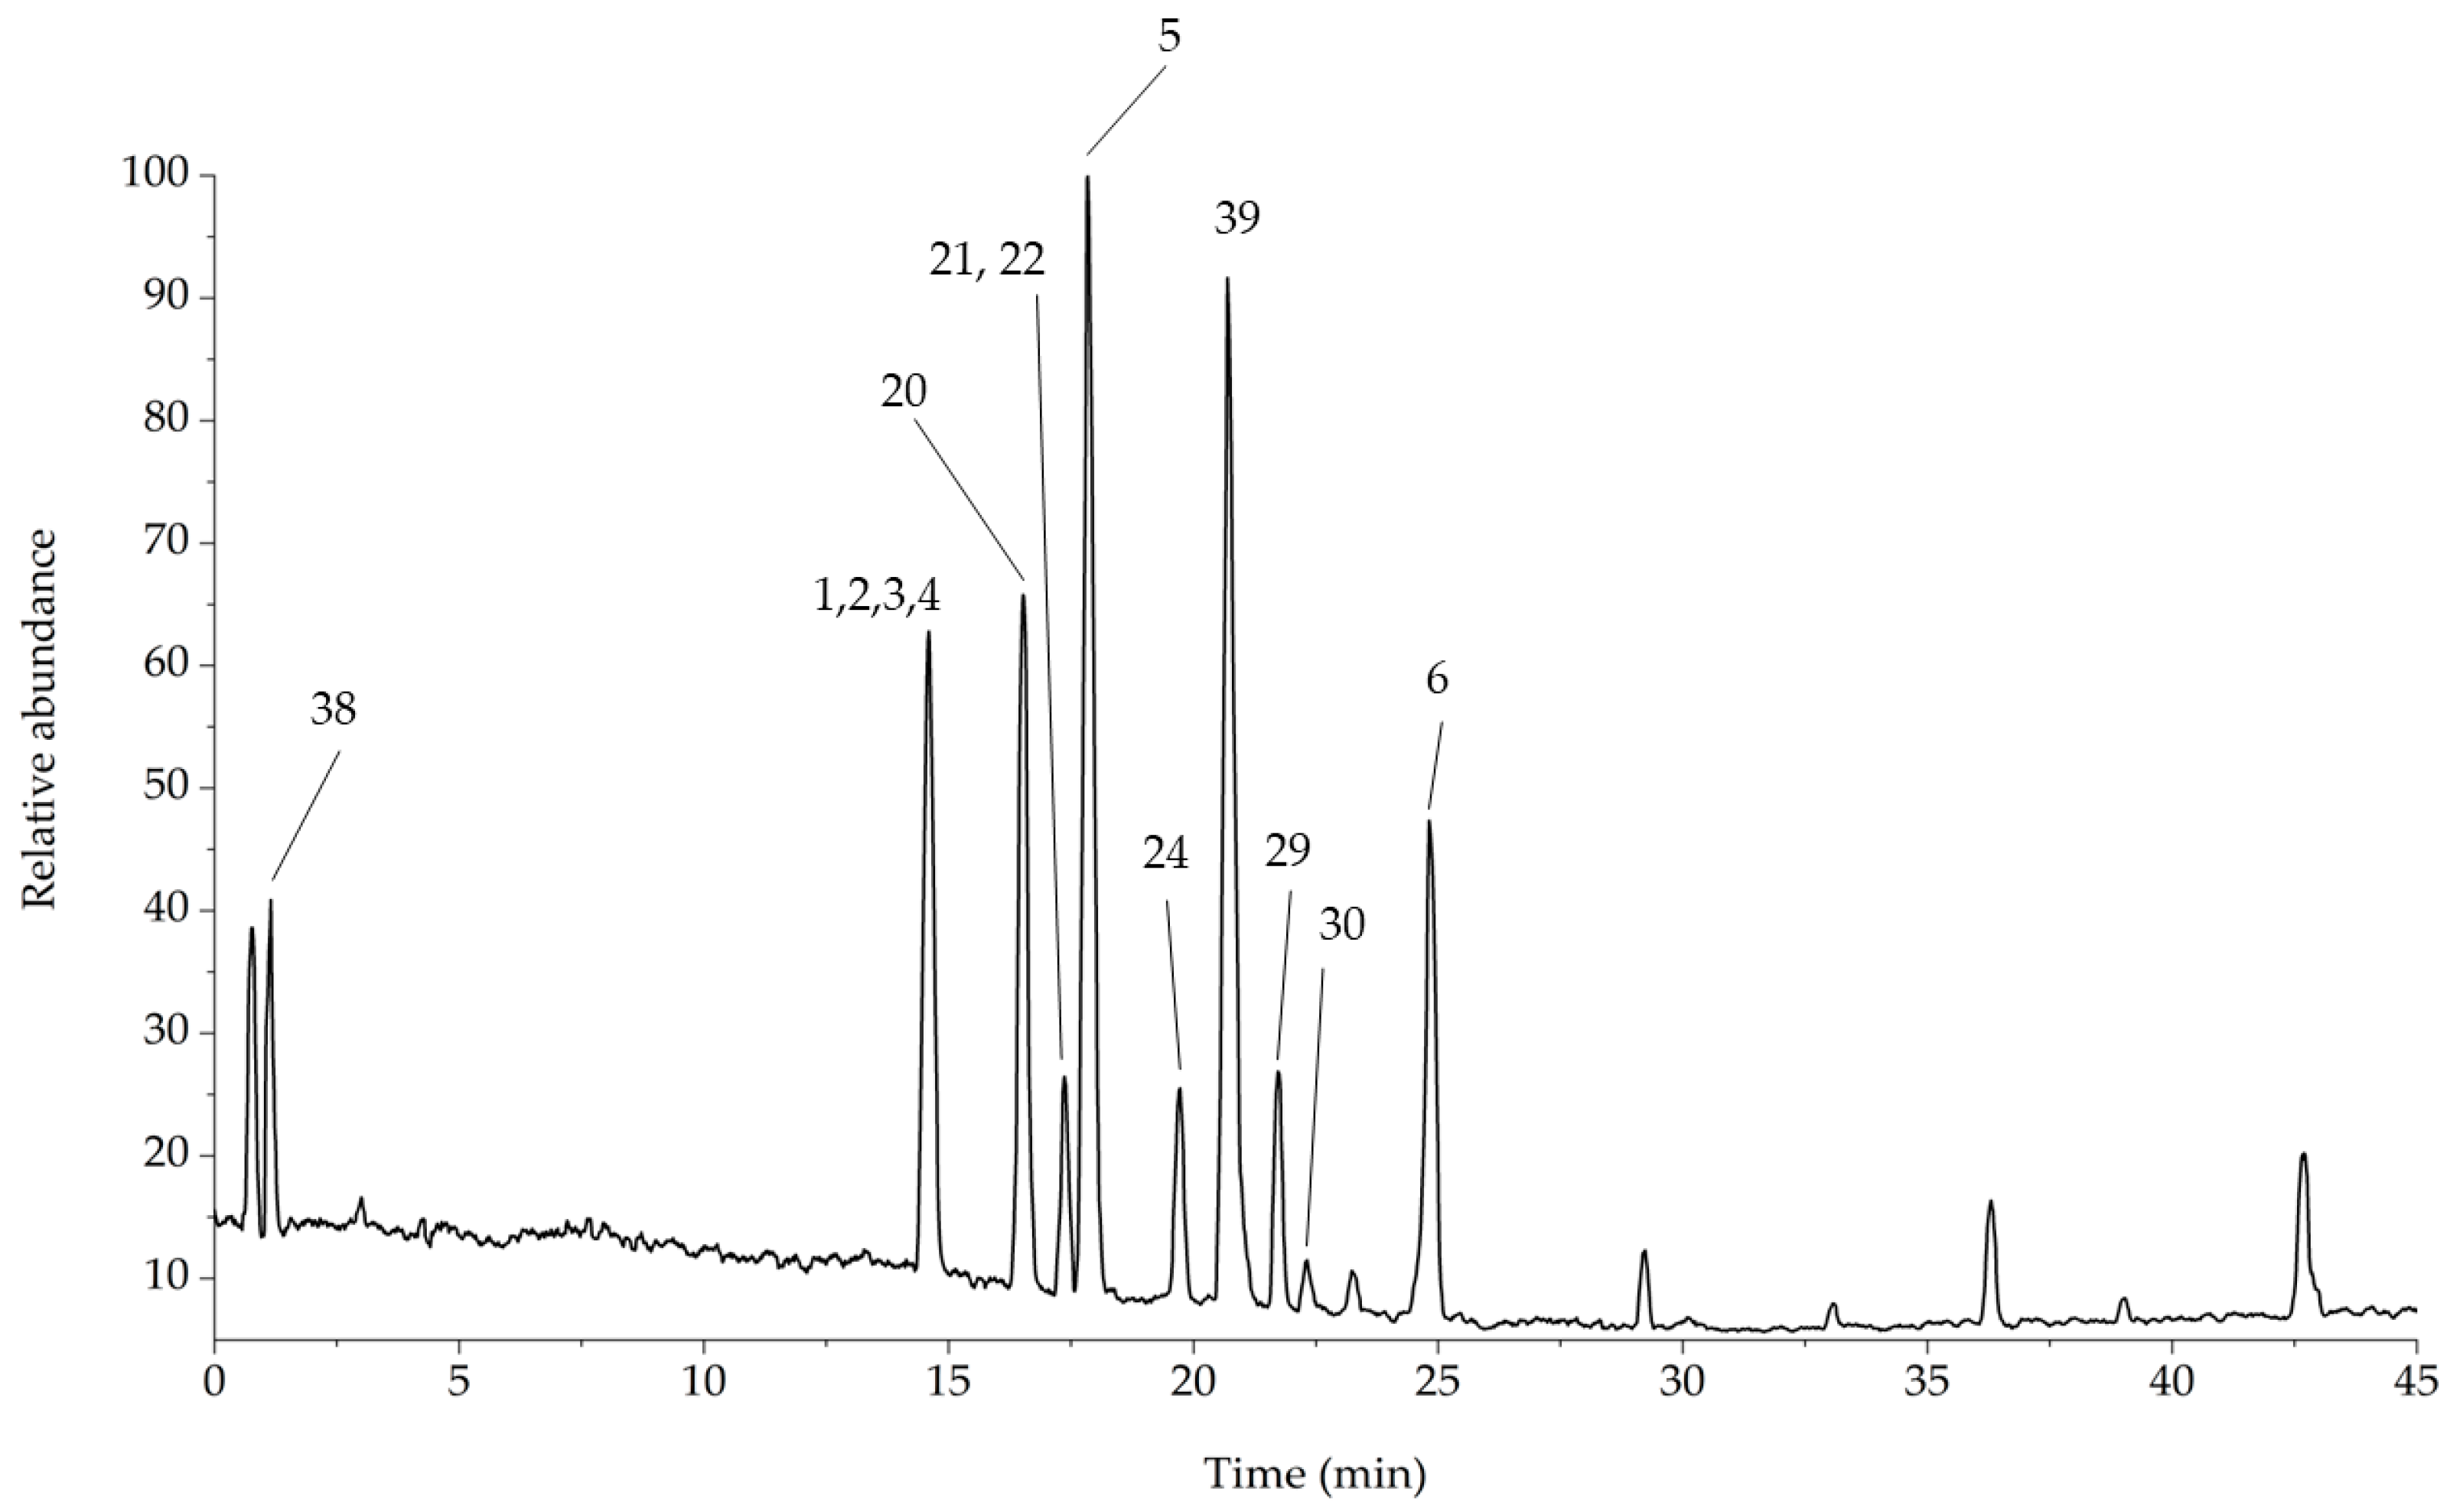
3.2. HPLC-ESI(−)-MSn Profiling of Coffea Arabica Leaf Extract
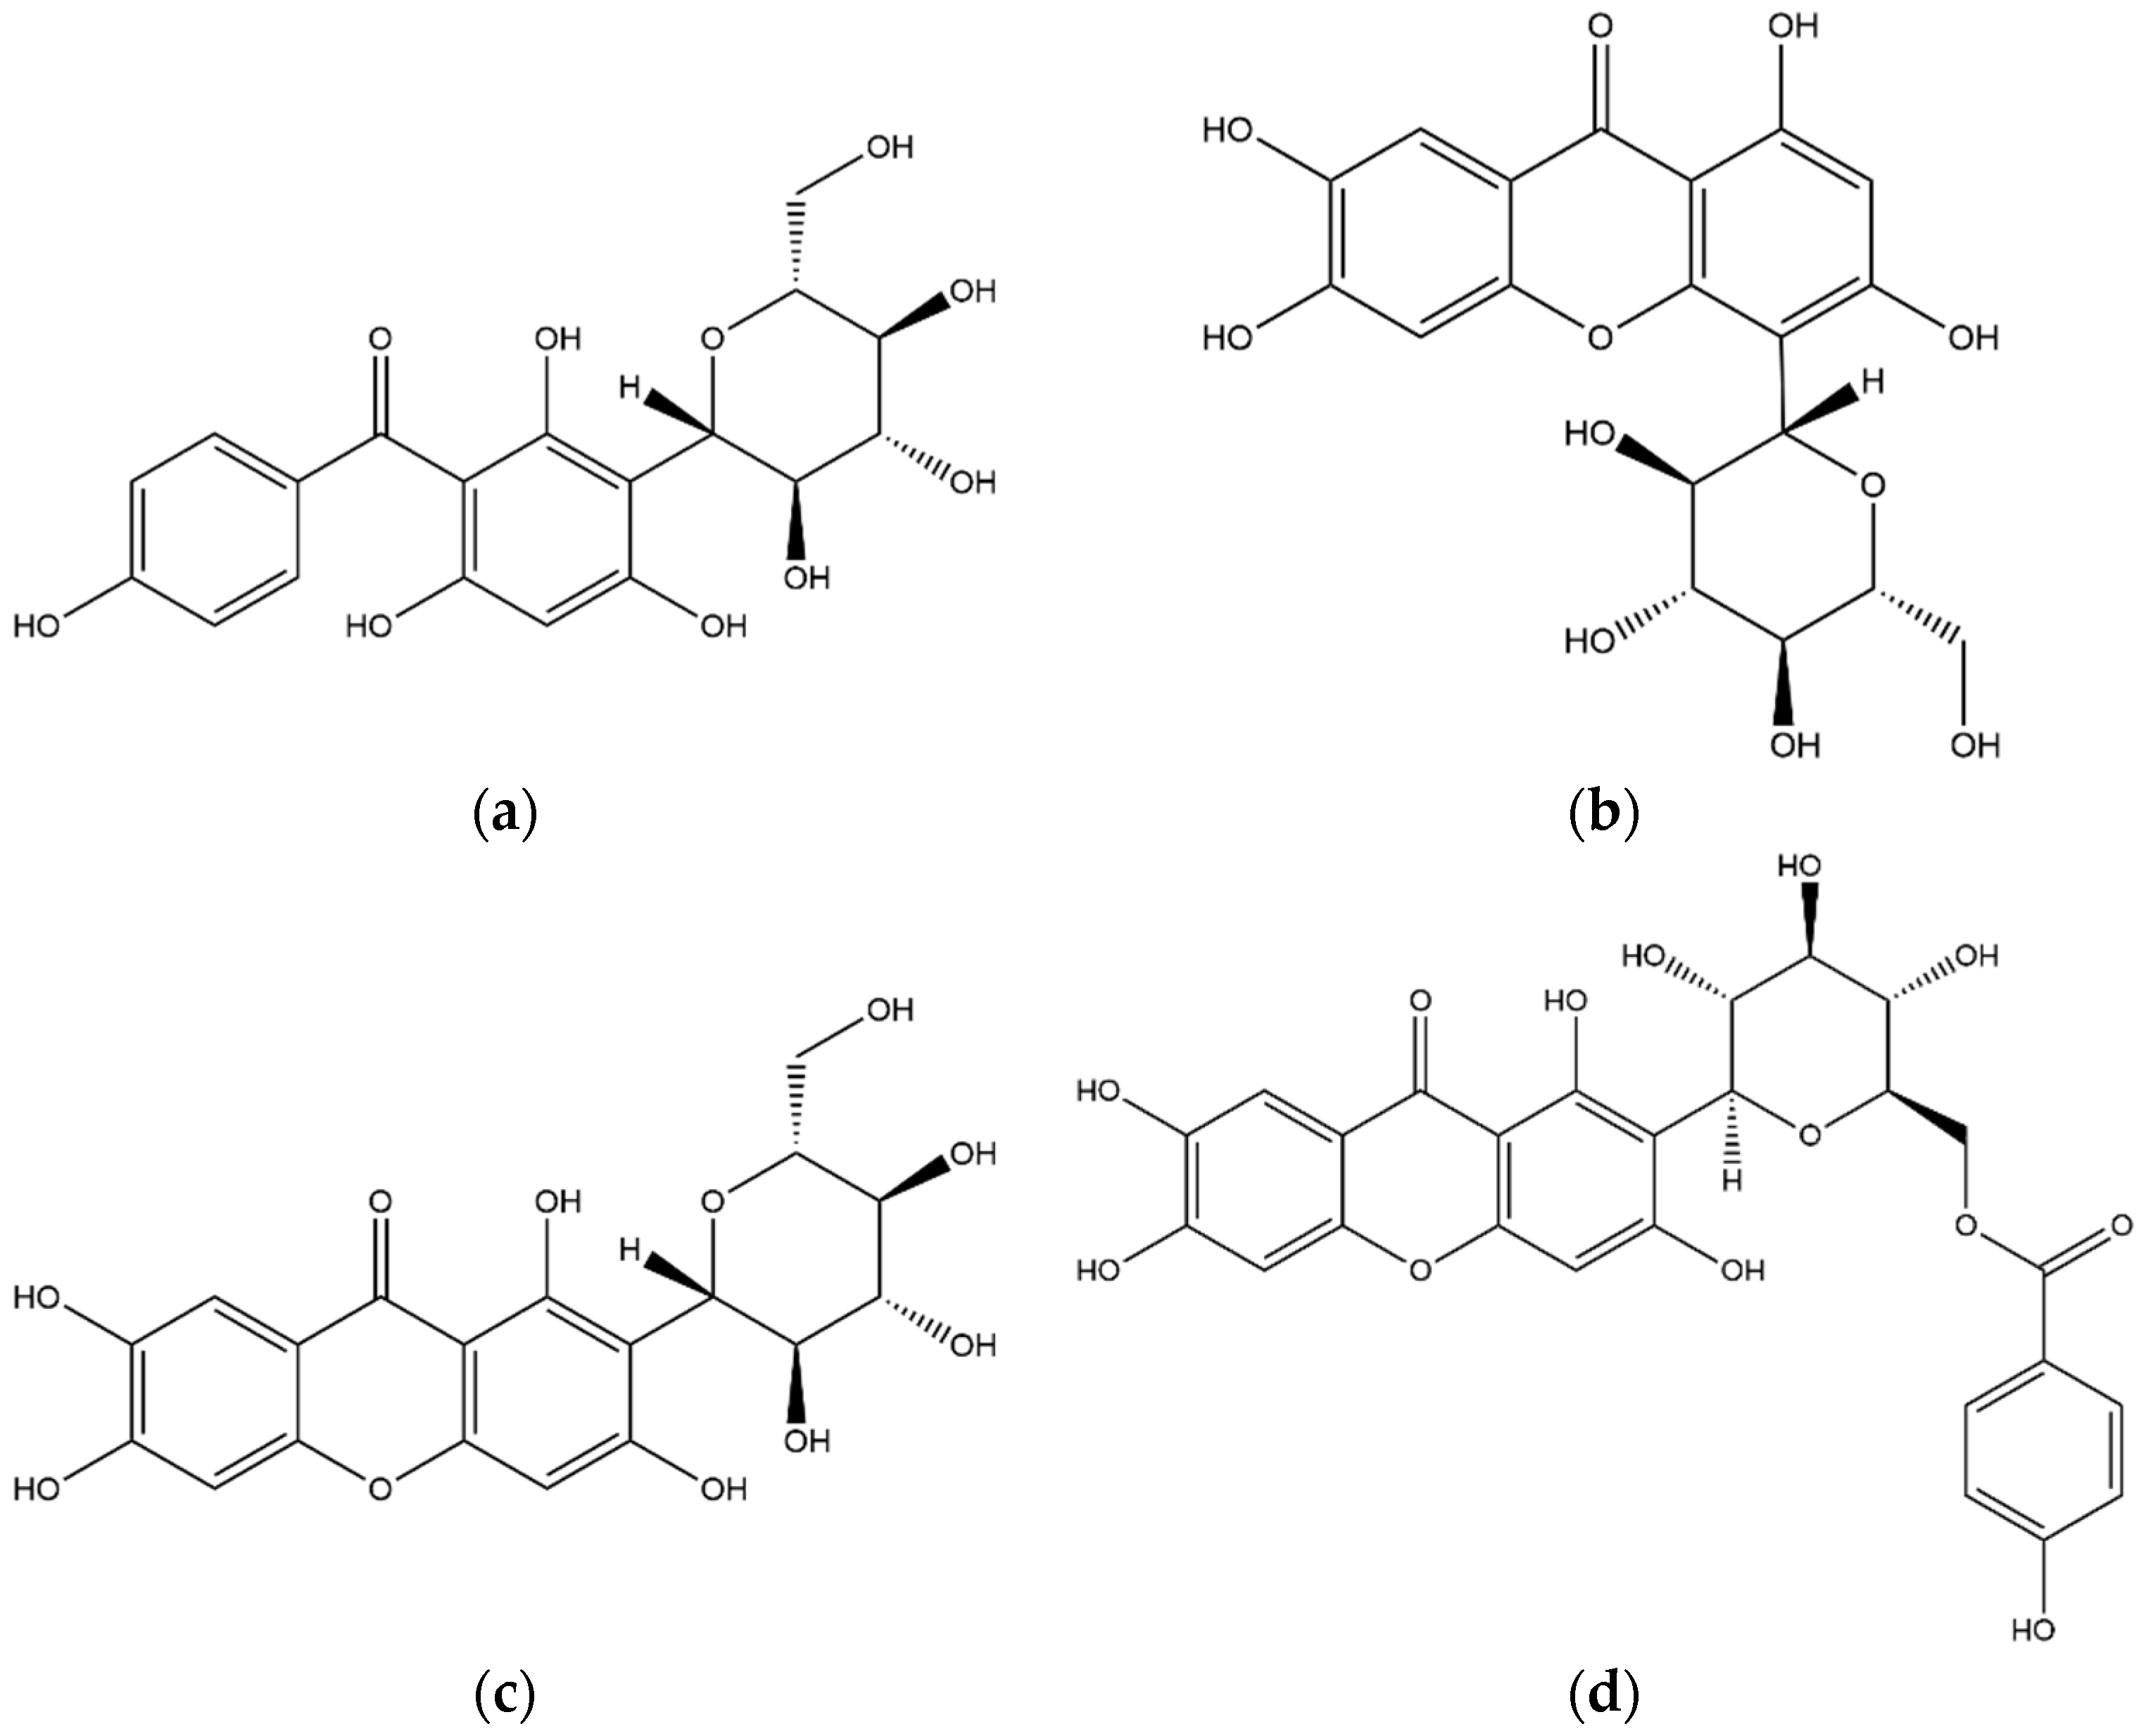
3.2.1. Xanthones
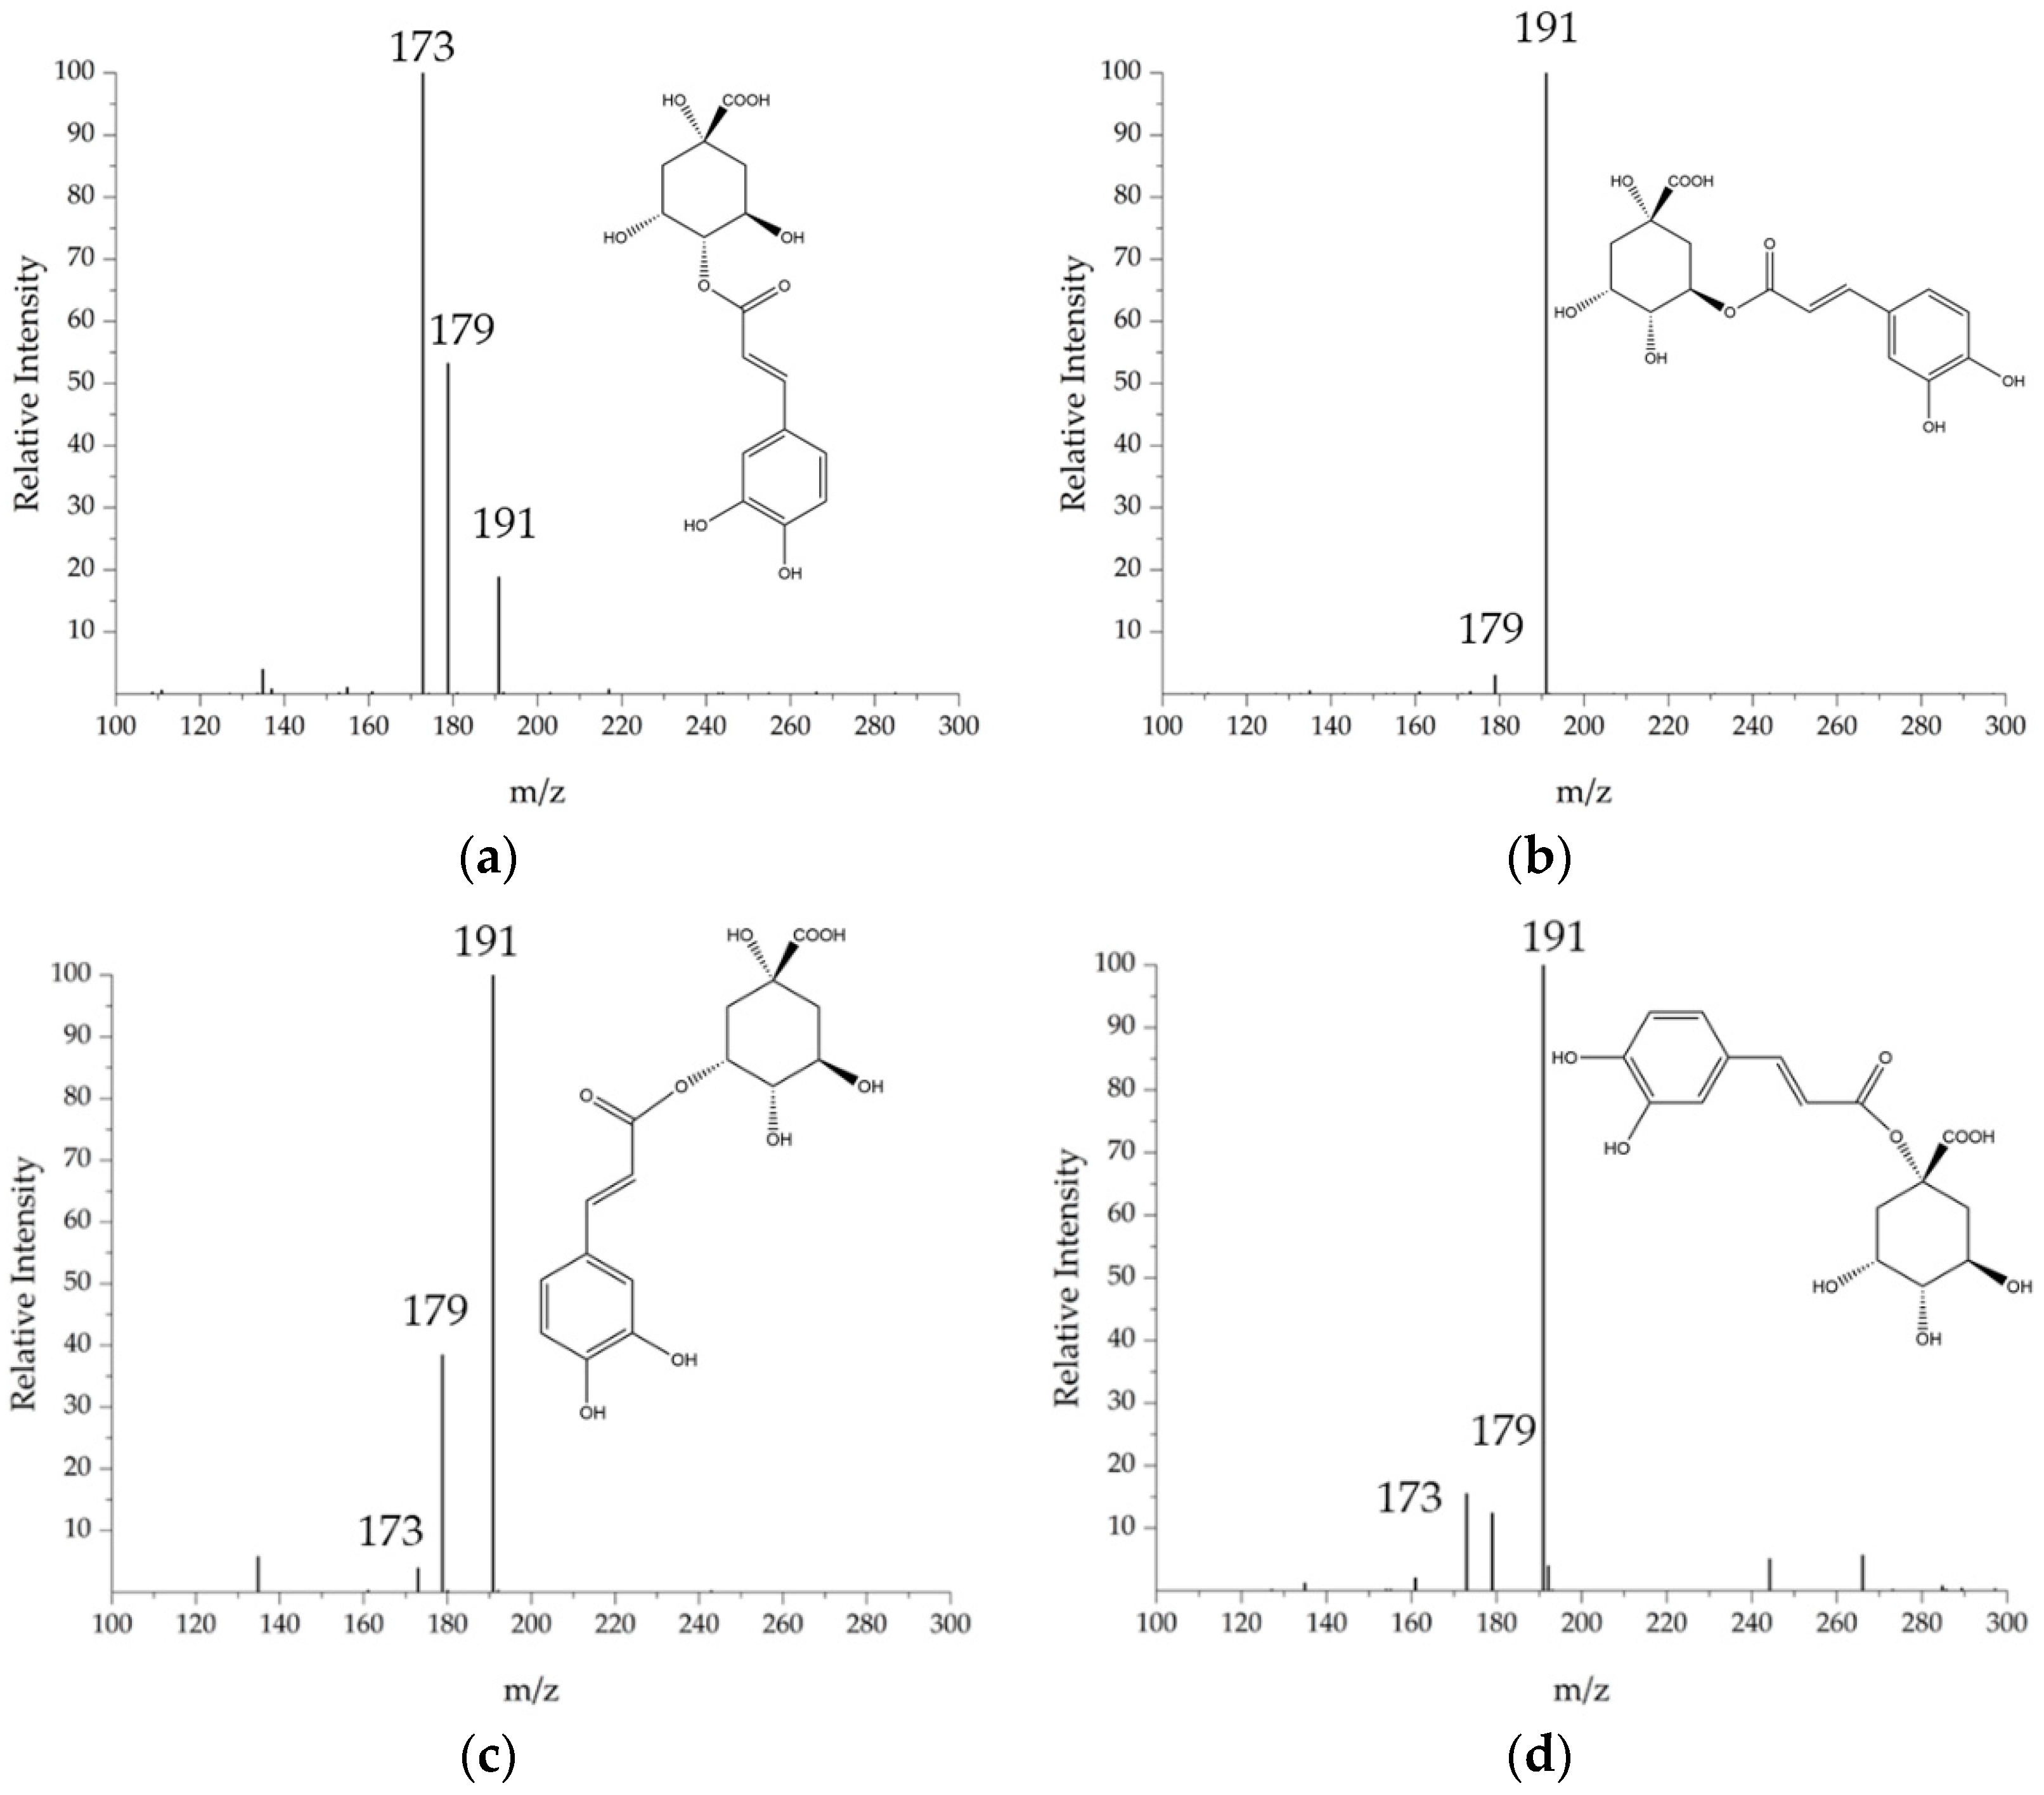
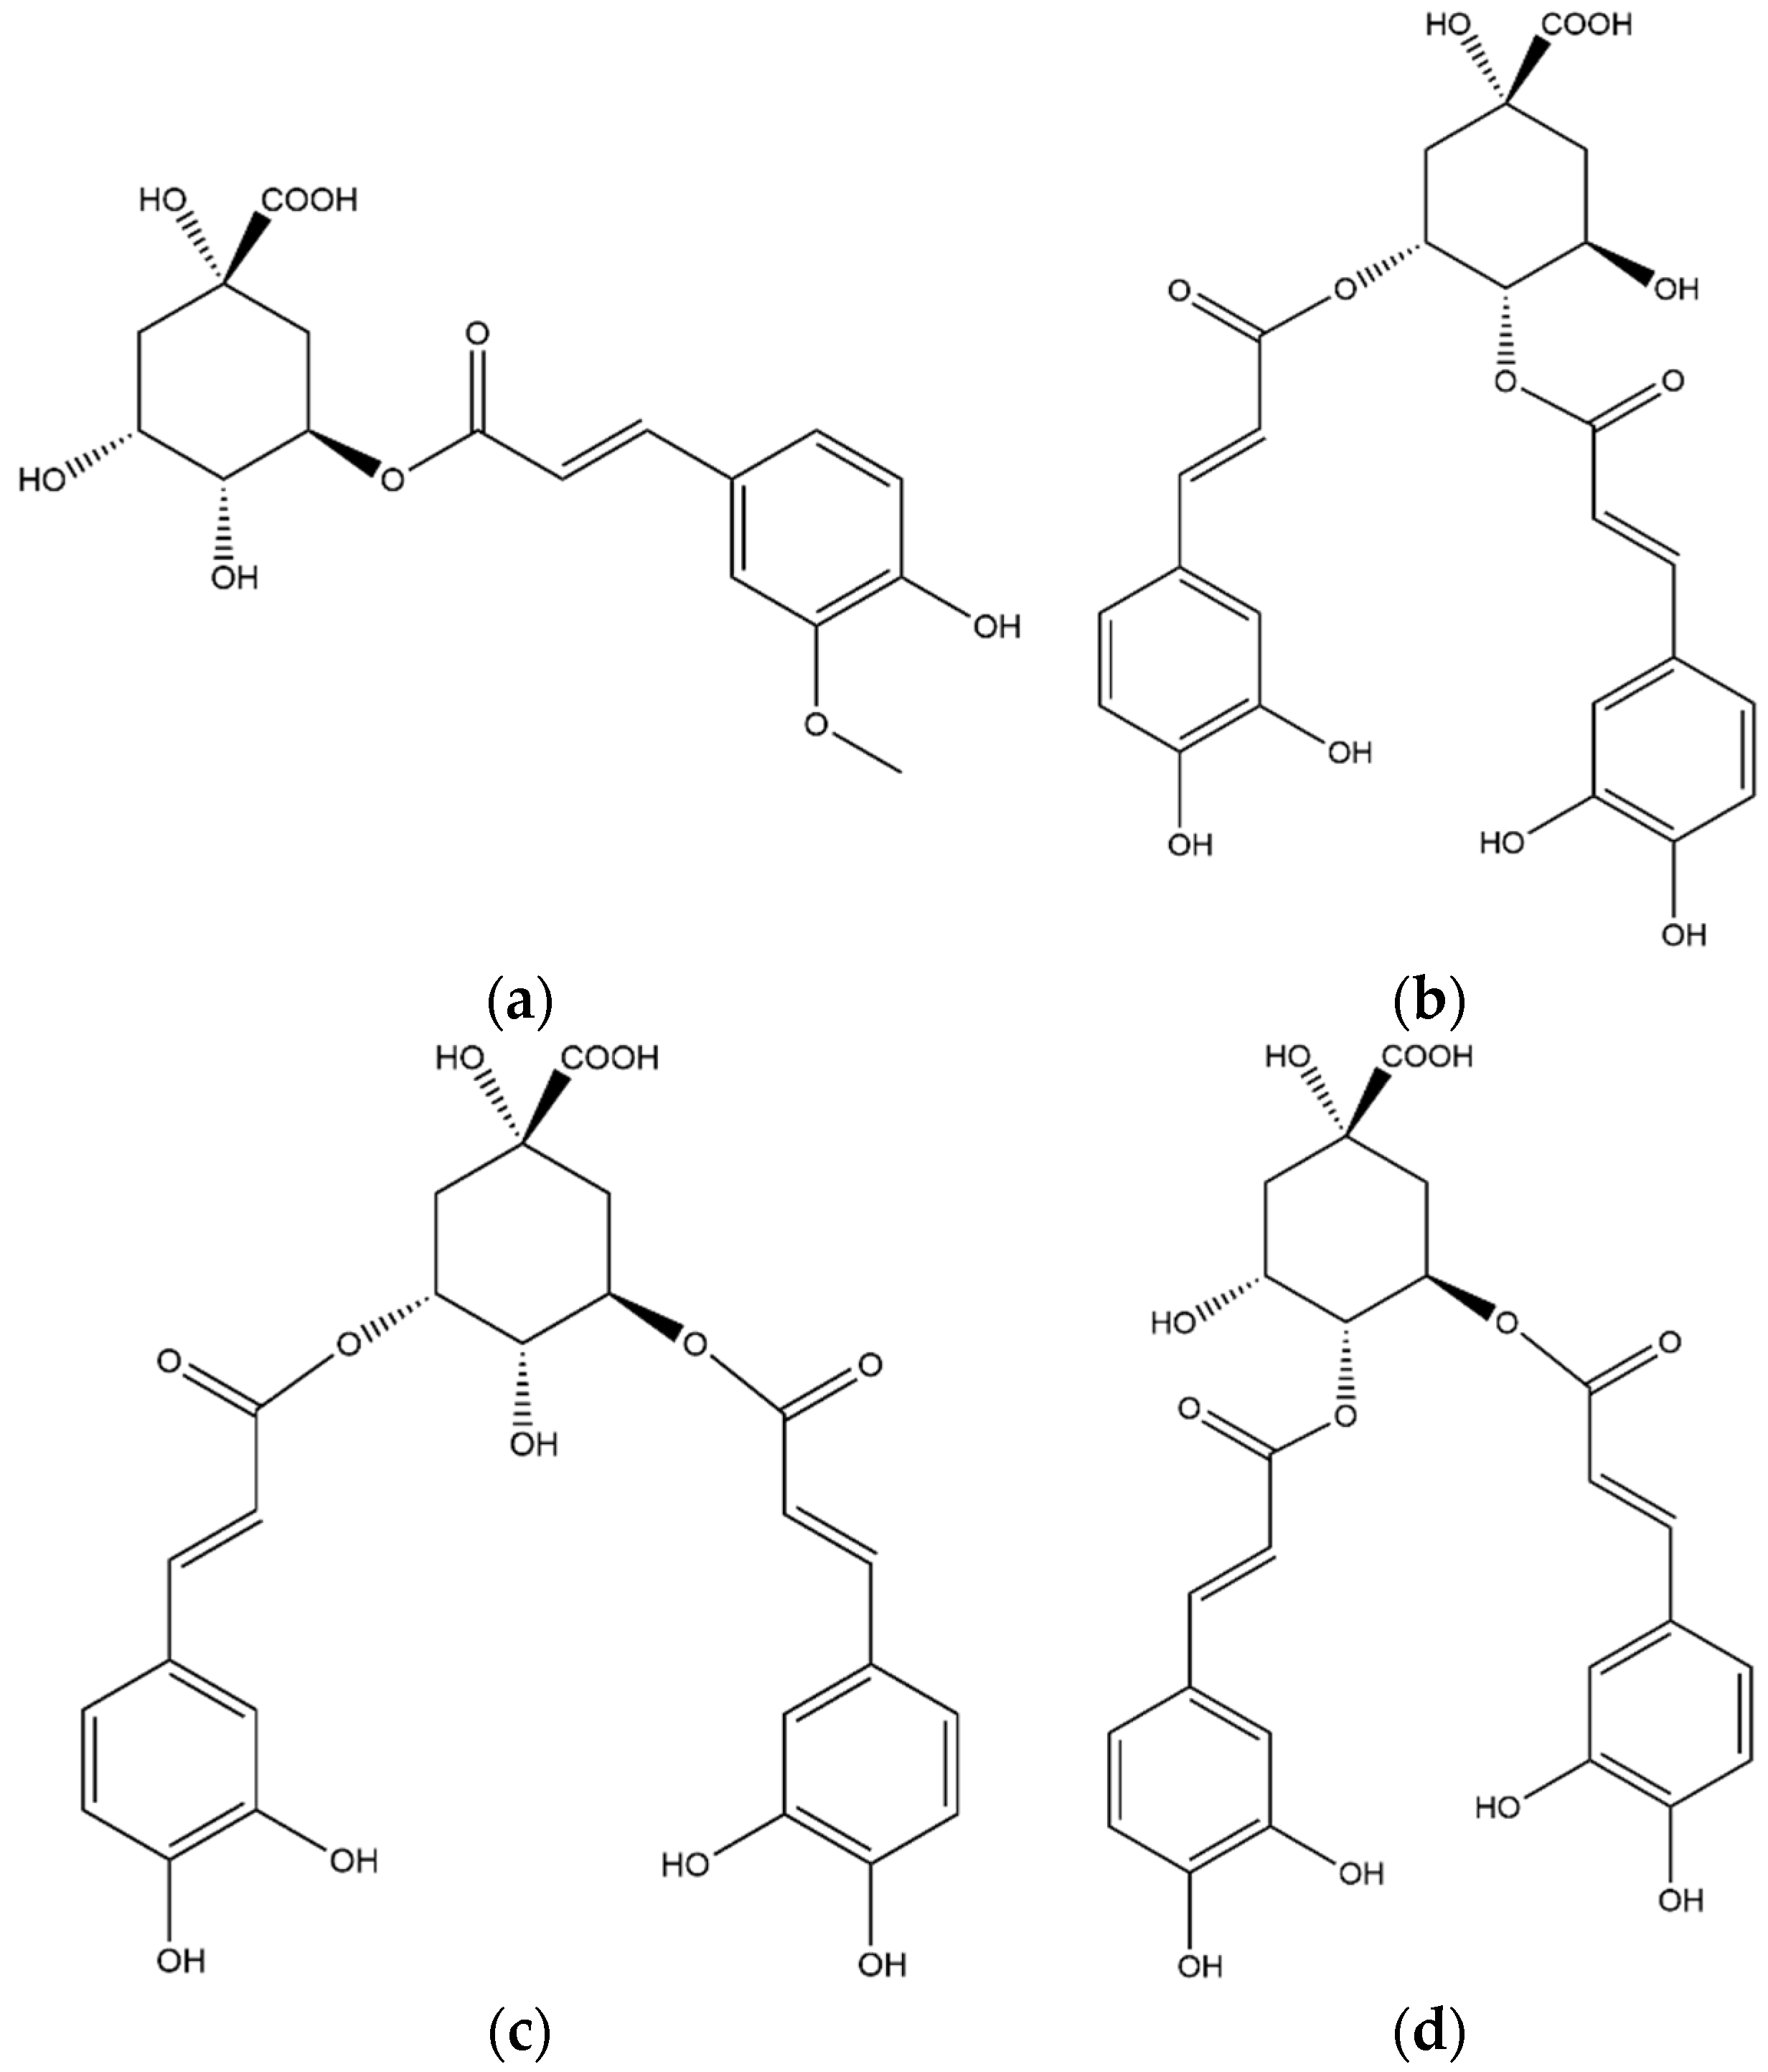
3.2.2. Chlorogenic Acids
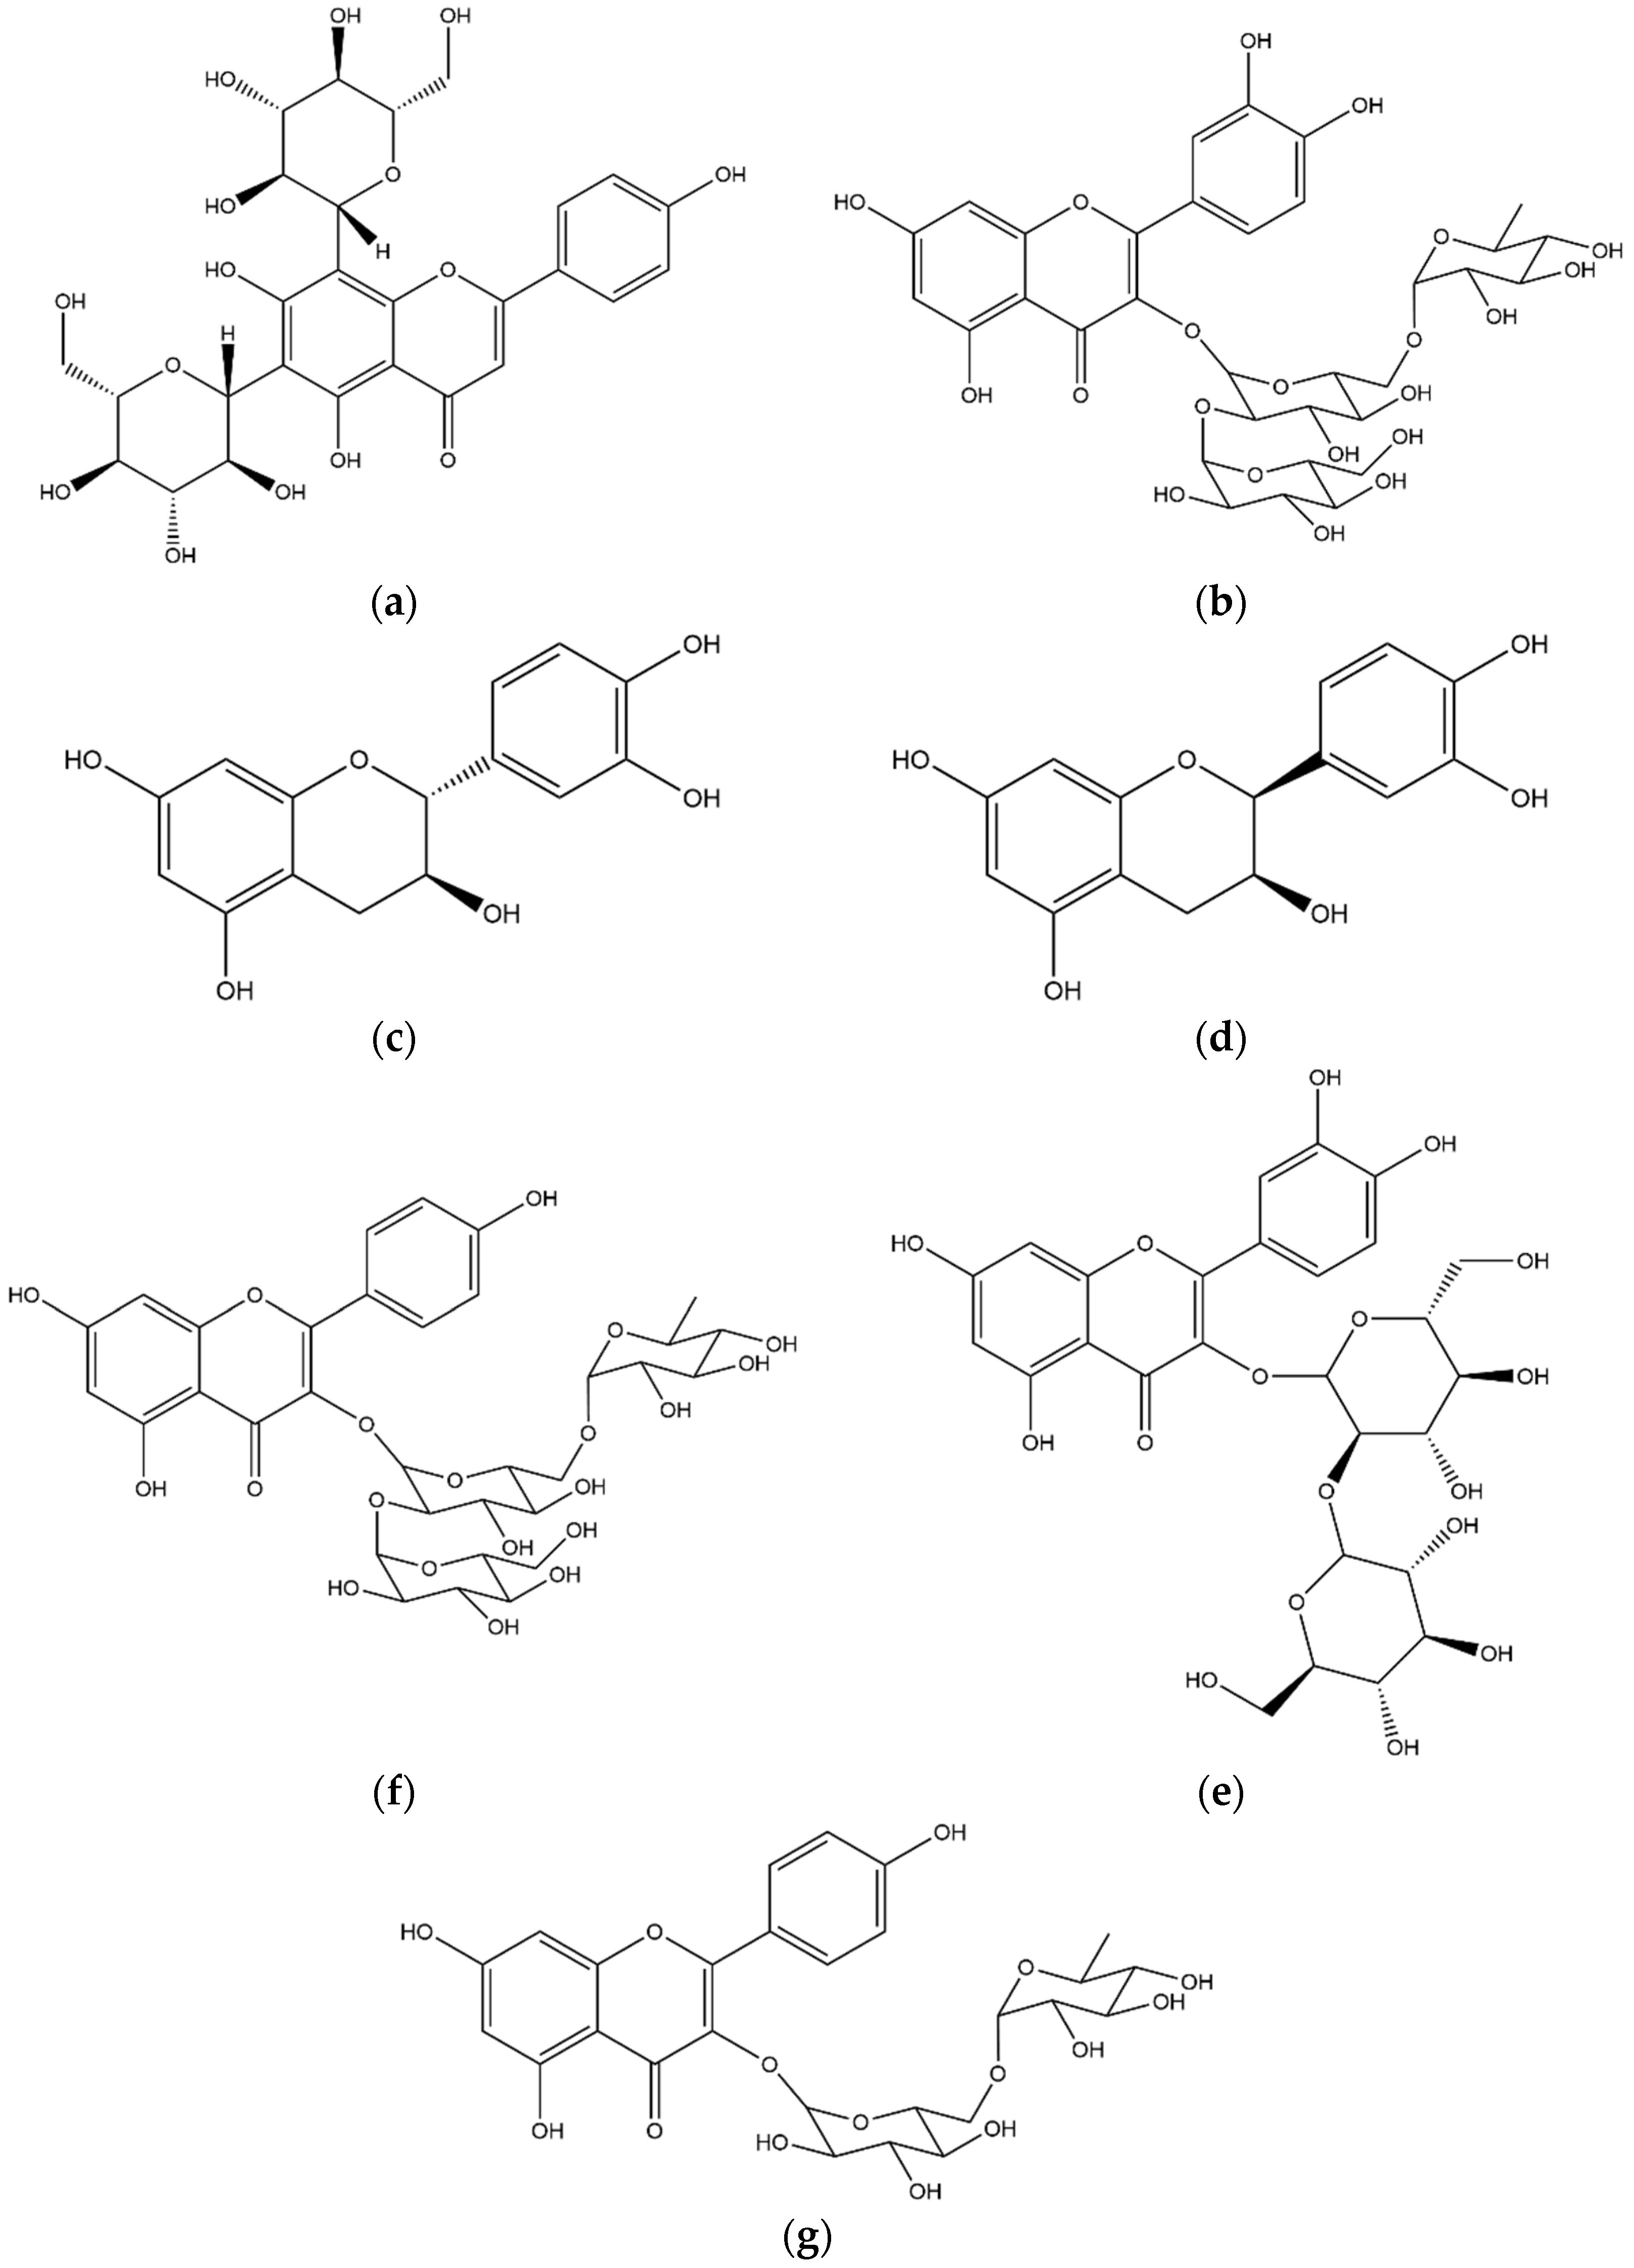
3.2.3. Flavonoids
3.2.4. Lignans
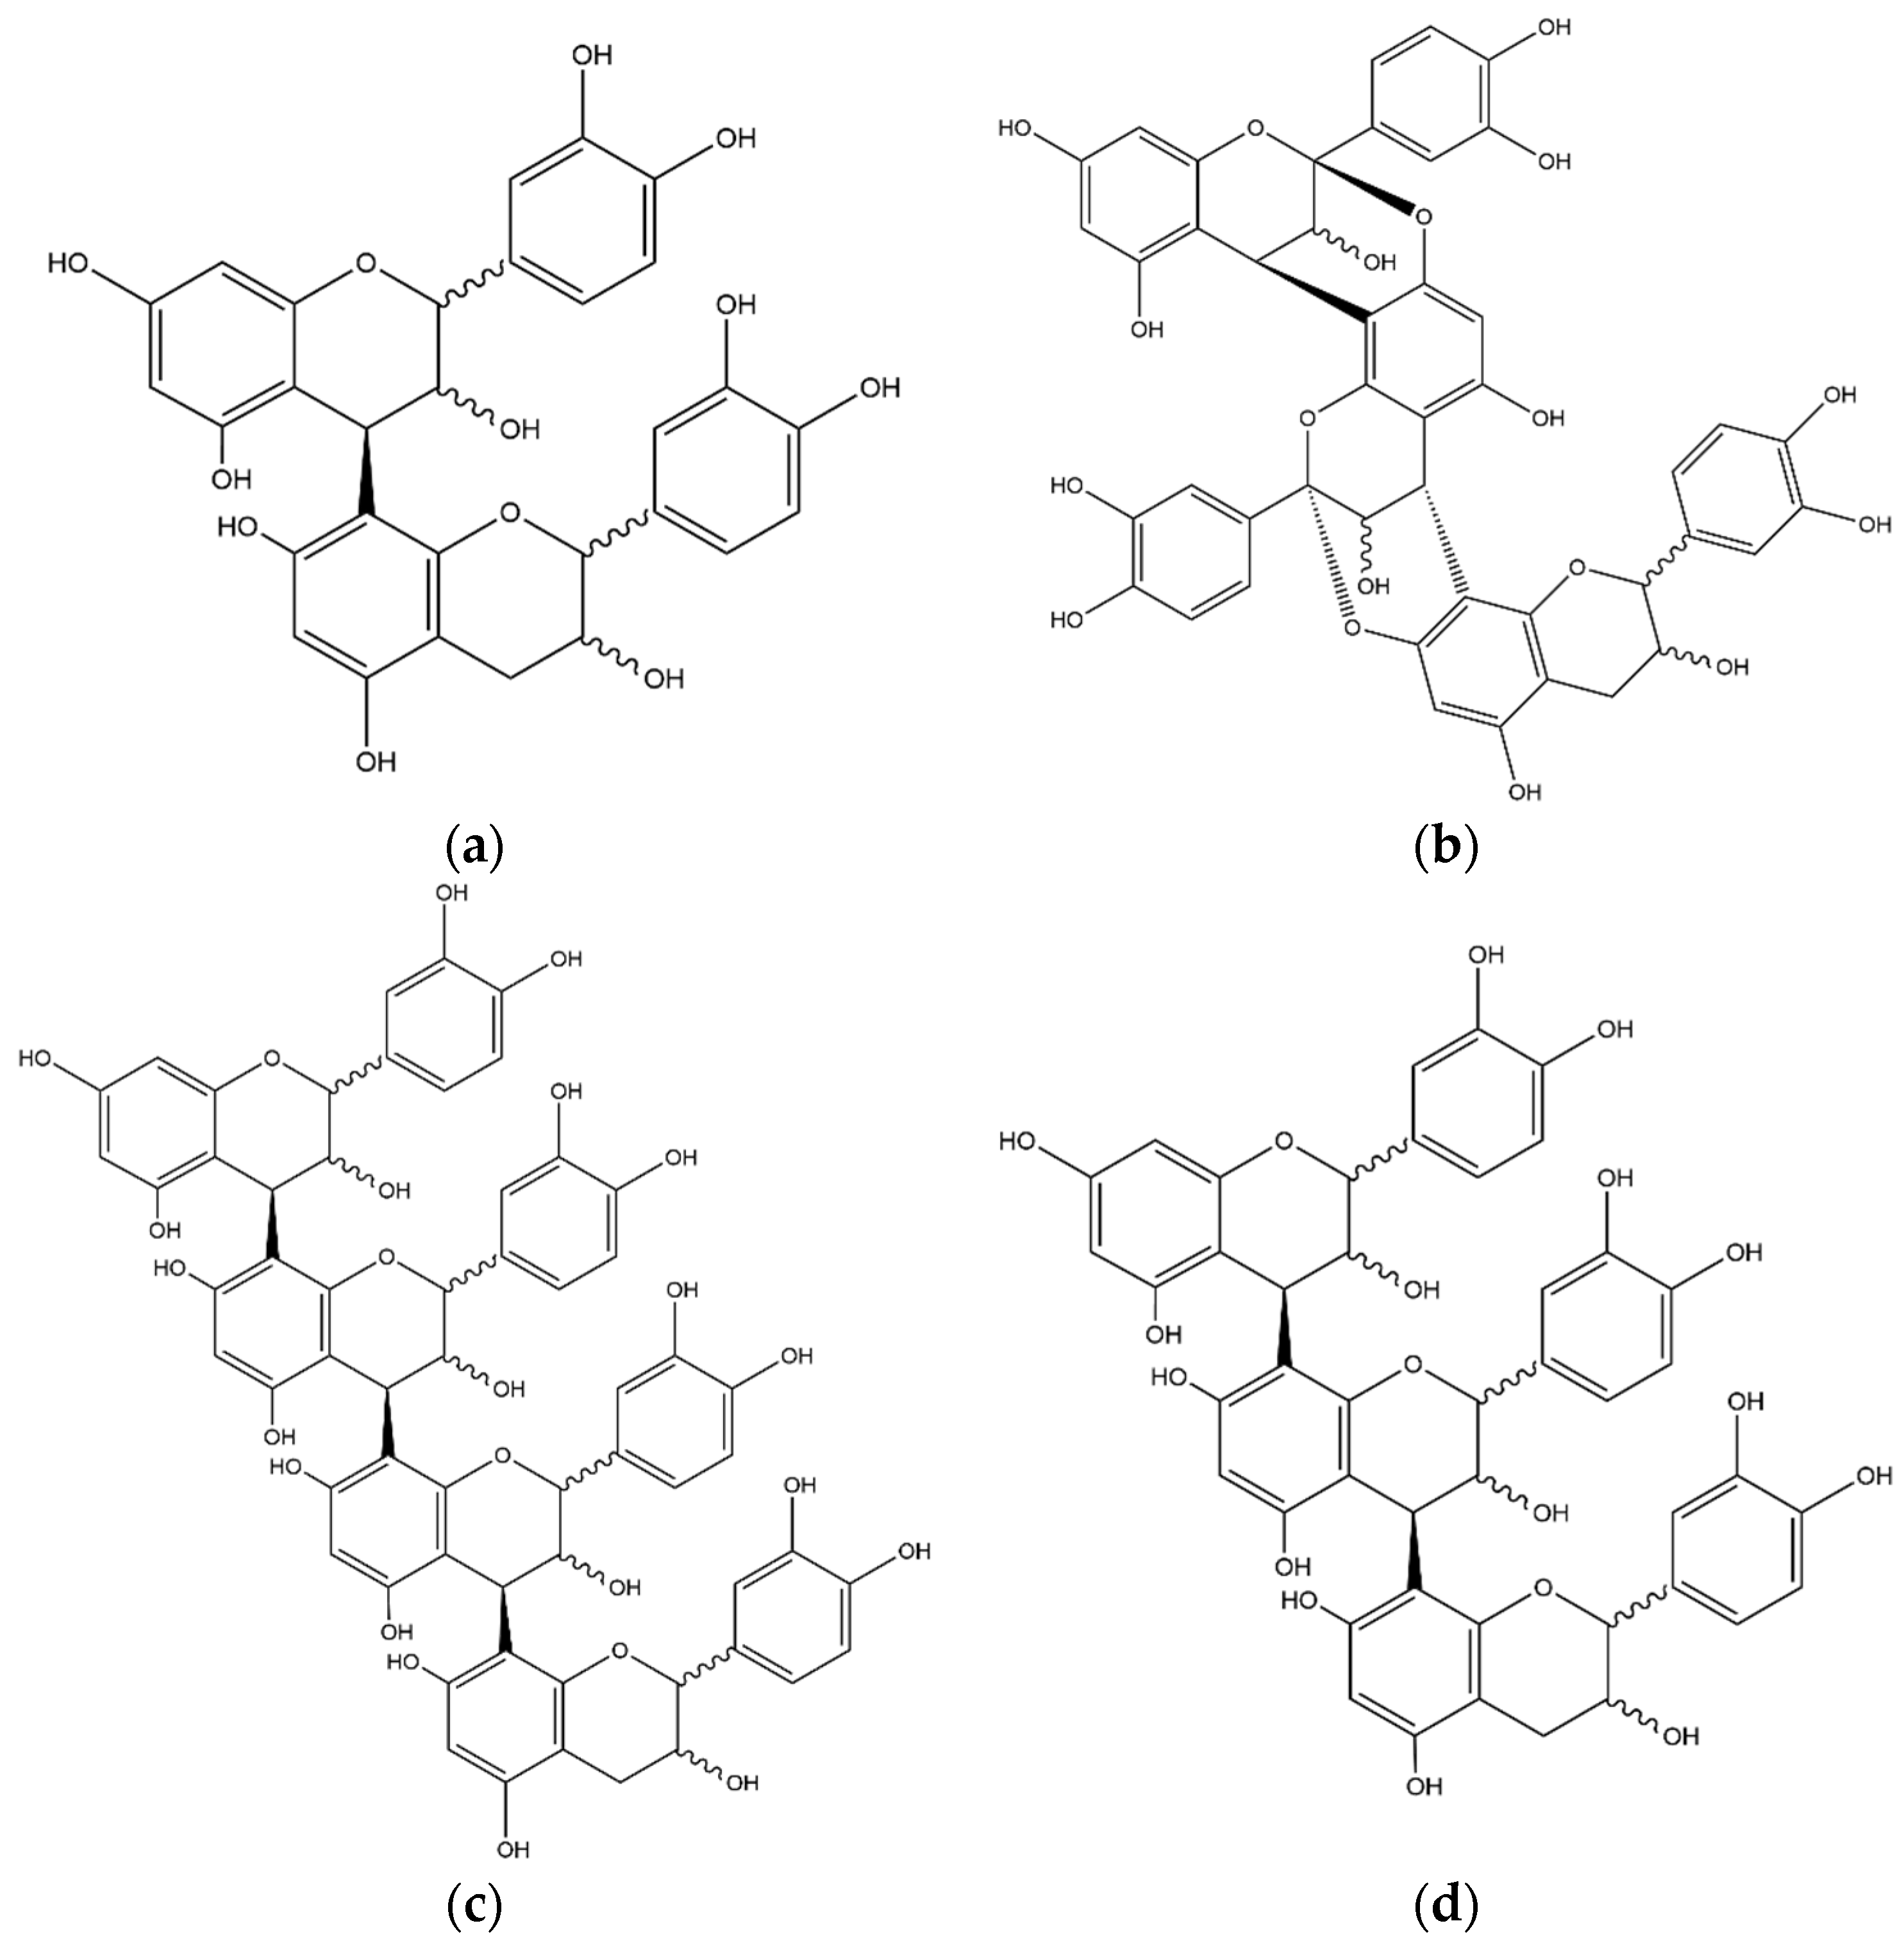
3.2.5. Procyanidins
3.3. HPLC-ESI(+)-MSn Profiling of Coffea Arabica Leaf Extract
3.4. HPLC-MS Quantitation of Coffea arabica L. Leaves Extract Components
4. Conclusions
Author Contributions
Funding
Institutional Review Board Statement
Informed Consent Statement
Data Availability Statement
Acknowledgments
Conflicts of Interest
References
- Campa, C.; Mondolot, L.; Rakotondravao, A.; Bidel, L.P.R.; Gargadennec, A.; Couturon, E.; La Fisca, P.; Rakotomalala, J.-J.; Jay-Allemand, C.; Davis, A.P. A Survey of Mangiferin and Hydroxycinnamic Acid Ester Accumulation in Coffee (Coffea) Leaves: Biological Implications and Uses. Ann. Bot. 2012, 110, 595–613. [Google Scholar] [CrossRef] [PubMed]
- Chen, X. A Review on Coffee Leaves: Phytochemicals, Bioactivities and Applications. Crit. Rev. Food Sci. Nutr. 2019, 59, 1008–1025. [Google Scholar] [CrossRef]
- Ngamsuk, S.; Huang, T.C.; Hsu, J.L. Determination of Phenolic Compounds, Procyanidins, and Antioxidant Activity in Processed Coffea arabica L. Leaves. Foods 2019, 8, 389. [Google Scholar] [CrossRef] [PubMed]
- Alañón, M.E.; Palomo, I.; Rodríguez, L.; Fuentes, E.; Arráez-Román, D.; Segura-Carretero, A. Antiplatelet Activity of Natural Bioactive Extracts from Mango (Mangifera Indica, L.) and its By-Products. Antioxidants 2019, 8, 517. [Google Scholar] [CrossRef] [PubMed]
- Bonechi, C.; Donati, A.; Tamasi, G.; Leone, G.; Consumi, M.; Rossi, C.; Lamponi, S.; Magnani, A. Protective Effect of Quercetin and Rutin Encapsulated Liposomes on Induced Oxidative Stress. Biophys. Chem. 2018, 233, 55–63. [Google Scholar] [CrossRef]
- Tamasi, G.; Pardini, A.; Croce, R.; Consumi, M.; Leone, G.; Bonechi, C.; Rossi, C.; Magnani, A. Combined Experimental and Multivariate Model Approaches for Glycoalkaloid Quantification in Tomatoes. Molecules 2021, 26, 3068. [Google Scholar] [CrossRef]
- Monteiro, Â.; Colomban, S.; Azinheira, H.G.; Guerra-Guimarães, L.; Do Céu Silva, M.; Navarini, L.; Resmini, M. Dietary Antioxidants in Coffee Leaves: Impact of Botanical Origin and Maturity on Chlorogenic Acids and Xanthones. Antioxidants 2019, 9, 6. [Google Scholar] [CrossRef]
- Pardini, A.; Consumi, M.; Leone, G.; Bonechi, C.; Tamasi, G.; Sangiorgio, P.; Verardi, A.; Rossi, C.; Magnani, A. Effect of Different Post-Harvest Storage Conditions and Heat Treatment on Tomatine Content in Commercial Varieties of Green Tomatoes. J. Food Comp. Anal. 2021, 96, 103735. [Google Scholar] [CrossRef]
- Perrone, D.; Donangelo, R.; Donangelo, C.M.; Farah, A. Modeling Weight Loss and Chlorogenic Acids Content in Coffee during Roasting. J. Agric. Food Chem. 2010, 58, 12238–12243. [Google Scholar] [CrossRef]
- Esquivel, P.; Viñas, M.; Steingass, C.B.; Gruschwitz, M.; Guevara, E.; Carle, R.; Schweiggert, R.M.; Jiménez, V.M. Coffee (Coffea arabica L.) by-Products as a Source of Carotenoids and Phenolic Compounds—Evaluation of Varieties with Different Peel Color. Front. Sustain. Food Syst. 2020, 4, 590597. [Google Scholar] [CrossRef]
- Dar, A.; Faizi, S.; Naqvi, S.; Roome, T.; Zikr-ur-Rehman, S.; Ali, M.; Firdous, S.; Moin, S.T. Analgesic and Antioxidant Activity of Mangiferin and its Derivatives: The Structure Activity Relationship. Biol. Pharm. Bul. 2005, 28, 596–600. [Google Scholar] [CrossRef]
- Segheto, L.; Santos, B.C.S.; Werneck, A.F.L.; Vilela, F.M.P.; de Sousa, O.V.; Rodarte, M.P. Antioxidant Extracts of Coffee Leaves and its Active Ingredient 5-Caffeoylquinic Acid Reduce Chemically-Induced Inflammation in Mice. Ind. Crops Prod. 2018, 126, 48–57. [Google Scholar] [CrossRef]
- Chen, X.M.; Ma, Z.; Kitts, D.D. Effects of Processing Method and Age of Leaves on Phytochemical Profiles and Bioactivity of Coffee Leaves. Food Chem. 2018, 249, 143–153. [Google Scholar] [CrossRef] [PubMed]
- Boros, K.; Jedlinszki, N.; Csupor, D. Theanine and Caffeine Content of Infusions Prepared from Commercial Tea Samples. Pharmacogn. Mag. 2016, 12, 75–78. [Google Scholar] [CrossRef] [PubMed]
- Choung, M.G.; Hwang, Y.S.; Lee, M.S.; Lee, J.; Kang, S.T.; Jun, T.H. Comparison of Extraction and Isolation Efficiency of Catechins and Caffeine from Green Tea Leaves Using Different Solvent Systems. Int. J. Food Sci. Technol. 2014, 49, 1572–1578. [Google Scholar] [CrossRef]
- Tamasi, G.; Baratto, M.C.; Bonechi, C.; Byelyakova, A.; Pardini, A.; Donati, A.; Leone, G.; Consumi, M.; Lamponi, S.; Magnani, A.; et al. Chemical characterization and antioxidant properties of products and by-products from Olea europaea L. Food Sci. Nutr. 2019, 7, 2907–2920. [Google Scholar] [CrossRef]
- Tamasi, G.; Pardini, A.; Bonechi, C.; Donati, A.; Pessina, F.; Marcolongo, P.; Gamberucci, A.; Leone, G.; Consumi, M.; Magnani, A.; et al. Characterization of Nutraceutical Components in Tomatoes Pulp, Skin and Locular Gel. Eur. Food Res. Technol. 2019, 245, 907–918. [Google Scholar] [CrossRef]
- Tamasi, G.; Bonechi, C.; Leone, G.; Andreassi, M.; Consumi, M.; Sangiorgio, P.; Verardi, A.; Rossi, C.; Magnani, A. Varietal and Geographical Origin Characterization of Peaches and Nectarines by Combining Analytical Techniques and Statistical Approach. Molecules 2021, 26, 4128. [Google Scholar] [CrossRef]
- Zielińska, A.; Siudem, P.; Paradowska, K.; Gralec, M.; Kaźmierski, S.; Wawer, I. Aronia Melanocarpa Fruits as a Rich Dietary Source of Chlorogenic Acids and Anthocyanins: 1H-NMR, HPLC-DAD, and Chemometric Studies. Molecules 2020, 25, 3234. [Google Scholar] [CrossRef]
- Gogna, N.; Hamid, N.; Dorai, K. Metabolomic Profiling of the Phytomedicinal Constituents of Carica papaya L. Leaves and Seeds by 1H NMR Spectroscopy and Multivariate Statistical Analysis. J. Pharm. Biomed. Anal. 2015, 115, 74–85. [Google Scholar] [CrossRef]
- Ulrich, E.L.; Akutsu, H.; Doreleijers, J.F.; Harano, Y.; Ioannidis, Y.E.; Lin, J.; Livny, M.; Mading, S.; Maziuk, D.; Miller, Z.; et al. BioMagResBank. Nucleic Acids Res. 2007, 36, D402–D408. [Google Scholar] [CrossRef] [PubMed]
- Wishart, D.S.; Guo, A.; Oler, E.; Wang, F.; Anjum, A.; Peters, H.; Dizon, R.; Sayeeda, Z.; Tian, S.; Lee, B.L.; et al. HMDB 5.0: The Human Metabolome Database for 2022. Nucleic Acids Res. 2022, 50, D622–D631. [Google Scholar] [CrossRef]
- Malherbe, C.J.; Willenburg, E.; De Beer, D.; Bonnet, S.L.; Van der Westhuizen, J.H.; Joubert, E. Iriflophenone-3-C-Glucoside from Cyclopia Genistoides: Isolation and Quantitative Comparison of Antioxidant Capacity with Mangiferin and Isomangiferin Using on-Line HPLC Antioxidant Assays. J. Chromatogr. B Anal. Technol. Biomed. Life Sci. 2014, 951–952, 164–171. [Google Scholar] [CrossRef]
- Barreto, J.A.C.B.; Revisan, M.A.T.S.T.; Ull, W.I.E.H.; Piegelhalder, B.E.S.; Wen, R.O.W.O. Characterization and Quantitation of Polyphenolic Compounds in Bark, Kernel, Leaves, and Peel of Mango (Mangifera indica L.). J. Agric. Food Chem. 2008, 56, 5599–5610. [Google Scholar] [CrossRef] [PubMed]
- Clifford, M.N.; Johnston, K.L.; Knight, S.; Kuhnert, N. Hierarchical Scheme for LC-MS n Identification of Chlorogenic Acids. J. Agric. Food Chem. 2003, 51, 2900–2911. [Google Scholar] [CrossRef] [PubMed]
- Clifford, M.N.; Kirkpatrick, J.; Kuhnert, N.; Roozendaal, H.; Salgado, P.R. LC-MSn Analysis of the Cis Isomers of Chlorogenic Acids. Food Chem. 2008, 106, 379–385. [Google Scholar] [CrossRef]
- Clifford, M.N.; Knight, S.; Kuhnert, N. Discriminating between the Six Isomers of Dicaffeoylquinic Acid by LC-MSn. J. Agric. Food Chem. 2005, 53, 3821–3832. [Google Scholar] [CrossRef]
- Clifford, M.N.; Marks, S.; Knight, S.; Kuhnert, N. Characterization by LC-MS n of Four New Classes of p-Coumaric Acid-Containing Diacyl Chlorogenic Acids in Green Coffee Beans. J. Agric. Food Chem. 2006, 54, 4095–4101. [Google Scholar] [CrossRef]
- Jaiswal, R.; Patras, M.A.; Eravuchira, P.J.; Kuhnert, N. Profile and Characterization of the Chlorogenic Acids in Green Robusta Coffee Beans by LC-MSn: Identification of Seven New Classes of Compounds. J. Agric. Food Chem. 2010, 58, 8722–8737. [Google Scholar] [CrossRef]
- Panche, A.N.; Diwan, A.D.; Chandra, S.R. Flavonoids: An Overview. J. Nutr. Sci. 2016, 5, e47. [Google Scholar] [CrossRef]
- Kazuno, S.; Yanagida, M.; Shindo, N.; Murayama, K. Mass Spectrometric Identification and Quantification of Glycosyl Flavonoids, Including Dihydrochalcones with Neutral Loss Scan Mode. Anal. Biochem. 2005, 347, 182–192. [Google Scholar] [CrossRef] [PubMed]
- Salerno, R.; Casale, F.; Calandruccio, C.; Procopio, A. Characterization of Flavonoids in Citrus bergamia (Bergamot) Polyphenolic Fraction by Liquid Chromatography–High Resolution Mass Spectrometry (LC/HRMS). PharmaNutrition 2016, 4, S1–S7. [Google Scholar] [CrossRef]
- de Almeida, R.F.; Trevisan, M.T.S.; Thomaziello, R.A.; Breuer, A.; Klika, K.D.; Ulrich, C.M.; Owen, R.W. Nutraceutical Compounds: Echinoids, Flavonoids, Xanthones and Caffeine Identified and Quantitated in the Leaves of Coffea arabica Trees from Three Regions of Brazil. Food Res. Int. 2019, 115, 493–503. [Google Scholar] [CrossRef]
- Stöggl, W.M.; Huck, C.W.; Bonn, G.K. Structural Elucidation of Catechin and Epicatechin in Sorrel Leaf Extracts Using Liquid-Chromatography Coupled to Diode Array-, Fluorescence-, and Mass Spectrometric Detection. J. Sep. Sci. 2004, 27, 524–528. [Google Scholar] [CrossRef] [PubMed]
- Wang, Y.; Berhow, M.A.; Black, M.; Jeffery, E.H. A Comparison of the Absorption and Metabolism of the Major Quercetin in Brassica, Quercetin-3-O-Sophoroside, to That of Quercetin Aglycone, in Rats. Food Chem. 2020, 311, 125880. [Google Scholar] [CrossRef]
- Justesen, U.; Arrigoni, E. Electrospray Ionisation Mass Spectrometric Study of Degradation Products of Quercetin, Quercetin-3-Glucoside and Quercetin-3-Rhamnoglucoside, Produced by in Vitro Fermentation with Human Faecal Flora. Rapid Commun. Mass Spectrom. 2001, 15, 477–483. [Google Scholar] [CrossRef] [PubMed]
- Khallouki, F.; Ricarte, I.; Breuer, A.; Owen, R.W. Characterization of Phenolic Compounds in Mature Moroccan Medjool Date Palm Fruits (Phoenix dactylifera) by HPLC-DAD-ESI-MS. J. Food Comp. Anal. 2018, 70, 63–71. [Google Scholar] [CrossRef]
- Angeloni, S.; Navarini, L.; Khamitova, G.; Sagratini, G.; Vittori, S.; Caprioli, G. Quantification of Lignans in 30 Ground Coffee Samples and Evaluation of Theirs Extraction Yield in Espresso Coffee by HPLC-MS/MS Triple Quadrupole. Int. J. Food Sci. Nutr. 2020, 71, 193–200. [Google Scholar] [CrossRef]
- Resende, F.O.; Rodrigues-Filho, E.; Luftmann, H.; Petereit, F.; De Mello, J.C.P. Phenylpropanoid Substituted Flavan-3-Ols from Trichilia Catigua and Their in Vitro Antioxidative Activity. J. Braz. Chem. Soc. 2011, 22, 2087–2093. [Google Scholar] [CrossRef]
- De Marchi, F.; De Rosso, M.; Flamini, R. Coupling between High-Resolution Mass Spectrometry and Focalized Data-Analysis Methods Provides the Identification of New Putative Glycosidic Non-Anthocyanic Flavonoids in Grape. Metabolomics 2022, 18, 37. [Google Scholar] [CrossRef]
- Dantas, C.A.G.; Abreu, L.S.; da Cunha, H.N.; Veloso, C.A.G.; Souto, A.L.; de Fátima Agra, M.; de Oliveira Costa, V.C.; da Silva, M.S.; Tavares, J.F. Dereplication of Phenolic Derivatives of Three Erythroxylum Species Using Liquid Chromatography Coupled with ESI-MSn and HRESIMS. Phytochem. Anal. 2021, 32, 1011–1026. [Google Scholar] [CrossRef] [PubMed]
- Sun, W.; Miller, J.M. Tandem Mass Spectrometry of the B-Type Procyanidins in Wine and B-Type Dehydrodicatechins in an Autoxidation Mixture of (+)-Catechin and (−)-Epicatechin. J. Mass Spectrom. 2003, 38, 438–446. [Google Scholar] [CrossRef] [PubMed]
- Rockenbach, I.I.; Jungfer, E.; Ritter, C.; Santiago-Schübel, B.; Thiele, B.; Fett, R.; Galensa, R. Characterization of Flavan-3-Ols in Seeds of Grape Pomace by CE, HPLC-DAD-MSn and LC-ESI-FTICR-MS. Food Res. Int. 2012, 48, 848–855. [Google Scholar] [CrossRef]
- Jungfer, E.; Zimmermann, B.F.; Ruttkat, A.; Galensa, R. Comparing Procyanidins in Selected Vaccinium Species by UHPLC-MS 2 with Regard to Authenticity and Health Effects. J. Agric. Food Chem. 2012, 60, 9688–9696. [Google Scholar] [CrossRef] [PubMed]
- Martini, S.; Conte, A.; Tagliazucchi, D. Phenolic Compounds Profile and Antioxidant Properties of Six Sweet Cherry (Prunus avium) Cultivars. Food Res. Int. 2017, 97, 15–26. [Google Scholar] [CrossRef] [PubMed]
- Rue, E.A.; Rush, M.D.; van Breemen, R.B. Procyanidins: A Comprehensive Review Encompassing Structure Elucidation via Mass Spectrometry. Phytochem. Rev. 2018, 17, 1–16. [Google Scholar] [CrossRef]
- He, B.; Li, Q.; Jia, Y.; Zhao, L.; Xiao, F.; Lv, C.; Xu, H.; Chen, X.; Bi, K. A UFLC-MS/MS Method for Simultaneous Quantitation of Spinosin, Mangiferin and Ferulic Acid in Rat Plasma: Application to a Comparative Pharmacokinetic Study in Normal and Insomnic Rats. J. Mass Spectrom. 2012, 47, 1333–1340. [Google Scholar] [CrossRef]
- Rodríguez-Gómez, R.; Vanheuverzwjin, J.; Souard, F.; Delporte, C.; Stevigny, C.; Stoffelen, P.; De Braekeleer, K.; Kauffmann, J.-M. Determination of Three Main Chlorogenic Acids in Water Extracts of Coffee Leaves by Liquid Chromatography Coupled to an Electrochemical Detector. Antioxidants 2018, 7, 143. [Google Scholar] [CrossRef]


| No. | Compound | Internal Standard | ESI Mode | [M−H]− [M+H]+ | Equation | R2 | Linearity Range (μg/mL) | LOD//LOQ (μg/mL) |
|---|---|---|---|---|---|---|---|---|
| 1 | 3-CGA | Sinapic acid | (−) | 353 | y = 0.7405x | 0.9986 | 0.500–10.0 | 0.07//0.30 |
| 3 | 4-CGA | Sinapic acid | (−) | 353 | y = 0.7405x | 0.9986 | 0.500–10.0 | 0.07//0.30 |
| 4 | 5-CGA | Sinapic acid | (−) | 353 | y = 0.7405x | 0.9986 | 0.500–10.0 | 0.07//0.30 |
| 34 | 3,5-dCQA | Sinapic acid | (−) | 515 | y = 0.3951x | 0.9961 | 0.500–10.0 | 0.10//0.35 |
| 33 | 3,4-dCQA | Sinapic acid | (−) | 515 | y = 0.3951x | 0.9961 | 0.500–10.0 | 0.10//0.35 |
| 36 | 4,5-dCQA | Sinapic acid | (−) | 515 | y = 0.3951x | 0.9961 | 0.500–10.0 | 0.10//0.35 |
| 5 | Mangiferin | Quercetin | (−) | 421 | y = 2.9624x | 0.9995 | 0.025–2.50 | 0.007//0.023 |
| 22 | Isomangiferin | Quercetin | (−) | 421 | y = 2.9624x | 0.9995 | 0.025–2.50 | 0.007//0.023 |
| 39 | Caffeine | Theophylline | (+) | 138 | y = 6.5298x | 0.9997 | 0.025–12.5 | 0.004//0.010 |
| 38 | Trigonelline | Nicotinic acid | (+) | 195 | y = 0.8923x | 0.9983 | 0.100–12.5 | 0.02//0.06 |
| No. | Compound | 1H Chemical Shifts (ppm) [J-Coupling Values (Hz)] |
|---|---|---|
| 1, 2, 3, 4 | Chlorogenic acids | 6.32 (d, 15.74), 6.80 (d, 8.14), 6.97 (dd, 1.9,1.9), 7.07 (d, 2.0), 7.59 (d, 15.9) |
| 5 | Mangiferin | 6.39 (s), 6.84 (s) |
| 6 | Rutin | 5.13 (d, 3.62), 7.65 (d, 2.4) 6.90 (m), 7.48 (s) |
| 7 | Saccharides | 4.50 (d, 7.7), 3.3–4.2 |
| 8 | Caffeine | 7.87 (s) |
| 9 | Trigonelline | 8.06 (t, 7.61), 9.22 (s), 8.86 (d, 5.9), 8.92 (d, 7.8), 4.47 (s) |
| 10 | Malic acid | 2.37 (dd,15.3, 10.0) |
| 11 | Lactic acid | 1.34 (d, 10.5) |
| 12 | Leucine | 0.98 (t, 7.2), 1.69 (m) |
| 13 | Alanine | 1.46 (d, 7.2) |
| 14 | Glutamine | 2.12 (m) |
| 15 | Aspartic acid | 2.75 (dd, 15.2, 8.3), 2.85 (dd, 17.3, 4.1) |
| 16 | Cystein | 3.03 (dd, 2.7, 2.8) |
| 17 | Choline | 3.22 (s) |
| No. | Compound | Rt (min) | [M−H]− | [M+H]+ | MS2 | MS3 |
|---|---|---|---|---|---|---|
| 18 | Quinic acid | 1.01 | 191 | - | 127–173–111–93 | - |
| 1 | 3-Caffeoyl-quinic acid | 3.51 | 353 | 355 | 179–191 | 126–173–171 |
| 19 | Iriflophenone 3-C-glucoside | 5.07 | 407 | - | 317–287 | 243–193–167 |
| 20a | Catechin/Epicatechin | 5.28 | 289 | 291 | 271–245–205–179 | 227–203–161 |
| 2 | 1-Caffeoyl-quinic acid | 6.69 | 353 | 355 | 191–173–179 | 173–171–126 |
| 3 | 4-Caffeoyl-quinic acid | 7.06 | 353 | 355 | 173–179–191 | 155 |
| 4 | 5-Caffeoyl-quinic acid | 7.70 | 353 | 355 | 191 | 173–171–126 |
| 20b | Catechin/Epicatechin | 10.38 | 289 | 291 | 271–245–205–179 | 227–203–161 |
| 21 | Procyanidin B | 11.22 | 577 | 579 | 425–407–289 | 407–273 |
| 22 | Isomangiferin | 11.63 | 421 | 423 | 301–331 | 273–258 |
| 5 | Mangiferin | 12.42 | 421 | 423 | 301–331–403 | 273–258 |
| 24 | Procyanidin trimer A-type | 16.19 | 863 | 865 | 711–573–451–411 | 693 |
| 25 | Procyanidin tetramer B-type 1 | 17.10 | 576 | - | 500–491–289–567–559–451 | - |
| 26 | Apigenin 6,8-di-C-glucoside | 17.91 | 593 | - | 473–503–383–353 | 383–353 |
| 27 | Procyanidin C | 18.95 | 865 | - | 739–695–577–847–449–425 | 677–543–525–451–405–289 |
| 28 | 5-Feruloyl-quinic acid | 19.25 | 367 | - | 191–163 | 173–171–127 |
| 29 | Rutin glycoside | 19.89 | 771 | 773 | 753–609–591–301–300–271 | 547–445–409–367–355–301 |
| 30 | Quercetin sophoroside | 20.70 | 625 | 627 | 505–463–445–301 | 271–255–179 |
| 31a | Cinchonain I isomer | 21.75 | 451 | - | 341 | 231–217 |
| 32 | Kaempferol triglycoside | 22.41 | 755 | - | 575–285 | 393–339 |
| 6 | Rutin | 23.36 | 609 | 611 | 301 | 271–179–151 |
| 33 | 3,4-Dicaffeoyl-quinic acid | 24.00 | 515 | - | 353–335 | 191–179–173 |
| 34 | 3,5-Dicaffeoyl-quinic acid | 24.62 | 515 | - | 353 | 191–179–173 |
| 35 | Kaempferol-3-O-rhamnoglucoside | 25.50 | 593 | - | 285 | 267–257–241 |
| 36 | 4,5-Dicaffeoyl-quinic acid | 26.44 | 515 | - | 353 | 191–179–173 |
| 37 | 6-O-(p-hydroxybenzoyl)mangiferin | 27.10 | 541 | - | 331–301 | 313–301–271–259 |
| 31b | Cinchonain I isomer | 28.52 | 451 | - | 341 | 231–217 |
| 38 | Trigonelline 2 | 1.11 | - | 138 | 121 | - |
| 39 | Caffeine 2 | 20.69 | - | 195 | 138 | 121 |
| No. | Compound | g/kg DW | %RSD |
|---|---|---|---|
| 1 | 3-CGA | 1.28 ± 0.12 | 9.2 |
| 3 | 4-CGA | 0.89 ± 0.07 | 8.0 |
| 4 | 5-CGA | 16.27 ± 1.66 | 10.2 |
| 34 | 3,5-dCQA | 0.58 ± 0.02 | 3.4 |
| 33 | 3,4-dCQA | 0.63 ± 0.05 | 7.6 |
| 36 | 4,5-dCQA | 0.91 ± 0.05 | 5.3 |
| 5 | Mangiferin | 4.43 ± 0.14 | 3.3 |
| 22 | Isomangiferin | 0.52 ± 0.03 | 5.8 |
| 39 | Caffeine | 7.94 ± 0.42 | 5.3 |
| 38 | Trigonelline | 4.47 ± 0.13 | 2.9 |
Publisher’s Note: MDPI stays neutral with regard to jurisdictional claims in published maps and institutional affiliations. |
© 2022 by the authors. Licensee MDPI, Basel, Switzerland. This article is an open access article distributed under the terms and conditions of the Creative Commons Attribution (CC BY) license (https://creativecommons.org/licenses/by/4.0/).
Share and Cite
Cangeloni, L.; Bonechi, C.; Leone, G.; Consumi, M.; Andreassi, M.; Magnani, A.; Rossi, C.; Tamasi, G. Characterization of Extracts of Coffee Leaves (Coffea arabica L.) by Spectroscopic and Chromatographic/Spectrometric Techniques. Foods 2022, 11, 2495. https://doi.org/10.3390/foods11162495
Cangeloni L, Bonechi C, Leone G, Consumi M, Andreassi M, Magnani A, Rossi C, Tamasi G. Characterization of Extracts of Coffee Leaves (Coffea arabica L.) by Spectroscopic and Chromatographic/Spectrometric Techniques. Foods. 2022; 11(16):2495. https://doi.org/10.3390/foods11162495
Chicago/Turabian StyleCangeloni, Lorenzo, Claudia Bonechi, Gemma Leone, Marco Consumi, Marco Andreassi, Agnese Magnani, Claudio Rossi, and Gabriella Tamasi. 2022. "Characterization of Extracts of Coffee Leaves (Coffea arabica L.) by Spectroscopic and Chromatographic/Spectrometric Techniques" Foods 11, no. 16: 2495. https://doi.org/10.3390/foods11162495
APA StyleCangeloni, L., Bonechi, C., Leone, G., Consumi, M., Andreassi, M., Magnani, A., Rossi, C., & Tamasi, G. (2022). Characterization of Extracts of Coffee Leaves (Coffea arabica L.) by Spectroscopic and Chromatographic/Spectrometric Techniques. Foods, 11(16), 2495. https://doi.org/10.3390/foods11162495