Abstract
Recent advances in nuclear magnetic resonance (NMR) have led to the development of low-field benchtop NMR systems with improved sensitivity and resolution suitable for use in research and quality-control laboratories. Compared to their high-resolution counterparts, their lower purchase and running costs make them a good alternative for routine use. In this article, we show the adaptation of a method for predicting the consumer acceptability of mandarins, originally reported using a high-field 400 MHz NMR spectrometer, to benchtop 60 MHz NMR systems. Our findings reveal that both instruments yield comparable results regarding sugar and citric acid levels, leading to the development of virtually identical predictive linear models. However, the lower cost of benchtop NMR systems would allow cultivators to implement this chemometric-based method as an additional tool for the selection of new cultivars.
1. Introduction
Since the early days of nuclear magnetic resonance (NMR), considerable efforts have been invested to increase sensitivity and spectral resolution through the use of magnets with stronger fields. These endeavors have gone hand in hand with the development of novel superconducting materials and cryogenic technologies [1]. However, these systems are generally expensive and have high running and maintenance costs, driving many NMR spectrometer manufacturers to develop smaller and more accessible systems based on cryogen-free permanent magnets. These low-field instruments have magnetic fields below 2.3 T (i.e., 1H resonance frequencies under 100 MHz), fit on a regular laboratory benchtop, and are even suitable for use in field experiments [2,3]. The basis of these instruments is the use of rare-earth ring-shaped magnets that produce relatively strong and homogeneous fields [3]. Their lower sensitivity can sometimes be offset by concentrating the samples or using a variety of methodologies for the enhancement of Boltzmann polarization [4]. Similarly, issues with chemical shift resolution can be addressed through the application of different signal acquisition and processing techniques, including solvent suppression and gradient-based pulse sequences [3,5].
Although low-field benchtop NMR spectrometers may not be suitable for natural product research due to their lower sensitivity and resolution, they have been used successfully in the quality control of phytopharmaceuticals and in food analysis, to mention a few examples [6]. In academia, the use of benchtop NMR is increasing progressively. The low operating costs and ease of use of these instruments allow students not only to control their research products, but to follow chemical reactions in real time or even perform quantitative analyses [6,7,8,9]. Indeed, the quantitation of natural products using benchtop NMR has been employed in the quality control of drugs [10] and for the detection of adulterations in pharmaceutical products [11,12]. The use of low-field NMR in routine quality control of foods has also been demonstrated [6]. Examples of such applications include the determination of alcohol content in beverages [13] and the study of food authenticity and food fraud by targeted and untargeted analysis, where wine, coffee, oils, or even meat are examples [14,15,16,17,18]. For certain products, subdisciplines have been developed to study metabolomic profiles. For example, the term “MEATabolomics” refers to the application of metabolomic analysis to correlate the composition of meat with its sensory attributes [19,20].
In food analysis, untargeted approaches are preferred when trying to discover flavor-related compounds, which are followed with targeted analyses to measure the content of specific compounds or study metabolic pathways of interest [21,22]. Citrus metabolomics has been emerging in the last few years to control industrial processes or to evaluate flavor traits that influence consumer preferences [23,24,25]. However, little research has been conducted to adapt high-field NMR techniques to low-field systems. As stated by Castaing-Cordier and coworkers [26], benchtop instruments can be used in many applications due to recent advances in terms of sensitivity and resolution. Recently, we proved the usefulness of high-field NMR to predict consumer preferences in mandarins. Although interesting from an academic point of view, the high cost of the 400 MHz spectrometer employed in the study hampers its application by the local citrus industry [25]. The aim of the present work is to show an updated protocol for the analysis of mandarin consumer preferences using benchtop NMR systems that could be accessible to citrus fruit cultivators. As shown herein, our results indicate that chemometric-based consumer acceptability models of identical quality can be obtained regardless of magnetic field.
2. Materials and Methods
The samples used in the comparisons were a selection of aqueous mandarin extracts obtained during the development of the original method at 400 MHz [25]. Five extract replicates for each mandarin variety were lyophilized and stored under nitrogen in sealed containers until analysis. They were then dissolved in 600 μL of deuterium oxide (MagniSolv™, 99.9% D, Merck, Darmstadt, Germany), transferred to 5 mm NMR tubes (Norell® Standard SeriesTM Sigma-Aldrich, Darmstadt, Germany) and analyzed immediately.
A Bruker Avance III 400 spectrometer (Bruker, Ettlingen, Germany) was used to perform the high-field NMR experiments, while a Magritek Spinsolve 60 benchtop NMR spectrometer (Magritek GmbH, Aachen, Germany) was used to obtain the data at the low field. The 400 MHz spectra were obtained at a 1H frequency of 400.13 MHz using a z-gradient BBFO-Plus probe (298 K). Spectra were recorded using a spectral width of 8 KHz, a data size of 32 K, and using a 30° excitation pulse. A total 64 scans with a relaxation delay of 1 s between scans were averaged, leading to an analysis time of 4.1 min per sample. The 60 MHz data were obtained at room temperature using a 1H frequency of 62.32 MHz, a spectral width of 5 KHz, a data size of 32 K, and using a 90° excitation pulse. A total of 256 scans with a relaxation delay of 1 s between scans were averaged in this case, resulting in a total analysis time of 64.0 min per sample.
All spectra were processed using MNova (version 11.0, MestreLab Research, S.L., Santiago de Compostela, Spain) following an identical protocol, which included zero filling to 64 K and apodization with a 0.3 Hz exponential window function prior to Fourier transformation, manual phase and baseline correction, and referencing to the signal of the anomeric proton of α-glucose at 5.22 ppm. The spectra were then aligned using the derivative method and the average spectrum as a reference [27].
Once all spectra were aligned, the integral of the signal belonging to the sucrose glucosyl anomeric proton at 5.40 ppm was given an arbitrary value of 1.00. Then, the areas of the signals corresponding to the anomeric protons of α-glucose at 5.22 ppm, β-glucose at 4.63 ppm, and the multiplet arising from the H-3 and H-4 protons of the β-furanose form of fructose at 4.09 ppm, together with the four citric acid methylene protons centered at approximately 2.8 ppm, were scaled to that of the sucrose signal. The integration ranges for the sugar signals mentioned above were, respectively, 5.54 to 5.32, 5.29 to 5.16, 4.63 to 4.53, and 4.10 to 4.07 ppm in both instruments. Due to slight differences in the temperature of the experiments, the citrate signals were integrated from 3.02 to 2.73 ppm in the high-field spectrometer, and between 2.81 and 2.54 ppm on the benchtop instrument.
The relative area values were corrected using the sweetness scale of Schiffman and coworkers [28,29], being 1.0 for sucrose, 1.3 for fructose and 0.6 for α- and β-glucose. The ratio sweetening power/citric acid was calculated as follows, where n represents each of the sugars considered:
The correlation between the mandarin acceptability and the sweetening power/citric acid ratio was determined using the same mandarin varieties for both spectrometer systems, the R2 of the regressions was determined and the root mean square error (RMSE) of each model was calculated.
3. Results and Discussion
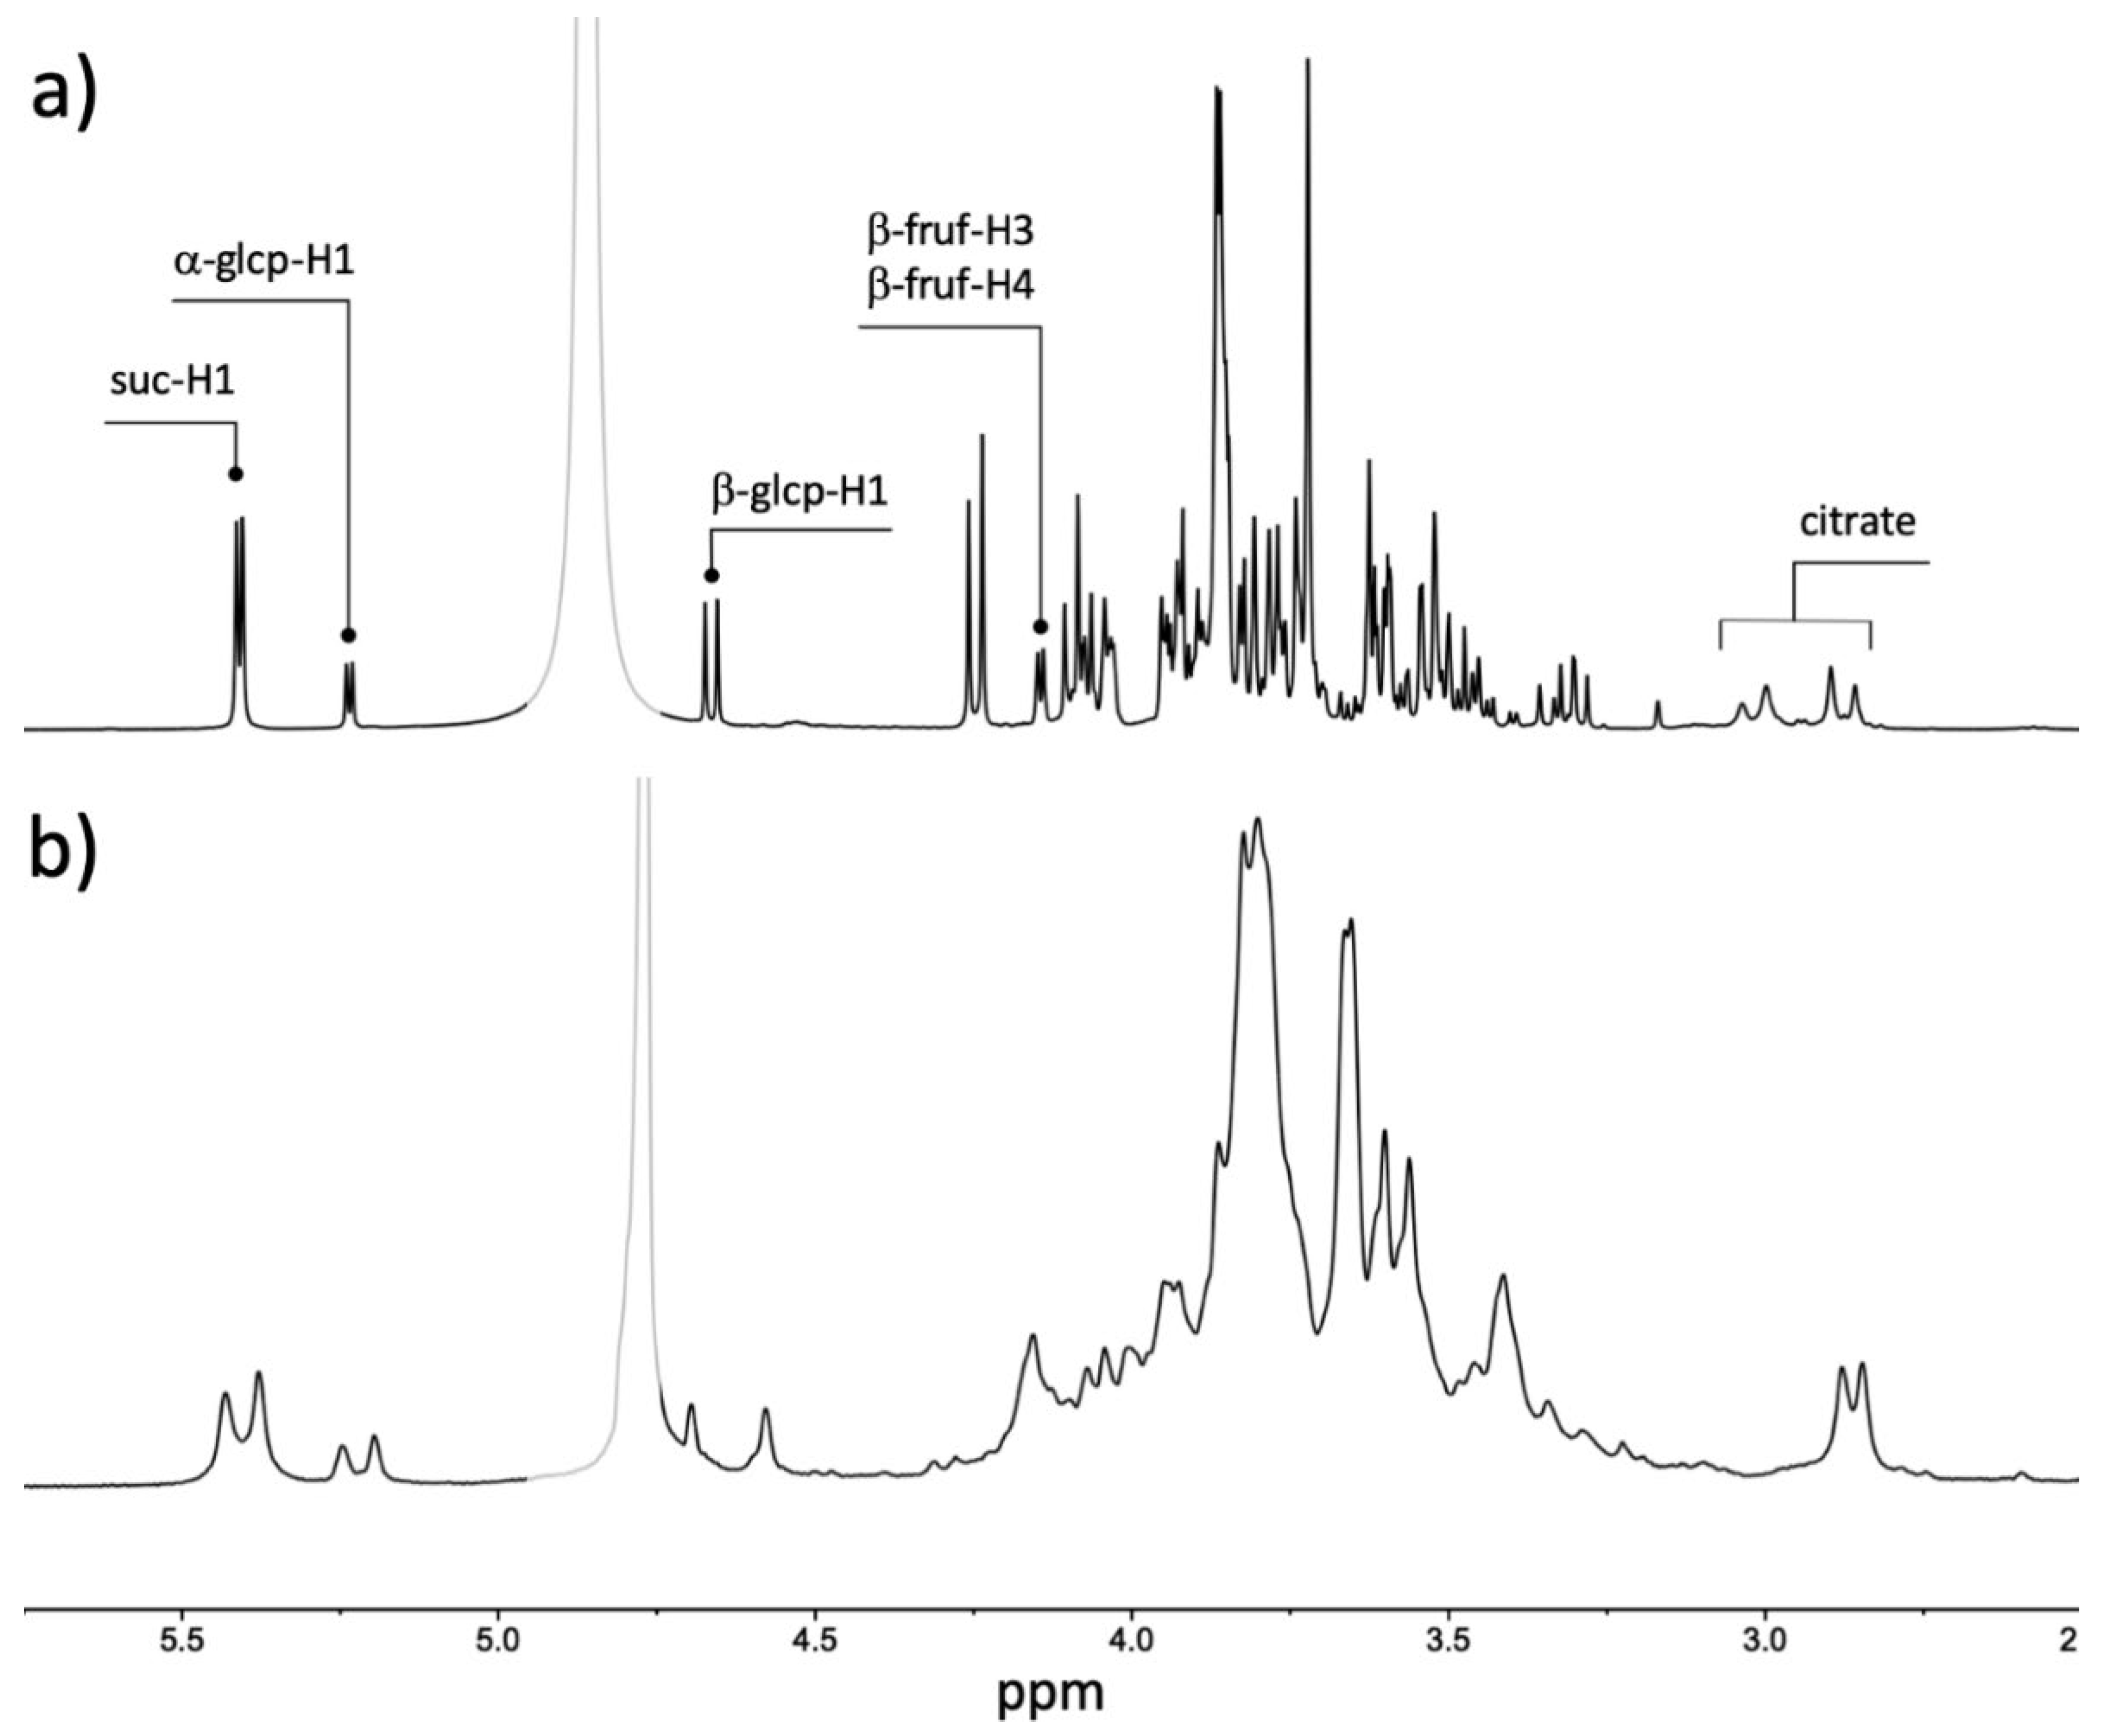
Figure 1 shows spectra obtained at 400 and 60 MHz for the same aqueous extract, respectively. Given its higher resolution, the spectrum obtained at 400 MHz allows for the identification of most protons from the species of interest. On the other hand, several of these signals appear overlapped at 60 MHz, making the initial assignment of resonances a harder task that requires technical know-how.

Figure 1.
Comparison of 1H spectra of the aqueous extract of mandarin variety B475B obtained with 400 and 60 MHz spectrometers ((a) and (b), respectively). Resonances employed in the estimations are annotated in the 400 MHz spectrum. The grayed-out region in both spectra corresponds to the residual HDO peak.
However, the signals corresponding to the sugar anomeric protons and citric acid methylene protons of interest are in relatively uncluttered regions of the spectrum, and therefore their identification and quantitation is achievable. Indeed, if the selection of the integration ranges is rigorous and consistent with those employed at the high field, the integration of the signals corresponding to anomeric protons of sucrose, glucose, and fructose, as well as the citric acid methylene protons, allows us to apply the methodology developed previously [25] to predict the acceptability of the mandarin samples (Table 1).

Table 1.
Results of the sensory evaluation (acceptability), sweetening power/citric acid ratio, predicted acceptability using the model and RMSE of the prediction of each model (60 and 400 MHz data).
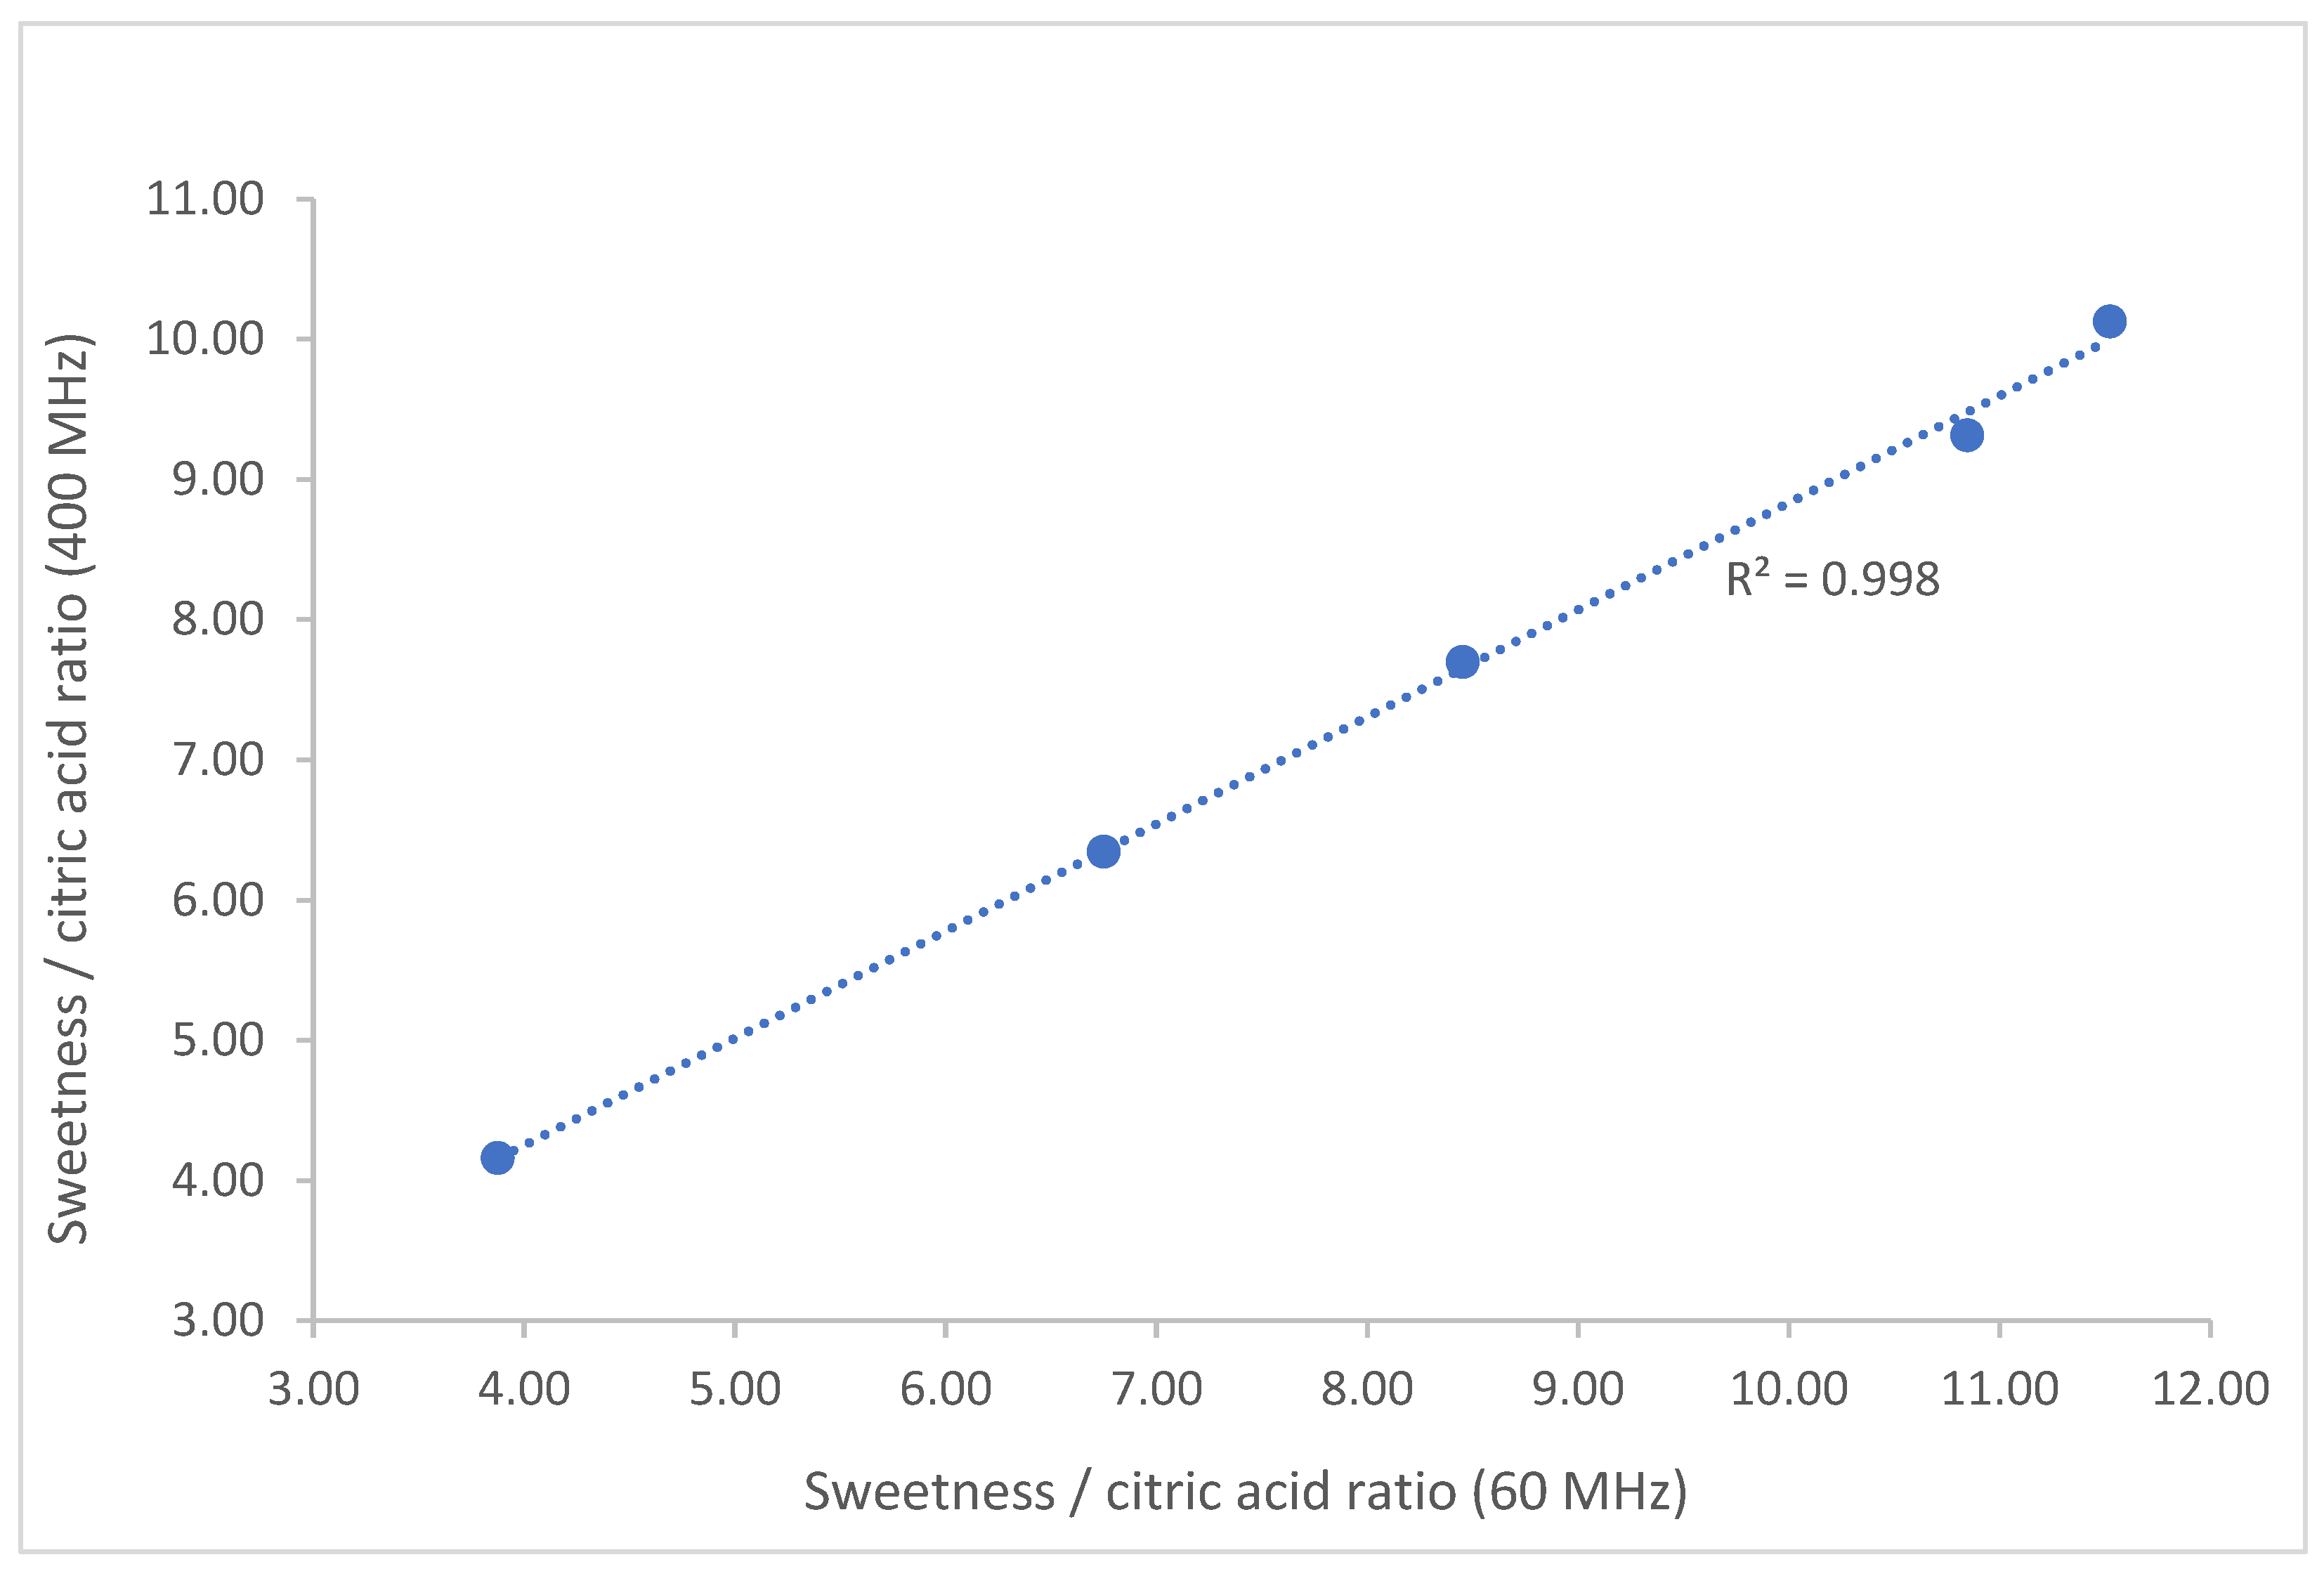
The sweetness/citric acid ratio of the samples determined at the two frequencies considered had high correlation (R2 > 0.99, Figure 2), showing the equivalence of both systems and their fitness for the intended purpose of the method.
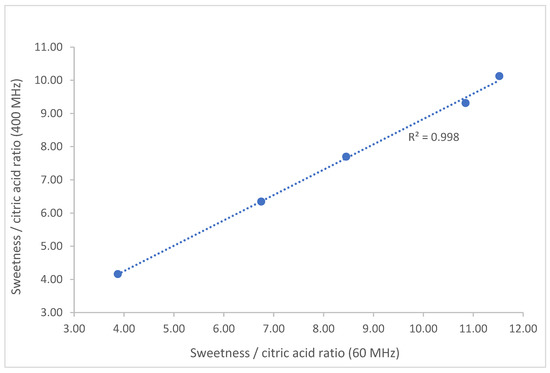
Figure 2.
Correlation between the measurement of the sweetness/citric acid ratio of the samples obtained at 400 and 60 MHz.
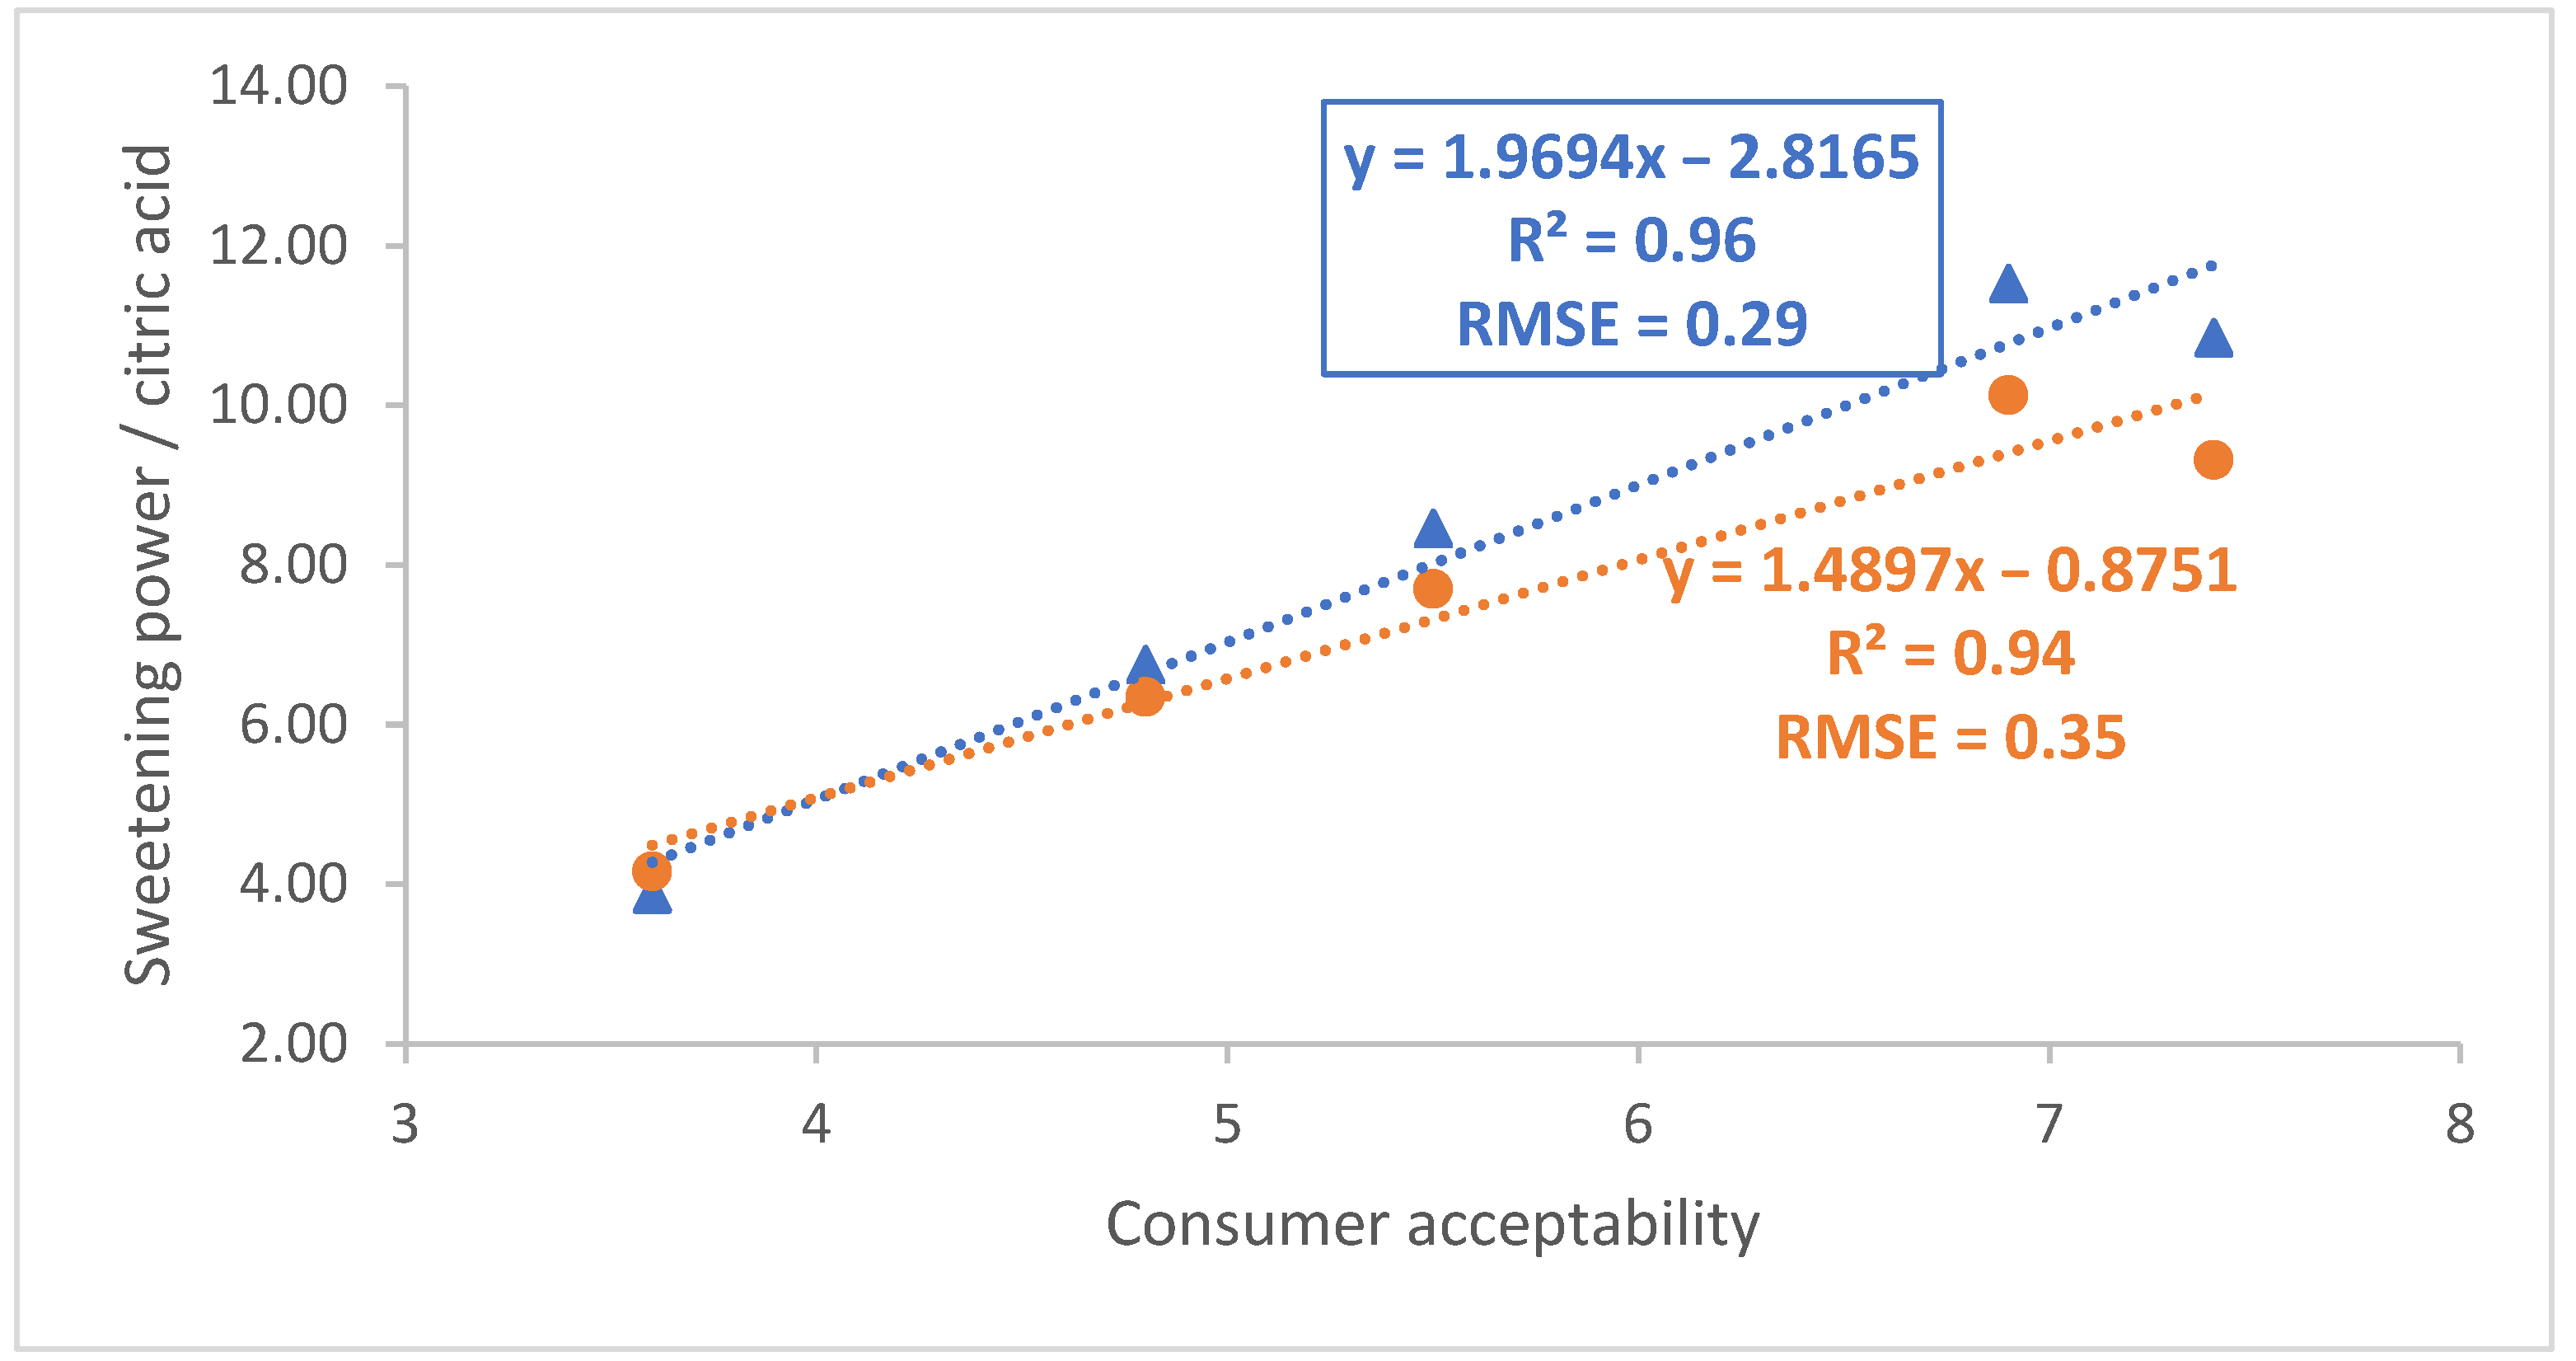
It is then possible to study the correlation between the acceptability of the mandarin samples determined by consumers and the sweetening power/citric acid ratio obtained using the 60 and 400 MHz systems (Figure 3). Using this set of data, a linear regression model with an R2 of 0.94 and an RMSE of 0.35 was obtained using data recorded at 400 MHz. The corresponding regression parameters of the linear model derived using sugar and citric acid concentrations determined with the 60 MHz instrument were 0.96 and 0.29, indicating that acceptability prediction models of similar quality were obtained regardless of the instrument employed in their development.
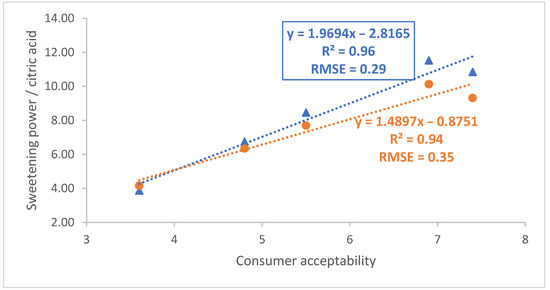
Figure 3.
Correlation between consumer acceptability and sweetening power/citric acid determined using 60 and 400 MHz data (blue triangles and orange circles, respectively).
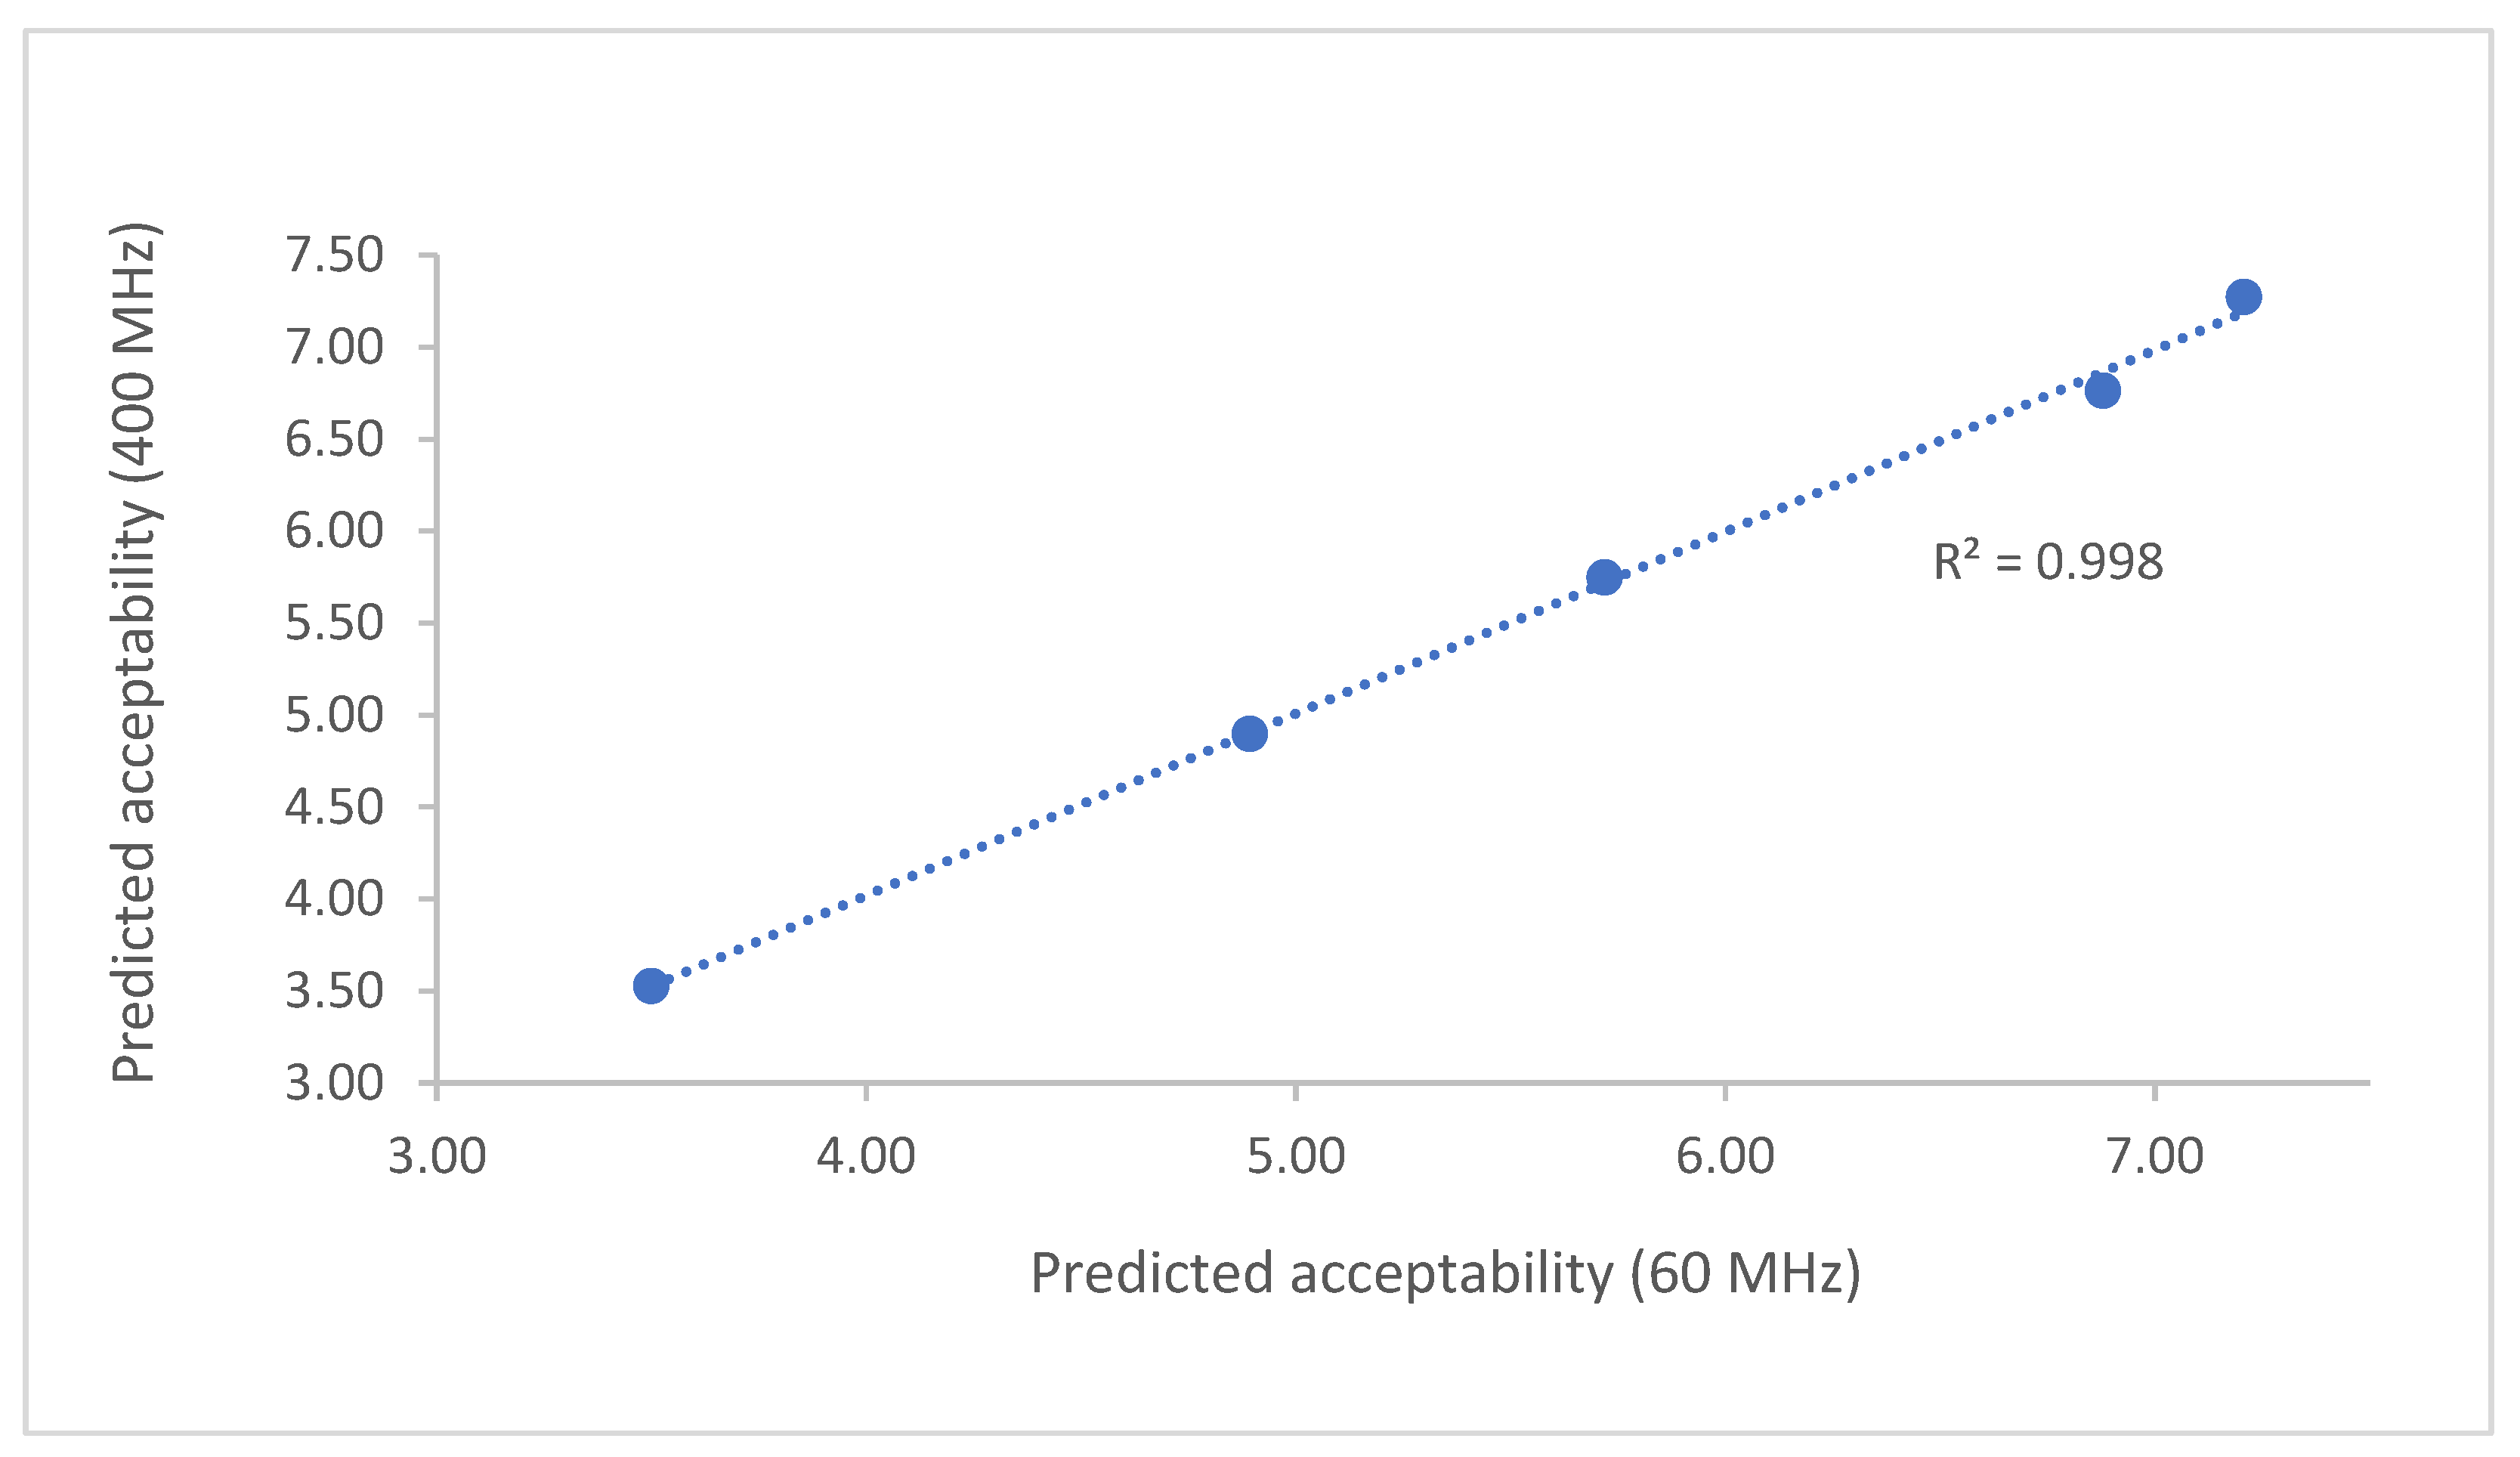
In addition, the correlation between the predicted acceptability using both models was very high (R2 > 0.99), further proving the equivalence of the models derived from the two instrumental systems (Figure 4).
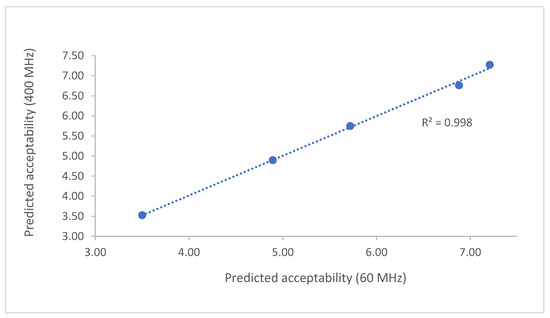
Figure 4.
Correlation of the predicted acceptability using the models obtained with both instruments.
It is worth pointing out that although models derived from data at 400 and 60 MHz are of the same predictive quality, special attention is needed when identifying and integrating data in the low-field instrument. As stated earlier and shown in Figure 1, there is considerable signal overlap in the 3.00 to 4.30 ppm region and expertise is required to assign peaks and process these spectra accurately.
Conversely, and due to the lower resolution of low-field instruments, the variations in the chemical shifts of sugar signals with pH have less impact on spectra recorded at 60 MHz [30]. This makes spectral referencing and alignment simpler in these instruments.
4. Conclusions
As demonstrated above, low-field NMR systems can be employed in the development of consumer acceptability prediction models that have identical quality to those derived from high-field NMR data. The lower purchase and running costs of benchtop spectrometers makes these chemometric-based tools more accessible for routine inclusion in fruit breeding programs, such as the Uruguayan Programa Nacional de Investigación en Producción Citrícola. Furthermore, the continuing advances in benchtop NMR instruments, which include the implementation pure shift pulse sequences, solvent suppression techniques, and multidimensional and multinuclear methods, will facilitate their application to other fields of food analysis and metabolomics.
Author Contributions
Conceptualization, S.D.K. and H.H.; methodology, I.M.; formal analysis, I.M.; investigation, I.M.; resources, F.R. and S.D.K.; data curation, I.M.; writing—original draft preparation, I.M.; writing—review and editing, G.M., S.D.K. and H.H.; visualization, I.M.; supervision, G.M., S.D.K., H.H.; project administration, S.D.K. and H.H.; funding acquisition, S.D.K. All authors have read and agreed to the published version of the manuscript.
Funding
This research was funded by the International Atomic Energy Agency (IAEA, award CRP D52042, “Implementation of Nuclear Techniques for Authentication of Foods with High-Value Labelling Claims”) and the Agencia Nacional de Investigación e Innovación (ANII, award POS_NAC_2020_1_164240, “Estudio de Perfiles Metabólicos como Herramienta para la Caracterización de Mezclas de Compuestos Bioactivos”). The APC was covered by IAEA and the Programa de Desarrollo de las Ciencias Básicas (PEDECIBA).
Institutional Review Board Statement
Not applicable.
Informed Consent Statement
Not applicable.
Data Availability Statement
The data presented in this study are available on request from the corresponding author.
Acknowledgments
The authors would like to thank the staff at INIA Salto Grande and Área de Evaluación Sensorial (Departamento de Ciencia y Tecnología de Alimentos (CYTAL), Facultad de Química, Universidad de la República).
Conflicts of Interest
The authors declare no conflict of interest.
References
- Freeman, R.; Robert, J.B. A Brief History of High Resolution NMR BT—NMR at Very High Field; Robert, J.B., Ed.; Springer: Berlin/Heidelberg, Germany, 1991; pp. 1–16. [Google Scholar]
- Blümich, B. Low-field and benchtop NMR. J. Magn. Reson. 2019, 306, 27–35. [Google Scholar] [CrossRef]
- Giberson, J.; Scicluna, J.; Legge, N.; Longstaffe, J. Chapter Three—Developments in benchtop NMR spectroscopy 2015–2020. Annu. Rep. NMR Spectrosc. 2021, 102, 153–246. [Google Scholar]
- Halse, M.E. Perspectives for hyperpolarisation in compact NMR. TrAC Trends Anal. Chem. 2016, 83, 76–83. [Google Scholar] [CrossRef] [Green Version]
- Kunjir, S.; Rodriguez-Zubiri, M.; Coeffard, V.; Felpin, F.-X.; Giraudeau, P.; Farjon, J. Merging Gradient-Based Methods to Improve Benchtop NMR Spectroscopy: A New Tool for Flow Reaction Optimization. ChemPhysChem 2020, 21, 2311–2319. [Google Scholar] [CrossRef]
- van Beek, T.A. Low-field benchtop NMR spectroscopy: Status and prospects in natural product analysis. Phytochem. Anal. 2021, 32, 24–37. [Google Scholar] [CrossRef] [PubMed] [Green Version]
- Kent, J.E.; Bell, N.G.A. Molecular Properties of Caffeine Explored by NMR: A Benchtop NMR Experiment for Undergraduate Physical-Chemistry Laboratories. J. Chem. Educ. 2019, 96, 786–791. [Google Scholar] [CrossRef]
- Lee, Y.; Matviychuk, Y.; Holland, D.J. Quantitative analysis using external standards with a benchtop NMR spectrometer. J. Magn. Reson. 2020, 320, 106826. [Google Scholar] [CrossRef] [PubMed]
- Araneda, J.F.; Mendonça Barbosa, T.; Hui, P.; Leclerc, M.C.; Ma, J.; Maier, A.F.G.; Riegel, S.D. Incorporating Benchtop NMR Spectrometers in the Undergraduate Lab: Understanding Resolution and Circumventing Second-Order Effects. J. Chem. Educ. 2021, 98, 1227–1232. [Google Scholar] [CrossRef]
- Araneda, J.F.; Chu, T.; Leclerc, M.C.; Riegel, S.D.; Spingarn, N. Quantitative analysis of cannabinoids using benchtop NMR instruments. Anal. Methods 2020, 12, 4853–4857. [Google Scholar] [CrossRef]
- Assemat, G.; Balayssac, S.; Gerdova, A.; Gilard, V.; Caillet, C.; Williamson, D.; Malet-Martino, M. Benchtop low-field 1H Nuclear Magnetic Resonance for detecting falsified medicines. Talanta 2019, 196, 163–173. [Google Scholar] [CrossRef] [PubMed]
- Keizers, P.H.J.; Bakker, F.; Ferreira, J.; Wackers, P.F.K.; van Kollenburg, D.; van der Aa, E.; van Beers, A. Benchtop NMR spectroscopy in the analysis of substandard and falsified medicines as well as illegal drugs. J. Pharm. Biomed. Anal. 2020, 178, 112939. [Google Scholar] [CrossRef]
- Isaac-Lam, M.F. Determination of alcohol content in alcoholic beverages using 45 MHz benchtop NMR spectrometer. Int. J. Spectrosc. 2016, 2016, 2526946. [Google Scholar] [CrossRef] [PubMed]
- Defernez, M.; Wren, E.; Watson, A.D.; Gunning, Y.; Colquhoun, I.J.; Le Gall, G.; Williamson, D.; Kemsley, E.K. Low-field 1H NMR spectroscopy for distinguishing between arabica and robusta ground roast coffees. Food Chem. 2017, 216, 106–113. [Google Scholar] [CrossRef] [PubMed] [Green Version]
- Sobolev, P.A.; Mannina, L.; Proietti, N.; Carradori, S.; Daglia, M.; Giusti, M.A.; Antiochia, R.; Capitani, D. Untargeted NMR-Based Methodology in the Study of Fruit Metabolites. Molecules 2015, 20, 4088–4108. [Google Scholar] [CrossRef] [PubMed] [Green Version]
- Gunning, Y.; Jackson, A.J.; Colmer, J.; Taous, F.; Philo, M.; Brignall, R.M.; El Ghali, T.; Defernez, M.; Kemsley, E.K. High-throughput screening of argan oil composition and authenticity using benchtop 1H NMR. Magn. Reson. Chem. 2020, 58, 1177–1186. [Google Scholar] [PubMed] [Green Version]
- Gunning, Y.; Taous, F.; El Ghali, T.; Gibbon, J.D.; Wilson, E.; Brignall, R.M.; Kemsley, E.K. Mitigating instrument effects in 60 MHz 1H NMR spectroscopy for authenticity screening of edible oils. Food Chem. 2022, 370, 131333. [Google Scholar] [CrossRef]
- Sobolev, A.P.; Thomas, F.; Donarski, J.; Ingallina, C.; Circi, S.; Marincola, F.C.; Capitani, D.; Mannina, L. Use of NMR applications to tackle future food fraud issues. Trends Food Sci. Technol. 2019, 91, 347–353. [Google Scholar] [CrossRef] [Green Version]
- Antonelo, D.S.; Cônsolo, N.R.B.; Gómez, J.F.M.; Beline, M.; Pavan, B.; Souza, C.; Goulart, R.S.; Colnago, L.A.; Silva, S.L. NMR-based metabolomics to assess metabolites correlated with beef sensory properties. In Proceedings of the 65th International Congress of Meat Science and Technology, Berlin, Germany, 4–9 August 2019; pp. 801–803. [Google Scholar]
- Muroya, S.; Ueda, S.; Komatsu, T.; Miyakawa, T.; Ertbjerg, P. MEATabolomics: Muscle and meat metabolomics in domestic animals. Metabolites 2020, 10, 188. [Google Scholar] [CrossRef] [PubMed]
- Pavagadhi, S.; Swarup, S. Metabolomics for evaluating flavor-associated metabolites in plant-based products. Metabolites 2020, 10, 197. [Google Scholar] [CrossRef] [PubMed]
- Hatzakis, E. Nuclear Magnetic Resonance (NMR) Spectroscopy in Food Science: A Comprehensive Review. Compr. Rev. Food Sci. Food Saf. 2019, 18, 189–220. [Google Scholar] [CrossRef] [Green Version]
- Salvino, R.A.; Colella, M.F.; De Luca, G. NMR-based metabolomics analysis of Calabrian citrus fruit juices and its application to industrial process quality control. Food Control 2021, 121, 107619. [Google Scholar] [CrossRef]
- Cirillo, A.; Magri, A.; Scognamiglio, M.; D’Abrosca, B.; Fiorentino, A.; Petriccione, M.; Di Vaio, C. Evaluation of Morphological, Qualitative, and Metabolomic Traits during Fruit Ripening in Pomegranate (Punica granatum L.). Horticulturae 2022, 8, 384. [Google Scholar] [CrossRef]
- Migues, I.; Hodos, N.; Moltini, A.I.; Gámbaro, A.; Rivas, F.; Moyna, G.; Heinzen, H. 1H NMR metabolic profiles as selection tools of new mandarin cultivars based on fruit acceptability. Sci. Hortic. 2021, 287, 110262. [Google Scholar] [CrossRef]
- Castaing-Cordier, T.; Ladroue, V.; Besacier, F.; Bulete, A.; Jacquemin, D.; Giraudeau, P.; Farjon, J. High-field and benchtop NMR spectroscopy for the characterization of new psychoactive substances. Forensic Sci. Int. 2021, 321, 110718. [Google Scholar] [CrossRef] [PubMed]
- Alamprese, C. Food Authentication. In Spectroscopic Methods in Food Analysis; Franca, A.S., Nollet, L.M.L., Eds.; CRC Press: Miami, FL, USA, 2018; pp. 327–352. [Google Scholar]
- Schiffman, S.S.; Booth, B.J.; Losee, M.L.; Pecore, S.D.; Warwick, Z.S. Bitterness of sweeteners as a function of concentration. Brain Res. Bull. 1995, 36, 505–513. [Google Scholar] [CrossRef]
- Stampanoni, C.R. Influence of acid and sugar content on sweetness, sourness and the flavour profile of beverages and sherbets. Food Qual. Prefer. 1993, 4, 169–176. [Google Scholar] [CrossRef]
- Matviychuk, Y.; Yeo, J.; Holland, D.J. A field-invariant method for quantitative analysis with benchtop NMR. J. Magn. Reson. 2019, 298, 35–47. [Google Scholar] [CrossRef]
Publisher’s Note: MDPI stays neutral with regard to jurisdictional claims in published maps and institutional affiliations. |
© 2022 by the authors. Licensee MDPI, Basel, Switzerland. This article is an open access article distributed under the terms and conditions of the Creative Commons Attribution (CC BY) license (https://creativecommons.org/licenses/by/4.0/).