
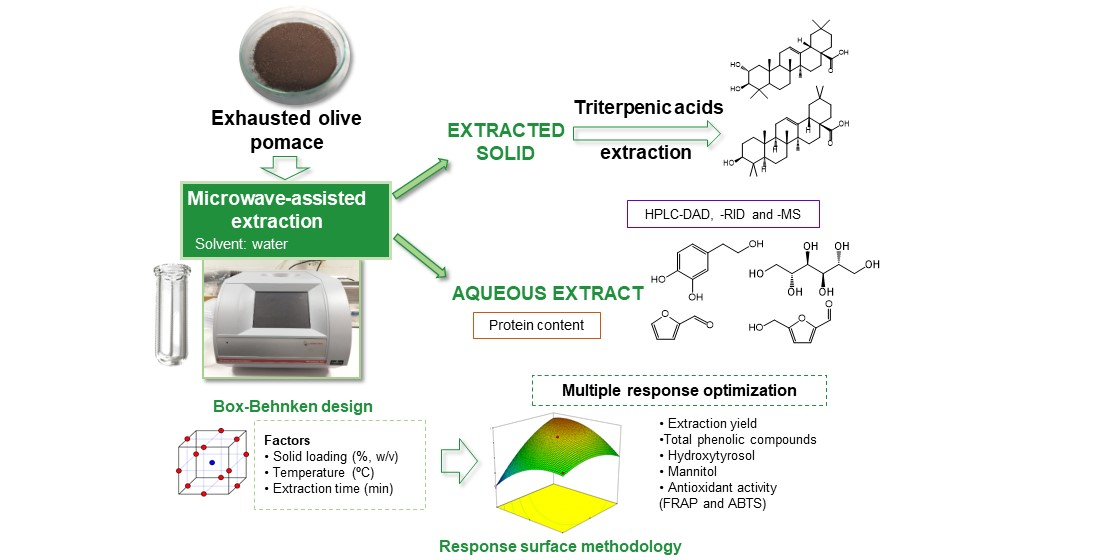
Optimization of Microwave-Assisted Water Extraction to Obtain High Value-Added Compounds from Exhausted Olive Pomace in a Biorefinery Context

 ,
,  ,
,  and
and
Abstract
: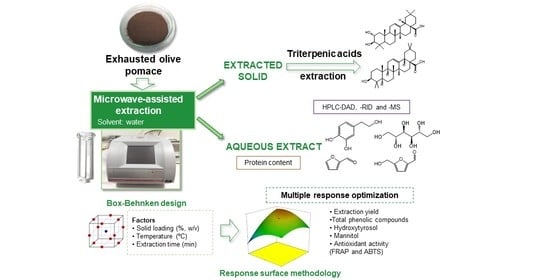
1. Introduction
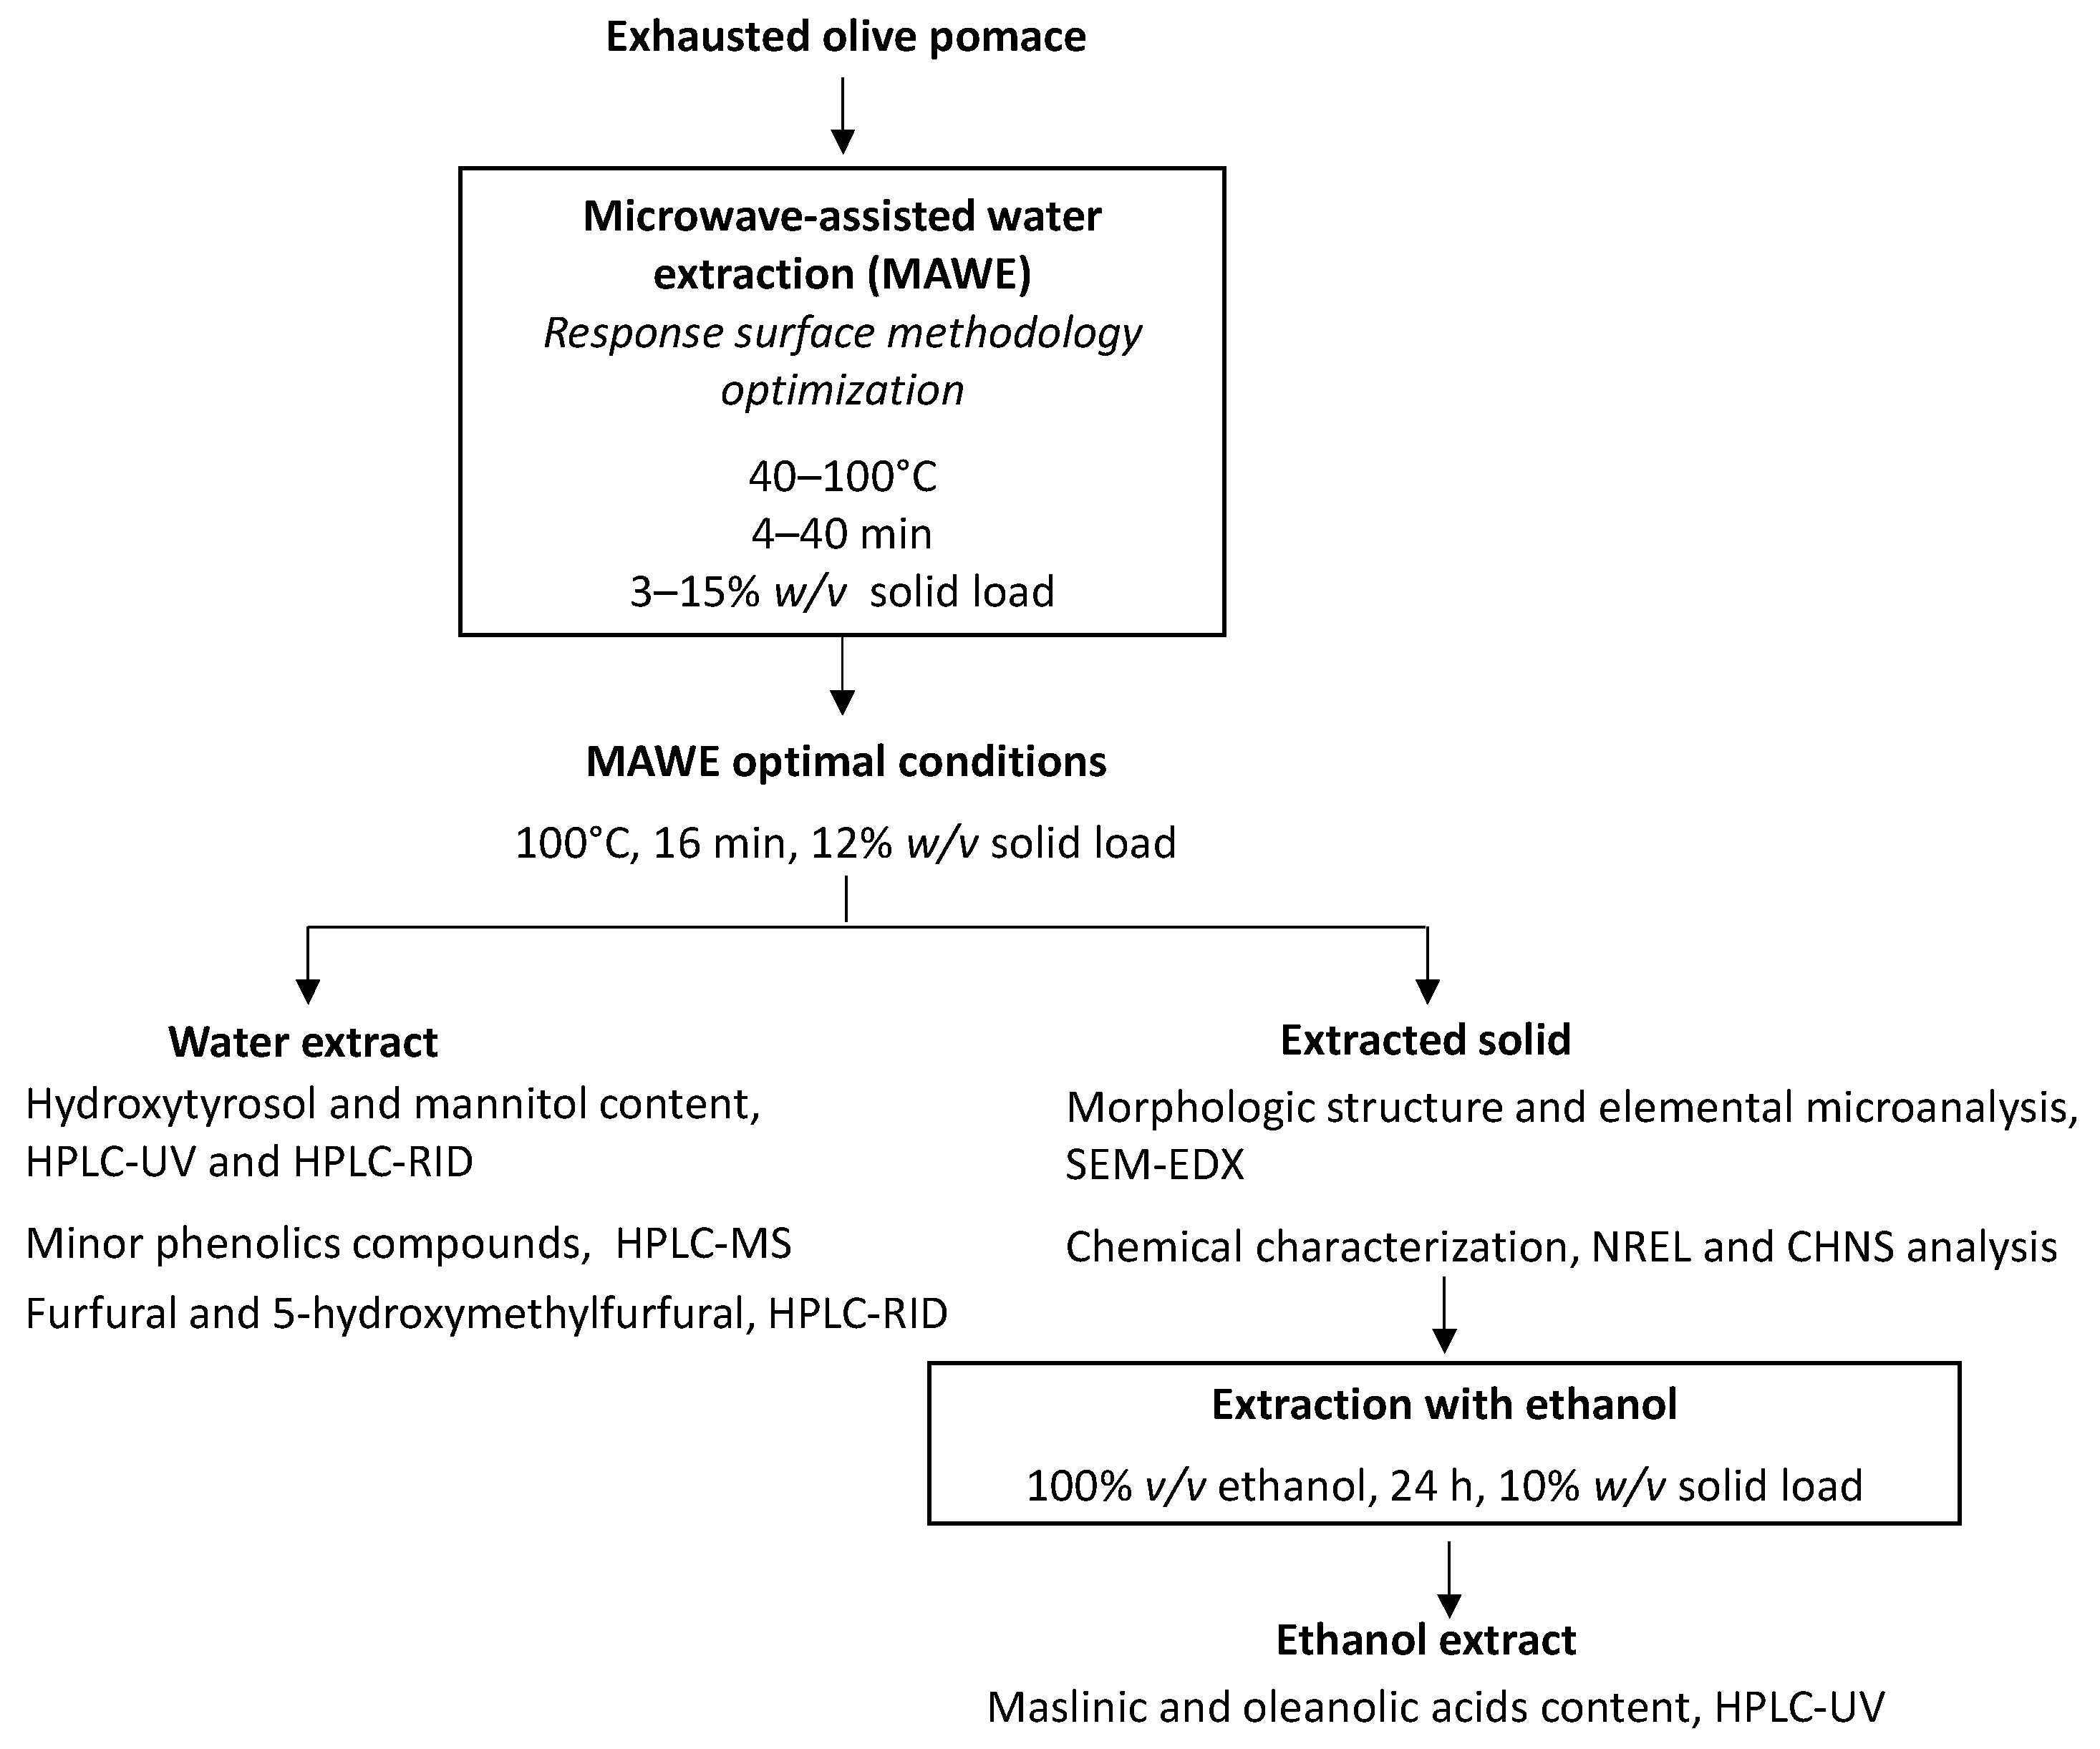
2. Materials and Methods
2.1. Biomass
2.2. Methodology
2.3. Experimental Design and Optimization of MAWE
2.4. Characterisation of the MAWE Extracts
2.4.1. Total Phenolic Content (TPC) and Antioxidant Properties of the Extracts
2.4.2. Liquid Chromatography of Phenolic Compounds and Mannitol
2.4.3. Analysis of the Protein
2.4.4. Analysis of Furfural and Hydroxymethylfurfural
2.5. Characterization of the Extracted EOP Solid after MAWE
2.6. Extraction and Analysis of Triterpenic Acids
2.7. Statistical Analysis
3. Results
3.1. MAWE Extraction of EOP and Model Equations
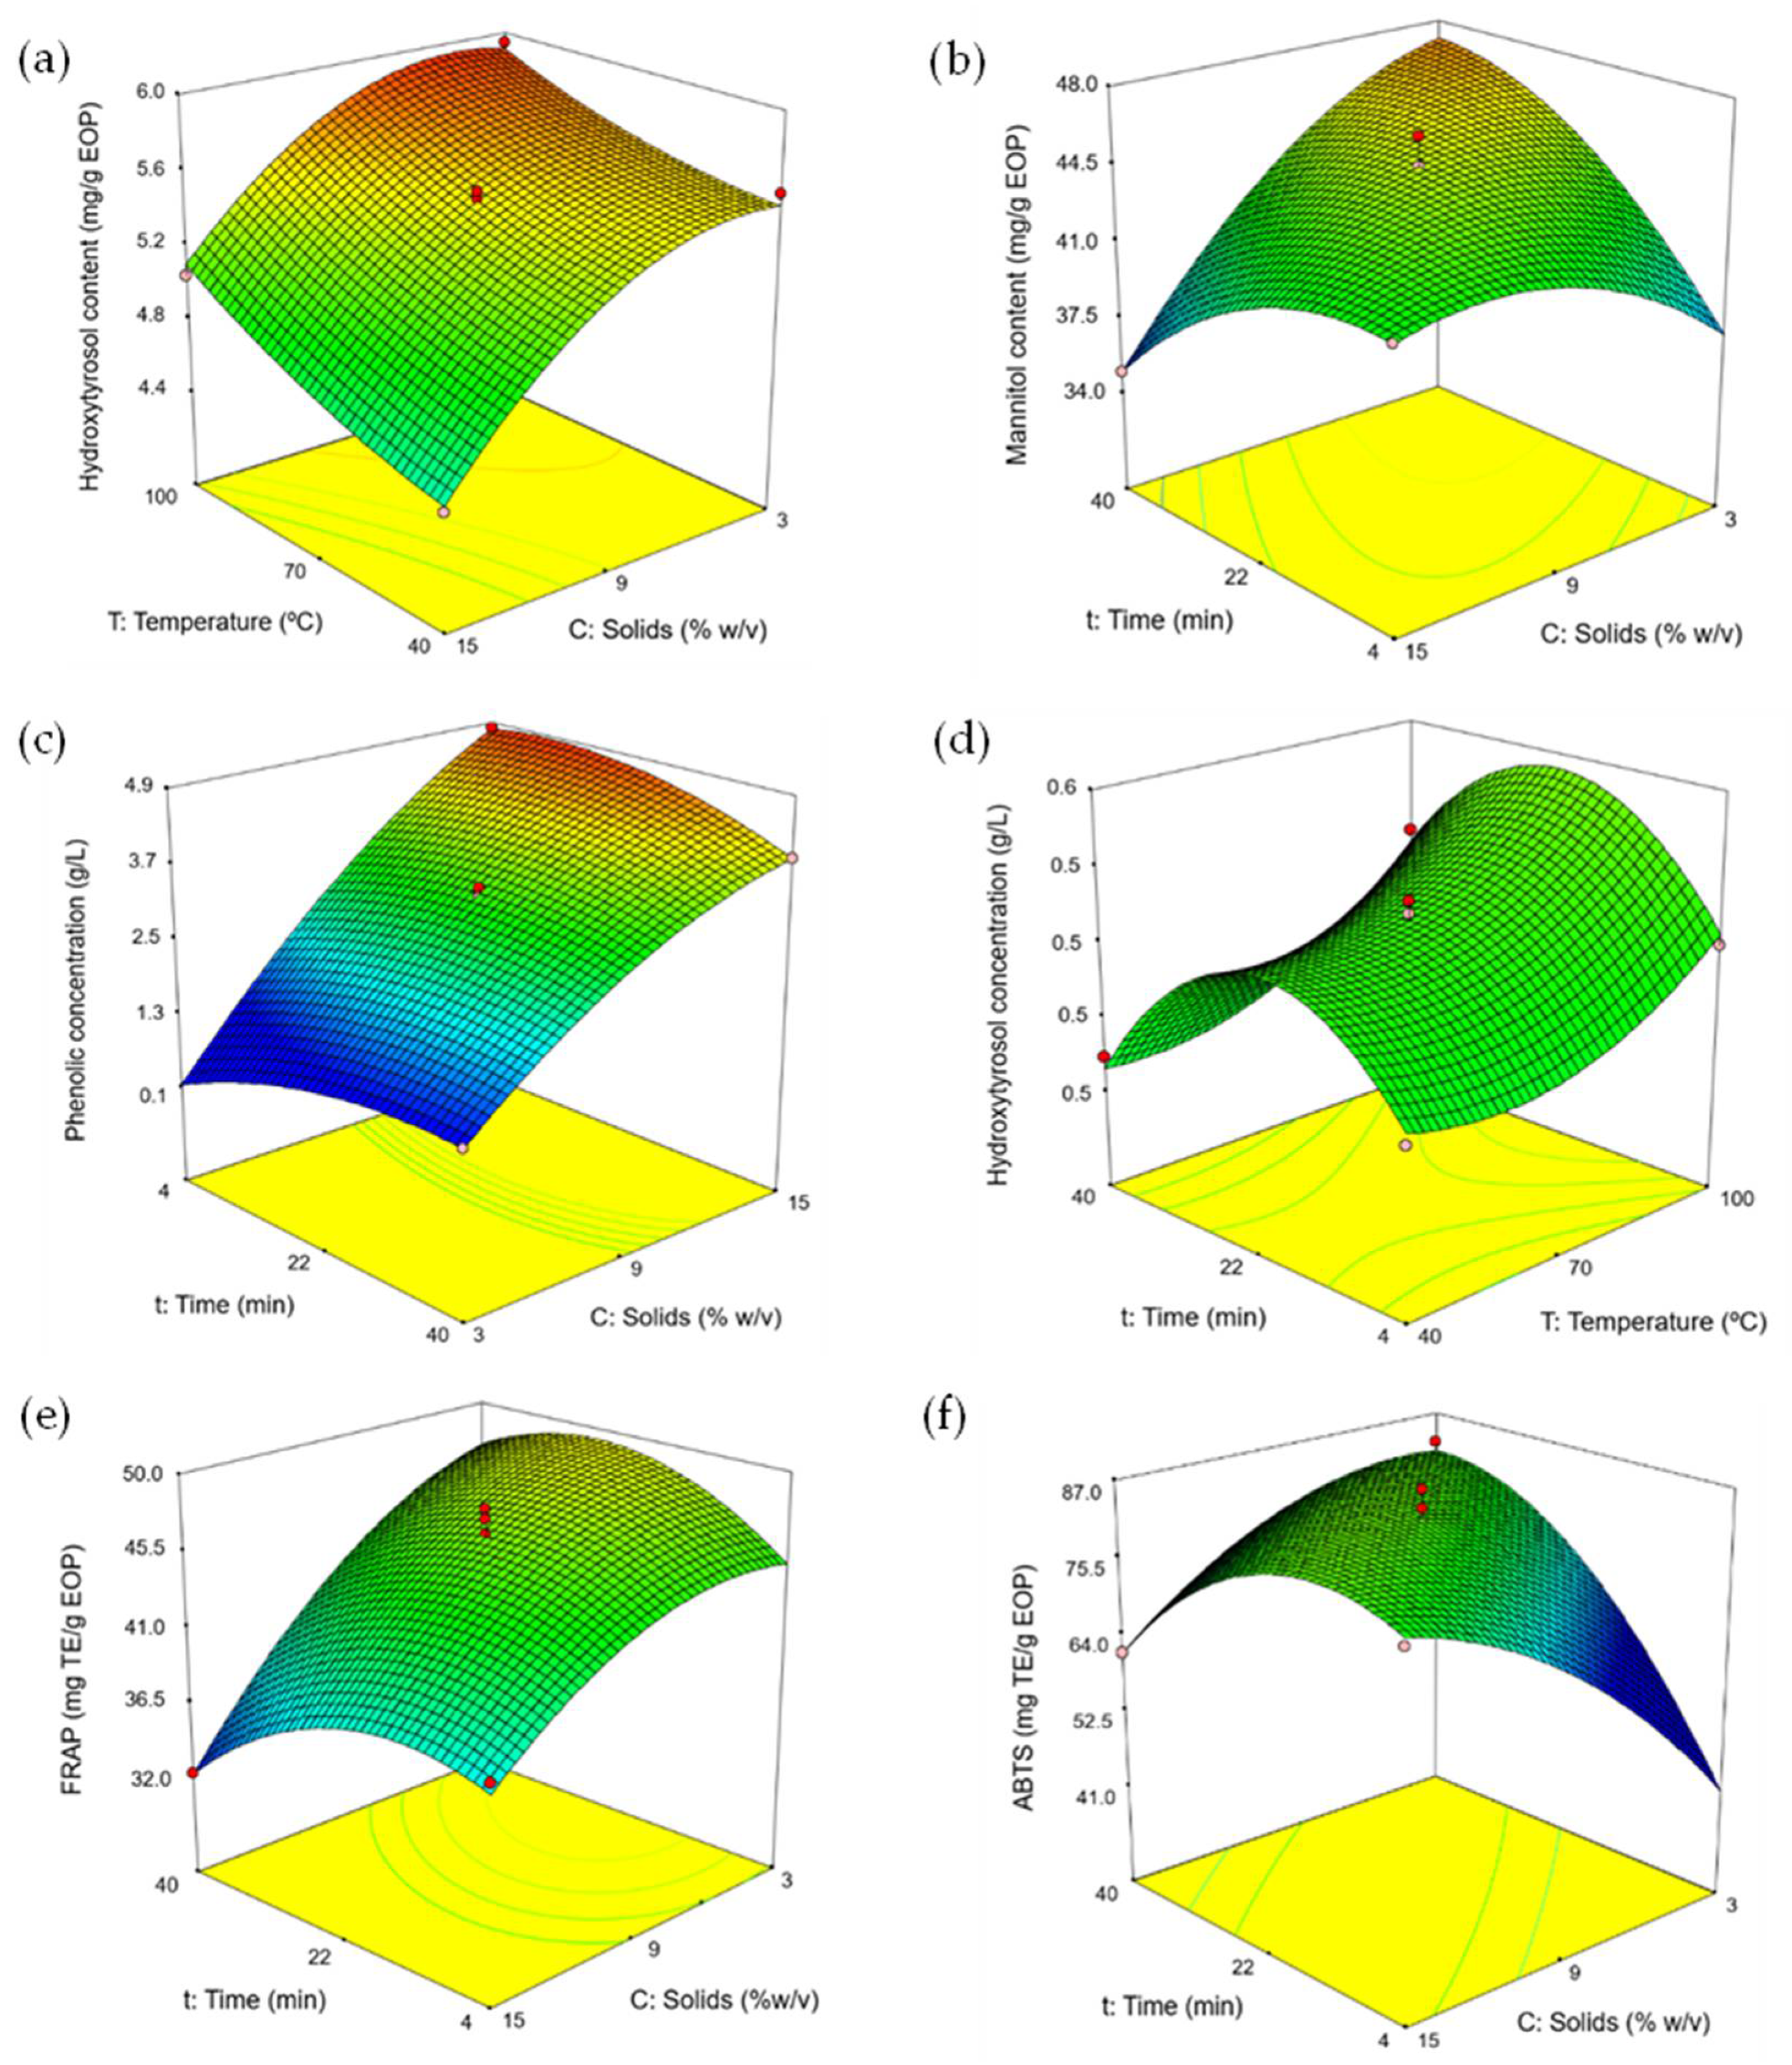
3.2. Effect of the MAWE Parameters on the Yield and Biocompounds
3.3. Optimization of the Extraction Parameters
3.4. Profiles and Standardization
3.5. Protein Solubilized in the EOP Extracts
3.6. Furfural and Hydroxymethylfurfural Amount in the EOP Extracts
3.7. Characterization of the EOP Solid after MAWE
3.7.1. Chemical and Elemental Characterization
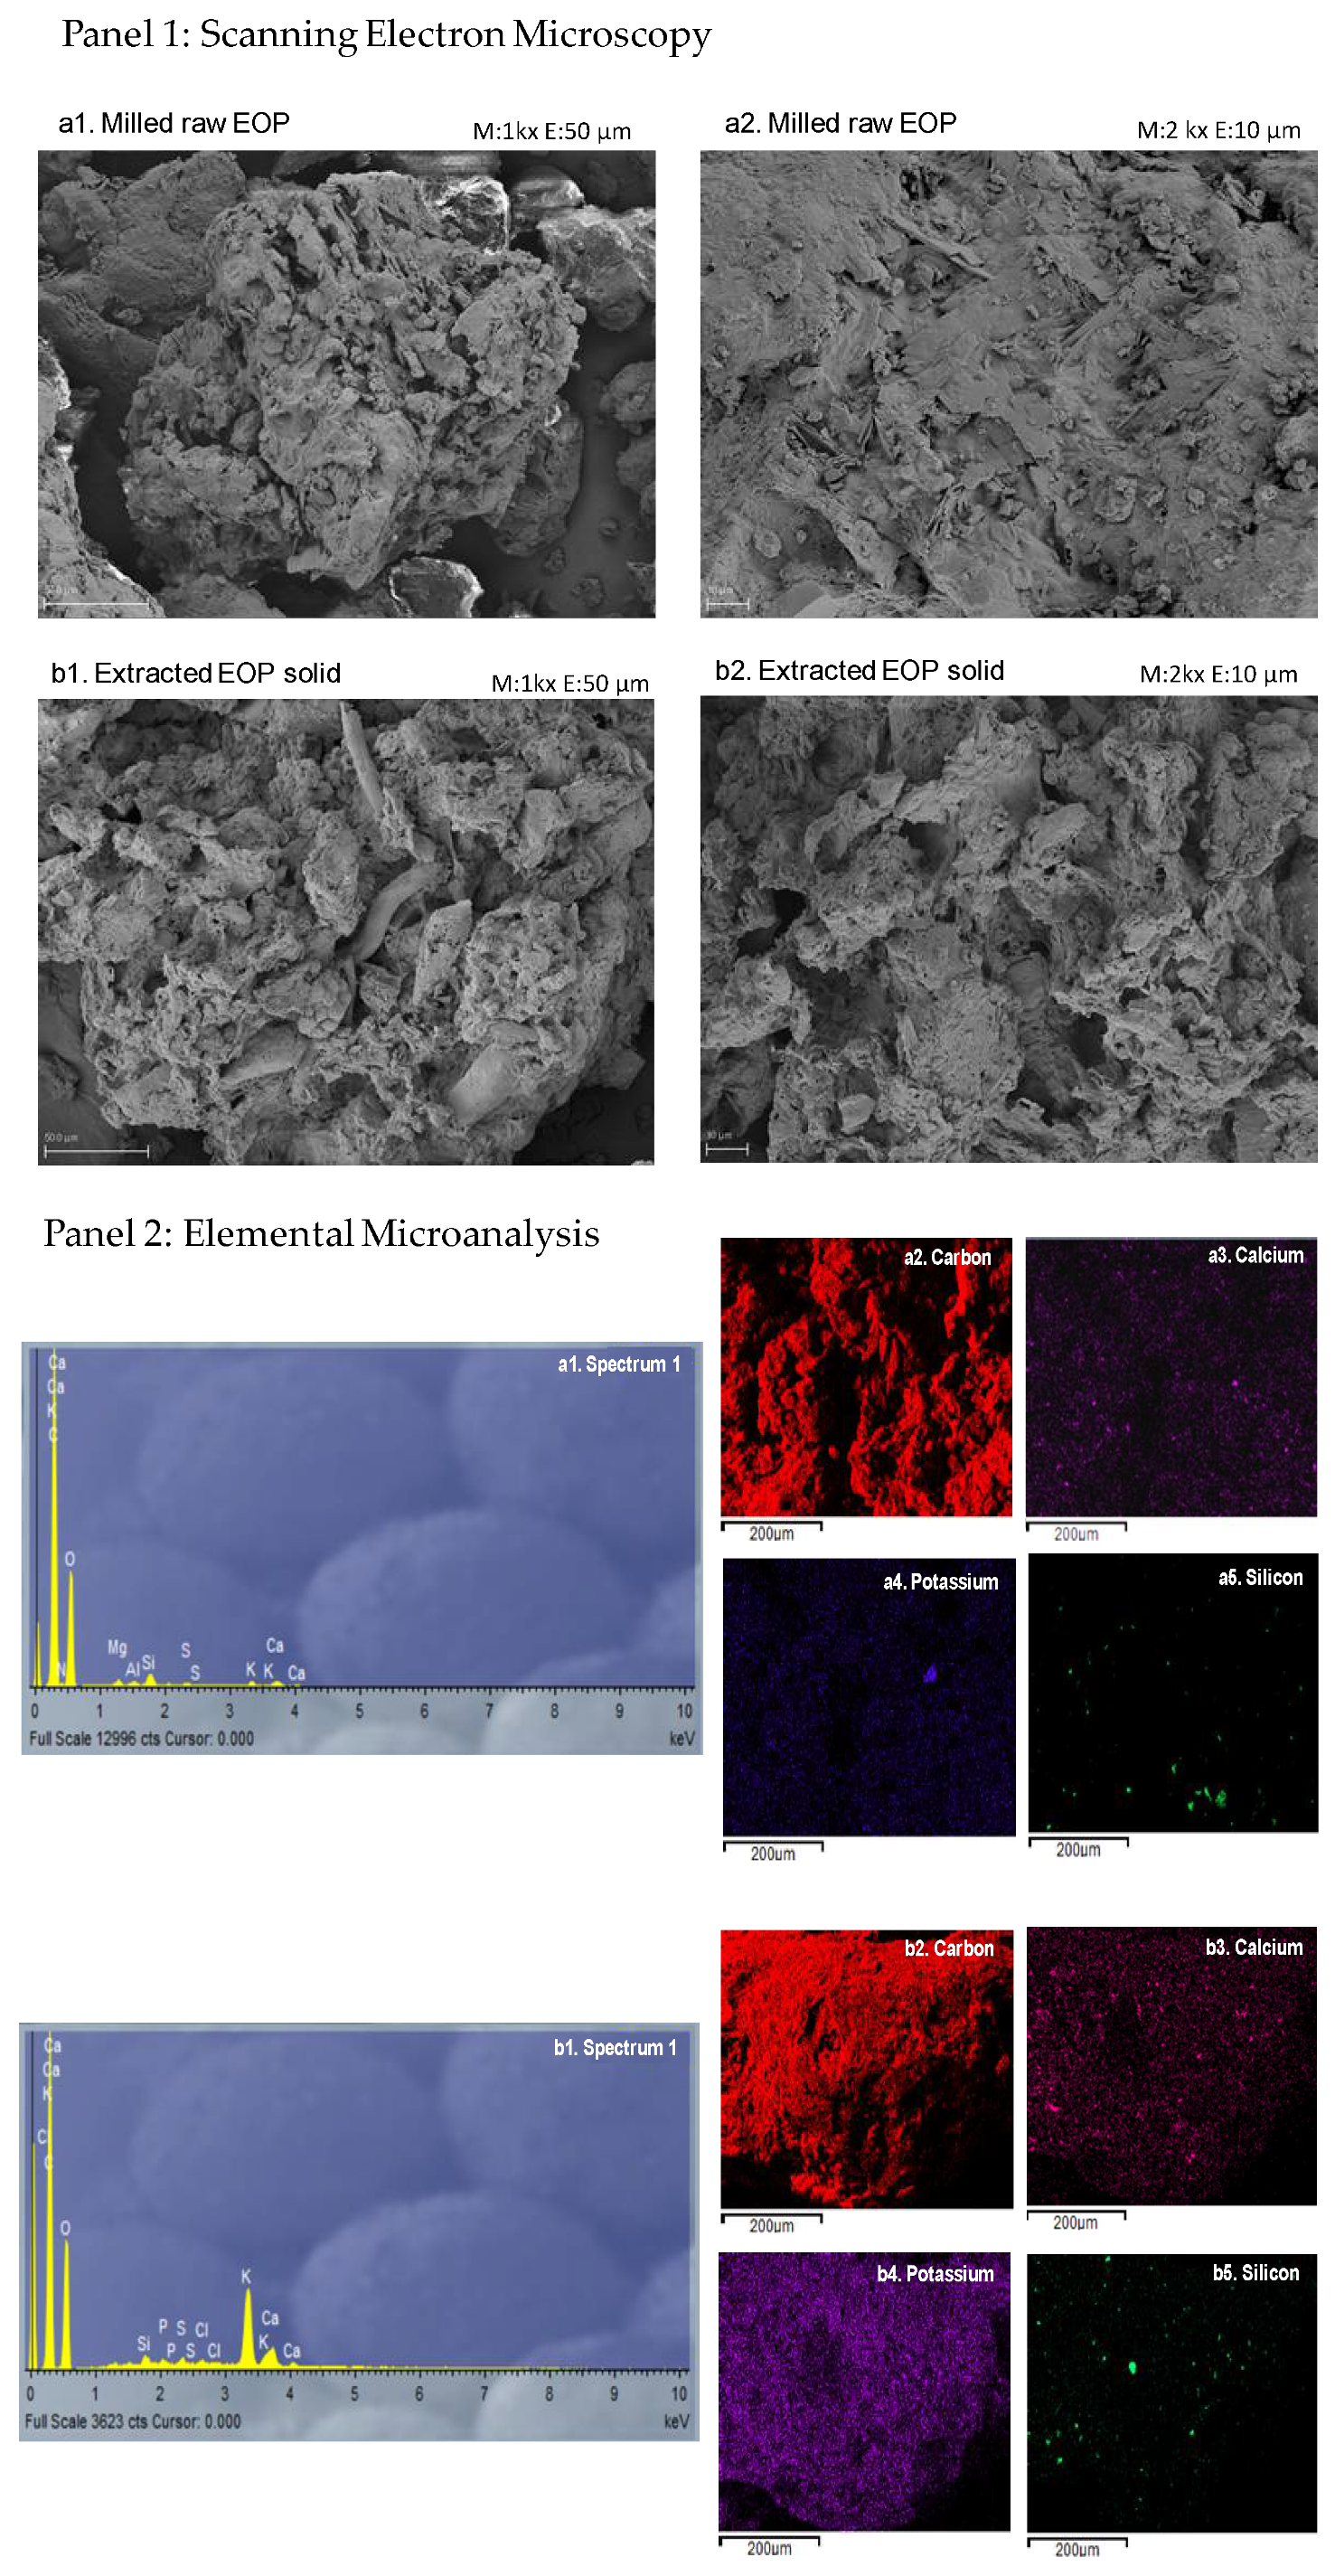
3.7.2. Scanning Electron Microscopy and Elemental Microanalysis
3.8. Ethanolic Extraction of Triterpenic Acids
4. Conclusions
Supplementary Materials
Author Contributions
Funding
Informed Consent Statement
Data Availability Statement
Acknowledgments
Conflicts of Interest
References
- Ben Saad, A.; Jerbi, A.; Khlif, I.; Ayedi, M.; Allouche, N. Stabilization of refined olive oil with phenolic monomers fraction and purified hydroxytyrosol from olive mill wastewater. Chem. Afr. 2020, 3, 657–665. [Google Scholar] [CrossRef]
- Luzi, F.; Pannucci, E.; Clemente, M.; Grande, E.; Urciuoli, S.; Romani, A.; Torre, L.; Puglia, D.; Bernini, R.; Santi, L. Hydroxytyrosol and oleuropein-enriched extracts obtained from olive oil wastes and by-products as active antioxidant ingredients for poly (Vinyl alcohol)-based films. Molecules 2021, 26, 2104. [Google Scholar] [CrossRef] [PubMed]
- EFSA Panel on Dietetic Products, Nutrition and Allergies (NDA); Turck, D.; Bresson, J.; Burlingame, B.; Dean, T.; Fairweather-Tait, S.; Heinonen, M.; Hirsch-Ernst, K.I.; Mangelsdorf, I. Safety of hydroxytyrosol as a novel food pursuant to Regulation (EC) No 258/97. EFSA J. 2017, 15, 4728. [Google Scholar] [CrossRef]
- Robles-Almazan, M.; Pulido-Moran, M.; Moreno-Fernandez, J.; Ramirez-Tortosa, C.; Rodriguez-Garcia, C.; Quiles, J.L.; Ramirez-Tortosa, M.C. Hydroxytyrosol: Bioavailability, toxicity, and clinical applications. Food Res. Int. 2018, 105, 654–667. [Google Scholar] [CrossRef] [PubMed]
- Britton, J.; Davis, R.; O’Connor, K.E. Chemical, physical and biotechnological approaches to the production of the potent antioxidant hydroxytyrosol. Appl. Microbiol. Biotechnol. 2019, 103, 5957–5974. [Google Scholar] [CrossRef]
- CBI. What Is the Demand for Natural Food Additives on the European Market? Available online: https://www.cbi.eu/market-information/natural-food-additives/what-demand (accessed on 8 October 2021).
- Gómez-Cruz, I.; Cara, C.; Romero, I.; Castro, E.; Gullón, B. Valorisation of exhausted olive pomace by an ecofriendly solvent extraction process of natural antioxidants. Antioxidants 2020, 9, 1010. [Google Scholar] [CrossRef]
- Gómez-Cruz, I.; Contreras, M.D.M.; Romero, I.; Castro, E. Sequential extraction of hydroxytyrosol, mannitol and triterpenic acids using a green optimized procedure based on ultrasound. Antioxidants 2021, 10, 1781. [Google Scholar] [CrossRef]
- Gómez-Cruz, I.; Contreras, M.D.M.; Carvalheiro, F.; Duarte, L.C.; Roseiro, L.B.; Romero, I.; Castro, E. Recovery of bioactive compounds from industrial exhausted olive pomace through ultrasound-assisted extraction. Biology 2021, 10, 514. [Google Scholar] [CrossRef]
- Contreras, M.D.M.; Gómez-Cruz, I.; Romero, I.; Castro, E. Olive pomace-derived biomasses fractionation through a two-step extraction based on the use of ultrasounds: Chemical characteristics. Foods 2021, 10, 111. [Google Scholar] [CrossRef]
- Doménech, P.; Duque, A.; Higueras, I.; Fernández, J.L.; Manzanares, P. Analytical characterization of water-soluble constituents in olive-derived by-products. Foods 2021, 10, 1299. [Google Scholar] [CrossRef]
- Martău, G.A.; Coman, V.; Vodnar, D.C. Recent advances in the biotechnological production of erythritol and mannitol. Crit. Rev. Biotechnol. 2020, 40, 608–622. [Google Scholar] [CrossRef] [PubMed]
- Kırbaşlar, Ş.İ.; Şahin, S. Recovery of bioactive ingredients from biowaste of olive tree (Olea europaea) using microwave-assisted extraction: Acomparative study. Biomass Convers. Biorefin. 2021. [Google Scholar] [CrossRef]
- Da Rosa, G.S.; Vanga, S.K.; Gariepy, Y.; Raghavan, V. Comparison of microwave, ultrasonic and conventional techniques for extraction of bioactive compounds from olive leaves (Olea europaea L.). Innov. Food Sci. Emerg. Technol. 2019, 58, 102234. [Google Scholar] [CrossRef]
- Da Silva, L.C.; Viganó, J.; de Souza Mesquita, L.M.; Dias, A.L.B.; de Souza, M.C.; Sanches, V.L.; Chaves, J.O.; Pizani, R.S.; Contieri, L.S.; Rostagno, M.A. Recent advances and trends in extraction techniques to recover polyphenols compounds from apple by-products. Food Chem. X 2021, 12, 100133. [Google Scholar] [CrossRef] [PubMed]
- Flórez, N.; Conde, E.; Domínguez, H. Microwave assisted water extraction of plant compounds. J. Chem. Technol. Biotechnol. 2015, 90, 590–607. [Google Scholar] [CrossRef]
- Biomass Compositional Analysis Laboratory Procedures. Available online: https://www.nrel.gov/bioenergy/biomass-compositional-analysis.html (accessed on 23 May 2020).
- Gómez-Cruz, I.; Contreras, M.D.M.; Romero, I.; Castro, E. A biorefinery approach to obtain antioxidants, lignin and sugars from exhausted olive pomace. J. Ind. Eng. Chem. 2021, 96, 356–363. [Google Scholar] [CrossRef]
- Lama-Muñoz, A.; Contreras, M.D.M.; Espínola, F.; Moya, M.; Romero, I.; Castro, E. Content of phenolic compounds and mannitol in olive leaves extracts from six Spanish cultivars: Extraction with the Soxhlet method and pressurized liquids. Food Chem. 2020, 320, 126626. [Google Scholar] [CrossRef]
- Fernandez-Pastor, I.; Fernandez-Hernandez, A.; Perez-Criado, S.; Rivas, F.; Martinez, A.; Garcia-Granados, A.; Parra, A. Microwave-assisted extraction versus Soxhlet extraction to determine triterpene acids in olive skins. J. Sep. Sci. 2017, 40, 1209–1217. [Google Scholar] [CrossRef]
- Vu, H.T.; Scarlett, C.J.; Vuong, Q.V. Maximising recovery of phenolic compounds and antioxidant properties from banana peel using microwave assisted extraction and water. J. Food Sci. Technol. 2019, 56, 1360–1370. [Google Scholar] [CrossRef]
- Ghoreishi, S.M.; Shahrestani, R.G. Subcritical water extraction of mannitol from olive leaves. J. Food Eng. 2009, 93, 474–481. [Google Scholar] [CrossRef] [Green Version]
- Tapia-Quirós, P.; Montenegro-Landívar, M.F.; Reig, M.; Vecino, X.; Alvarino, T.; Cortina, J.L.; Saurina, J.; Granados, M. Olive mill and winery wastes as viable sources of bioactive compounds: A study on polyphenols recovery. Antioxidants 2020, 9, 1074. [Google Scholar] [CrossRef] [PubMed]
- Singh, A.; Nair, G.R.; Liplap, P.; Gariepy, Y.; Orsat, V.; Raghavan, V. Effect of dielectric properties of a solvent-water mixture used in microwave-assisted extraction of antioxidants from potato peels. Antioxidants 2014, 3, 99–113. [Google Scholar] [CrossRef] [PubMed]
- Manzanares, P.; Ballesteros, I.; Negro, M.J.; González, A.; Oliva, J.M.; Ballesteros, M. Processing of extracted olive oil pomace residue by hydrothermal or dilute acid pretreatment and enzymatic hydrolysis in a biorefinery context. Renew. Energy 2020, 145, 1235–1245. [Google Scholar] [CrossRef]
- Du, L.; Arauzo, P.J.; Meza Zavala, M.F.; Cao, Z.; Olszewski, M.P.; Kruse, A. Towards the properties of different biomass-derived proteins via various extraction methods. Molecules 2020, 25, 488. [Google Scholar] [CrossRef] [PubMed] [Green Version]
- Andreou, V.; Psarianos, M.; Dimopoulos, G.; Tsimogiannis, D.; Taoukis, P. Effect of pulsed electric fields and high pressure on improved recovery of high-added-value compounds from olive pomace. J. Food Sci. 2020, 85, 1500–1512. [Google Scholar] [CrossRef]
- Vladić, J.; Janković, T.; Živković, J.; Tomić, M.; Zdunić, G.; Šavikin, K.; Vidović, S. Comparative study of subcritical water and microwave-assisted extraction techniques impact on the phenolic compounds and 5-hydroxymethylfurfural content in pomegranate peel. Plant Foods Hum. Nutr. 2020, 75, 553–560. [Google Scholar] [CrossRef]
- Wijngaard, H.; Brunton, N. The optimization of extraction of antioxidants from apple pomace by pressurized liquids. J. Agric. Food Chem. 2009, 57, 10625–10631. [Google Scholar] [CrossRef]
- Mafra, I.; Lanza, B.; Reis, A.; Marsilio, V.; Campestre, C.; De Angelis, M.; Coimbra, M.A. Effect of ripening on texture, microstructure and cell wall polysaccharide composition of olive fruit (Olea europaea). Physiol. Plant. 2001, 111, 439–447. [Google Scholar] [CrossRef] [Green Version]
- Kaderides, K.; Papaoikonomou, L.; Sera, M.; Goula, A.M. Microwave-assisted extraction of phenolics from pomegranate peels: Optimization, kinetics, and comparison with ultrasounds extraction. Chem. Eng. Process. 2019, 137, 1–11. [Google Scholar] [CrossRef]
- Nargotra, P.; Sharma, V.; Gupta, M.; Kour, S.; Bajaj, B.K. Application of ionic liquid and alkali pretreatment for enhancing saccharification of sunflower stalk biomass for potential biofuel-ethanol production. Bioresour. Technol. 2018, 267, 560–568. [Google Scholar] [CrossRef]
- ENERGIZA. Available online: https://www.energiza.org/index.php?option=com_k2&view=item&id=1121:el-orujillo-y-su-problemática (accessed on 28 November 2021).
- Carrillo-Beltrán, R.; Corpas-iglesias, F.A.; Terrones-saeta, J.M.; Bertoya-Sol, M. New geopolymers from industrial by-products: Olive biomass fly ash and chamotte as raw materials. Constr. Build. Mater. 2021, 272, 121924. [Google Scholar] [CrossRef]
- Xie, P.; Huang, L.; Zhang, C.; Deng, Y.; Wang, X.; Cheng, J. Enhanced extraction of hydroxytyrosol, maslinic acid and oleanolic acid from olive pomace: Process parameters, kinetics and thermodynamics, and greenness assessment. Food Chem. 2019, 276, 662–674. [Google Scholar] [CrossRef] [PubMed]
- Ozkan, G.; Karacabey, E.; Arslan, N.; Odabasi, N. Optimisation of microwave-assisted extraction of triterpenoic acids from olive mill waste using response surface methodology. Qual. Assur. Saf. Crops Foods 2017, 9, 179–185. [Google Scholar] [CrossRef]
- Romero, C.; Medina, E.; Mateo, M.A.; Brenes, M. New by-products rich in bioactive substances from the olive oil mill processing. J. Sci. Food Agric. 2017, 98, 225–230. [Google Scholar] [CrossRef] [PubMed] [Green Version]
- Martín-García, B.; Verardo, V.; León, L.; De la Rosa, R.; Arráez-Román, D.; Segura-Carretero, A.; Gómez-Caravaca, A.M. GC-QTOF-MS as valuable tool to evaluate the influence of cultivar and sample time on olive leaves triterpenic components. Food Res. Int. 2019, 115, 219–226. [Google Scholar] [CrossRef]


| Run | T | t | C | Yield | PC | TPC | HT | HTC | MAN | MANC | FRAP | ABTS |
|---|---|---|---|---|---|---|---|---|---|---|---|---|
| 1 | 70 | 4 | 3 | 37.53 | 1.26 | 38.96 | 0.20 | 6.05 | 1.52 | 46.86 | 55.30 | 94.72 |
| 2 | 40 | 22 | 3 | 33.80 | 1.13 | 34.81 | 0.18 | 5.57 | 1.39 | 42.91 | 47.37 | 75.18 |
| 3 | 70 | 40 | 15 | 27.75 | 3.93 | 24.45 | 0.61 | 3.78 | 5.63 | 35.00 | 32.21 | 61.41 |
| 4 | 70 | 22 | 9 | 37.83 | 3.37 | 35.01 | 0.53 | 5.53 | 4.55 | 47.18 | 47.34 | 81.30 |
| 5 | 70 | 22 | 9 | 37.70 | 3.30 | 34.38 | 0.53 | 5.50 | 4.30 | 44.71 | 47.92 | 86.11 |
| 6 | 100 | 22 | 3 | 40.42 | 1.30 | 40.42 | 0.19 | 5.94 | 1.59 | 49.20 | 55.14 | 96.75 |
| 7 | 40 | 40 | 9 | 35.48 | 3.09 | 32.10 | 0.46 | 4.84 | 4.19 | 43.61 | 43.11 | 89.46 |
| 8 | 70 | 22 | 9 | 37.86 | 3.29 | 34.09 | 0.41 | 4.25 | 4.23 | 43.87 | 46.42 | 83.45 |
| 9 | 40 | 4 | 9 | 34.84 | 2.86 | 29.69 | 0.48 | 4.97 | 4.05 | 41.99 | 42.00 | 79.86 |
| 10 | 70 | 22 | 9 | 36.87 | 3.25 | 33.72 | 0.52 | 5.39 | 4.27 | 44.30 | 45.18 | 80.11 |
| 11 | 100 | 40 | 9 | 37.66 | 3.37 | 35.04 | 0.53 | 5.50 | 4.44 | 46.10 | 45.69 | 94.55 |
| 12 | 70 | 4 | 15 | 33.84 | 4.81 | 29.91 | 0.80 | 4.99 | 6.71 | 41.75 | 38.58 | 77.88 |
| 13 | 100 | 4 | 9 | 37.94 | 3.45 | 35.86 | 0.51 | 5.35 | 4.31 | 44.81 | 48.65 | 85.25 |
| 14 | 70 | 22 | 9 | 37.45 | 3.40 | 35.30 | 0.53 | 5.54 | 4.44 | 46.04 | 44.81 | 78.66 |
| 15 | 70 | 40 | 3 | 36.53 | 1.13 | 34.95 | 0.18 | 5.61 | 1.35 | 41.75 | 46.77 | 82.27 |
| 16 | 100 | 22 | 15 | 35.62 | 5.02 | 31.21 | 0.81 | 5.04 | 6.67 | 41.41 | 41.40 | 92.97 |
| 17 | 40 | 22 | 15 | 33.59 | 4.87 | 30.24 | 0.72 | 4.48 | 6.90 | 42.82 | 37.98 | 77.37 |
| Dependent Variable | Models | Eq. | CV (%) | R2 | Adjusted R2 | F-Value | Lack of Fit (p-Value) |
|---|---|---|---|---|---|---|---|
| Extraction yield (%) | 37.54 + 1.74∙T + 0.093∙t − 1.25∙C − 0.23∙T∙t − 3.14∙t∙C + 1.37∙T2 − 2.43∙t2 − 3.06∙C2 | (2) | 1.64 | 0.9831 | 0.9577 | 38.77 | 0.1029 |
| Phenolic concentration (g GAE/L) | 3.32 + 0.15∙T + 0.034∙t + 1.87∙C − 0.075∙T∙t − 0.0057∙T∙C − 0.47∙t∙C + 0.23∙T2 − 0.36∙t2 − 0.47∙C2 | (3) | 2.93 | 0.9975 | 0.9939 | 270.38 | 0.0933 |
| Total phenolic content (mg GAE/g EOP) | 34.50 + 1.96∙T + 0.067∙t − 3.11∙C − 0.81∙T∙t − 1.16∙T∙C − 2.47∙t∙C + 1.44∙T2 − 2.77∙t2 − 1.77∙C2 | (4) | 2.53 | 0.9780 | 0.9449 | 29.57 | 0.1517 |
| Hydroxytyrosol concentration (g/L) | 0.53 + 0.025∙T − 0.00499∙t + 0.30∙C + 0.007083∙T∙t + 0.020∙T∙C − 0.087∙t∙C + 0.020∙T2 − 0.052∙t2 − 0.073∙C2 | (5) | 2.02 | 0.9991 | 0.9974 | 587.22 | 0.1473 |
| Hydroxytyrosol content (mg/g EOP) | 5.49 + 0.25∙T − 0.046∙t − 0.45∙C + 0.069∙T∙t + 0.048 T∙C − 0.51∙t∙C + 0.074∙T2 − 0.40∙t2 − 0.30∙C2 | (6) | 1.98 | 0.9871 | 0.9640 | 42.67 | 0.1484 |
| Mannitol concentration (g/L) | 4.35 + 0.058∙T + 0.042∙t + 2.67∙C − 0.004∙T∙t − 0.11∙T∙C − 0.56∙t∙C + 0.28∙T2 − 0.39∙t2 − 0.50∙C2 | (7) | 3.25 | 0.9974 | 0.9934 | 251.05 | 0.3651 |
| Mannitol content (mg/g EOP) | 44.73 + 1.27∙T + 0.73∙t − 1.97∙C − 0.081∙T∙t − 1.93∙T∙C − 4.10∙t∙C + 1.57∙T2 − 2.17∙t2 − 2.21∙C2 | (8) | 1.88 | 0.9799 | 0.9346 | 21.65 | 0.8828 |
| FRAP (mg TE/g EOP) | 46.33 + 2.55∙T − 0.77∙t − 5.48∙C − 1.02∙T∙t − 1.08∙T∙C − 2.11∙t∙C + 1.72∙T2 − 3.19∙t2 − 2.58∙C2 | (9) | 2.78 | 0.9779 | 0.9448 | 29.51 | 0.6168 |
| ABTS (mg TE/g EOP) | 81.92+ 3.24∙T + 5.35∙t + 4.40∙C − 0.076∙T∙t − 6.92∙T∙C − 14.21∙t∙C + 15.24∙T2 − 9.88∙t2 − 6.17∙C2 | (10) | 3.55 | 0.9595 | 0.8865 | 13.15 | 0.3543 |
| Response Variable | Predicted Values | Experimental Values | Error (%) |
|---|---|---|---|
| Extraction Yield (%) | 39.22 | 39.15 ± 2.40 | 0.18 |
| Phenolic concentration (g GAE/L) | 4.48 | 4.30 ± 0.17 | 4.20 |
| TPC (mg GAE/g EOP) | 35.95 | 34.49 ± 1.38 | 4.20 |
| Hydroxytyrosol concentration (g/L) | 0.71 | 0.73 ± 0.03 | 2.74 |
| Hydroxytyrosol content (mg/g EOP) | 5.59 | 5.87 ± 0.28 | 4.77 |
| Mannitol concentration (g/L) | 5.76 | 5.83 ± 0.13 | 1.20 |
| Mannitol content (mg/g EOP) | 45.5 | 46.70 ± 1.09 | 2.51 |
| FRAP (mg TE/g EOP) | 47.17 | 45.35 ± 2.09 | 4.01 |
| ABTS (mg TE/g EOP) | 97.36 | 98.78 ± 1.54 | 1.43 |
| Component | Raw EOP 1 | Extracted EOP Solid |
|---|---|---|
| Chemical characterization | %, dry weight basis | %, dry weight basis |
| Extractives | 41.8 ± 1.9 a | 17.5 ± 0.9 b |
| Aqueous extractives | 37.9 ± 1.9 a | 9.5 ± 1.0 b |
| Ethanolic extractives | 3.8 ± 0.2 b | 8.1 ± 0.1 a |
| Cellulose | 9.7 ± 0.8 a | 10.8 ± 1.3 a |
| Hemicellulose | 10.9 ± 0.5 b | 13.5 ± 1.0 a |
| Xylose | 9.8 ± 0.5 b | 13.1 ± 1.4 a |
| Galactose | 0.3 ± 0.0 b | 1.1 ± 0.3 a |
| Arabinose | 1.8 ± 0.0 a | 1.0 ± 0.1 b |
| Mannose | 0.4 ± 0.0 | - |
| Acetyl groups | 1.5 ± 0.2 a | 1.3 ± 0.3 a |
| Lignin | 21.8 ± 0.9 b | 31.5 ± 0.5 a |
| Ash | 6.4 ± 0.2 a | 1.4 ± 0.0 b |
| Elemental analysis | %, dry weight basis | %, dry weight basis |
| Nitrogen | 1.3 ± 0.1 a | 1.1 ± 0.2 a |
| Carbon | 42.4 ± 0.2 b | 49.7 ± 0.2 a |
| Hydrogen | 5.6 ± 0.1 b | 6.1 ± 0.0 a |
| Sulfur | ND | 1.7 ± 0.0 |
| Parameter | Raw EOP | Extracted EOP Solid |
|---|---|---|
| Extraction yield (%, g/100 g solid) | 6.40 ± 0.19 b | 6.78 ± 0.14 a |
| Maslinic acid concentration (g/L) | 0.53 ± 0.01 b | 0.96 ± 0.01 a |
| Maslinic acid content (mg/g solid) | 5.31 ± 0.12 b | 9.54 ± 0.03 a |
| Oleanolic acid concentration (g/L) | 0.20 ± 0.01 b | 0.36 ± 0.00 a |
| Oleanolic acid content (mg/g solid) | 1.96 ± 0.05 b | 3.60 ± 0.02 a |
Publisher’s Note: MDPI stays neutral with regard to jurisdictional claims in published maps and institutional affiliations. |
© 2022 by the authors. Licensee MDPI, Basel, Switzerland. This article is an open access article distributed under the terms and conditions of the Creative Commons Attribution (CC BY) license (https://creativecommons.org/licenses/by/4.0/).
Share and Cite
Gómez-Cruz, I.; Contreras, M.d.M.; Romero, I.; Castro, E. Optimization of Microwave-Assisted Water Extraction to Obtain High Value-Added Compounds from Exhausted Olive Pomace in a Biorefinery Context. Foods 2022, 11, 2002. https://doi.org/10.3390/foods11142002
Gómez-Cruz I, Contreras MdM, Romero I, Castro E. Optimization of Microwave-Assisted Water Extraction to Obtain High Value-Added Compounds from Exhausted Olive Pomace in a Biorefinery Context. Foods. 2022; 11(14):2002. https://doi.org/10.3390/foods11142002
Chicago/Turabian StyleGómez-Cruz, Irene, María del Mar Contreras, Inmaculada Romero, and Eulogio Castro. 2022. "Optimization of Microwave-Assisted Water Extraction to Obtain High Value-Added Compounds from Exhausted Olive Pomace in a Biorefinery Context" Foods 11, no. 14: 2002. https://doi.org/10.3390/foods11142002
APA StyleGómez-Cruz, I., Contreras, M. d. M., Romero, I., & Castro, E. (2022). Optimization of Microwave-Assisted Water Extraction to Obtain High Value-Added Compounds from Exhausted Olive Pomace in a Biorefinery Context. Foods, 11(14), 2002. https://doi.org/10.3390/foods11142002