
How Different Are Industrial, Artisanal and Homemade Soft Breads?


Abstract

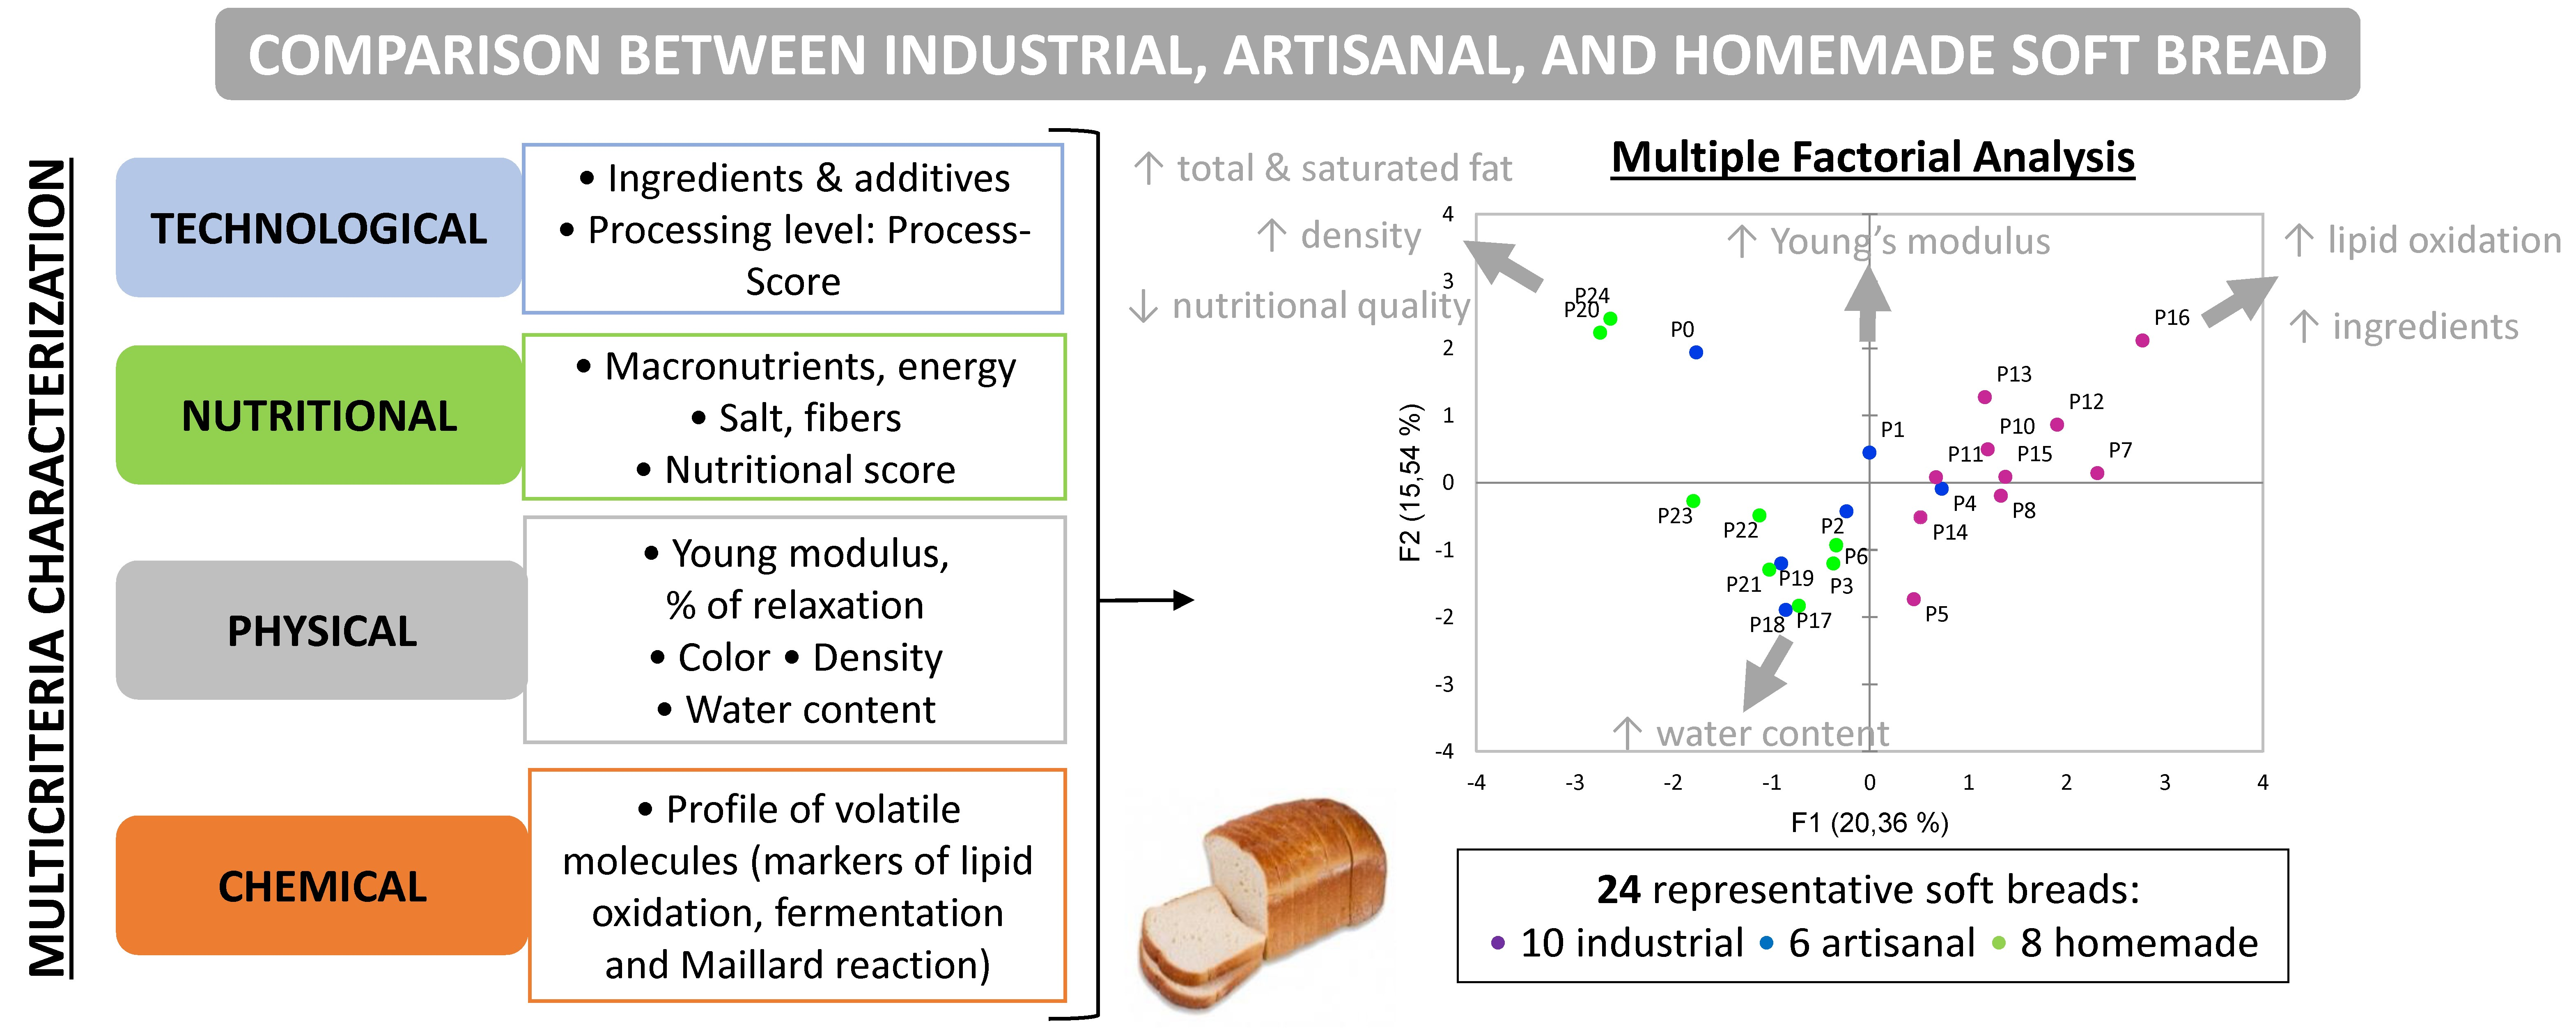
1. Introduction
2. Materials and Methods
2.1. Industrial, Artisanal, and Homemade Soft Bread
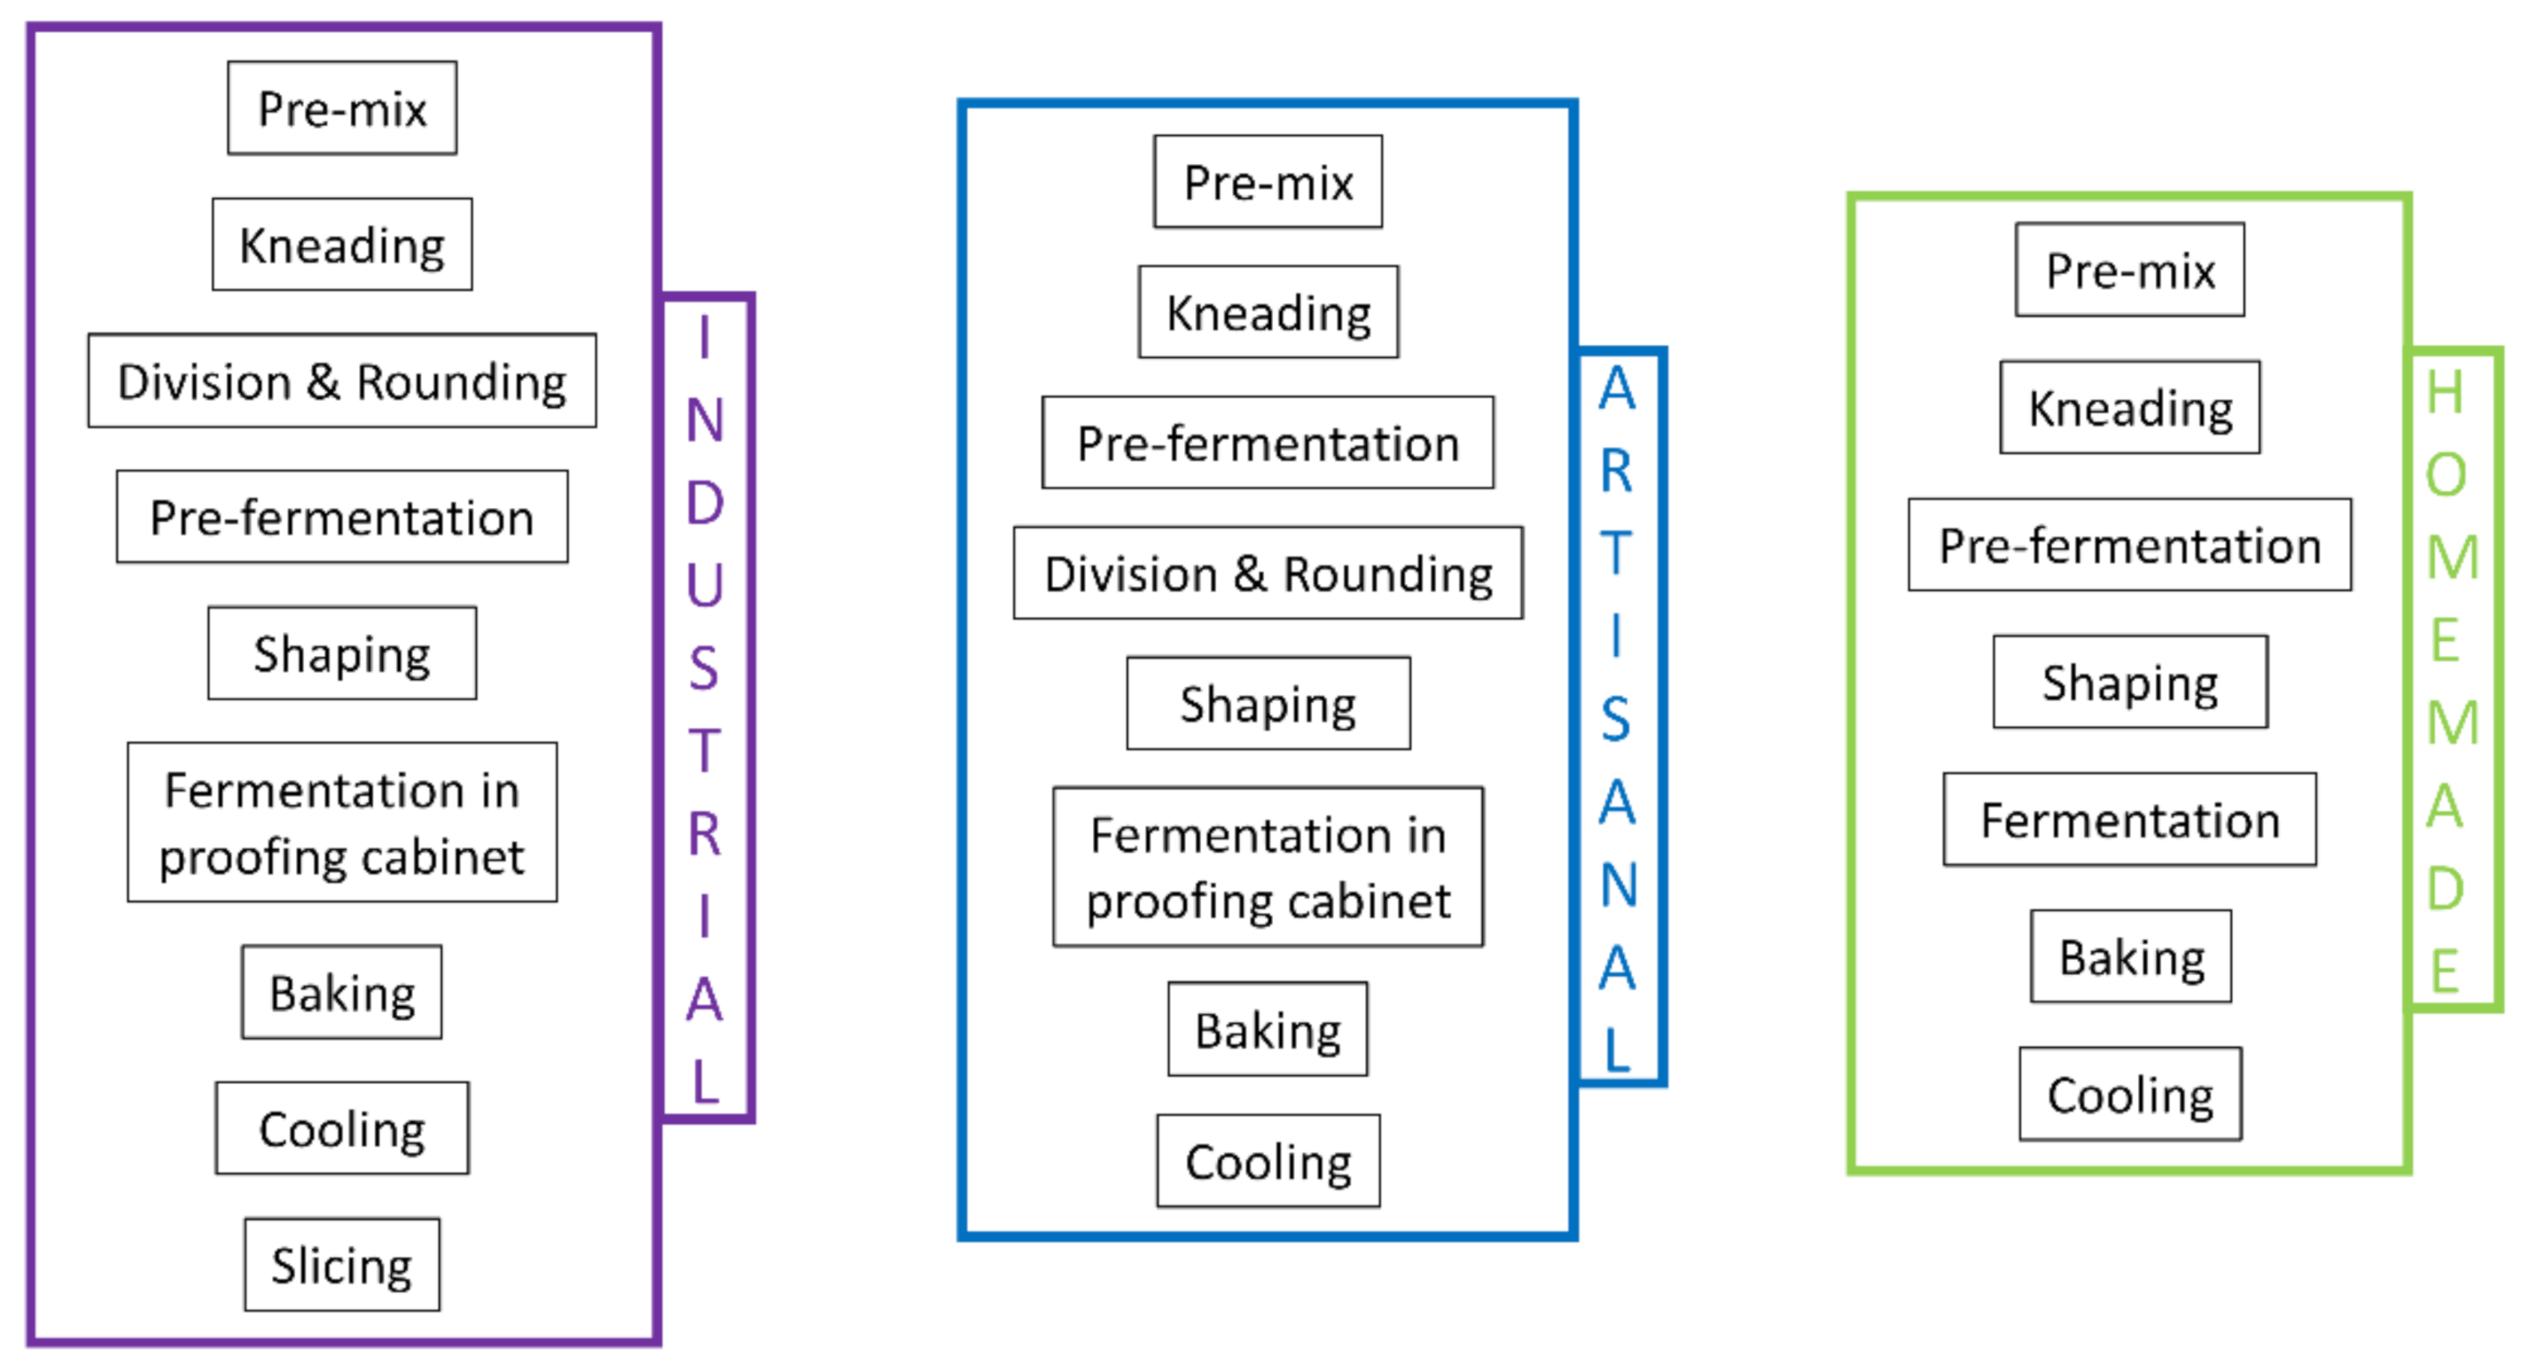
2.2. Recipes and Technological Data
2.3. Nutritional Data
2.4. Characterization of the Physical Properties of Soft Bread
2.4.1. Soft Bread Density
2.4.2. Colorimetry
2.4.3. Texture Properties
2.4.4. Physical Determination of Water Content
2.5. Characterization of the Chemical Properties of Soft Bread
2.5.1. Analysis of Volatile Compounds
2.5.2. Quantification of Key Volatile Compounds
2.6. Statistical Analysis
3. Results and Discussion
3.1. Recipes and Technological Data
3.1.1. Analysis of the Recipes
3.1.2. Calculation of the Degree of Processing
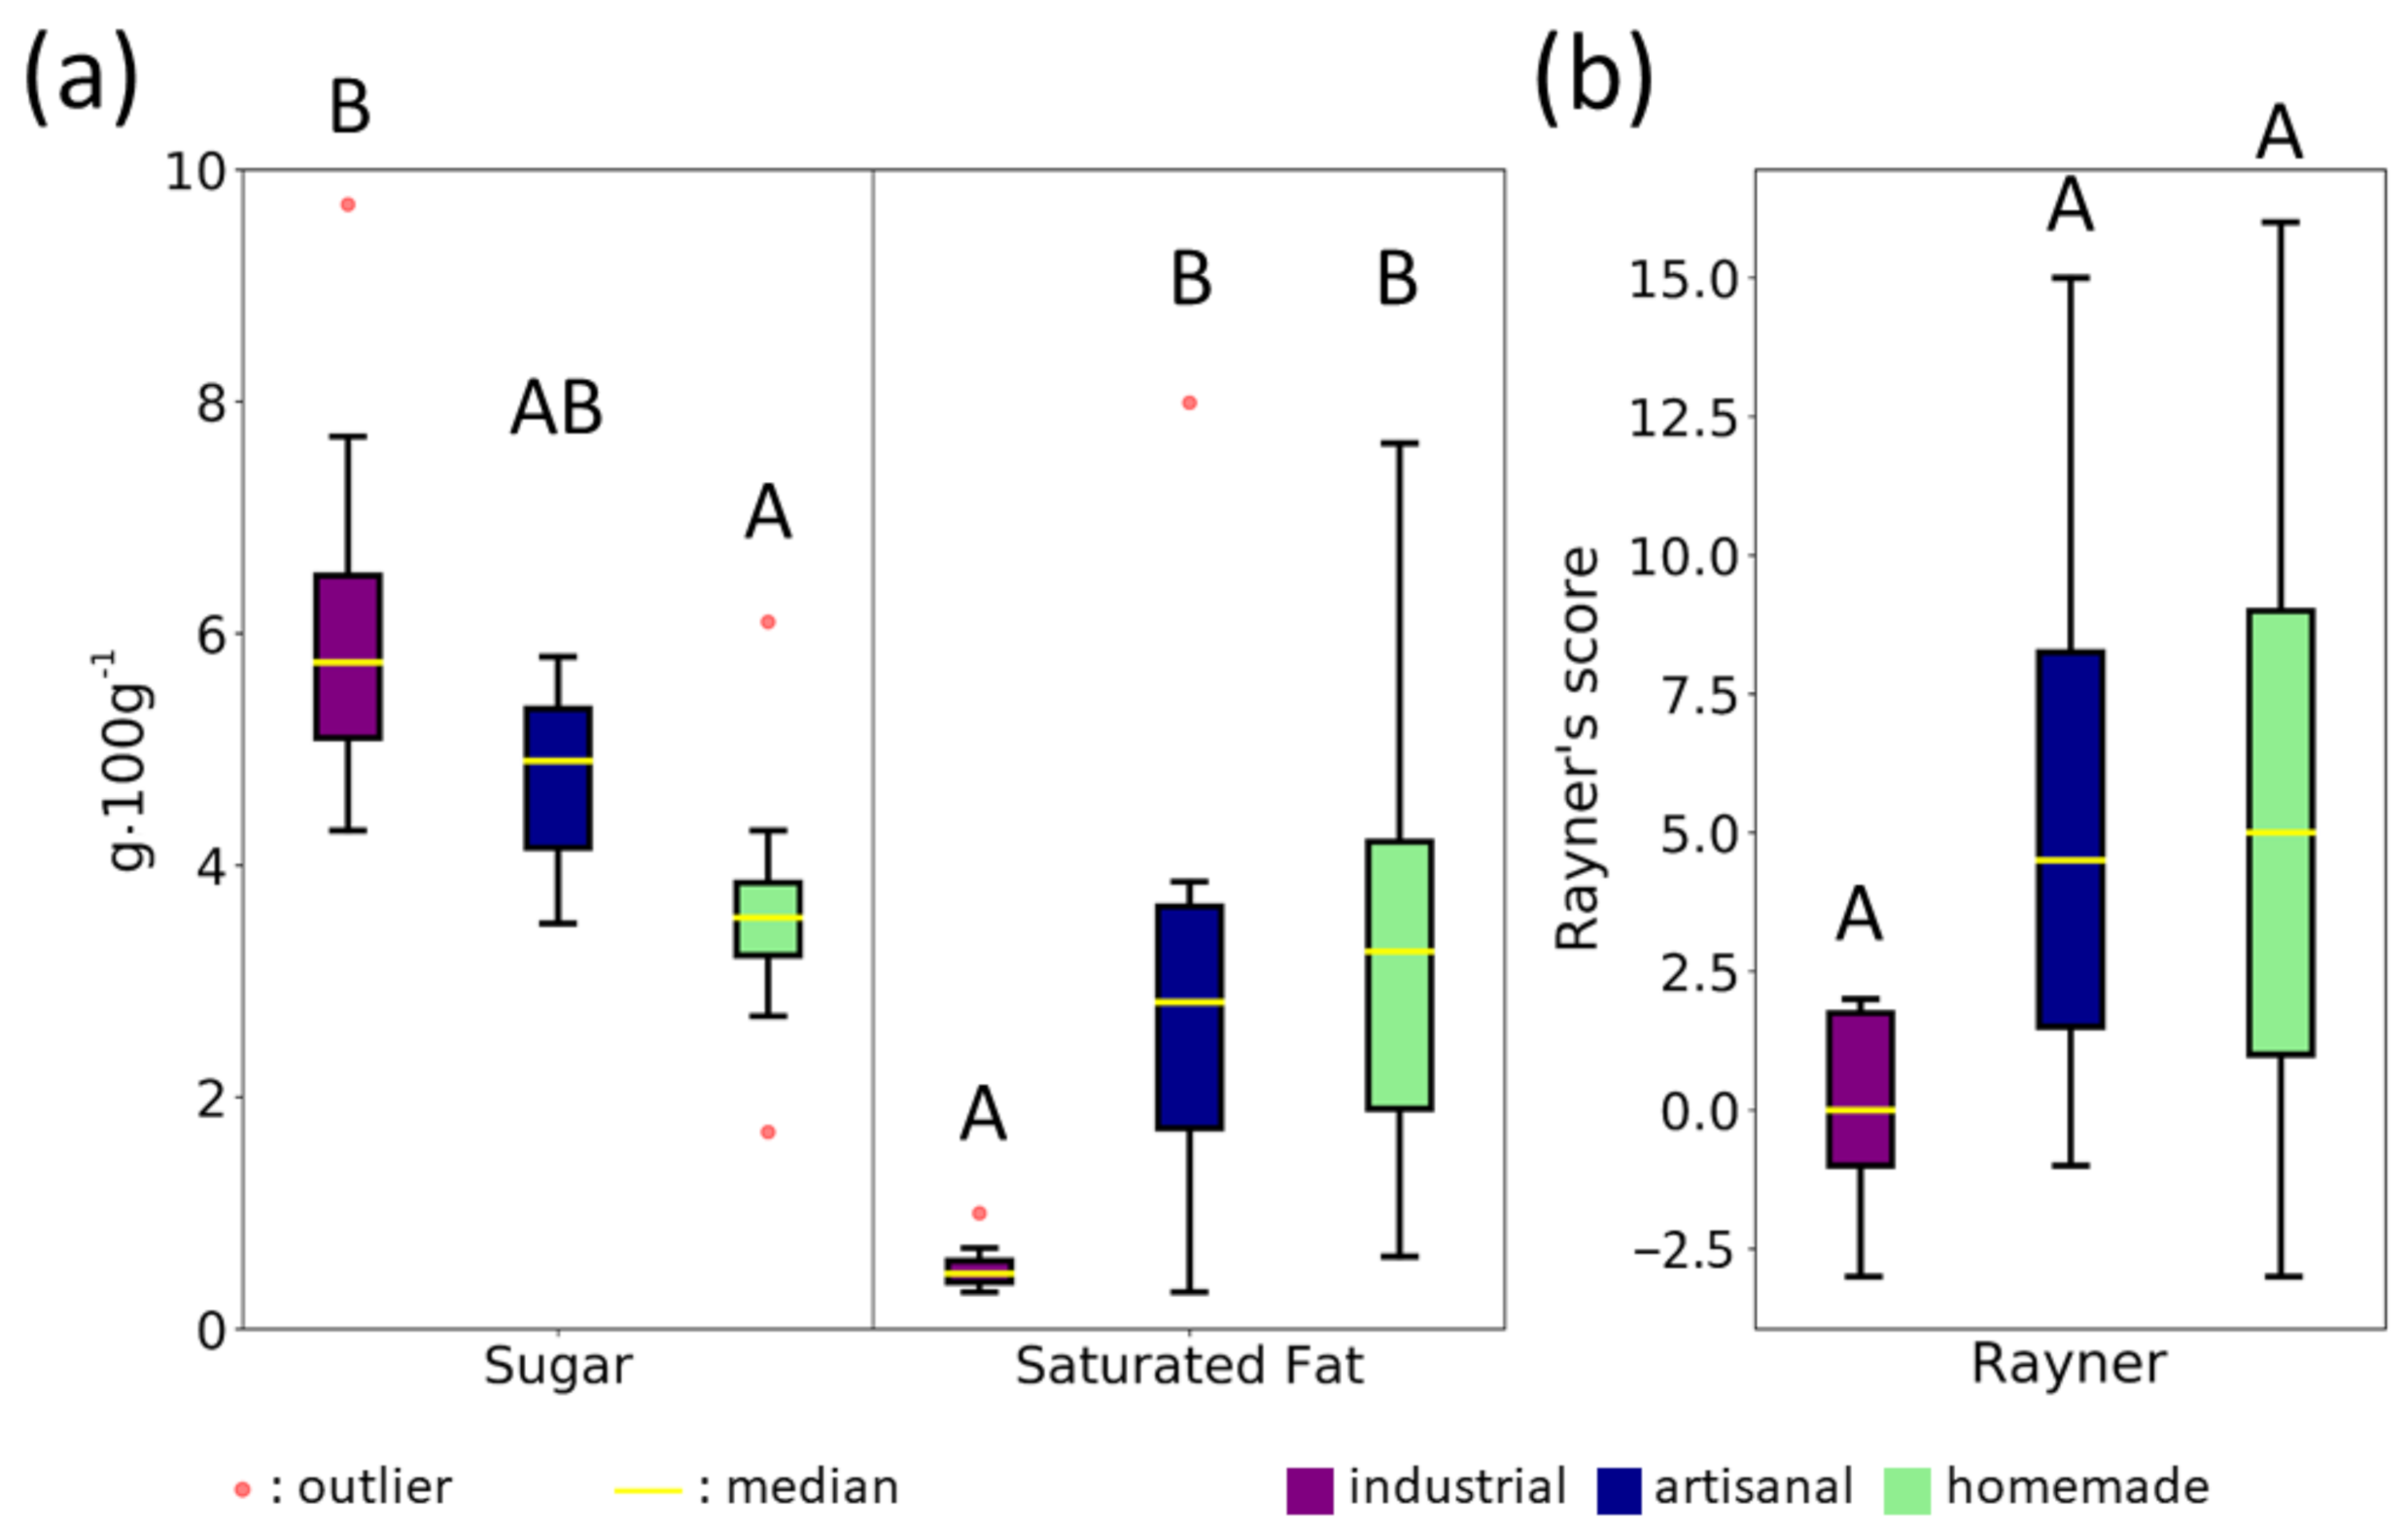
3.2. Nutritional Comparison
3.3. Physical Properties
3.3.1. Comparison of the Density and Texture of Soft Bread
3.3.2. Color Comparison of Soft Breads
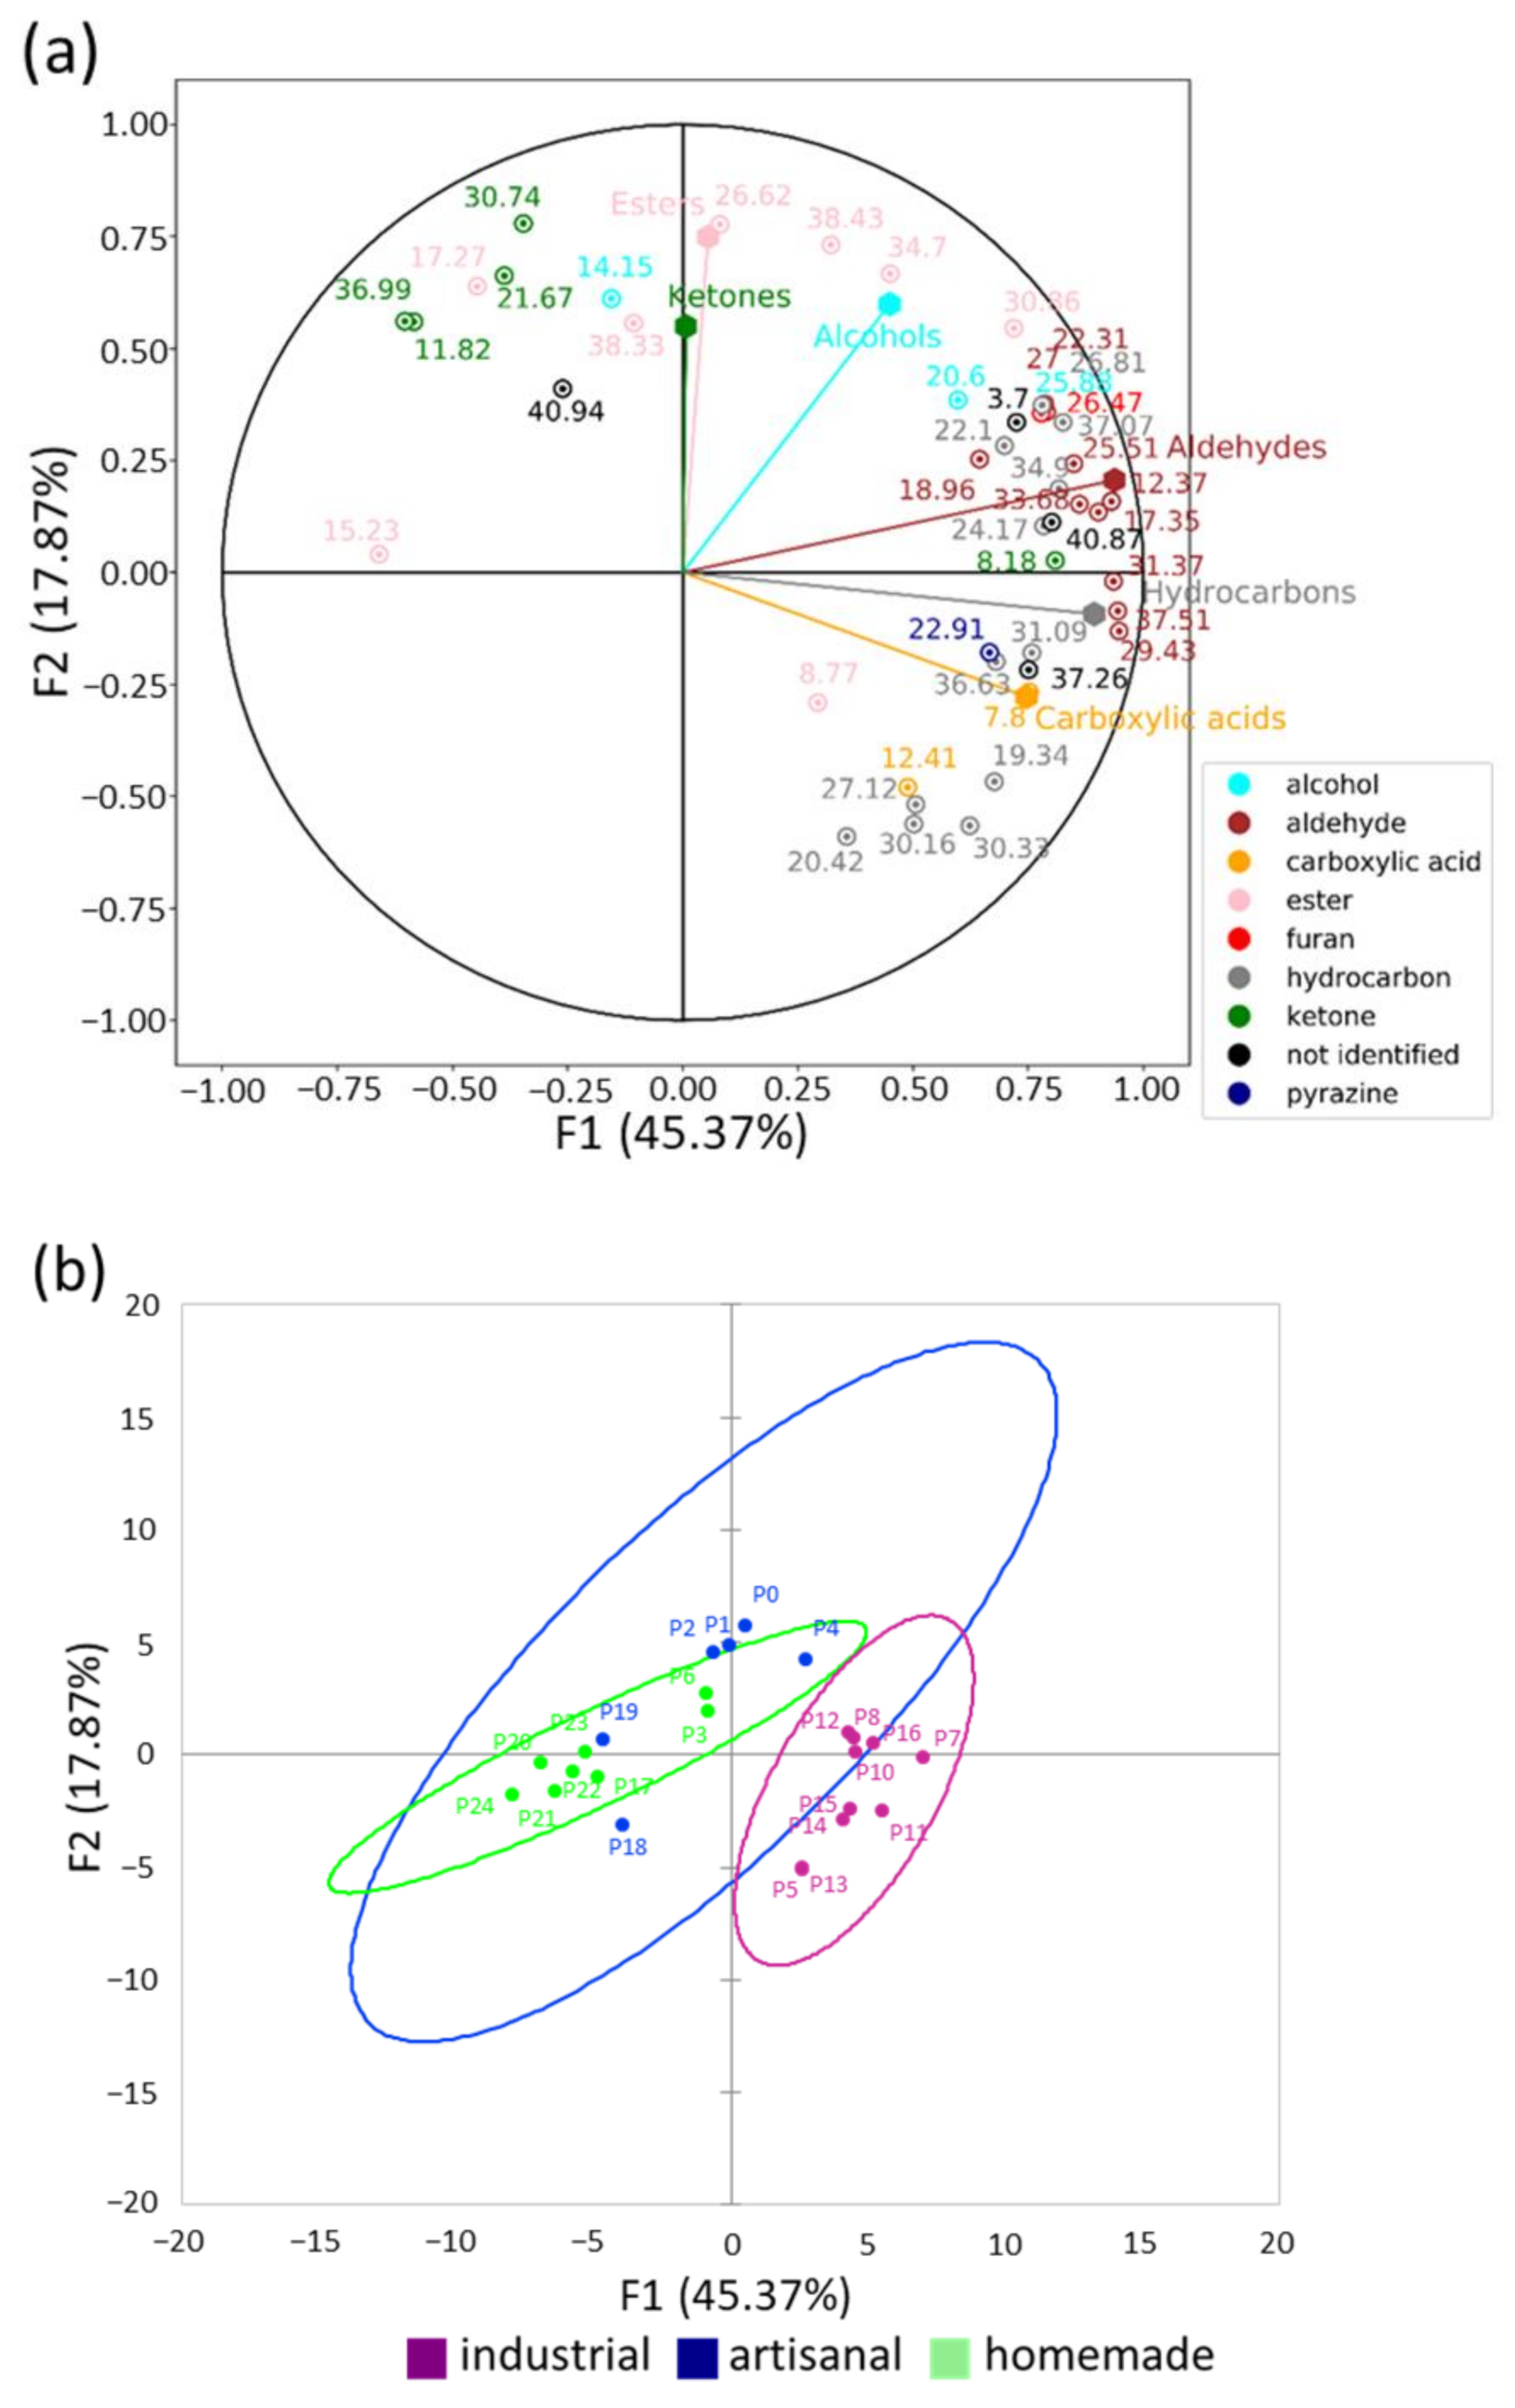
3.4. Comparison of the Volatile Profiles of Soft Bread Crumb
4. Conclusions
Supplementary Materials
Author Contributions
Funding
Institutional Review Board Statement
Informed Consent Statement
Data Availability Statement
Acknowledgments
Conflicts of Interest
References
- Lang, T. Food Industrialisation and Food Power: Implications for Food Governance. Dev. Policy Rev. 2003, 21, 555–568. [Google Scholar] [CrossRef]
- Potter, N.N.; Hotchkiss, J.H. Unit Operations in Food Processing. In Food Science, 5th ed.; Potter, N.N., Hotchkiss, J.H., Eds.; Food Science Text Series; Springer: Boston, MA, USA, 1995; pp. 69–89. [Google Scholar]
- Lamanthe, A. Extension des marchés et normalisation: Les systèmes agro-alimentaires dans la mondialisation. Géogr. Écon. Soc. 2007, 9, 257–270. [Google Scholar] [CrossRef]
- Juul, F.; Vaidean, G.; Parekh, N. Ultra-Processed Foods and Cardiovascular Diseases: Potential Mechanisms of Action. Adv. Nutr. Int. 2021, 12, 1673–1680. [Google Scholar] [CrossRef] [PubMed]
- Crino, M.; Barakat, T.; Trevena, H.; Neal, B. Systematic Review and Comparison of Classification Frameworks Describing the Degree of Food Processing. Nutr. Food Technol. 2017, 3, 138. [Google Scholar]
- Slimani, N.; Deharveng, G.; Southgate, D.A.T.; Biessy, C.; Chajès, V.; E Van Bakel, M.M.; Boutron-Ruault, M.C.; McTaggart, A.; Grioni, S.; Verkaik-Kloosterman, J.; et al. Contribution of Highly Industrially Processed Foods to the Nutrient Intakes and Patterns of Middle-Aged Populations in the European Prospective Investigation into Cancer and Nutrition Study. Eur. J. Clin. Nutr. 2009, 63 (Suppl. 4), S206–S225. [Google Scholar] [CrossRef] [PubMed]
- Monteiro, C.A.; Cannon, G.; Levy, R.B.; Moubarac, J.-C.; Jaime, P.; Martins, A.P.; Canella, D.; Louzada, M.; Parra, D. NOVA. The Star Shines Bright. World Nutr. 2016, 7, 28. [Google Scholar]
- Sadler, C.R.; Grassby, T.; Hart, K.; Raats, M.; Sokolović, M.; Timotijevic, L. Processed Food Classification: Conceptualisation and Challenges. Trends Food Sci. Technol. 2021, 112, 149–162. [Google Scholar] [CrossRef]
- Braesco, V.; Souchon, I.; Sauvant, P.; Haurogné, T.; Maillot, M.; Féart, C.; Darmon, N. Ultra-Processed Foods: How Functional Is the NOVA System? Eur. J. Clin. Nutr. 2022, 1–9. [Google Scholar] [CrossRef]
- Petrus, R.R.; do Amaral Sobral, P.J.; Tadini, C.C.; Gonçalves, C.B. The NOVA Classification System: A Critical Perspective in Food Science. Trends Food Sci. Technol. 2021, 116, 603–608. [Google Scholar] [CrossRef]
- Botelho, R.; Araújo, W.; Pineli, L. Food Formulation and Not Processing Level: Conceptual Divergences between Public Health and Food Science and Technology Sectors. Crit. Rev. Food Sci. Nutr. 2018, 58, 639–650. [Google Scholar] [CrossRef]
- Hall, K.D.; Ayuketah, A.; Brychta, R.; Cai, H.; Cassimatis, T.; Chen, K.Y.; Chung, S.T.; Costa, E.; Courville, A.; Darcey, V.; et al. Ultra-Processed Diets Cause Excess Calorie Intake and Weight Gain: An Inpatient Randomized Controlled Trial of Ad Libitum Food Intake. Cell Metab. 2019, 30, 67–77. [Google Scholar] [CrossRef] [PubMed]
- Freitas, D.; Souchon, I.; Feunteun, S.L. The Contribution of Gastric Digestion of Starch to the Glycaemic Index of Breads with Different Composition or Structure. Food Funct. 2022, 13, 1718–1724. [Google Scholar] [CrossRef] [PubMed]
- Pico, J.; Bernal, J.; Gómez, M. Wheat Bread Aroma Compounds in Crumb and Crust: A Review. Food Res. Int. 2015, 75, 200–215. [Google Scholar] [CrossRef] [PubMed]
- Galoburda, R.; Straumite, E.; Sabovics, M.; Kruma, Z. Dynamics of Volatile Compounds in Triticale Bread with Sourdough: From Flour to Bread. Foods 2020, 9, 1837. [Google Scholar] [CrossRef]
- Koszucka, A.; Nowak, A.; Nowak, I.; Motyl, I. Acrylamide in Human Diet, Its Metabolism, Toxicity, Inactivation and the Associated European Union Legal Regulations in Food Industry. Crit. Rev. Food Sci. Nutr. 2020, 60, 1677–1692. [Google Scholar] [CrossRef]
- Fromberg, A.; Mariotti, M.S.; Pedreschi Plasencia, F.; Fagt, S.; Granby, K. Furan and Alkylated Furans in Heat Processed Food, Including Home Cooked Products. Czech J. Food Sci. 2014, 32, 443–448. [Google Scholar] [CrossRef]
- Cepeda-Vázquez, M.; Rega, B.; Descharles, N.; Camel, V. How Ingredients Influence Furan and Aroma Generation in Sponge Cake. Food Chem. 2018, 245, 1025–1033. [Google Scholar] [CrossRef]
- Michalak, J.; Czarnowska-Kujawska, M.; Gujska, E. Acrylamide and Thermal-Processing Indexes in Market-Purchased Food. Int. J. Environ. Res. Public Health 2019, 16, 4724. [Google Scholar] [CrossRef]
- Aprile, M.C.; Caputo, V.; Nayga, R.M., Jr. Consumers’ Preferences and Attitudes Toward Local Food Products. J. Food Prod. Mark. 2016, 22, 19–42. [Google Scholar] [CrossRef]
- Lingham, S.; Hill, I.; Manning, L. Artisan Food Production: What Makes Food ‘Artisan’? In Artisan and Handicraft Entrepreneurs: Past, Present, and Future, 1st ed.; Dana, L.-P., Ramadani, V., Palalic, R., Salamzadeh, A., Eds.; Contributions to Management Science; Springer: Cham, Switzerland, 2022. [Google Scholar]
- Rosell, C.M. Nutritionally Enhanced Wheat Flours and Breads. In Breadmaking, 2nd ed.; Cauvain, S.P., Ed.; Woodhead Publishing Series in Food Science, Technology and Nutrition; Woodhead Publishing: Sawston, UK, 2012; pp. 687–710. [Google Scholar]
- Canesin, M.R.; Cazarin, C.B.B. Nutritional Quality and Nutrient Bioaccessibility in Sourdough Bread. Curr. Opin. Food Sci. 2021, 40, 81–86. [Google Scholar] [CrossRef]
- Balestra, F.; Pinnavaia, G.G.; Romani, S. Evaluation of the Effects of Different Fermentation Methods on Dough Characteristics. J. Texture Stud. 2015, 46, 262–271. [Google Scholar] [CrossRef]
- Keramat, J.; LeBail, A.; Prost, C.; Jafari, M. Acrylamide in Baking Products: A Review Article. Food Bioprocess Technol. 2011, 4, 530–543. [Google Scholar] [CrossRef]
- Belkova, B.; Chytilova, L.; Kocourek, V.; Slukova, M.; Mastovska, K.; Kyselka, J.; Hajslova, J. Influence of Dough Composition on the Formation of Processing Contaminants in Yeast-Leavened Wheat Toasted Bread. Food Chem. 2021, 338, 127715. [Google Scholar] [CrossRef] [PubMed]
- Lau, E.; Soong, Y.Y.; Zhou, W.; Henry, J. Can Bread Processing Conditions Alter Glycaemic Response? Food Chem. 2015, 173, 250–256. [Google Scholar] [CrossRef]
- Jourdren, S.; Saint-Eve, A.; Panouillé, M.; Lejeune, P.; Déléris, I.; Souchon, I. Respective Impact of Bread Structure and Oral Processing on Dynamic Texture Perceptions through Statistical Multiblock Analysis. Food Res. Int. 2016, 87, 142–151. [Google Scholar] [CrossRef]
- Jourdren, S.; Masson, M.; Saint-Eve, A.; Panouillé, M.; Blumenthal, D.; Lejeune, P.; Déléris, I.; Souchon, I. Effect of Bread Crumb and Crust Structure on the in Vivo Release of Volatiles and the Dynamics of Aroma Perception. J. Agric. Food Chem. 2017, 65, 3330–3340. [Google Scholar] [CrossRef]
- Silow, C.; Axel, C.; Zannini, E.; Arendt, E.K. Current Status of Salt Reduction in Bread and Bakery Products—A Review. J. Cereal Sci. 2016, 72, 135–145. [Google Scholar] [CrossRef]
- Mertens, E.; Colizzi, C.; Peñalvo, J.L. Ultra-Processed Food Consumption in Adults across Europe. Eur. J. Nutr. 2021, 61, 1521–1539. [Google Scholar] [CrossRef]
- Données de Consommations et Habitudes Alimentaires de L’étude Inca 3. Available online: https://www.data.gouv.fr/fr/datasets/donnees-de-consommations-et-habitudes-alimentaires-de-letude-inca-3/ (accessed on 6 May 2022).
- Dewettinck, K.; Van Bockstaele, F.; Kühne, B.; Van de Walle, D.; Courtens, T.M.; Gellynck, X. Nutritional Value of Bread: Influence of Processing, Food Interaction and Consumer Perception. J. Cereal Sci. 2008, 48, 243–257. [Google Scholar] [CrossRef]
- Leroy, P.; Guillemin, H.; Guinet, N.; Maurice, B.; Perret, B.; Allais, O.; Souchon, I. Anatole (Analyse des Taux Ordonnés des Ingrédients Dans Les Recettes Industrielles). Available online: https://odalim.inrae.fr/fr/tools/7-anatole-v1 (accessed on 6 May 2022).
- Santé Publique France Conditions of Use of the “Nutri-Score” Logo. Available online: https://www.santepubliquefrance.fr/content/download/150258/file/20210908_RU_International_Users_regulation_ENG.pdf (accessed on 6 May 2022).
- Mathieu, V.; Monnet, A.-F.; Jourdren, S.; Panouillé, M.; Chappard, C.; Souchon, I. Kinetics of Bread Crumb Hydration as Related to Porous Microstructure. Food Funct. 2016, 7, 3577–3589. [Google Scholar] [CrossRef]
- El Youssef, C.; Bonnarme, P.; Fraud, S.; Péron, A.-C.; Helinck, S.; Landaud, S. Sensory Improvement of a Pea Protein-Based Product Using Microbial Co-Cultures of Lactic Acid Bacteria and Yeasts. Foods 2020, 9, 349. [Google Scholar] [CrossRef] [PubMed]
- Granato, D.; de Araújo Calado, V.M.; Jarvis, B. Observations on the Use of Statistical Methods in Food Science and Technology. Food Res. Int. 2014, 55, 137–149. [Google Scholar] [CrossRef]
- Day, L.; Augustin, M.A.; Batey, I.L.; Wrigley, C.W. Wheat-Gluten Uses and Industry Needs. Trends Food Sci. Technol. 2006, 17, 82–90. [Google Scholar] [CrossRef]
- Otegbayo, B.O.; Adebiyi, O.M.; Bolaji, O.A.; Olunlade, B.A. Effect of Soy Enrichment on Bread Quality. Int. Food Res. J. 2018, 25, 1120–1125. [Google Scholar]
- Lassoued, N. Structure Alvéolaire des Produits Céréaliers de Cuisson En Lien Avec Les Propriétés Rhéologiques et Thermiques de la Pâte: Effet De La Composition. Ph.D. Thesis, Ecole Nationale Supérieure des Industries Agricoles et Alimentaires, Paris, France, 2005. [Google Scholar]
- Monteiro, C.A.; Cannon, G.; Levy, R.B.; Moubarac, J.-C.; Louzada, M.L.; Rauber, F.; Khandpur, N.; Cediel, G.; Neri, D.; Martinez-Steele, E.; et al. Ultra-Processed Foods: What They Are and How to Identify Them. Public Health Nutr. 2019, 22, 936–941. [Google Scholar] [CrossRef]
- Gioia, L.C.; Ganancio, J.R.; Steel, C.J. Food Additives and Processing Aids Used in Breadmaking, 1st ed.; IntechOpen: London, UK, 2017. [Google Scholar]
- Bratovanova, P. Diacetyl, Acetoin and Acetaldehyde in the Flavour of Doughy Part-Manufactured Goods and Bread, Prepared with Leavens of Lactococci and Lactobacilli. Biotechnol. Biotechnol. Equip. 1997, 11, 53–59. [Google Scholar] [CrossRef][Green Version]
- Pu, D.; Duan, W.; Huang, Y.; Zhang, Y.; Sun, B.; Ren, F.; Zhang, H.; Chen, H.; He, J.; Tang, Y. Characterization of the Key Odorants Contributing to Retronasal Olfaction during Bread Consumption. Food Chem. 2020, 318, 126520. [Google Scholar] [CrossRef]
- Birch, A.N.; Petersen, M.A.; Hansen, Å.S. The Aroma Profile of Wheat Bread Crumb Influenced by Yeast Concentration and Fermentation Temperature. LWT-Food Sci. Technol. 2013, 50, 480–488. [Google Scholar] [CrossRef]
- Petisca, C.; Henriques, A.R.; Pérez-Palacios, T.; Pinho, O.; Ferreira, I. Assessment of Hydroxymethylfurfural and Furfural in Commercial Bakery Products. J. Food Compos. Anal. 2014, 33, 20–25. [Google Scholar] [CrossRef]
- Jensen, S.; Oestdal, H.; Skibsted, L.H.; Larsen, E.; Thybo, A.K. Chemical Changes in Wheat Pan Bread during Storage and How It Affects the Sensory Perception of Aroma, Flavour, and Taste. J. Cereal Sci. 2011, 53, 259–268. [Google Scholar] [CrossRef]
- Xi, J.; Zhao, Q.; Xu, D.; Jin, Y.; Wu, F.; Xu, X. Effect of Dough Kneading Time on Chinese Steamed Bread Quality and Volatile Compounds. Food Biosci. 2021, 43, 101323. [Google Scholar] [CrossRef]
- Izzreen, M.N.; Hansen, Å.S.; Petersen, M.A. Volatile Compounds in Whole Meal Bread Crust: The Effects of Yeast Level and Fermentation Temperature. Food Chem. 2016, 210, 566–576. [Google Scholar] [CrossRef] [PubMed]


| Soft Bread | Number of Ingredients (Including Flavoring) | Number of Additives | NOVA | Recipe: Ingredient and Quantity (% Total Ingredients) | |
|---|---|---|---|---|---|
| P0 (artisanal) | 7 (0) | 0 | 3 | flour | 55.6 |
| water | 13.6 | ||||
| butter | 12.5 | ||||
| eggs | 10.1 | ||||
| sugar | 3.9 | ||||
| yeast | 3.0 | ||||
| salt | 1.3 | ||||
| P1 (artisanal) | 11 (0) | 1 | 4 | flour (wheat flour, wheat gluten, maltead wheat flour) | 59.2 |
| water | 30.3 | ||||
| butter | 4.6 | ||||
| sugar | 4.5 | ||||
| salt | 1.0 | ||||
| egg yolk powder | 0.4 | ||||
| yeast | |||||
| deactivated yeast | |||||
| flour treatment agent E300 | |||||
| P2 (artisanal) | NA | NA | NA | not available | |
| P3 (homemade) | 8 (0) | 0 | 3 | T45 flour | 57.5 |
| water | 30.0 | ||||
| sugar | 2.9 | ||||
| eggs | 2.9 | ||||
| butter | 2.3 | ||||
| sunflower oil | 1.7 | ||||
| yeast | 1.7 | ||||
| salt | 1.0 | ||||
| P4 (artisanal) | NA | NA | NA | not available | |
| P5 (industrial) | 8 (1) | 0 | 4 | wheat flour | 73.0 |
| water | 20.8 | ||||
| rapeseed oil | 2.2 | ||||
| yeast | 2.2 | ||||
| salt | 1.0 | ||||
| flavor (contains alcohol) | 0.5 | ||||
| fermented corn flour | |||||
| acerola extract | |||||
| P6 (homemade) | 8 (0) | 0 | 3 | T45 flour | 57.5 |
| water | 30.0 | ||||
| sugar | 2.9 | ||||
| eggs | 2.9 | ||||
| butter | 2.3 | ||||
| sunflower oil | 1.7 | ||||
| yeast | 1.7 | ||||
| salt | 1.0 | ||||
| P7 (industrial) | 10 (1) | 0 | 4 | T80 wheat flour | 63 |
| water | 25.8 | ||||
| cane sugar | 4.8 | ||||
| sunflower oil | 3.0 | ||||
| yeast | 1.9 | ||||
| salt | 1.0 | ||||
| vinegar | 0.5 | ||||
| wheat gluten | |||||
| natural flavor (contains alcohol) | |||||
| acerola extract | |||||
| P8 (industrial) | 11 (1) | 0 | 4 | wheat flour | 63.0 |
| water | 23.7 | ||||
| sugar | 4.6 | ||||
| rapeseed oil | 3.2 | ||||
| bean flour | 2.0 | ||||
| yeast | 2.0 | ||||
| salt | 1.0 | ||||
| vinegar | 0.2 | ||||
| wheat gluten | |||||
| flavor (contains alcohol) | |||||
| acerola extract | |||||
| P10 (industrial) | 12 (1) | 1 | 4 | wheat flour | 66.5 |
| water | 21.9 | ||||
| rapeseed oil | 3.1 | ||||
| sugar | 2.9 | ||||
| yeast | 2.0 | ||||
| bean flour | 2.0 | ||||
| salt | 1.1 | ||||
| wheat gluten | 0.2 | ||||
| vinegar | 0.1 | ||||
| flavor (contains alcohol) | |||||
| preservative: calcium propionate | |||||
| acerola extract | |||||
| P11 (industrial) | 9 (1) | 0 | 4 | wheat flour | 70.0 |
| water | 16.9 | ||||
| rapeseed oil | 4.0 | ||||
| yeast | 4.0 | ||||
| bean flour | 2.0 | ||||
| vinegar | 1.7 | ||||
| salt | 1.0 | ||||
| flavor (contains alcohol) | |||||
| acerola extract | |||||
| P12 (industrial) | 17 (1) | 7 | 4 | wheat flour (contains gluten) | 57.0 |
| water | 30.0 | ||||
| sugar | 2.7 | ||||
| sunflower vegetable oil | 2.7 | ||||
| yeast | 1.8 | ||||
| wheat gluten | 1.7 | ||||
| soybean flour | 1.2 | ||||
| dextrose | 0.9 | ||||
| salt | 0.8 | ||||
| emulsifiers: sodium stearoyl-2-lactylate, mono- and diglycerides of fatty acids | |||||
| preservatives: calcium propionate, sorbic acid, potassium sorbate | |||||
| stabilizer: guar gum | |||||
| flour treatment agent: ascorbic acid | |||||
| flavor (contains alcohol) | |||||
| P13 (industrial) | 13 (1) | 4 | 4 | wheat flour | 67.0 |
| water | 20.7 | ||||
| sugar | 5.8 | ||||
| rapeseed oil | 2.0 | ||||
| wheat gluten | 1.7 | ||||
| yeast | 1.2 | ||||
| salt | 0.9 | ||||
| flavor | 0.3 | ||||
| preservative: calcium propionate | |||||
| emulsifiers: mono- and diglycerides of fatty acids, lecithin | |||||
| thickener: xanthan gum | |||||
| bean flour | |||||
| P14 (industrial) | 12 (0) | 2 | 4 | wheat flour | 63.0 |
| water | 29.6 | ||||
| yeast | 4.7 | ||||
| wheat fiber | 1.3 | ||||
| salt | 1.0 | ||||
| vinegar | 0.3 | ||||
| wheat gluten | |||||
| bean flour | |||||
| emulsifier: mono- and diglycerides of fatty acids (rapeseed) | |||||
| preservative: calcium propionate | |||||
| psyllium | |||||
| acerola extract | |||||
| P15 (industrial) | 8 (1) | 0 | 4 | wheat flour * | 65.0 |
| water | 25.4 | ||||
| rapeseed oil * | 3.9 | ||||
| cane sugar * | 3.3 | ||||
| salt | 1.0 | ||||
| yeast | 1.0 | ||||
| wheat gluten * | 0.4 | ||||
| natural flavor * (contains alcohol *) | |||||
| P16 (industrial) | 13 (0) | 0 | 4 | wheat flour * | 47 |
| water | 29.8 | ||||
| sourdough* (wheat flour *, water, yeast, untreated sea salt) | 14.5 | ||||
| sunflower oil * | 3.0 | ||||
| white cane sugar * | 3.0 | ||||
| wheat gluten * | 1.8 | ||||
| malted wheat flour * | 0.7 | ||||
| yeast * | 0.2 | ||||
| untreated sea salt | |||||
| acerola extract | |||||
| P17 (homemade) | 7 (0) | 0 | 3 | T45 flour | 55.5 |
| water | 18.6 | ||||
| milk | 18.5 | ||||
| oil | 3.9 | ||||
| sugar | 1.8 | ||||
| baker’s yeast | 1.1 | ||||
| salt | 0.6 | ||||
| P18 (artisanal) | 5 (0) | 0 | 3 | traditional flour | 65.9 |
| water | 30.9 | ||||
| sourdough | 2.0 | ||||
| salt | 1.1 | ||||
| baker’s yeast | 0.1 | ||||
| P19 (artisanal) | 6 (0) | 0 | 3 | flour | 55.6 |
| water | 30.4 | ||||
| butter | 5.6 | ||||
| sugar | 5.6 | ||||
| yeast | 1.7 | ||||
| salt | 1.1 | ||||
| P20 (homemade) | 7 (0) | 0 | 3 | flour | 66.5 |
| water | 15.0 | ||||
| soft butter | 8.7 | ||||
| semi-skimmed milk | 4.2 | ||||
| baker’s yeast | 2.8 | ||||
| sugar | 1.4 | ||||
| salt | 1.4 | ||||
| P21 (homemade) | 8 (0) | 0 | 3 | flour | 59.5 |
| milk | 18.1 | ||||
| water | 12.1 | ||||
| butter | 4.1 | ||||
| fresh yeast | 2.0 | ||||
| sugar | 2.0 | ||||
| eggs | 1.2 | ||||
| salt | 1.0 | ||||
| P22 (homemade) | 7 (0) | 0 | 3 | flour | 54.6 |
| milk | 21.8 | ||||
| water | 10.9 | ||||
| butter | 5.6 | ||||
| sugar | 4.4 | ||||
| fresh yeast | 2.2 | ||||
| salt | 0.5 | ||||
| P23 (homemade) | 7 (0) | 0 | 3 | flour | 51.5 |
| milk | 25.7 | ||||
| water | 12.5 | ||||
| butter | 5.3 | ||||
| fresh yeast | 2.0 | ||||
| sugar | 1.5 | ||||
| salt | 1.5 | ||||
| P24 (homemade) | 6 (0) | 0 | 3 | flour | 56.3 |
| semi-skimmed milk | 33.8 | ||||
| sweet butter | 6.9 | ||||
| sugar | 1.1 | ||||
| salt | 1.1 | ||||
| baker’s yeast | 0.8 | ||||
| Variable | Industrial (n = 10) | Artisanal (n = 6) | Homemade (n = 8) | p Value | |||||
|---|---|---|---|---|---|---|---|---|---|
| R E C I P E | Number of ingredients | 11.3 ± 2.8 | B | 7 ± 2.8 (n = 4) | A | 7.23 ± 0.7 | A | 0.002 ** | |
| Number of additives | 1.4 ± 2.4 | A | 0.3 ± 0.5 (n = 4) | A | 0.0 ± 0.0 | A | 0.132 | ||
| Process-Score | 43.0 ± 1.8 | A | 41.1 ± 0.6 (n = 4) | A | 41.4 ± 3.4 | A | 0.287 | ||
| % animal fat | 0.0 ± 0.0 | A | 6.7 ± 6.8 (n = 4) | B | 4.7 ± 2.6 | B | 0.002 ** | ||
| % vegetable fat | 2.7 ± 1.1 | B | 0.0 ± 0.0 (n = 4) | A | 0.9 ± 1.4 | A | 0.005 ** | ||
| P H Y S I C A L | Water content (g·100 g−1) | 38.4 ± 3.6 | A | 41.9 ± 3.0 | A | 39.7 ± 2.1 | A | 0.221 | |
| Density | 0.2 ± 0.0 (n = 5) | A | 0.2 ± 0.1 | A | 0.3 ± 0.1 | A | 0.100 | ||
| Fmax (N) | 1.6 ± 0.8 | AB | 1.2 ± 0.5 | A | 3.1 ± 2.7 | B | 0.020 * | ||
| Relaxation (%) | 36.4 ± 5.0 | B | 32.1 ± 3.7 | AB | 30.9 ± 4.0 | A | 0.040 * | ||
| Young’s modulus (kPa) | 9.3 ± 9.1 | A | 4.7 ± 3.7 | A | 9.3 ± 7.8 | A | 0.329 | ||
| L* | 73.7 ± 3.8 (n = 5) | A | 72.8 ± 2.0 | A | 74.4 ± 2.1 | A | 0.577 | ||
| a* | 0.5 ± 0.8 (n = 5) | A | 0.4 ± 0.3 | A | 0.1 ± 0.5 | A | 0.426 | ||
| b* | 14.6 ± 1.3 (n = 5) | A | 19.3 ± 3.8 | B | 19.4 ± 2.3 | B | 0.013 * | ||
| C* | 14.6 ± 1.3 (n = 5) | A | 19.3 ± 3.8 | B | 19.4 ± 2.3 | B | 0.014 * | ||
| N U T R I T I O N A L | Energy (kcal·100 g−1) | 270.0 ± 15.4 | A | 280.8 ± 33.3 | A | 285.5 ± 21.9 | A | 0.501 | |
| Total fat | (g· 100 g−1) | 4.0 ± 1.3 | A | 5.6 ± 4.1 | A | 6.3 ± 2.2 | A | 0.075 | |
| Saturated Fat | 0.5 ± 0.2 | A | 3.2 ± 2.7 | B | 3.5 ± 2.2 | B | 0.002 ** | ||
| Total Carbohydrate | 50.5 ± 3.2 | A | 51.2 ± 1.9 | A | 51.8 ± 1.2 | A | 0.813 | ||
| Sugars | 6.1 ± 1.6 | B | 4.8 ± 0.9 | AB | 3.6 ± 1.3 | A | 0.003 ** | ||
| Fibers | 3.4 ± 1.0 | A | 2.9 ± 0.8 | A | 3.2 ± 0.4 | A | 0.523 | ||
| Proteins | 8.2 ± 0.9 | A | 8.6 ± 1.2 | A | 7.8 ± 0.3 | A | 0.228 | ||
| Salt | 1.2 ± 0.2 | A | 1.3 ± 0.1 | A | 1.3 ± 0.4 | A | 0.333 | ||
| Rayner’s score | 0.0 ± 1.8 | A | 5.5 ± 5.9 | A | 5.4 ± 6.2 | A | 0.056 | ||
| Molecule | Industrial (n = 5) | Artisanal (n = 4) | Homemade (n = 2) | p Value | |||
|---|---|---|---|---|---|---|---|
| [3-hydroxybutan-2-one] | 66,667.0 ± 36,947.9 | A | 112,252.7 ± 47,334.5 | A | 90,060.7 ± 20,794.9 | A | 0.286 |
| [hexanal] | 935.1 ± 522.7 | A | 450.3 ± 98.4 | A | 523.8 ± 102.2 | A | 0.178 |
| [furan-2-carbaldehyde] | 128.3 ± 129.4 | A | 191.7 ± 270.7 | A | 26.5 ± 2.9 | A | 0.767 |
| [2,5-dimethylpyrazine] | 0.8 ± 1.8 | A | 0.0 ± 0.0 | A | 15.8 ± 22.3 | A | 0.301 |
| [2-pentylfuran] | 1581.9 ± 1173.6 | A | 597.1 ± 450.0 | A | 831.7 ± 196.2 | A | 0.313 |
| [ethyl octanoate] | 193.7 ± 108.9 | A | 1694.1 ± 1417.8 | B | 251.9 ± 15.9 | AB | 0.023 * |
| Compound | CAS Number | Chemical Classification | Kovats Retention Index | Retention Time (min) | Industrial (n = 10) | Artisanal (n = 6) | Homemade (n = 8) | p Value | |||
|---|---|---|---|---|---|---|---|---|---|---|---|
| Not identified | NA | NA | NA | 3.70 ± 0.05 | 17,271.0 ± 4088.3 | B | 13,682.6 ± 6470.0 | AB | 9075.4 ± 4849.0 | A | 0.009 ** |
| acetic acid | 64-19-7 | Carboxylic acid | 619 ± 22 | 7.80 ± 0.14 | 465.0 ± 644.7 | B | 22.0 ± 50.7 | A | 0.1 ± 0.0 | A | 0.001 *** |
| butan-2-one | 78-93-3 | Ketone | 587 ± 23 | 8.18 ± 0.07 | 68.6 ± 31.0 | B | 42.4 ± 36.2 | AB | 17.9 ± 14.4 | A | 0.004 ** |
| ethyl acetate | 141-78-6 | Ester | 609 ± 13 | 8.77 ± 0.06 | 3809.0 ± 4 835.0 | B | 493.5 ± 375.8 | A | 1549.3 ± 1284.3 | AB | 0.050 * |
| pentan-2-one | 107-87-9 | Ketone | 679 ± 22 | 11.82 ± 0.06 | 5.2 ± 8.0 | A | 91.9 ± 161.6 | B | 84.2 ± 74.5 | B | 0.001 *** |
| pentanal | 110-62-3 | Aldehyde | 698 ± 14 | 12.37 ± 0.05 | 281.9 ± 204.8 | B | 108.9 ± 69.7 | A | 46.2 ± 40.5 | A | 0.001 *** |
| propanoic acid | 79-09-4 | Carboxylic acid | 704 ± 24 | 12.41 ± 0.64 | 2523 ± 4 230.1 | B | 0.1 ± 0.0 | A | 0.1 ± 0.0 | A | 0.005 ** |
| 3-methylbutan-1-ol | 123-51-3 | Alcohol | 738 ± 11 | 14.15 ± 0.08 | 10,972.8 ± 6670.7 | A | 18,993.2 ± 7 235.3 | A | 21,881.2 ± 11,862.3 | A | 0.043 * |
| ethyl 2-methylpropanoate | 97-62-1 | Ester | 755 ± 10 | 15.23 ± 0.05 | 1.5 ± 1.4 | A | 6.6 ± 12.6 | A | 54.3 ± 53.5 | B | 0.002 ** |
| ethyl butanoate | 105-54-4 | Ester | 798 ± 10 | 17.27 ± 0.04 | 3.9 ± 1.6 | A | 48.3 ± 56.8 | B | 24.6 ± 12.7 | B | 0.003 ** |
| hexanal | 66-25-1 | Aldehyde | 797 ± 34 | 17.35 ± 0.05 | 918.4 ± 489.1 | B | 375.6 ± 235.7 | A | 184 ± 180.9 | A | 0.001 *** |
| furan-2-carbaldehyde | 98-01-1 | Aldehyde | 830 ± 53 | 18.96 ± 0.07 | 197.1 ± 213.6 | B | 277.3 ± 506.4 | B | 12.1 ± 21.6 | A | 0.007 ** |
| 2,4-dimethylhept-1-ene | 19549-87-2 | Hydrocarbon | 838 ± 10 | 19.34 ± 0.02 | 298.1 ± 339.7 | B | 1.4 ± 0.9 | A | 1.2 ± 0.3 | A | 0.002 ** |
| 4-methyloctane | 2216-34-4 | Hydrocarbon | 863 ± 3 | 20.42 ± 0.03 | 33.4 ± 38.0 | B | 1.7 ± 1.7 | A | 2.0 ± 1.3 | AB | 0.028 * |
| hexan-1-ol | 111-27-3 | Alcohol | 865 ± 50 | 20.60 ± 0.06 | 823.6 ± 563.0 | B | 779.0 ± 341.5 | B | 299.4 ± 221.7 | A | 0.021 * |
| heptan-2-one | 110-43-0 | Ketone | 888 ± 11 | 21.67 ± 0.05 | 126.7 ± 71.4 | A | 868.5 ± 1084.4 | AB | 658.3 ± 487.2 | B | 0.021 * |
| styrene | 100-42-5 | Hydrocarbon | 837 ± 197 | 22.10 ± 0.05 | 122.6 ± 80.7 | B | 80.1 ± 58.1 | AB | 51.0 ± 44.1 | A | 0.039 * |
| heptanal | 111-71-7 | Aldehyde | 897 ± 46 | 22.31 ± 0.04 | 490.9 ± 321.5 | B | 443.6 ± 357.1 | AB | 162.8 ± 129.5 | A | 0.009 ** |
| 2,5-dimethylpyrazine | 123-32-0 | Pyrazine | 916 ± 12 | 22.91 ± 0.05 | 11.3 ± 13.1 | B | 3.1 ± 1.3 | AB | 1.9 ± 2.8 | A | 0.003 ** |
| 2,6,6-trimethylbicyclo[3.1.1]hept-2-ene | 80-56-8 | Hydrocarbon | 936 ± 8 | 24.17 ± 0.02 | 218.8 ± 247.9 | B | 33.0 ± 46.9 | AB | 3.4 ± 3.9 | A | 0.002 ** |
| benzaldehyde | 100-52-7 | Aldehyde | 954 ± 80 | 25.51 ± 0.06 | 435.8 ± 181.0 | B | 229.8 ± 203.9 | AB | 151.1 ± 209.3 | A | 0.015 * |
| oct-1-en-3-ol | 3391-86-4 | Alcohol | 980 ± 7 | 25.88 ± 0.04 | 74.2 ± 110.5 | B | 34.0 ± 20.6 | AB | 22.5 ± 38.3 | A | 0.035 * |
| 2-pentylfuran | 3777-69-3 | Furan | 992 ± 6 | 26.47 ± 0.03 | 546.1 ± 277.5 | B | 378.3 ± 141.5 | AB | 174.8 ± 208.8 | A | 0.010 ** |
| ethyl hexanoate | 123-66-0 | Ester | 994 ± 67 | 26.62 ± 0.04 | 136.6 ± 71.9 | A | 758.3 ± 595.2 | B | 165.5 ± 106.1 | AB | 0.043 * |
| decane | 124-18-5 | Hydrocarbon | 1000 | 26.81 ± 0.02 | 294.4 ± 763.9 | B | 73.0 ± 112.4 | AB | 16.6 ± 11.6 | A | 0.014 * |
| octanal | 124-13-0 | Aldehyde | 998 ± 63 | 27.00 ± 0.04 | 118.3 ± 68.5 | B | 66.2 ± 74.4 | AB | 20.5 ± 29.1 | A | 0.03 * |
| 2,6-dimethylnonane | 17302-28-2 | Hydrocarbon | 1020 ± 4 | 27.12 ± 0.11 | 82.4 ± 99.9 | B | 1.0 ± 0.0 | A | 1.0 ± 0.0 | A | 0.016 * |
| (E)-oct-2-enal | 2548-87-0 | Aldehyde | 1059 ± 8 | 29.43 ± 0.01 | 151.2 ± 138.8 | B | 15.4 ± 17.4 | A | 8.3 ± 13.7 | A | 0.0001 *** |
| Not identified | NA | Hydrocarbon | NA | 30.16 ± 0.02 | 145.1 ± 152.1 | B | 1.6 ± 0.9 | A | 2.2 ± 2.4 | A | 0.007 ** |
| Not identified | NA | Hydrocarbon | NA | 30.33 ± 0.01 | 121.5 ± 124.3 | B | 1.0 ± 0.0 | A | 1.0 ± 0.0 | A | 0.002 ** |
| nonan-2-one | 821-55-6 | Ketone | 1085 ± 73 | 30.74 ± 0.03 | 25.0 ± 35.2 | A | 245.3 ± 245.6 | B | 116.0 ± 79.9 | B | 0.012 * |
| ethyl heptanoate | 106-30-9 | Ester | 1095 ± 9 | 30.86 ± 0.02 | 9.0 ± 7.2 | B | 19.5 ± 20.4 | A | 1.3 ± 1.4 | A | 0.007 ** |
| Not identified | NA | Hydrocarbon | NA | 31.09 ± 0.01 | 746.2 ± 1 744.6 | B | 16.0 ± 11.9 | A | 11.8 ± 13.9 | A | 0.005 ** |
| nonanal | 124-19-6 | Aldehyde | 1101 ± 40 | 31.37 ± 0.04 | 401.6 ± 137.3 | C | 199.1 ± 151.7 | B | 71.9 ± 96.5 | A | 0.0005 *** |
| (E)-non-2-enal | 18829-56-6 | Aldehyde | 1162 ± 7 | 33.68 ± 0.03 | 74.9 ± 27.5 | B | 48.2 ± 46.8 | B | 7.6 ± 13.2 | A | 0.001 *** |
| ethyl octanoate | 106-32-1 | Ester | 1188 ± 93 | 34.70 ± 0.02 | 318.5 ± 156.7 | AB | 1989.5 ± 1 875.4 | B | 135.5 ± 123.7 | A | 0.014 * |
| dodecane | 112-40-3 | Hydrocarbon | 1200 | 34.90 ± 0.01 | 414.5 ± 1 129.5 | B | 33.6 ± 44.2 | AB | 10.7 ± 7.1 | A | 0.005 ** |
| Not identified | NA | Hydrocarbon | NA | 36.63 ± 0.01 | 42.2 ± 46.9 | B | 4.1 ± 4.2 | AB | 3.4 ± 5.3 | A | 0.020 * |
| undecan-2-one | 112-12-9 | Ketone | 1286 ± 84 | 36.99 ± 0.03 | 1.1 ± 0.2 | A | 59.2 ± 76.6 | B | 14.2 ± 13.6 | B | 0.002 ** |
| tridecane | 629-50-5 | Hydrocarbon | 1300 | 37.07 ± 0.01 | 172.8 ± 312.4 | B | 35.0 ± 30.9 | AB | 14.6 ± 24.5 | A | 0.013 * |
| Not identified | NA | NA | NA | 37.26 ± 0.01 | 60.7 ± 49.7 | B | 12.3 ± 8.8 | AB | 7.8 ± 11.2 | A | 0.006 ** |
| (2E,4E)-deca-2,4-dienal | 25152-84-5 | Aldehyde | 1318 ± 10 | 37.51 ± 0.02 | 256.8 ± 267.5 | B | 21.2 ± 10.4 | A | 14.7 ± 21.1 | A | 0.0001 *** |
| ethyl dec-9-enoate | 67233-91-4 | Ester | 1387 ± 2 | 38.33 ± 0.02 | 1.2 ± 0.7 | A | 72.5 ± 60.3 | B | 1.8 ± 1.8 | A | 0.004 ** |
| ethyl decanoate | 110-38-3 | Ester | 1378 ± 141 | 38.43 ± 0.02 | 25.7 ± 21.3 | AB | 232.8 ± 259.2 | B | 15.8 ± 12.6 | A | 0.041 * |
| Not identified | NA | NA | NA | 40.87 ± 0.02 | 67.7 ± 16.1 | B | 44.2 ± 41.0 | AB | 13.5 ± 23.4 | A | 0.004 ** |
| Not identified | NA | NA | NA | 40.94 ± 0.00 | 368.0 ± 134.2 | A | 604.9 ± 200.5 | B | 463 ± 152.9 | AB | 0.025 * |
Publisher’s Note: MDPI stays neutral with regard to jurisdictional claims in published maps and institutional affiliations. |
© 2022 by the authors. Licensee MDPI, Basel, Switzerland. This article is an open access article distributed under the terms and conditions of the Creative Commons Attribution (CC BY) license (https://creativecommons.org/licenses/by/4.0/).
Share and Cite
Maurice, B.; Saint-Eve, A.; Pernin, A.; Leroy, P.; Souchon, I. How Different Are Industrial, Artisanal and Homemade Soft Breads? Foods 2022, 11, 1484. https://doi.org/10.3390/foods11101484
Maurice B, Saint-Eve A, Pernin A, Leroy P, Souchon I. How Different Are Industrial, Artisanal and Homemade Soft Breads? Foods. 2022; 11(10):1484. https://doi.org/10.3390/foods11101484
Chicago/Turabian StyleMaurice, Bastien, Anne Saint-Eve, Aurélia Pernin, Pascal Leroy, and Isabelle Souchon. 2022. "How Different Are Industrial, Artisanal and Homemade Soft Breads?" Foods 11, no. 10: 1484. https://doi.org/10.3390/foods11101484
APA StyleMaurice, B., Saint-Eve, A., Pernin, A., Leroy, P., & Souchon, I. (2022). How Different Are Industrial, Artisanal and Homemade Soft Breads? Foods, 11(10), 1484. https://doi.org/10.3390/foods11101484