Abstract
Introduction: Over the last decade, the possible impact of meat intake on overall cancer incidence and mortality has received considerable attention, and authorities have recommended decreasing consumption; however, the benefits of reducing meat consumption are small and uncertain. As such, individual decisions to reduce consumption are value- and preference-sensitive. Consequently, we undertook a pilot cross-sectional study to explore people’s values and preferences towards meat consumption in the face of cancer risk. Methods and analysis: The mixed-method pilot study included a quantitative questionnaire followed by qualitative evaluation to explore the dietary habits of 32 meat eaters, their reasons for eating meat, and willingness to change their meat consumption when faced with a potential risk reduction of cancer over a lifetime based on a systematic review and dose–response meta-analysis. We recruited a convenience sample of participants from two Canadian provinces: Nova Scotia and Prince Edward Island. This project was approved by the Research Ethics Board for Health Sciences research at Dalhousie University, Canada. Results: The average weekly consumption of red meat was 3.4 servings and the average weekly consumption of processed meat was 3 servings. The determinants that influenced meat intake were similar for both red and processed meat. Taste, cost, and family preferences were the three most commonly cited factors impacting red meat intake. Taste, cost, and (lack of) cooking time were the three most commonly cited factors impacting processed meat intake. None of the participants were willing to eliminate red or processed meat from their diet. About half of participants were willing to potentially reduce their meat consumption, with one third definitely willing to reduce their consumption. Strengths and limitations: This study is the first that we are aware of to share data with participants on the association of red meat and processed meat consumption and the risk of cancer mortality and cancer incidence, including the certainty of evidence for the risk reduction. The limitations of this study include its small sample size and its limited geographic sampling. Conclusions: When presented explicit information about the small uncertain cancer risk associated with red and processed meat consumption, study participants were unwilling to eliminate meat, while about one-third were willing to reduce their meat intake.
1. Introduction
Nutrition guidelines, including Canada’s Food Guide, provide important directions for community and institutional food programs and are important tools for the promotion of healthy eating [1]. Nutritional choices are important for general health and may help prevent major illnesses, including cancer [2]. Recently, the possible influence of unprocessed red and processed meat on overall cancer incidence and mortality has received attention [3,4,5]. Unprocessed red meat (hereafter, referred to as red meat) is typically defined as any type of meat from mammals (e.g., beef, pork, lamb), whereas processed meats are defined as red or white meats preserved by smoking, curing, salting, or by the addition of preservatives [6].
Members of the public are key stakeholders for nutrition guidelines because they are ultimately left with the choice of whether or not to adhere to their recommendations [7,8]; however, to our knowledge, aside from the recent NutriRECS guideline on red and processed meat [9], all nutrition guidelines have been developed without explicit consideration or the systematic assessment of public values and preferences [7,8,10,11,12,13]. For example, the process of developing the recent Canadian Food Guidelines included public consultation about the proposed guidelines [14]; however, it is unclear how public comments and input was received, prioritized, and integrated. In addition, most guidelines suffer from a lack of systematic engagement and integration of values and preferences from members of the public [13].
The decision to modify dietary intake may be associated with despondency or pleasure that ultimately affects an individual’s overall satisfaction and quality of life [15]. Indeed, people generally have considerable reluctance or difficulty in changing either the amount or type of food they consume [15]. The values of community members with respect to nutritional issues are uncertain. For example, it is not clear how high the risk of major adverse future events, such as cancer, would have to be to motivate people to change their diet. A recent systematic review on values and preferences regarding consumption of meats of different types and health risks found that, based on a low certainty of evidence, people are attached to their general meat consumption and are typically unwilling to change their consumption for health reasons [16]. We wanted to assess this by directly asking omnivores to consider the factors (e.g., cost and taste) impacting their red and processed meat consumption and weigh them against cancer risk reduction based on up-to-date systematic summary data tailored to their typical weekly consumption of red or processed meat.
2. Methods
2.1. Design
This study is a pilot study featuring mixed methods.
2.2. Protocol Development
Based on the results of a rigorous systematic review and meta-analysis on the risk of cancer associated with red and processed meat intake [17], we developed a survey and semi-structured interview guide to elicit the values and preferences of participants regarding red and processed meat intake [18]. The study included a quantitative assessment using a questionnaire and direct choice exercise. This was followed by qualitative evaluation through semi-structured interviews to explore participants’ reasons for eating meat, as well as factors influencing their willingness to reduce or stop eating meat. The Research Ethics Board for Health Sciences research at Dalhousie University approved this project.
2.3. Participant Selection
Eligible participants were those who lived in Atlantic Canada (Nova Scotia, New Brunswick, Prince Edward Island, and Newfoundland and Labrador) and consumed red or processed meat. We recruited a convenience sample of participants using social media posts and community posters in the Halifax Regional Municipality. In addition, to help recruit those residing in Nova Scotia, flyers were distributed to local participants in the Canadian Longitudinal Study for Aging [19]. Participants were included if they consumed at least 1 weekly serving of either red meat or processed meat and were between the ages of 18 and 80. Participants were excluded if they were pregnant, had suffered a major cardiovascular event, or had ever been diagnosed with cancer.
2.4. Procedures
2.4.1. Direct-Choice Exercise
Participants completed a questionnaire that included a direct-choice exercise. First, we collected basic demographic and medical history information (e.g., age, sex, family history of cancer, current consumption of red meat, processed meat, and typical source of red and processed meat). Participants then completed a dietary survey describing their current meat intake, whether they take health risks into account when choosing their diet, and whether their food choices affect other people (e.g., preparing food for children or others in the household). We assured participants that there were no correct answers, and that we wanted to hear their genuine opinions. To standardize questions and elicit consumption patterns, we showed participants pictures illustrating types of meats and serving sizes (Appendix A).
Subsequently, using standard serving sizes of 120 g for red meat and 50 g for processed meat, we showed participants data illustrations generated using MAGICapp (https://app.magicapp.org/app#/guidelines, Accessed on 22 August 2021). These graphics were based on our meta-analytical data to illustrate the effect of eliminating the consumption of red and processed meat on the risk of dying from or developing cancer compared to average consumption [17]. The MAGICapp graphics also contained the certainty of the evidence using the GRADE approach to help inform participants’ understanding of the quality of evidence we presented to them (Appendix A). We tailored the risk reduction based on the reported weekly intake for each participant. For instance, if the participant consumed four servings per week of red meat, we presented the risk reduction associated with a reduction of four servings.
We then elicited the participant of willingness to: (i) eliminate meat, and, if they were unwilling to eliminate, to (ii) reduce their meat consumption when faced with an absolute risk reduction of overall (all-cause) cancer mortality and the lifetime risk of a diagnosis of overall cancer (incidence). Participants then ranked their level of willingness to eliminate or reduce their intake on a 1–7 Likert scale, with 1 meaning “definitely not willing to eliminate (or reduce)”, 2 or 3 meaning “somewhat not willing to eliminate (or reduce)”, 4 or 5 meaning “somewhat willing to eliminate (or reduce)”, and 6 or 7 meaning “definitely willing to eliminate (or reduce)”.
2.4.2. Semi-Structured Interview
A semi-structured interview was completed either in-person or via private video conferencing. We discussed the factors that influenced participants red and processed meat intake using open-ended questions. We also asked them how the MAGICapp figures presented to them impacted their decisions, if at all. We then discussed what the determinants were for their decision regarding changing or not changing their meat consumption patterns by referring to the Likert scale from the direct-choice exercise.
2.5. Data Synthesis and Analysis
2.5.1. Quantitative Analysis
We calculated means and standard deviations for participant demographic information, the number of servings of red and processed meat they consumed, and their willingness to eliminate or reduce their consumption.
2.5.2. Qualitative Analysis
A research assistant (VH) recorded audio, transcribed the semi-structured interviews in verbatim and used thematic analysis for the qualitative analysis [20,21]. We developed a codebook based on the participant answers. With the help of an experienced qualitative researcher (APD), the research assistant then coded text segments of the interview transcripts to represent units of meaning using MaxQDA 2018 software package (maxqda.com, Accessed: Aug 22, 2021). Next, we analyzed code reports, displayed, summarized and compared coded excerpts between interviewees, and wrote memos to track observed regularities and dissimilarities. Each of these steps enabled us to identify emerging patterns and themes. The themes were then explored and contextualized with individual characteristics of the interviewees, such as age, sex, and willingness vs. unwillingness to eliminate or reduce red or processed meat consumption.
3. Results
3.1. Participant Demographics
We recruited and interviewed 32 participants living in Nova Scotia and Prince Edward Island, Canada, in the summer of 2019. They ranged from 21–79 years old, with the largest proportion of individuals in the 23–27 age range (n = 10, 31%, Table 1). Of these, 18 were male and 14 were female. All participants completed the survey and semi-structured interview. The average weekly consumption of red meat was 3.4 servings (SD 1.7 to 5.1), and the average weekly consumption of processed meat was 3 servings (SD 0.9 to 5.1).

Table 1.
Demographic characteristics of participants.
Of the 32 participants, 31 consumed at least 1 weekly serving of red meat, and 15 consumed at least 1 weekly serving of processed meat. Fourteen of the 15 participants who consumed at least 1 weekly serving of processed meat also consumed at least 1 weekly serving of red meat.
3.2. Willingness to Eliminate or Reduce Red Meat
Twenty-eight (90%) of 31 participants were not willing to eliminate their red meat consumption (between 1 and 3 on the Likert scale). Three (9.7%) participants were “somewhat willing” to eliminate (4 or 5 on the Likert scale) while no participants were “definitely willing” to eliminate their red meat consumption (Figure 1).
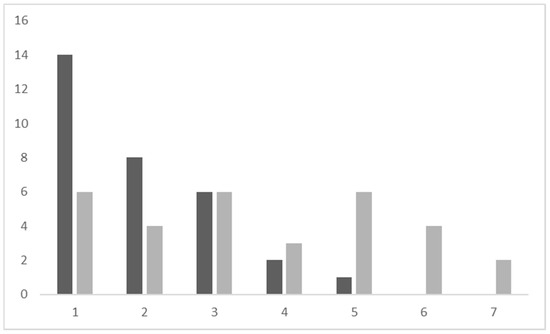
Figure 1.
Participant willingness to eliminate (dark bars) or reduce (light bars) red meat according to ranking on a Likert scale (1–7). The vertical axis refers to a number of participants. The horizontal axis refers to the Likert scale.
In contrast, when asked about the reduction of meat intake, 15 (48.4%) of 31 participants were willing to potentially reduce their red meat consumption. Six (19%) were “definitely willing” to reduce (6 or 7 on the Likert scale), nine (29%) participants were “somewhat willing” to reduce eating red meat (4 or 5 on the Likert scale). The remaining 17 (46%) were “somewhat unwilling” to “definitely unwilling” to reduce their red meat consumption (Figure 1). An approximate equal number of these participants were male and female. Half were also between 18 and 40 years old, with one participant between 41 and 60 years old and the remaining five were in the 61–80 year old category. Three were employed for wages, while four were students and the remaining five were retired or not working.
3.3. Willingness to Eliminate or Reduce Processed Meat
In total, 13 (86.7%) of the 15 participants who ate processed meat were not willing to eliminate their meat consumption (between 1 and 3 on the Likert scale). Two (13.3%) were “somewhat willing” to eliminate (4 or 5 on the Likert scale) and no participants were “definitely willing” to eliminate their processed meat consumption (Figure 2).
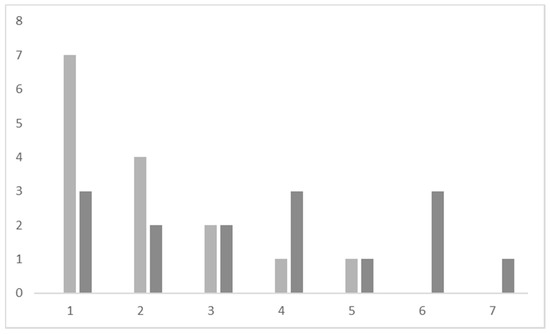
Figure 2.
Participant willingness to eliminate (light bars) or reduce (dark bars) processed meat according to ranking on a Likert scale (1–7). The vertical axis refers to the number of participants. The horizontal axis refers to Likert scale.
By contrast, when asked about reduction of meat intake, eight (53.3%) of 15 participants were potentially willing to reduce their processed meat consumption. Four (26.7%) of 15 participants were “definitely willing” to reduce their intake while the remaining four (26.7%) participants were “somewhat willing” to reduce eating processed meat (Figure 2). The age groups were approximately evenly distributed, with two between 18 and 40, one between 41 and 60 and two between 61 and 80. Similarly to red meat, one of these participants was employed, two were students, and the remaining three participants were either retired or not currently working.
3.4. Preferences and Factors Impacting Meat Consumption in the Face of Cancer Risk Reduction
The determinants that influenced participant meat intake were similar for both red and processed meat. Taste, cost, and family preferences were the three most commonly cited factors impacting red meat intake. Similarly, taste, cost, and cooking time were the three most commonly cited factors impacting processed meat intake. While cost was cited as a top factor for both, people tended to purchase less red meat and more processed meat because of the difference in expense. Similarly, health was seen as a positive factor for consuming red meat for the iron and protein content, whereas, for processed meat, it was seen as a negative factor due to the addition of preservatives, and often high sodium content. Some quotations from the participants illustrate the pattern of preferences related to meat consumption (Table 2).
Table 2.
Factors that impacted unprocessed red and processed meat intake.
Based on the semi-structured interviews, participants outlined several key reasons for consuming red and processed meat. Table 3 provides quotations supporting our findings. Participants chose red and processed meats mainly for their unique flavors, which “gives satisfaction” and “cannot be replaced” by any other types of meat or alternatives. Many of the interviewees’ inclinations for meat were related to eating habits from their family homes, to which interviewees continued to conform as adults. Preferences of nuclear family members were also influential. Partner preferences towards meat were negotiated and particular strategies of managing meat consumption were developed in some interviewees’ households. Participants also suggested that the broader social context can facilitate eating red and processed meat. A social practice of preparing and consuming meat during particular social events, i.e., barbecue parties, was a key pattern and participants often felt obliged to eat customary meat dishes.
Table 3.
Participant willingness to change their meat intake given the potential cancer risk and the main determinant(s) of their decision.
Some participants talked about price as a barrier to eating red meat. On the contrary, the lower cost of processed meat encouraged more regular consumption for some participants. Another pragmatic reason to consume processed meat was convenient access and simple preparation. On a busy day, “easy grab and go snacks”, including processed meat was, for some participants, optimal for satisfying hunger. When talking about reasons to consume red meat, some mentioned health factors, including meat as part of a balanced diet with substantive nutritional value. Those responses corresponded with recalling claims about red meat being a part of a healthy diet. Finally, some participants perceived negative environmental consequence of meat production as a motivation to reduce eating meat.
Study participants who were willing to reduce their red or processed meat intake cited several reasons for their decision. Some viewed the evidence presented to them as convincing and “something to be concerned about.” They also referred to common knowledge regarding processed foods as being generally unhealthy as a reason to reduce their intake of processed meat. Others used the evidence shown to them as further motivation to change their consumption patterns, as they were already considering a possible change before we interviewed them. One participant was especially concerned about the environmental impact of meat consumption and reported that the evidence presented could “help push [them] over the edge” to reduce their consumption.
4. Discussion
4.1. Main Findings
The 32 participants in Atlantic Canada who informed us on their willingness to eliminate or reduce their meat intake based on the best available systematic review evidence, consumed on average 3.4 servings of red meat and 3 servings of processed meat per week. Based on our results, the main determinants of dietary behavior that influenced red and processed meat intake, included taste, cost, cultural habits, and ease access or preparation time. About half of the participants were willing to potentially reduce their intake, with one third of participants stating that they were “definitely willing” to reduce eating meat; however, none of the participants were willing to completely stop their meat consumption. Although we had a limited sample size, results were generally consistent regardless of age, sex, and employment status (e.g., student, worker, retired) with respect to the amount of meat consumed weekly and participant willingness to eliminate or reduce meat intake.
Many participants who were willing to reduce their red or processed meat intake were already conscious of current health trends with respect to meat consumption based on mainstream media reports, with particular attention paid to perceived increased cancer risk associated with higher levels of consumption. Several participants mentioned that they would be more willing to reduce their processed meat intake because of this increased attention [3,22]; however, most participants valued the taste of meat, their family preferences, or the low cost of meat more than evidence demonstrating a possible risk reduction in cancer, suggesting an overall unwillingness to consider making a change. Many of these participants were “definitely unwilling” to change their consumption patterns and several could not think of any reasons that would lead them to consider making a change in the future.
4.2. Comparison to Other Similar Studies
A recent systematic review on values and preferences regarding consumption of meats of different types and health risks found that, based on a low certainty of evidence, people are highly attached to their general meat consumption and are unwilling to change their consumption for health reasons [16]. We wanted to assess this by directly asking omnivores to consider factors (e.g., cost, taste) impacting their red and processed meat consumption and weigh them in terms of cancer risk reduction based on an up-to-date systematic summary of data tailored to their typical weekly consumption. While dietary guidelines often provide opportunity for public feedback on the initial guideline structure and objectives, as well as the preliminary findings [2,5], to our knowledge they do not incorporate public values and preferences based on the estimated risks and corresponding certainty of evidence. Based on guidance from the GRADE working group and the National Guideline Clearinghouse Extent Adherence to Trustworthy Standards (NEATS) on optimal guideline methods, our study design and findings on value and preferences should be of interest to those making dietary recommendations on red and processed meat [23,24].
4.3. Strengths and Limitations
Our study has a number of strengths. First, we shared real data from a high-quality systematic review of red meat and processed meat consumption and risk of cancer mortality and cancer incidence studies [9,17]. Second, we presented the certainty of evidence for the association of meat intake and cancer risk generated using the GRADE approach. Based on previous research, we anticipated that if participants were shown the best estimate of cancer reduction, as well as the certainty of this reduction, which was low to very low based on the GRADE assessments, their responses may be different than if they were shown only the risk reduction. Third, using the dose–response meta-analysis data from a systematic review [17], we tailored the reduction in cancer risk over a lifetime for each participant based on their reported number of servings of red and processed meat per week. Many participants stated that the evidence was not conclusive enough to warrant a change in meat consumption habits, suggesting that an understanding of the limitations of the evidence on meat intake and cancer risk, primarily based on observational data, which is at risk of confounding and thus lower certainty, is informative when making nutrition decisions.
The limitations of this study include its sample size of only 32 participants, its limited geographical representation, its uneven age distribution, and its focus on the impact of meat on cancer risk with omission of cardiovascular risk. Regarding the omission, although we conducted a systematic review and dose–response meta-analysis on cardiovascular disease [25], the evidence was less compelling when compared to cancer risk [17]. This was a pilot study to test our study methods and to develop our study protocol for a larger study [18]. An additional limitation of note is that after presenting the potential risk reductions together with the uncertainty of evidence, rather than asking participants about their willingness to both decrease and increase their meat intake, we only asked participants if they were willing to decrease their meat intake. In the qualitative interviews, although we did not directly ask participants, none mentioned that they may be inclined to increase their intake after seeing the uncertainty of evidence.
4.4. Implications
Although we are the first to collect value and preference data based on a systematic review of the evidence on red meat and processed meat consumption and potential cancer risk, the generalizability of our results is limited. To help overcome this limitation and explore the consistency of our findings, we aim to also conduct this study in multiple countries [18]. To improve adherence and optimally develop dietary guidelines, as is done in evidence-based clinical practice, patient and public values and preferences should be closely considered. Ideally, dietary guidelines should be based on the best summaries of the absolute risks and the corresponding certainty of the evidence for the potential risks associated with meat consumption. Indeed, participants demonstrated that they are interested in the level of certainty, and that certainty of evidence played a role in their decision-making process.
5. Conclusions
When presented explicit information about cancer risk reduction associated with red and processed meats, omnivores valued competing factors such as the taste, cost, family and cultural norms, and ease of preparation over the small uncertain risk of cancer. Study participants were unwilling to eliminate meat, while about one-third were definitely willing to reduce their meat intake. Although we had a limited sample size, the results were generally consistent regardless of age, sex, and employment status (student, employed, and retired) with respect to the amount of meat consumed weekly and participant willingness to eliminate or reduce their meat intake.
Author Contributions
Conceptualization, B.C.J., A.P.-D., C.V., M.M.B., G.H.G. and P.A.-C.; methodology, V.H., B.C.J., A.P.-D., C.V., J.Z., M.M.B., and P.A.-C.; software, V.H., A.P.-D.; formal analysis, V.H., A.P.-D., B.C.J.; writing—original draft preparation, V.H., A.P.-D., B.C.J.; writing—review and editing, V.H., A.P.-D., C.V., M.M.B., J.Z., P.A.-C., B.C.J.; supervision, A.P.-D., and B.C.J.; All authors have read and agreed to the published version of the manuscript.
Funding
This research received no external funding.
Institutional Review Board Statement
The study was conducted according to the guidelines of the Declaration of Helsinki, and approved by the Research Ethics Board of Dalhousie University (protocol code 2019-4715, 7 May 2019).
Informed Consent Statement
Informed consent was obtained from all subjects involved in the study.
Data Availability Statement
Additional data is available upon.
Conflicts of Interest
Disclosures: B.C.J., M.M.B., P.A.-C. are GRADE working group members; G.H.G. is the Co-Chair of the GRADE working group. B.C.J. has received a grant from Texas A&M AgriLife Research to fund investigator-initiated research related to saturated and polyunsaturated fats. The grant was from Texas A&M AgriLife institutional funds from interest and investment earnings, not a sponsoring organization, industry, or company. AgriLife Research played no role in the conduct of this study. This study began in the January of 2019 at Dalhousie University, approximately one year prior to BCJ joining Texas A&M University in January 2020. Study recruitment was completed in September 2019, analysis completed in December of 2019, and write-up was completed in the summer of 2020. Otherwise, the authors claim no other relationships or activities that could appear to have influenced the submitted work.
Appendix A. MAGIC Graphic Decision Aids for the Direct-Choice Exercise
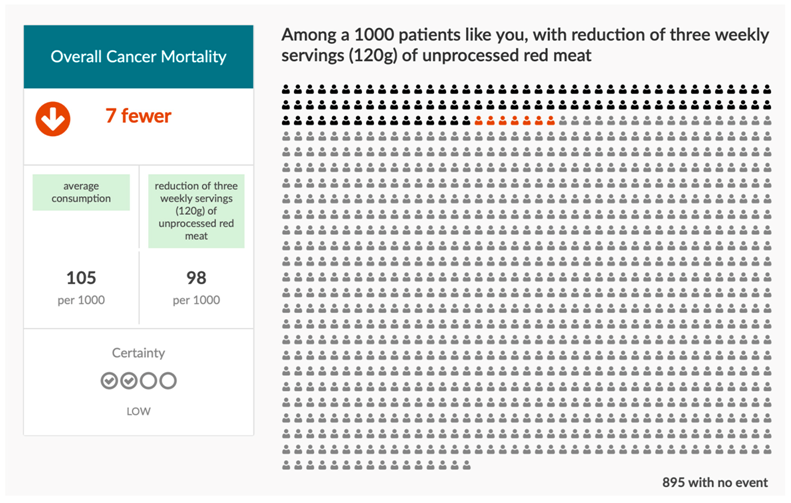
After completing a general demographic and dietary questionnaire, participants were presented with a direct choice exercise, which included graphics like the one above that were tailored to participants current weekly consumption of red or processed meat.
The following explanation of the graphic was provided:
“Based on our study, for people consuming 3 servings per week of red meat, the risk of dying from cancer is 10.5%. This means that, out of 1000 people, approximately 105 will die from cancer and 895 will not. For people consuming 3 fewer weekly servings of red meat, the risk of risk of dying from cancer is 9.8%. This means that, out of 1000 people, approximately 98 will die from cancer and 902 will not. Overall, seven fewer people will die from cancer when consuming three fewer weekly servings of red meat compared to not decreasing their processed meat intake. The level of certainty of this evidence is low, which means that this, while this effect may be true, it could also not be true.”
References
- Willet, W.; McCullough, M. Dietary pattern analysis for the evaluation of dietary guidelines. Asia Pac. J. Clin. Nutr. 2008, 17 (Suppl. 1), 75–78. [Google Scholar]
- Government of Canada. Canada’s Food Guide: Benefits of Healthy Eating Patterns. Available online: https://food-guide.canada.ca/en/healthy-eating-recommendations/make-it-a-habit-to-eat-vegetables-fruit-whole-grains-and-protein-foods/ (accessed on 22 August 2021).
- Bouvard, V.; Loomis, D.; Guyton, K.Z.; Grosse, Y.; Ghissassi, F.E.; Benbrahim-Tallaa, L.; Guha, N.; Mattock, H.; Straif, K. International Agency for Research on Cancer Monograph Working Group. Carcinogenicity of consumption of red and processed meat. Lancet Oncol. 2015, 16, 1599–1600. [Google Scholar] [CrossRef]
- International Agency for Research in Cancer (IARC). Monographs on the evaluation of carcinogenic risks to humans. Red Process. Meat. 2015, 114. Available online: https://monographs.iarc.who.int/wp-content/uploads/2018/06/mono114.pdf (accessed on 22 August 2021).
- United States Dietary Guidelines for Americans. 2015–2020 Dietary Guidelines for Americans; US Department of Health and Human Services: Rockville, MD, USA, 2015.
- Wiseman, M. The second World Cancer Research Fund/American Institute for Cancer Research expert report. Food, nutrition, physical activity, and the prevention of cancer: A global perspective. Proc. Nutr. Soc. 2008, 67, 253–256. [Google Scholar] [CrossRef] [PubMed]
- Erickson, J.; Sadeghirad, B.; Lytvyn, L.; Slavin, J.; Johnston, B.C. The Scientific Basis of Guideline Recommendations on Sugar Intake: A Systematic Review. Ann. Intern. Med. 2017, 166, 257–267. [Google Scholar] [CrossRef] [PubMed]
- Rabassa, M.; Garcia-Ribera Ruiz, S.; Sola, I.; Pardo-Hernandez, H.; Alonso-Coello, P.; Garcia, L.M. Nutrition Guidelines vary widely in methodological quality: An overview of reviews. J. Clin. Epidemiol. 2018, 104, 62–72. [Google Scholar] [CrossRef] [PubMed]
- Johnston, B.C.; Zeraatkar, D.; Han, M.A.; Vernooij, R.W.M.; Valli, C.; El Dib, R.; Marshall, C.; Stover, P.J.; Fairweather-Taitt, S.; Wójcik, G.; et al. Unprocessed Red Meat and Processed Meat Consumption: Dietary Guideline Recommendations from the Nutritional Recommendations (NutriRECS) Consortium. Ann. Intern. Med. 2019, 171, 756–764. [Google Scholar] [CrossRef] [PubMed]
- Brouwers, M.C.; Kho, M.E.; Browman, G.P.; Burgers, J.S.; Cluzeau, F.; Feder, G.; Fervers, B.; Graham, I.D.; Grimshaw, J.; Hanna, S.E.; et al. AGREE II: Advancing guideline development, reporting and evaluation in health care. CMAJ 2010, 182, E839–E842. [Google Scholar] [CrossRef] [PubMed]
- Institute of Medicine (US) Committee on Standards for Developing Trustworthy Clinical Practice Guidelines. Clinical Practice Guidelines We Can Trust; National Academies Press: Washington, DC, USA, 2011.
- Blake, P.; Durão, S.; Naude, C.E.; Bero, L. An analysis of methods used to synthesize evidence and grade recommendations in food-based dietary guidelines. Nutr. Rev. 2018, 76, 290–300. [Google Scholar] [CrossRef] [PubMed]
- Johnston, B.C.; Alonso-Coello, P.; Bala, M.M.; Zeraatkar, D.; Rabassa, M.; Valli, C.; Marshall, C.; El Dib, R.; Vernooij, R.W.M.; Vandvik, P.O.; et al. Methods for trustworthy nutritional recommendations NutriRECS (Nutritional Recommendations and Accessible Evidence Summaries Composed of Systematic reviews): A Protocol. BMC Med. Res. Methodol. 2018, 18, 162. [Google Scholar] [CrossRef] [PubMed]
- Health Canada. Revision Processed for Canada’s Food Guide. 2019. Available online: https://www.canada.ca/en/health-canada/services/canada-food-guide/about/revision-process.html#a3 (accessed on 22 August 2021).
- Shepherd, R.; Shepherd, R. Resistance to changes in diet. Proc. Nutr. Soc. 2002, 61, 267–272. [Google Scholar] [CrossRef] [PubMed]
- Valli, C.; Rabassa, M.; Johnston, B.C.; Kuijpers, R.; Prokop-Dorner, A.; Zajac, J.; Storman, D.; Storman, M.; Bala, M.M.; Sola, I.; et al. Health-Related Values and Preferences Regarding Meat Consumption: A Mixed-Methods Systematic Review. Ann. Intern. Med. 2019, 171, 742–755. [Google Scholar] [CrossRef] [PubMed]
- Han, M.A.; Zeraatkar, D.; Guyatt, G.H.; Vernooij, R.W.M.; El Dib, R.; Zhang, Y.; Algarni, A.; Leung, G.; Storman, D.; Valli, C.; et al. Reduction of Red and Processed Meat Intake and Cancer Mortality and Incidence: A Systematic Review and Meta-analysis of Cohort Studies. Ann. Intern. Med. 2019, 171, 711–720. [Google Scholar] [CrossRef] [PubMed]
- Valli, C.; Howatt, V.; Prokop-Dorner, A.; Rabassa, M.; Johnston, B.C.; Zajac, J.; Han, M.A.; Kenji Nampo, F.; Guyatt, G.H.; Bala, M.M.; et al. Evaluating adults’ health-related values and preferences about unprocessed red meat and processed meat consumption: Protocol for a cross-sectional mixed-methods study. F1000Research 2020, 9, 346. [Google Scholar] [CrossRef] [PubMed]
- Raina, P.S.; Wolfson, C.; Kirkland, S.A.; Griffith, L.E.; Oremus, M.; Patterson, C.; Wister, A. The Canadian longitudinal study on aging (CLSA). Can. J. Aging 2009, 28, 221–229. [Google Scholar] [CrossRef] [PubMed]
- Boyatzis, R.E. Transforming Qualitative Information: Thematic Analysis and Code Development; Sage: Thousand Oaks, CA, USA, 1999. [Google Scholar]
- Guest, G.; MacQueen, K.M.; Namey, E.M. Applied Thematic Analysis; Sage: Thousand Oaks, CA, USA, 2011. [Google Scholar]
- Prochaska, J.O.; Velicer, W.F. The Transtheoretical Model of Health Behavior Change. Am. J. Health Promot. 1997, 12, 38–48. [Google Scholar] [CrossRef] [PubMed]
- Andrews, J.C.; Schünemann, H.J.; Oxman, A.D.; Pottie, K.; Meerpohl, J.J.; Coello, P.A.; Rind, D.; Montori, V.M.; Brito, J.P.; Norris, S.; et al. GRADE guidelines: 15. Going from evidence to recommendation-determinants of a recommendation’s direction and strength. J. Clin. Epidemiol. 2013, 66, 726–735. [Google Scholar] [CrossRef] [PubMed]
- Jue, J.J.; Cunningham, S.; Lohr, K.; Shekelle, P.; Shiffman, R.; Robbins, C.; Nix, M.; Coates, V.; Schoelles, K. Developing and Testing the Agency for Healthcare Research and Quality’s National Guideline Clearinghouse Extent of Adherence to Trustworthy Standards (NEATS) Instrument. Ann. Intern. Med. 2019, 170, 480–487. [Google Scholar] [CrossRef] [PubMed]
- Zeraatkar, D.; Han, M.A.; Guyatt, G.H.; Vernooij, R.W.M.; El Dib, R.; Cheung, K.; Milio, K.; Zworth, M.; Bartoszko, J.J.; Valli, C.; et al. Red and Processed Meat Consumption and Risk for All-Cause Mortality and Cardiometabolic Outcomes: A Systematic Review and Meta-analysis of Cohort Studies. Ann. Intern. Med. 2019, 171, 703–710. [Google Scholar] [CrossRef] [PubMed]
Publisher’s Note: MDPI stays neutral with regard to jurisdictional claims in published maps and institutional affiliations. |
© 2021 by the authors. Licensee MDPI, Basel, Switzerland. This article is an open access article distributed under the terms and conditions of the Creative Commons Attribution (CC BY) license (https://creativecommons.org/licenses/by/4.0/).