
Egg Freshness Evaluation Using Transmission and Reflection of NIR Spectroscopy Coupled Multivariate Analysis

Abstract
: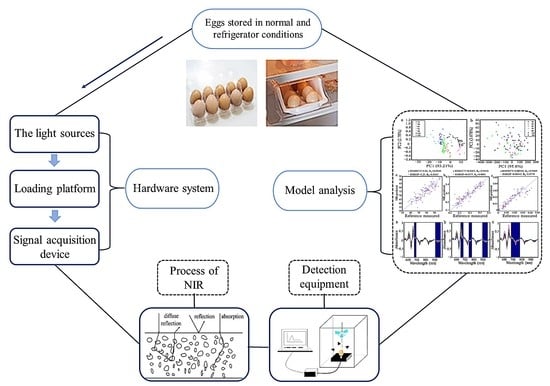
1. Introduction
2. Materials and Methods
2.1. Sample Preparation
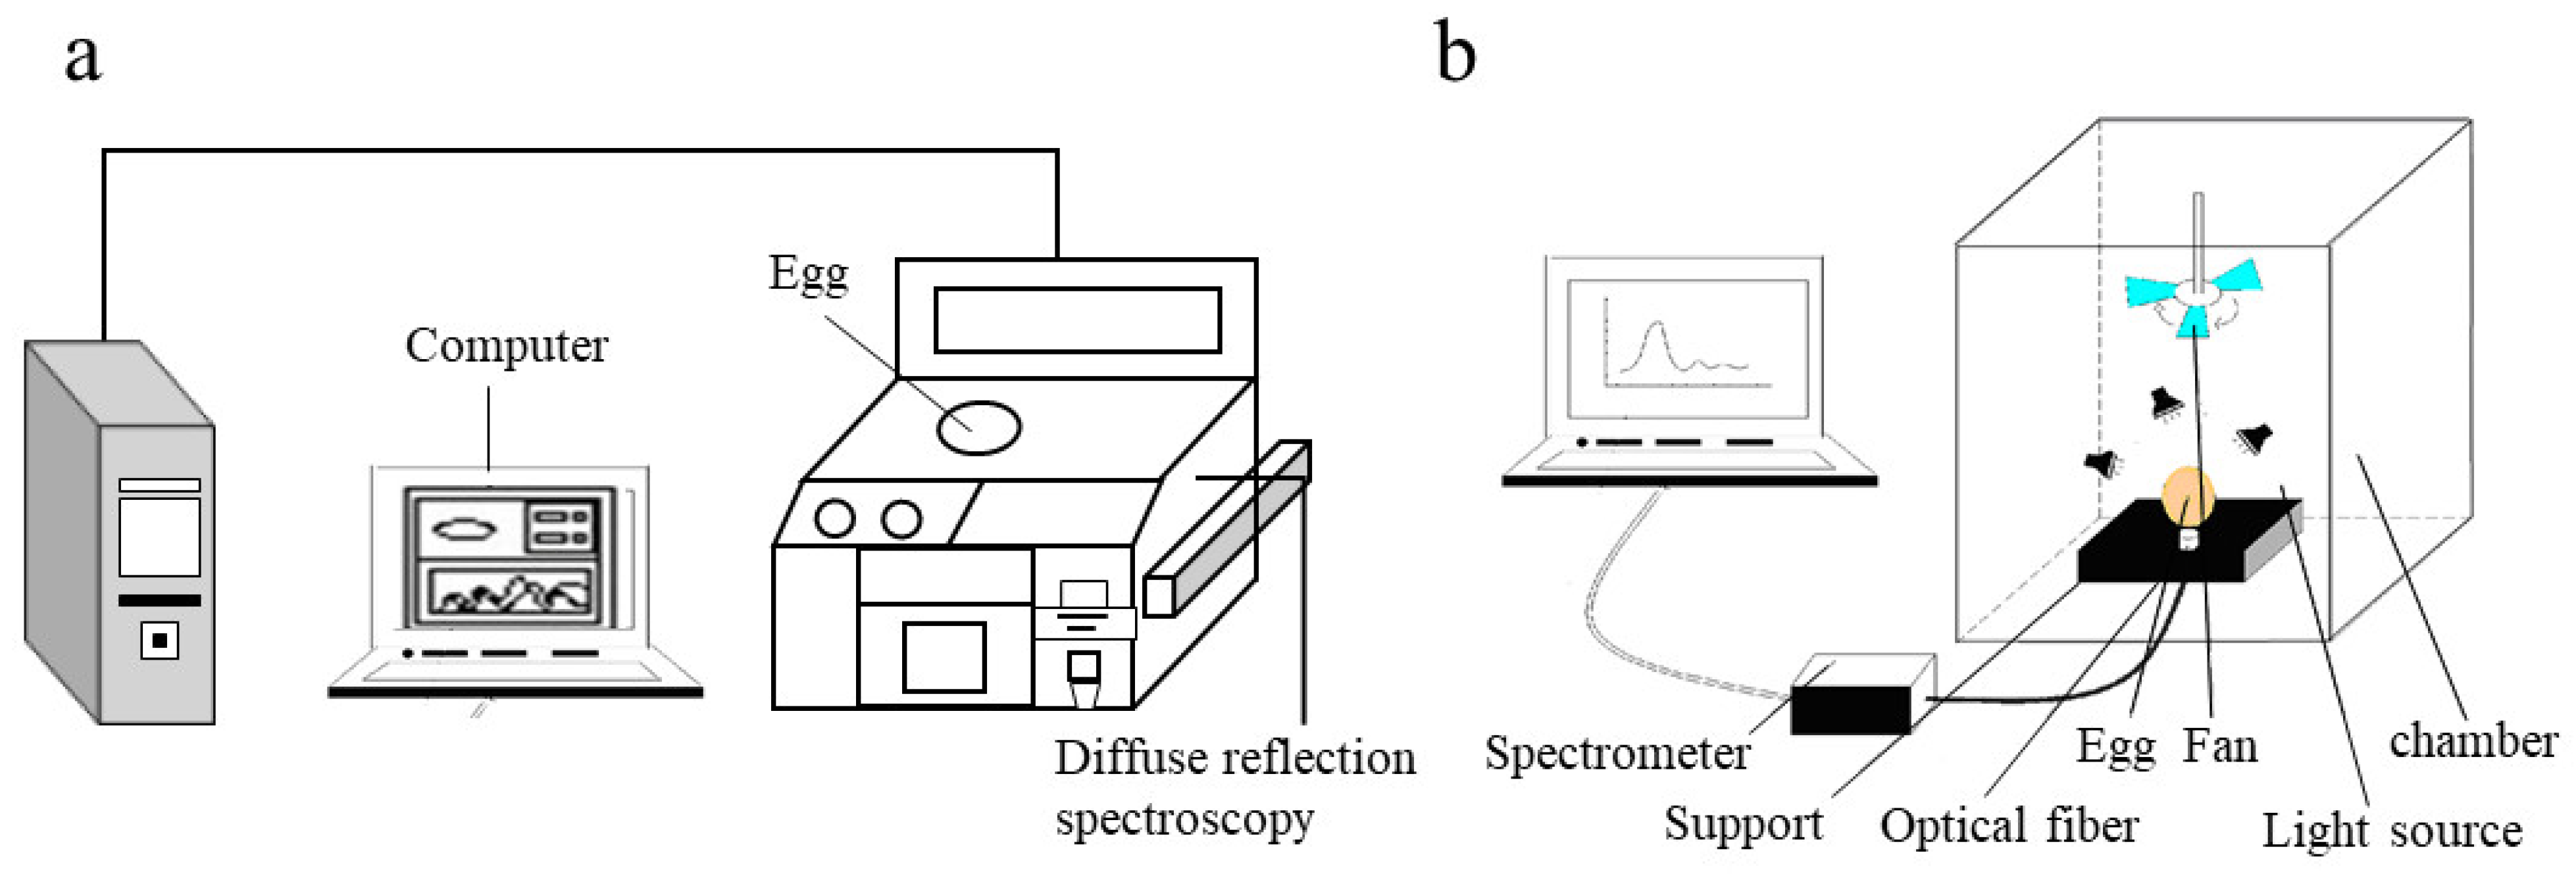
2.2. NIR Spectroscopy Measurement
2.2.1. Diffuse Reflectance Measurement
2.2.2. Diffuse Transmittance Measurement
2.3. Destructive Measurement
2.3.1. Weight Loss (%)
2.3.2. Yolk Index (YI)
2.3.3. Haugh Unit (HU)
2.4. Spectral Data Preprocessing
2.5. Multivariate Calibrations
2.5.1. Principal Component Analysis (PCA)
2.5.2. Linear Discriminant Analysis (LDA)
2.5.3. Synergy Interval Partial Least Squares (Si-PLS)
2.6. Software
3. Results and Discussion
3.1. Physical Indexes Analysis with Eggs Storage Time Changes
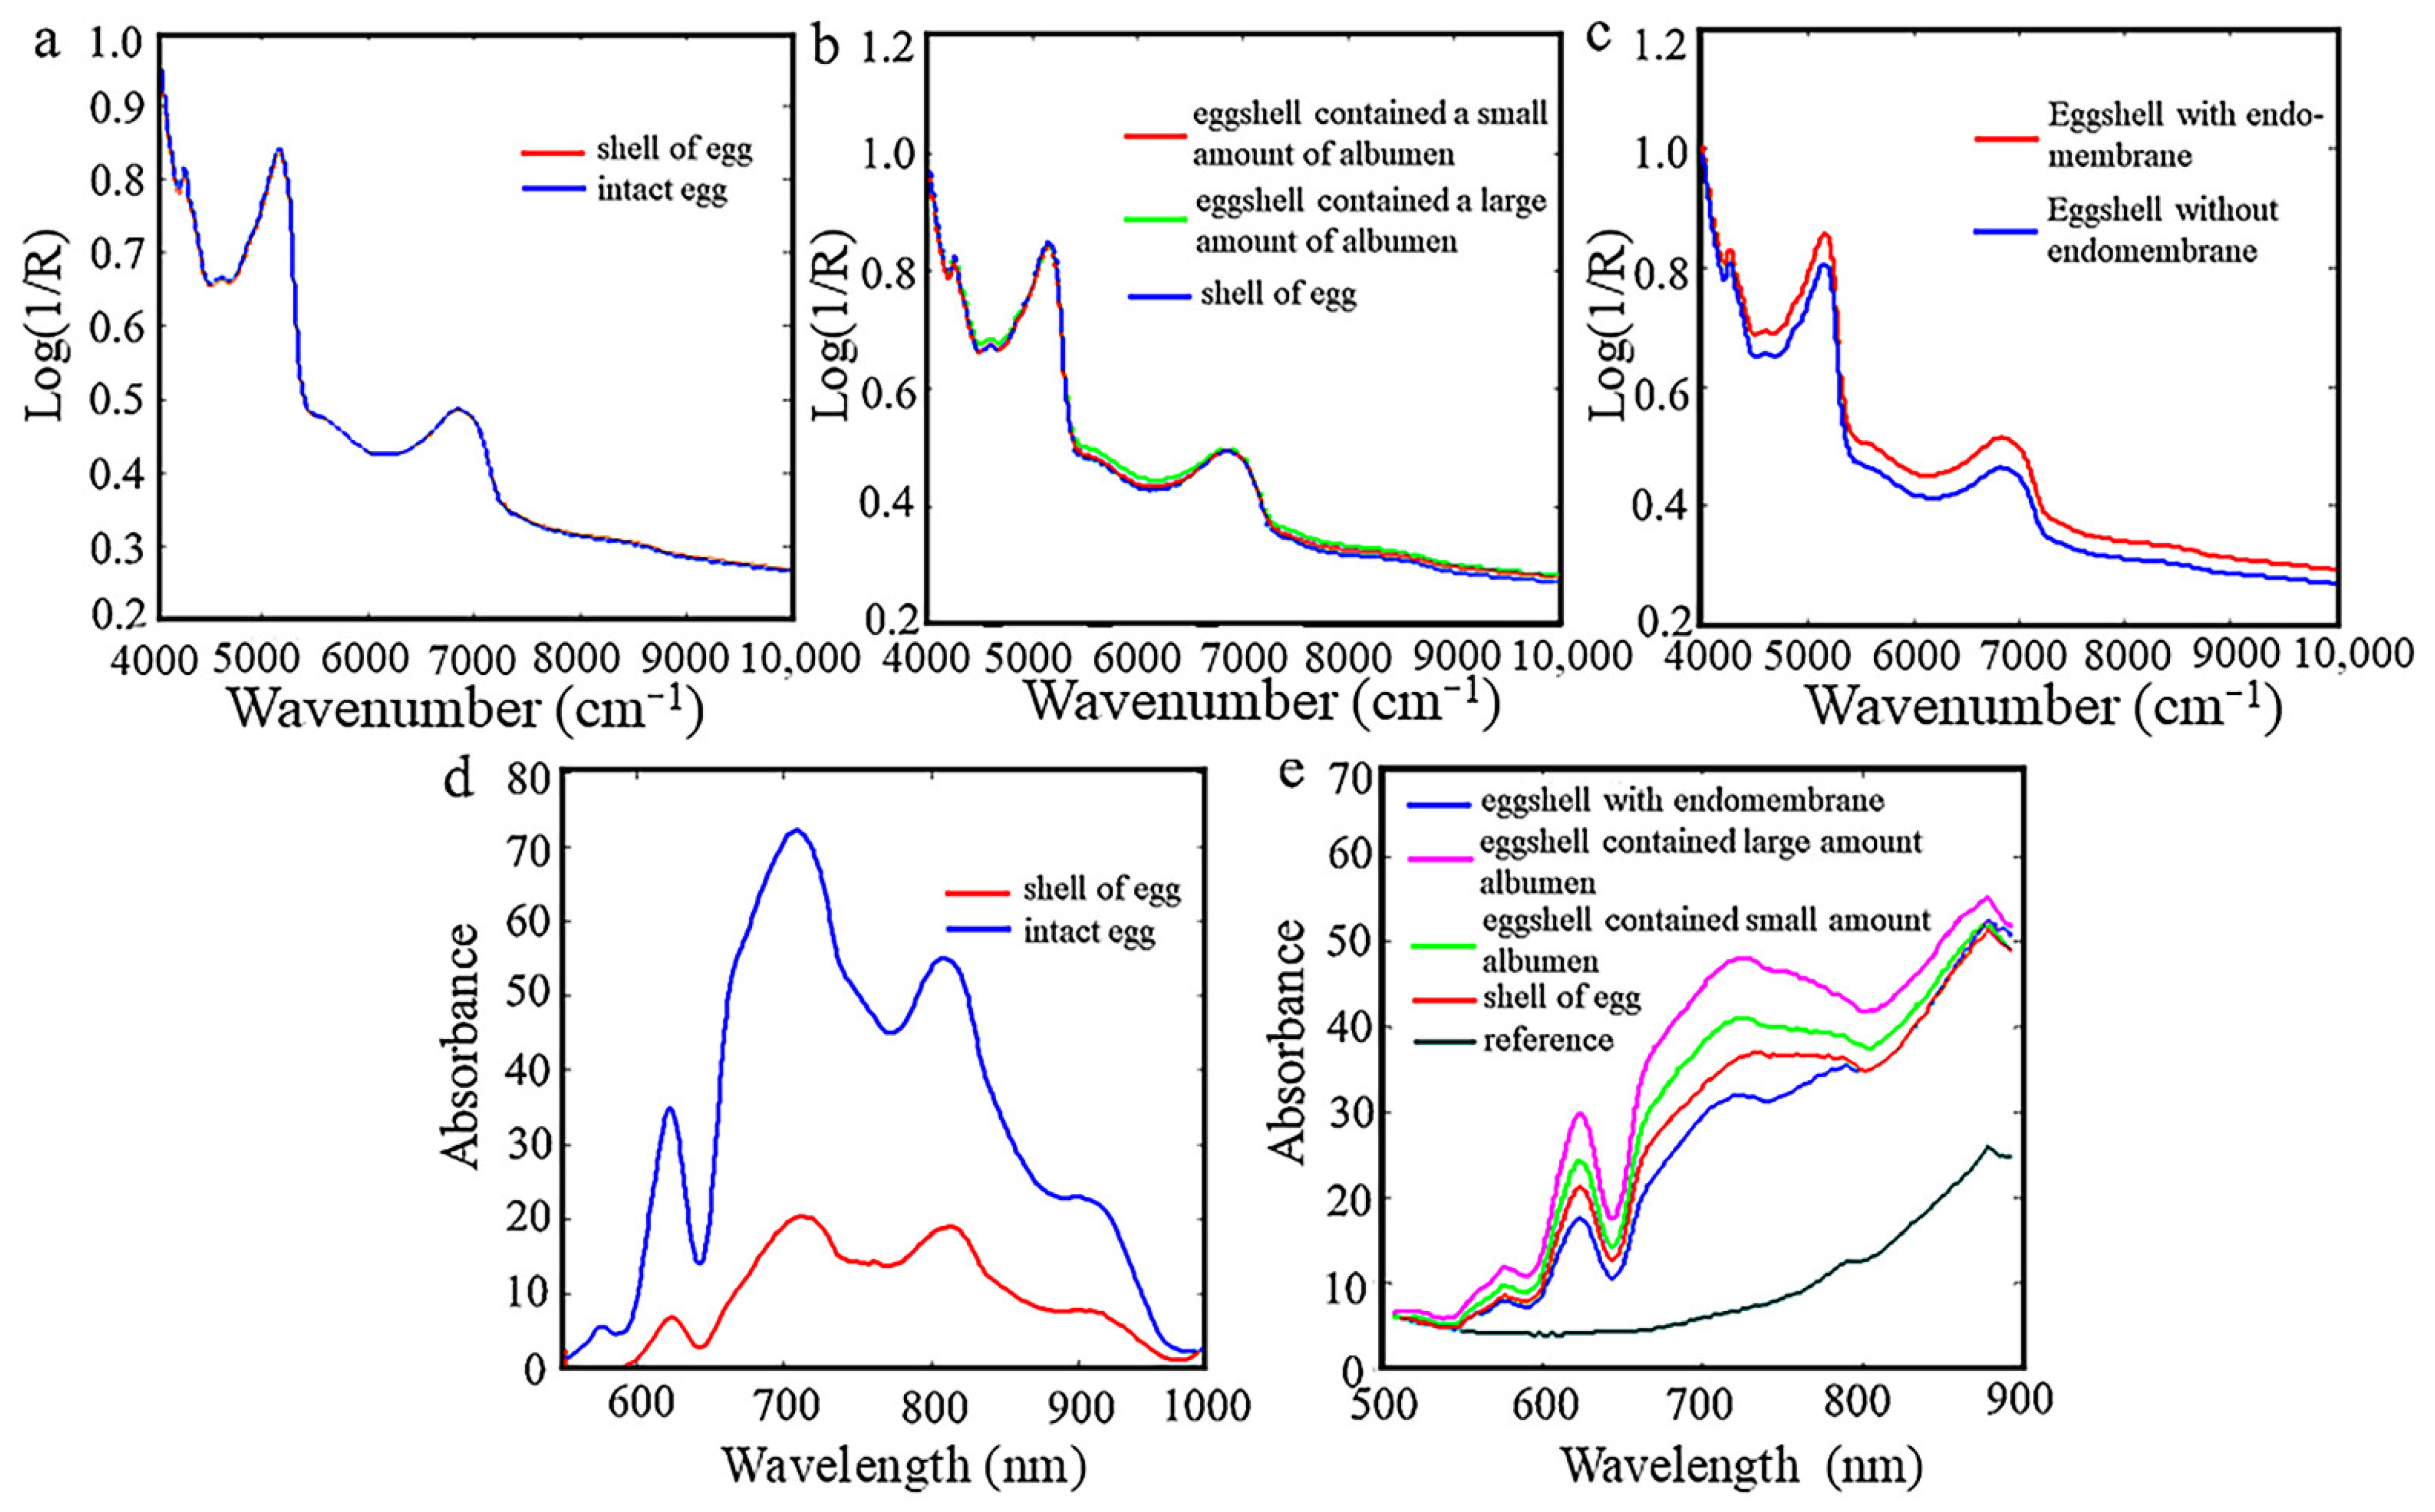
3.2. Comparison of Egg NIR Spectra with Different Patterns
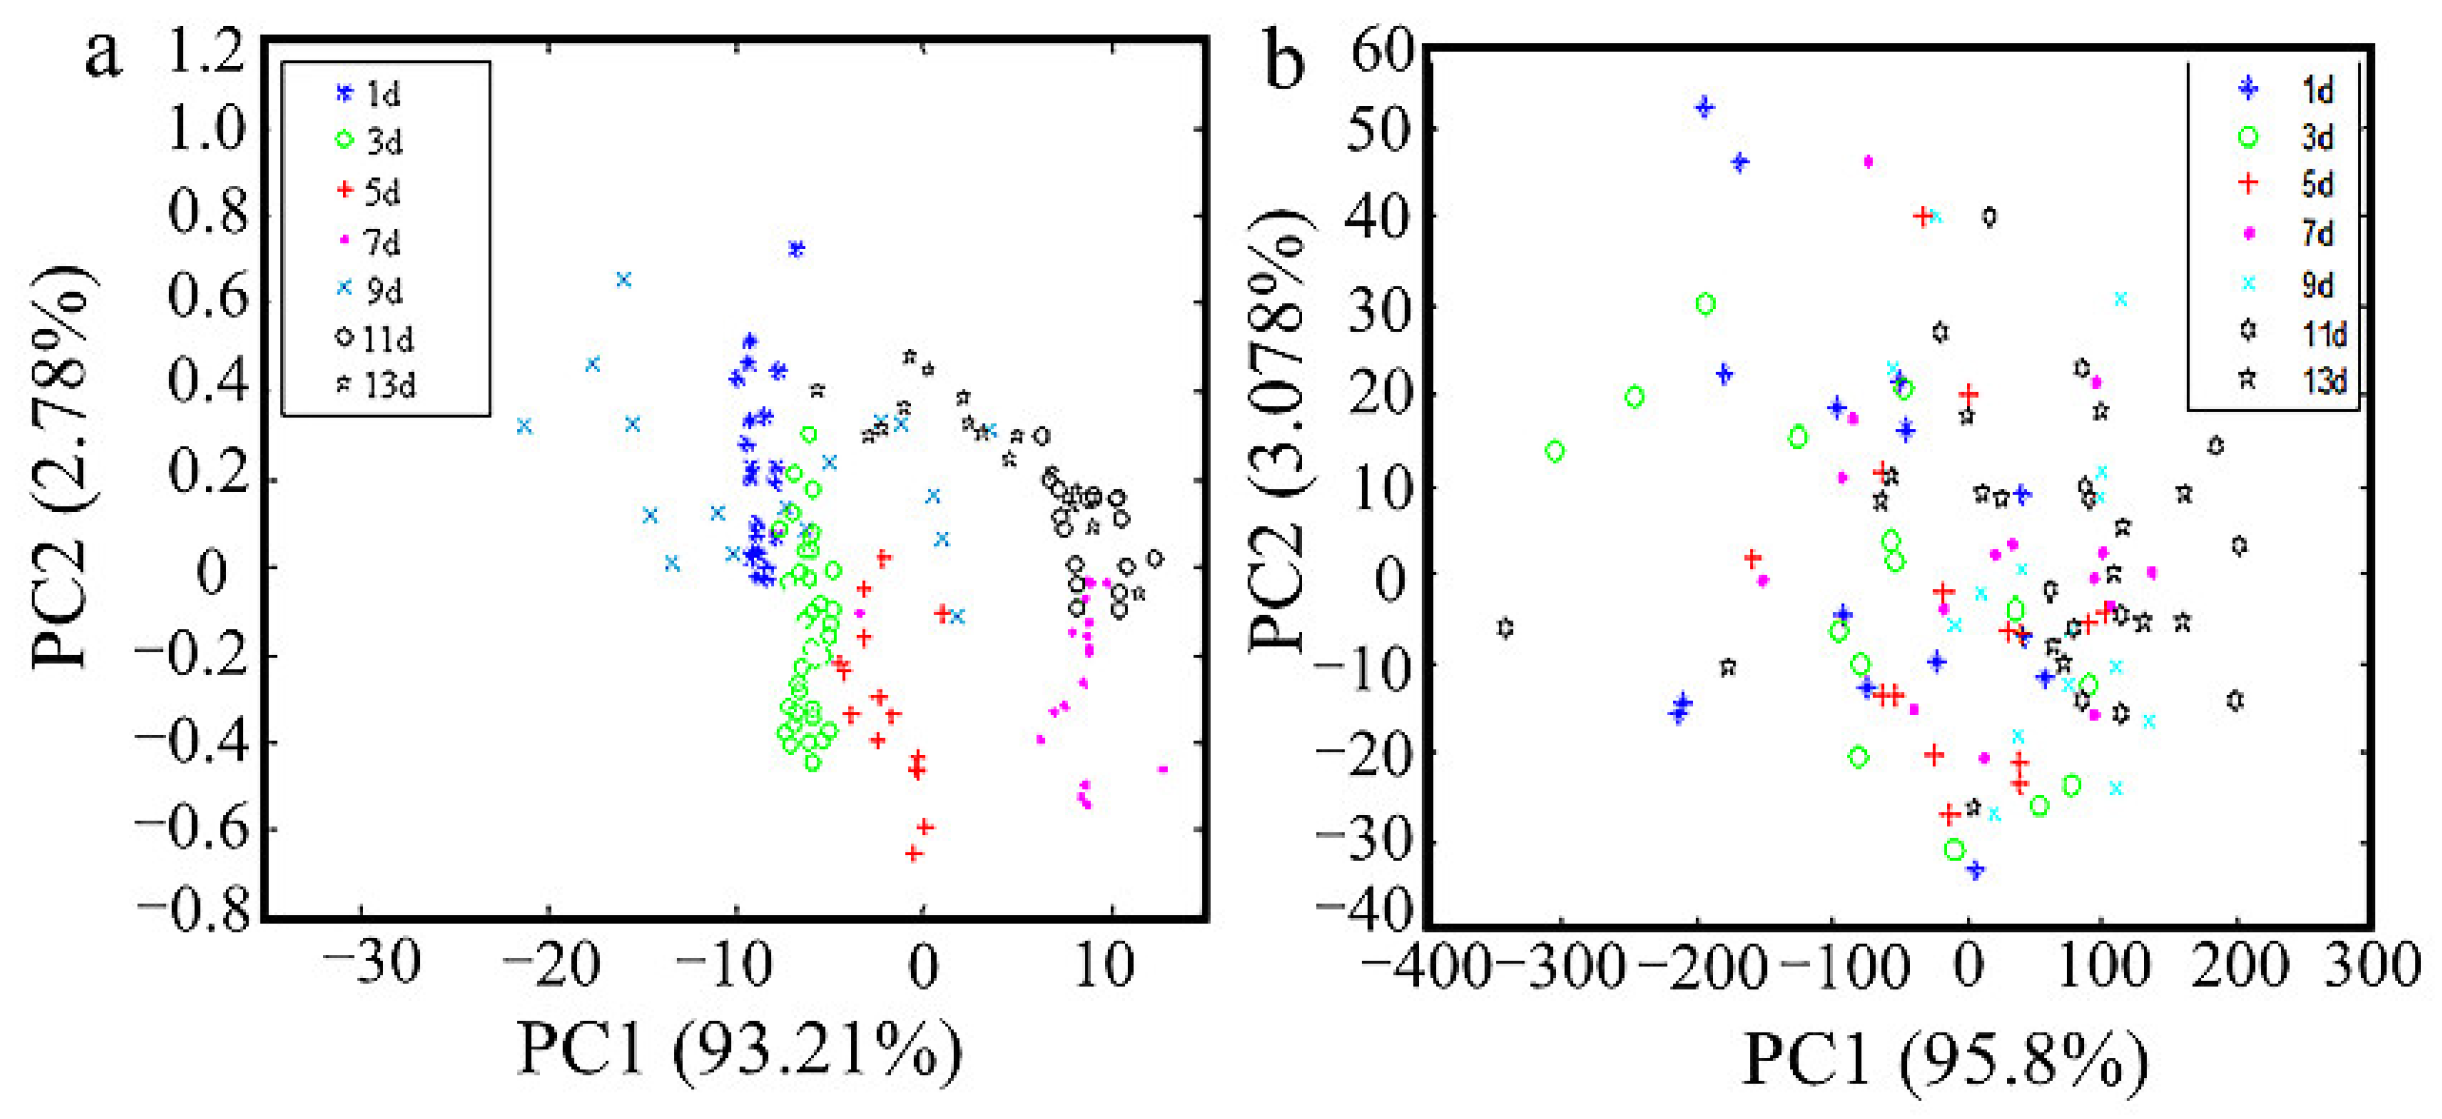
3.3. Data Processed by PCA Algorithm
3.4. Calibration of Models
3.5. Qualitative Identification of Eggs with Different Storage Time
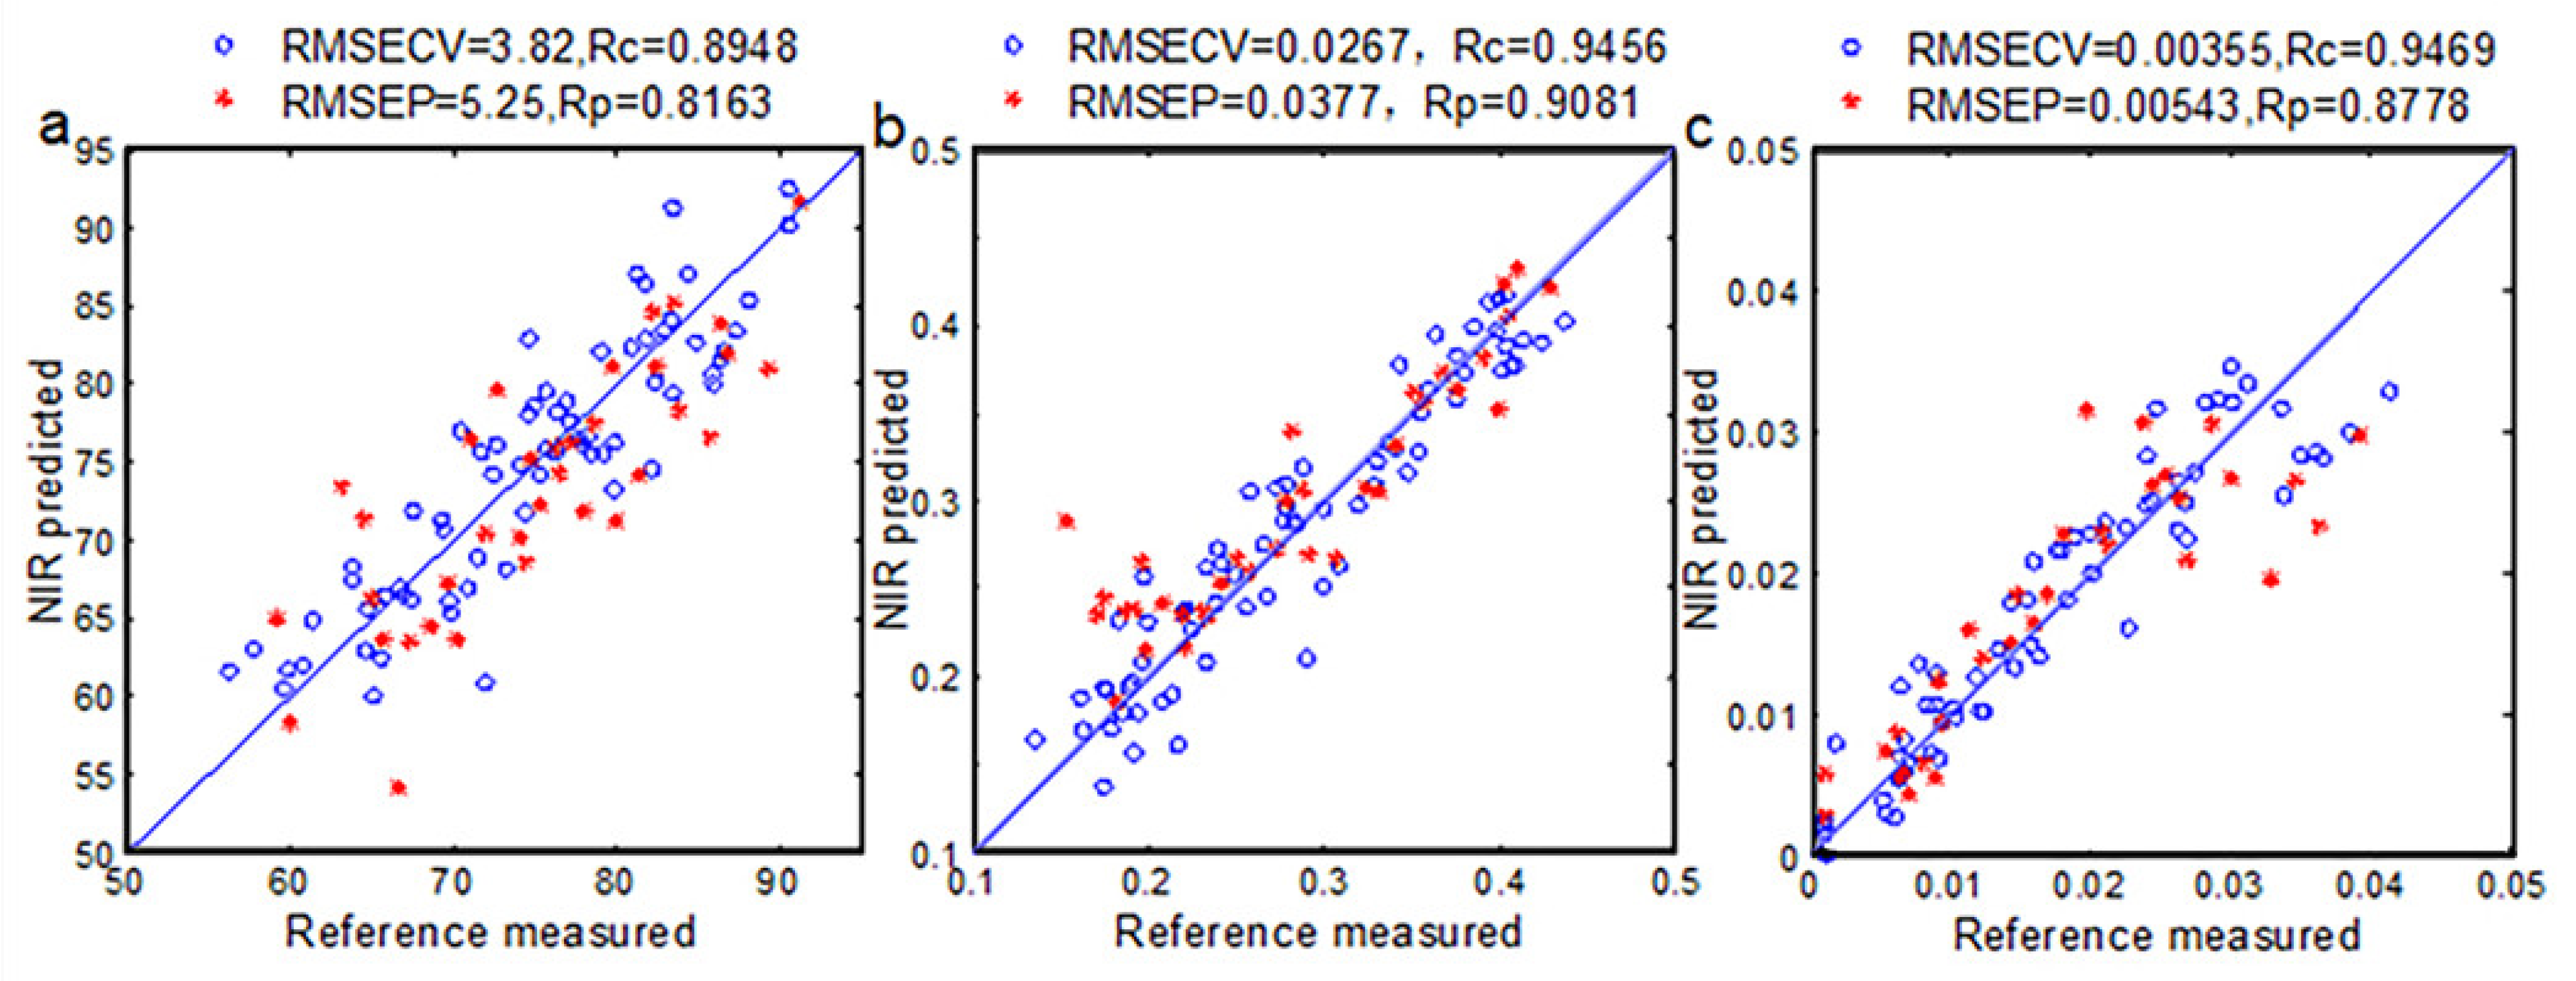
3.6. Quantitative Analysis of Eggs Freshness Using Si-PLS Models
4. Conclusions
Author Contributions
Funding
Acknowledgments
Conflicts of Interest
References
- Karoui, R.; Kemps, B.; Bamelis, F.; De Ketelaere, B.; Decuypere, E.; De Baerdemaeker, J. Methods to evaluate egg freshness in research and industry: A review. Eur. Food Res. Technol. 2005, 222, 727–732. [Google Scholar] [CrossRef]
- Saleh, G.; El Darra, N.; Kharroubi, S.; Farran, M.T. Influence of storage conditions on quality and safety of eggs collected from Lebanese farms. Food Control. 2020, 111. [Google Scholar] [CrossRef]
- Marzec, A.; Damaziak, K.; Kowalska, H.; Riedel, J.; Michalczuk, M.; Koczywąs, E.; Cisneros, F.; Lenart, A.; Niemiec, J. Effect of hens age and storage time on functional and physiochemical properties of eggs. J. Appl. Poult. Res. 2019, 28, 290–300. [Google Scholar] [CrossRef]
- Yimenu, S.M.; Koo, J.; Kim, J.Y.; Kim, J.H.; Kim, B.S. Kinetic modeling impacts of relative humidity, storage temperature, and air flow velocity on various indices of hen egg freshness. Poult. Sci. 2018, 97, 4384–4391. [Google Scholar] [CrossRef] [PubMed]
- Zhang, W.; Pan, L.; Tu, S.; Zhan, G.; Tu, K. Non-destructive internal quality assessment of eggs using a synthesis of hyperspectral imaging and multivariate analysis. J. Food Eng. 2015, 157, 41–48. [Google Scholar] [CrossRef]
- Coronel-Reyes, J.; Ramirez-Morales, I.; Fernandez-Blanco, E.; Rivero, D.; Pazos, A. Determination of egg storage time at room temperature using a low-cost NIR spectrometer and machine learning techniques. Comput. Electron. Agric. 2018, 145, 1–10. [Google Scholar] [CrossRef] [Green Version]
- Giunchi, A.; Berardinelli, A.; Ragni, L.; Fabbri, A.; Silaghi, F.A. Non-destructive freshness assessment of shell eggs using FT-NIR spectroscopy. J. Food Eng. 2008, 89, 142–148. [Google Scholar] [CrossRef]
- Zhao, J.; Lin, H.; Chen, Q.; Huang, X.; Sun, Z.; Zhou, F. Identification of egg′s freshness using NIR and support vector data description. J. Food Eng. 2010, 98, 408–414. [Google Scholar] [CrossRef]
- Kaveh Mollazade, S.J. Andreas Nüchter Measuring internal quality traits in egg by 3D laser imaging. J. Food Eng. 2021. [Google Scholar] [CrossRef]
- Jones, D.R.; Musgrove, M.T.; Northcutt, J.K. Variations in external and internal microbial populations in shell eggs during extended storage. J. Food Prot. 2004, 67, 4. [Google Scholar] [CrossRef]
- Berardinelli, A.; Donati, V.; Giunchi, A.; Guarnieri, A.; Ragni, L. Effects of sinusoidal vibrations on quality indices of shell eggs. Biosyst. Eng. 2003, 86, 7. [Google Scholar] [CrossRef]
- Montgomery, R.H.; Stewart, D.A. A comparison of measured and estimated haugh units with factors affecting their differences. Br. Poult. Sci. 2007, 14, 445–450. [Google Scholar] [CrossRef]
- Lin, H.; Zhao, J.; Chen, Q.; Zhou, F.; Sun, L. Discrimination of Radix Pseudostellariae according to geographical origins using NIR spectroscopy and support vector data description. Spectrochim. Acta A Mol. Biomol. Spectrosc. 2011, 79, 1381–1385. [Google Scholar] [CrossRef]
- Chen, Q.; Zhao, J.; Lin, H. Study on discrimination of Roast green tea (Camellia sinensis L.) according to geographical origin by FT-NIR spectroscopy and supervised pattern recognition. Spectrochim. Acta A Mol. Biomol. Spectrosc. 2009, 72, 845–850. [Google Scholar] [CrossRef] [PubMed]
- Kestens, V.; Charoud-Got, J.; Bau’, A.; Bernreuther, A.; Emteborg, H. Online measurement of water content in candidate reference materials by acousto-optical tuneable filter near-infrared spectrometry (AOTF-NIR) using pork meat calibrants controlled by Karl Fischer titration. Food Chem. 2008, 106, 1359–1365. [Google Scholar] [CrossRef]
- Xiaobo, Z.; Jiewen, Z.; Povey, M.J.; Holmes, M.; Hanpin, M. Variables selection methods in near-infrared spectroscopy. Anal. Chim. Acta 2010, 667, 14–32. [Google Scholar] [CrossRef] [PubMed]
- Balabin, R.M.; Safieva, R.Z.; Lomakina, E.I. Comparison of linear and nonlinear calibration models based on near infrared (NIR) spectroscopy data for gasoline properties prediction. Chemom. Intell. Lab. Syst. 2007, 88, 183–188. [Google Scholar] [CrossRef]
- Rezaei, B.; Khayamian, T.; Mokhtari, A. Simultaneous determination of codeine and noscapine by flow-injection chemiluminescence method using N-PLS regression. J. Pharm. Biomed. Anal. 2009, 49, 234–239. [Google Scholar] [CrossRef] [PubMed]
- Leardi, R.; Nørgaard, L. Sequential application of backward interval partial least squares and genetic algorithms for the selection of relevant spectral regions. J. Chemom. 2004, 18, 486–497. [Google Scholar] [CrossRef]
- Leardi, R. Application of genetic algorithm-PLS for feature selection in spectral data sets. J. Chemom. 2000, 14, 643–655. [Google Scholar] [CrossRef]
- Wenxiang, L.; Hui, X.; Chunhong, X.; Jianke, L.; Yonggang, T.; Yan, Z. Effects of temperature on quality of preserved eggs during storage. Poult. Sci. 2020, 99, 3144–3157. [Google Scholar]


| Storage Time (d) | Haugh Unit | Yolk Index | Weight Loss (%) | |||
|---|---|---|---|---|---|---|
| 25 °C | 4 °C | 25 °C | 4 °C | 25 °C | 4 °C | |
| 1 | 84.94 ± 4.05 a | 85.89 ± 4.73 c | 0.36 ± 0.041 a | 0.42 ± 0.027 b | 0.117 ± 0.0246 g | 0.173 ± 0.043 g |
| 3 | 81.75 ± 4.59 ab | 89.78 ± 2.65 b | 0.32 ± 0.11 ab | 0.443 ± 0.027 a | 0.637 ± 0.055 f | 0.325 ± 0.066 f |
| 5 | 80.01 ± 1.85 ab | 92.75 ± 4.17 a | 0.32 ± 0.042 ab | 0.433 ± 0.025 ab | 0.954 ± 0.132 e | 0.469 ± 0.054 e |
| 7 | 79.35 ± 4.09 b | 92.63 ± 2.76 a | 0.28 ± 0.038 bc | 0.443 ± 0.02 a | 1.526 ± 0.281 d | 0.66 ± 0.18 d |
| 9 | 70.95 ± 5.11 c | 94.57 ± 3.25 a | 0.26 ± 0.11 c | 0.437 ± 0.034 ab | 2.068 ± 0.299 c | 1.04 ± 0.14 c |
| 11 | 65.96 ± 5.62 d | 94.65 ± 2.98 a | 0.24 ± 0.032 cd | 0.449 ± 0.02 a | 2.760 ± 0.446 b | 1.22 ± 0.17 b |
| 13 | 59.19 ± 1.87 e | 92.05 ± 2.56 ab | 0.20 ± 0.031 d | 0.430 ± 0.019 ab | 3.286 ± 0.467 a | 1.52 ± 0.20 a |
| R2 | 0.92 | 0.57 | 0.97 | 0.13 | 0.99 | 0.97 |
| Haugh Unit | Yolk Index | |||
|---|---|---|---|---|
| 25 °C | 4 °C | 25 °C | 4 °C | |
| Haugh Unit | -- | -- | -- | -- |
| Yolk index | 0.3 | 0.498 | -- | -- |
| Weight loss (%) | 0.975 | 0.464 | 0.307 | 0.0943 |
| Indexes | Sample Sets | Group A (25 °C) | Group B (4 °C) | ||
|---|---|---|---|---|---|
| Range | Mean ± SD | Range | Mean ± SD | ||
| Haugh Unit | Calibration | 56.33–90.55 | 74.69 ± 8.44 | 80.24–101.03 | 90.48 ± 4.37 |
| Prediction | 59.19–91.25 | 75.23 ± 8.36 | 76.26–100.45 | 92.32 ± 4.32 | |
| Yolk Index | Calibration | 0.13–0.43 | 0.28 ± 0.08 | 0.38–0.48 | 0.43 ± 0.028 |
| Prediction | 0.15–0.42 | 0.28 ± 0.08 | 0.35–0.49 | 0.43 ± 0.023 | |
| Weight Loss Rate | Calibration | 0.00091–0.004 | 0.016 ± 0.011 | 0.001–0.02 | 0.0079 ± 0.049 |
| Prediction | 0.00095–0.039 | 0.016 ± 0.011 | 0.0009–0.015 | 0.0075 ± 0.047 | |
| Storage Time (d) | Group A (25 °C) | Group B (4 °C) | ||
|---|---|---|---|---|
| Train | Test | Train | Test | |
| 1 | 9/10 | 4/5 | 3/10 | 3/5 |
| 3 | 10/10 | 5/5 | 6/10 | 1/5 |
| 5 | 10/10 | 5/5 | 4/10 | 1/5 |
| 7 | 9/10 | 4/5 | 9/10 | 1/5 |
| 9 | 9/10 | 5/5 | 7/10 | 0/5 |
| 11 | 9/10 | 5/5 | 5/10 | 0/5 |
| 13 | 10/10 | 5/5 | 4/10 | 3/5 |
| Total (%) | 94.2 | 94.2 | 54.3 | 25.7 |
| Components | Group A (25 °C) | Group B (4 °C) | ||||||
|---|---|---|---|---|---|---|---|---|
| Effective Spectral Region/nm | PCs | RMSEP | R(t) | Effective Spectral Region/nm | PCs | RMSEP | R(t) | |
| Haugh Unit | 666–689, 905–965 | 10 | 4.25 | 0.816 | 622–644, 844–866, 910–954 | 3 | 5.23 | 0.436 |
| Yolk Index | 650–682, 746–777 899–957 | 8 | 0.031 | 0.908 | 704–729, 754–778, 828–853, 877–904 | 8 | 0.0358 | 0.174 |
| Weight Loss Rate | 678–777 | 7 | 0.00543 | 0.877 | 666–716, 755–777, 844–868 | 7 | 0.0127 | 0.459 |
Publisher’s Note: MDPI stays neutral with regard to jurisdictional claims in published maps and institutional affiliations. |
© 2021 by the authors. Licensee MDPI, Basel, Switzerland. This article is an open access article distributed under the terms and conditions of the Creative Commons Attribution (CC BY) license (https://creativecommons.org/licenses/by/4.0/).
Share and Cite
Wang, F.; Lin, H.; Xu, P.; Bi, X.; Sun, L. Egg Freshness Evaluation Using Transmission and Reflection of NIR Spectroscopy Coupled Multivariate Analysis. Foods 2021, 10, 2176. https://doi.org/10.3390/foods10092176
Wang F, Lin H, Xu P, Bi X, Sun L. Egg Freshness Evaluation Using Transmission and Reflection of NIR Spectroscopy Coupled Multivariate Analysis. Foods. 2021; 10(9):2176. https://doi.org/10.3390/foods10092176
Chicago/Turabian StyleWang, Fuyun, Hao Lin, Peiting Xu, Xiakun Bi, and Li Sun. 2021. "Egg Freshness Evaluation Using Transmission and Reflection of NIR Spectroscopy Coupled Multivariate Analysis" Foods 10, no. 9: 2176. https://doi.org/10.3390/foods10092176
APA StyleWang, F., Lin, H., Xu, P., Bi, X., & Sun, L. (2021). Egg Freshness Evaluation Using Transmission and Reflection of NIR Spectroscopy Coupled Multivariate Analysis. Foods, 10(9), 2176. https://doi.org/10.3390/foods10092176