Article

HPLC Fingerprints for the Characterization of Walnuts and the Detection of Fraudulent Incidents

by
Natasa P. Kalogiouri
and
Victoria F. Samanidou
*
Laboratory of Analytical Chemistry, Department of Chemistry, Aristotle University of Thessaloniki, 54124 Thessaloniki, Greece
*
Author to whom correspondence should be addressed.
Foods 2021, 10(9), 2145; https://doi.org/10.3390/foods10092145
Submission received: 20 August 2021 / Revised: 7 September 2021 / Accepted: 8 September 2021 / Published: 10 September 2021

Abstract

:
A high-pressure liquid chromatographic method coupled to diode array detector (HPLC-DAD) was developed for the determination of phenolic compounds that could be used as markers in authentication studies of walnuts belonging to the Chandler variety, originating from Bulgaria, Greece, and France. An ultrasound-assisted extraction (UAE) protocol applied in the extraction of phenolic compounds was optimized. The method was validated and the relative standard deviations (RSD%) of the within-day, and between-day assays was lower than 6.3 and 11.1, respectively, showing adequate precision, and good accuracy ranging from 86.4 (sinapic acid) to 98.4% (caffeic acid) for within-day assay, and from 90.1 (gallocatechin gallate) to 100.6% (gallic acid) for between-day assay. Eighteen phenolic compounds were determined belonging to the classes of phenolic acids and flavonoids. The quantification results were further processed with chemometrics, and a robust partial least square–discriminant analysis (PLS-DA) model was developed for the classification of the samples according to their geographical origin, proposing markers that could be used for the control of walnuts authenticity and the detection of fraudulent incidents.

1. Introduction

Food authenticity is a critical issue and attracts great interest due to consumer concern about food quality and safety. Authentic food is defined as the product that is precisely described by the label [1]. According to the Insurance Agency of Food Authenticity (IFAA), “authentication” is a process which unequivocally proves that the food is genuine [2]. In a global food market, consumers are interested in the origin and quality of the products they choose. Food authenticity concerns not only consumers, but the authorities, as well. Authentic foods have high economic significance both to the food industry and the national economy, especially in the case of high value export agricultural products, such as nuts.
Among nuts species, walnuts (Juglans regia L.) are a valuable nutritional source and play a dominant role in the Mediterranean diet. Walnut has been characterized as functional foods owing to its nutritional value and beneficial health effects [3,4]. The walnut kernel is a rich source of minerals, tocopherols, fatty acids, and phenolic compounds [5,6,7,8]. The cultivar and the geographical origin have been shown to affect the bioactive content of walnuts [3,9,10]. Walnut was cultivated in Europe as early as 1000 BC [4]. It has naturally diverged to several cultivars worldwide. Among the most commercial cultivars are: Chander, Hartley, Franquette, Mellanaise, Lara, Marbot, Mayette, Serr, Tulare, Sorento, etc. [11,12,13].
Even though walnuts are high-value agricultural products that provide energy, all the necessary nutrients ingredients and have beneficial health effects, they have not been adequately studied in terms of authenticity compared to other food products [14]. This gap has to be filled with the development of analytical methodologies that enable the determination of walnut constituents that could potentially be used as markers for the guarantee of walnuts genuineness. It is worth noting that the formation and development of a modern global food distribution system critically depends on the enforcement and implementation of quality controls. To this end, the European Union (EU) has established reference centers for authenticity and integrity of the agri-food chain to avoid fraudulent indices (EU, 2017/625, L95, 1-95). For agricultural products, such as walnuts, it is important to validate the country and area where the food was produced, as well as verify the cultivation practice.
The majority of the published articles focus mainly on the development of methodologies for the assessment of the mineral [5,15,16], lipid [6,17,18,19] or volatile profile [14,20] of walnuts [21,22]. Less is known about the minor phenolic fraction [8,23]. Phenolic constituents are secondary plant metabolites subjected to environmental modifications [8,24]. The analysis and evaluation of the phenolic profile of agricultural products provides valuable information about the quality characteristics among the plant species, and this is why the phenolic profile is investigated in authenticity studies [25]. Considering the chemical diversity of phenolic constituents (phenolic acids, flavonoids, lignans, stilbenes, and tannines), the generic analytical methodology for the determination of phenolic constituents involves extraction as the first step, and then analytical separation, identification and quantification follow. Liquid chromatography (LC) is the main technique used for the separation of phenolic compounds. Several methodologies using high pressure liquid chromatography (HPLC) coupled to UV or diode array detector (DAD), ultra-high pressure liquid chromatography (UHPLC) coupled to mass spectrometric detectors (MS), as well as high resolution mass spectrometric (HRMS) instruments which provide sufficient separation capacity and resolving power, are widely used in the analysis of phenolic analytes, as it has already been reviewed [8,26,27].
The further analysis of the chromatographic results with chemometric tools enhances the conclusions derived from the experimental data. The development of chemometric models enables the establishment of mathematical correlations in the data matrix, allowing the discovery of trends and behaviors among the samples. To such an end, the development of pattern recognition models allows the presentation of significant and non-evident information that is critical in authenticity issues [28]. Several authenticity studies have used unsupervised chemometric tools such as Principal Component Analysis (PCA) for exploratory data analysis, displaying the similarity of the observations as points in a map (score plot) [21,29,30]. Even though PCA finds correlations among the features successfully, it is affected by scale, and it may cause loss of information as compared to the original list of features. Supervised recognition techniques such as partial least squares–discriminant analysis (PLS-DA) overcomes the weaknesses of unsupervised methods and is considered unique in exploratory data analysis, providing good insight into the causes of discrimination via loadings and weights [31,32].
The objective of this work was to develop a rapid, accurate and selective HPLC-DAD analytical method for the determination of phenolic compounds in walnut samples belonging to the Chandler variety originating from Greece, Bulgaria and France and are available in the Greek market. A PLS-DA prediction model was developed to discriminate the samples and reveal characteristic markers responsible for their classification according to the geographical origin.

2. Materials and Methods

2.1. Chemicals and Reagents

Acetonitrile (ACN), HPLC grade, and methanol (MeOH) HPLC grade were purchased from Panreac–AppliChem (Darmstadt, Germany). Acetic acid 99% and trifluoroacetic acid (TFA) 99% were acquired by Sigma-Aldrich (Steinheim, Germany). Ultrapure water was provided by a Milli-Q ® purification system (Millipore, Bedford, MA, USA). The following standard compounds: caffeic acid 98%, catechin 98%, diosmin 97%, epigallocatechin gallate 95%, ferulic acid 98%, gallic acid 98%, gallocatechin gallate 98%, kaempferol 97%, myricetin 98%, myricitrin 99%, p-coumaric 98% quercetin-3-o-glucoside 97%, rosmarinic acid 98%, rutin 98%, sinapic acid 95%, syringic acid 95%, vanillic acid 97%, and vanillin 99% were purchased by Sigma-Aldrich (Steinheim, Germany). Stock standard solutions were prepared for each analyte (1000 mg/L) in MeOH and stored at −20 °C in dark brown glass bottles.

2.2. Instrumentation

A quaternary low-pressure gradient HPLC–DAD system by Shimadzu (Kyoto, Japan) was used for chromatographic analysis. The HPLC system was equipped with: (a) an FCV-10ALVP mixing system, (b) a Rheodyne 7725i injection valve (Rheodyne, Cotati California, USA) geared with a 20 μL loop for sample injection, (c) an LC- 10ADVP pump equipped with a Shimadzu SCL-10ALVP System Controller, (d) an SPD-M10AVP photodiode array detector supplied with the soft- ware Lab Solutions-LC solutions by Shimadzu. For degassing the mobile phase, a DGU-10B de-gassing unit was used with helium. For the filtration of the mobile phases a glass vacuum filtration apparatus, acquired by Alltech Associates (Deereld, IL, USA), and nylon 0.2 μm membrane Filters (Alltech Associates, Chicago, IL, USA) were utilized. A vortexer purchased from FALC Instruments (Treviglio (BG), Italy) was used for sample agitation. For sample evaporation, a ReactiVap 9-port evaporator model 18,780 by Pierce (Rockford, IL, USA) was used. Centrifugation was carried out in a HermLe centrifuge, model Z-230 (B. HermLe, Gosheim, Germany). For sample filtration, Q-Max RR syringe filters (0.45 μm nylon membrane) were purchased from Frisenette ApS (Knebel, Denmark).

2.3. Chromatographic Analysis

Chromatographic separation was achieved on a C18 Fortis UniverSil column (250 mm × 4.6, 5 μm), supplied by Fortis Technologies Ltd. (Neston, UK), and operated at 30 °C. The binary mobile phase consisted of 1% acetic acid in water (A) and ACN (B) starting at a ratio of 95:5 (v/v), and then gradually increasing to 20% (Β) within 15 min, and then increasing to 50:50 (v/v) within the following 25 min, reaching a ratio of 10:90 (v/v) in the 45th min, and remaining stable for the following five min (t = 45–50 min). Then, the initial conditions (95% A, 5% B) were restored in the 55th min, and kept constant for five min to re-equilibrate the column for the next injection. Peak identification was carried out using the retention time (Rt) of the standard compounds, along with the spectral information provided by the DAD detector that operated over the range 250–400 nm. Peak monitoring and quantitation were performed at the maximum wavelength of each analyte. Peak identification was performed by using the data Rts and spectra from the DAD detector.

2.4. Walnut Samples

Twenty-six walnut samples of conventional farming commercially available to the Greek market, belonging to the Chandler cultivar were obtained. Ten Greek walnut samples were acquired from Thrace, Macedonia and Thessaly in Greece during November 2020. Ιmported walnuts from Bulgaria and France were supplied by traders who import walnuts from these countries and distribute them in the Greek market during the same time period (November 2020). Nine samples originating from Bulgaria, and seven samples originating from France were acquired. All samples were dried in a drying unit at 35 °C for 24 h and were then homogenized in a porcelain mortar prior to storage at −20°C, until analysis.

2.5. Extraction Optimization

A generic sample preparation protocol previously introduced by Pinasseau et al. [33] for the extraction of phenolic compounds was modified. Specifically, several extraction factors such as the extraction solvent, the ultrasound-assisted extraction (UAE) time and the extraction temperature were optimized following the well-established one-factor- at-a-time method (OFAT) [34]. In this respect, the recoveries (R%) of the previously reviewed as the most abundant phenolic compounds determined in walnuts [8]; namely gallic acid, vanillic acid, and syringic acid from the class of phenolic acids, as well as catechin, rutin, and quercetin-3-o-glucoside from the class of flavonoids, were calculated to evaluate the effect of extraction solvent (0.05% TFA in acetone, 0.05% TFA in methanol, 0.05% TFA in methanol: water at 60:40 ratio, v/v), the effect of extraction time (5–20 min), and the extraction temperature (4–40 °C). Briefly, 100 mg of homogenized walnuts was weighted in 2-mL eppendorf tubes and 0.5 mL of extraction solvent was added. The mixture was vortexed for 1 min, and then it was transferred in an ultrasonic bath to optimize extraction temperature and the extraction time. The samples were centrifuged for 10 min at 10,000 rpm. The supernatant was collected and dried under nitrogen flow and the extract was reconstituted in 0.2 mL of 1% acetic acid in water: acetonitrile (50:50, v/v).

2.6. Sample Preparation

In brief, 100 mg of homogenized walnuts was weighted in 2-mL eppendorf tubes and 0.5 mL of 0.05% TFA in methanol: water at 60:40 ratio (v/v), was added. The mixture was vortexed for 1 min, and then it was transferred in an ultrasonic bath at 25 °C for 10 min. Then, the samples were centrifuged for 10 min at 10,000 rpm. The supernatant was collected and dried under nitrogen flow and the extract was reconstituted in 0.1 mL of 1% acetic acid in water: acetonitrile (50:50, v/v). The diluent was filtered through 0.45 μm nylon syringe filters prior to injection in the chromatographic system.

2.7. Method Validation

Μethod validation was performed to estimate linearity selectivity, the limits of detection (LODs) and the limits of quantification (LOQs), within-day, and between-day accuracy and precision. Linearity studies were performed in triplicate using standard solutions and covered the working range of 2–20 μg/g. Seven-point calibration curves were constructed by plotting the peak areas versus concentration. For the calculation of the LODs and the LOQs the S/N ratio was monitored until a S/N ratio of 3:1 (LOD) and 10:1 (LOQ) was reached. For the evaluation of accuracy and precision a pool sample was prepared and spiked at low, medium, and maximum concentration levels of 0.5 μg/g, 10 μg/g, and 20 μg/g. Analysis was performed in triplicate. For the estimation of relative recoveries (R%) the found and added concentrations of the examined analytes were calculated (mean concentration found/concentration*100, R%), expressing accuracy. Precision was expressed as relative standard deviation (RSD%). Within-day precision (repeatability) was assessed in six replicates (n = 6), and between-days precision (reproducibility) was examined after performing triplicate analysis of spiked samples within three consecutive days (n = 3 × 3). To evaluate selectivity, five blank matrices were used and no interferences were observed in the same chromatographic window for both methodologies.

2.8. Chemometric Analysis

PLS-DA is a supervised pattern recognition technique used to find the appropriate class for each sample [32,35]. PLS-DA is a linear classification of the PLS regression that was initially used for regression task and evolved into a classification tool. A mathematical model is built and applied in the analysis of unknown samples to establish a correlation and classify them. The advantage compared to unsupervised classification techniques is that the samples belonging to each class are labelled, and in this respect the prediction model achieves the reduction of the dimensions knowing the lass labels.
A PLS-DA prediction model was developed using the MetaboAnalyst 5.0 platform [36], in an attempt to discover patterns in the quantitative data of the determined phenolic compounds and predict the geographical origin of the analyzed samples, establishing the most important compounds used for the classification as characteristic markers.

3. Results

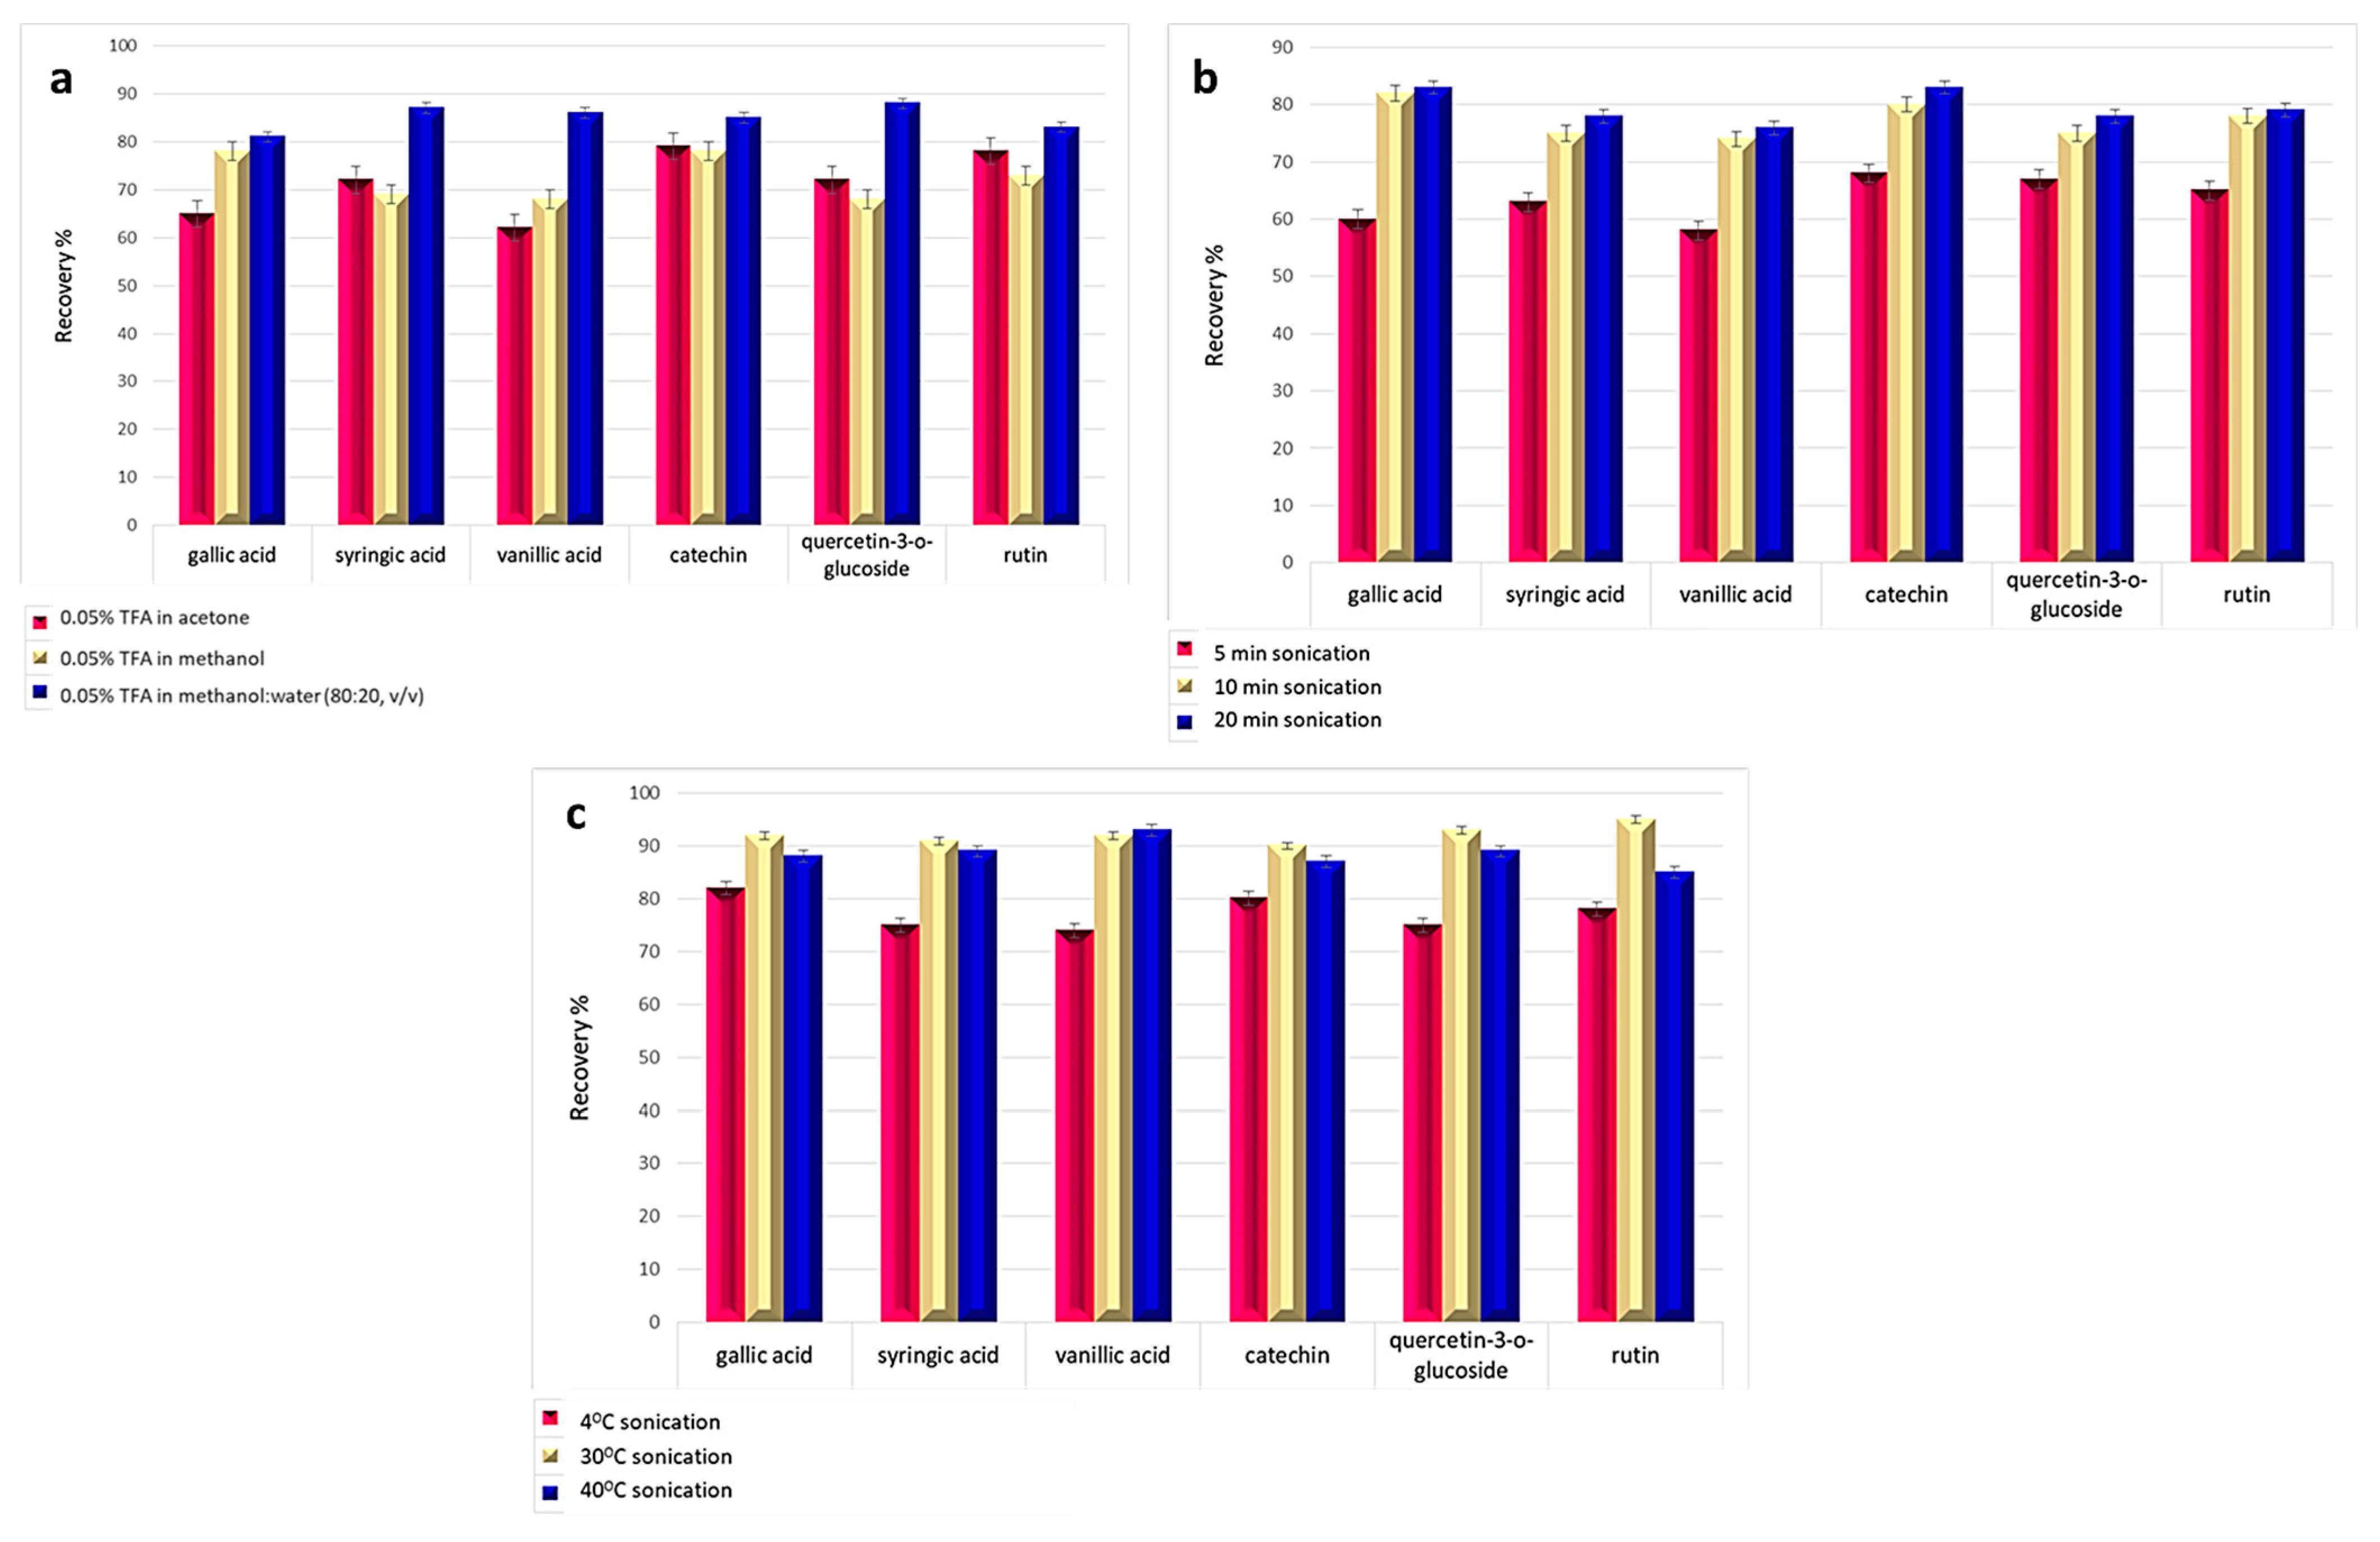
3.1. Extraction Optimization Results

The effects of the extraction solvent, the UAE time, and extraction temperature were studied following the OFAT method [34]. The extraction recoveries (R%) of gallic acid, vanillic acid, and syringic acid from the class of phenolic acids, and catechin, rutin, and quercetin-3-o-glucoside from the class of flavonoids, were calculated to evaluate the effect of each parameter on the extraction efficiency.
The extraction solvent was the first factor to be studied. According to the results presented in Figure 1a, the higher recoveries were obtained for 0.05% TFA in methanol:water at 60:40 ratio, v/v). The findings are in accordance with the literature, since the majority of the studies report the use of acidified mixtures of methanol:water [8]. The second factor that was evaluated was the time of the extraction in an ultrasonic bath. According to the results presented in Figure 1b, the increase in the extraction time increased the recoveries of all the analytes. The difference in the extraction efficiency between 10 min of sonication and 20 min was less than 4% and, in an attempt to minimize extraction time, the extraction time of 10 min was selected as the optimum for the next experiment. The last parameter that was evaluated was the extraction temperature. Three different temperatures were tested (4 °C, 30 °C and 40 °C). The highest recoveries (≥90%) were obtained at 30 °C, and this temperature was selected as the optimum. The extraction at low temperature (4 °C) was not sufficient enough resulting in low recoveries over the range 72–81%. On the other hand, the further increase of temperature at 40 °C resulted in a slight decrease of the obtained recoveries, compared to the results obtained at 30 °C, which could be explained due to the degradation of phenolic constituents at higher temperatures [37].

3.2. Method Validation Results

All the analytical parameters of the developed HPLC-DAD methodology for the determination of phenolic compounds in walnuts (i.e., the calibration curves and linear range, the determined coefficients (r2), the calculated LODs, and LOQs, accuracy and precision are summarized in Table 1. According to the results, r2 ranged from 0.991 to 0.999 establishing the good linearity of the method. The LOQs were found to range between 0.30 μg/g (gallic acid) and 1.44 μg/g (myricetin), while the LODs were calculated equal to 0.10 (gallic acid)–0.48 μg/g (myricetin). The RSD% of the within-day (n = 6) and between-day assays (n = 3 × 3) was lower than 6.3, and 11.1, respectively, showing adequate precision. The accuracy was assessed by means of relative percentage of recovery (%R) at low, medium, and maximun concentration levels (2, 10, 20 μg/g), and the results were acceptable, ranging from 86.4 (sinapic acid, at 20 μg/g concentration level) to 98.4% (caffeic acid, at 20 μg/g concentration level) for within-day assay (n = 6) (Table 2), and from 90.1 (gallocatechin gallate, at 20 μg/g concentration level) to 100.6% (gallic acid) for between-day assay (n = 3 × 3) (Table 3).

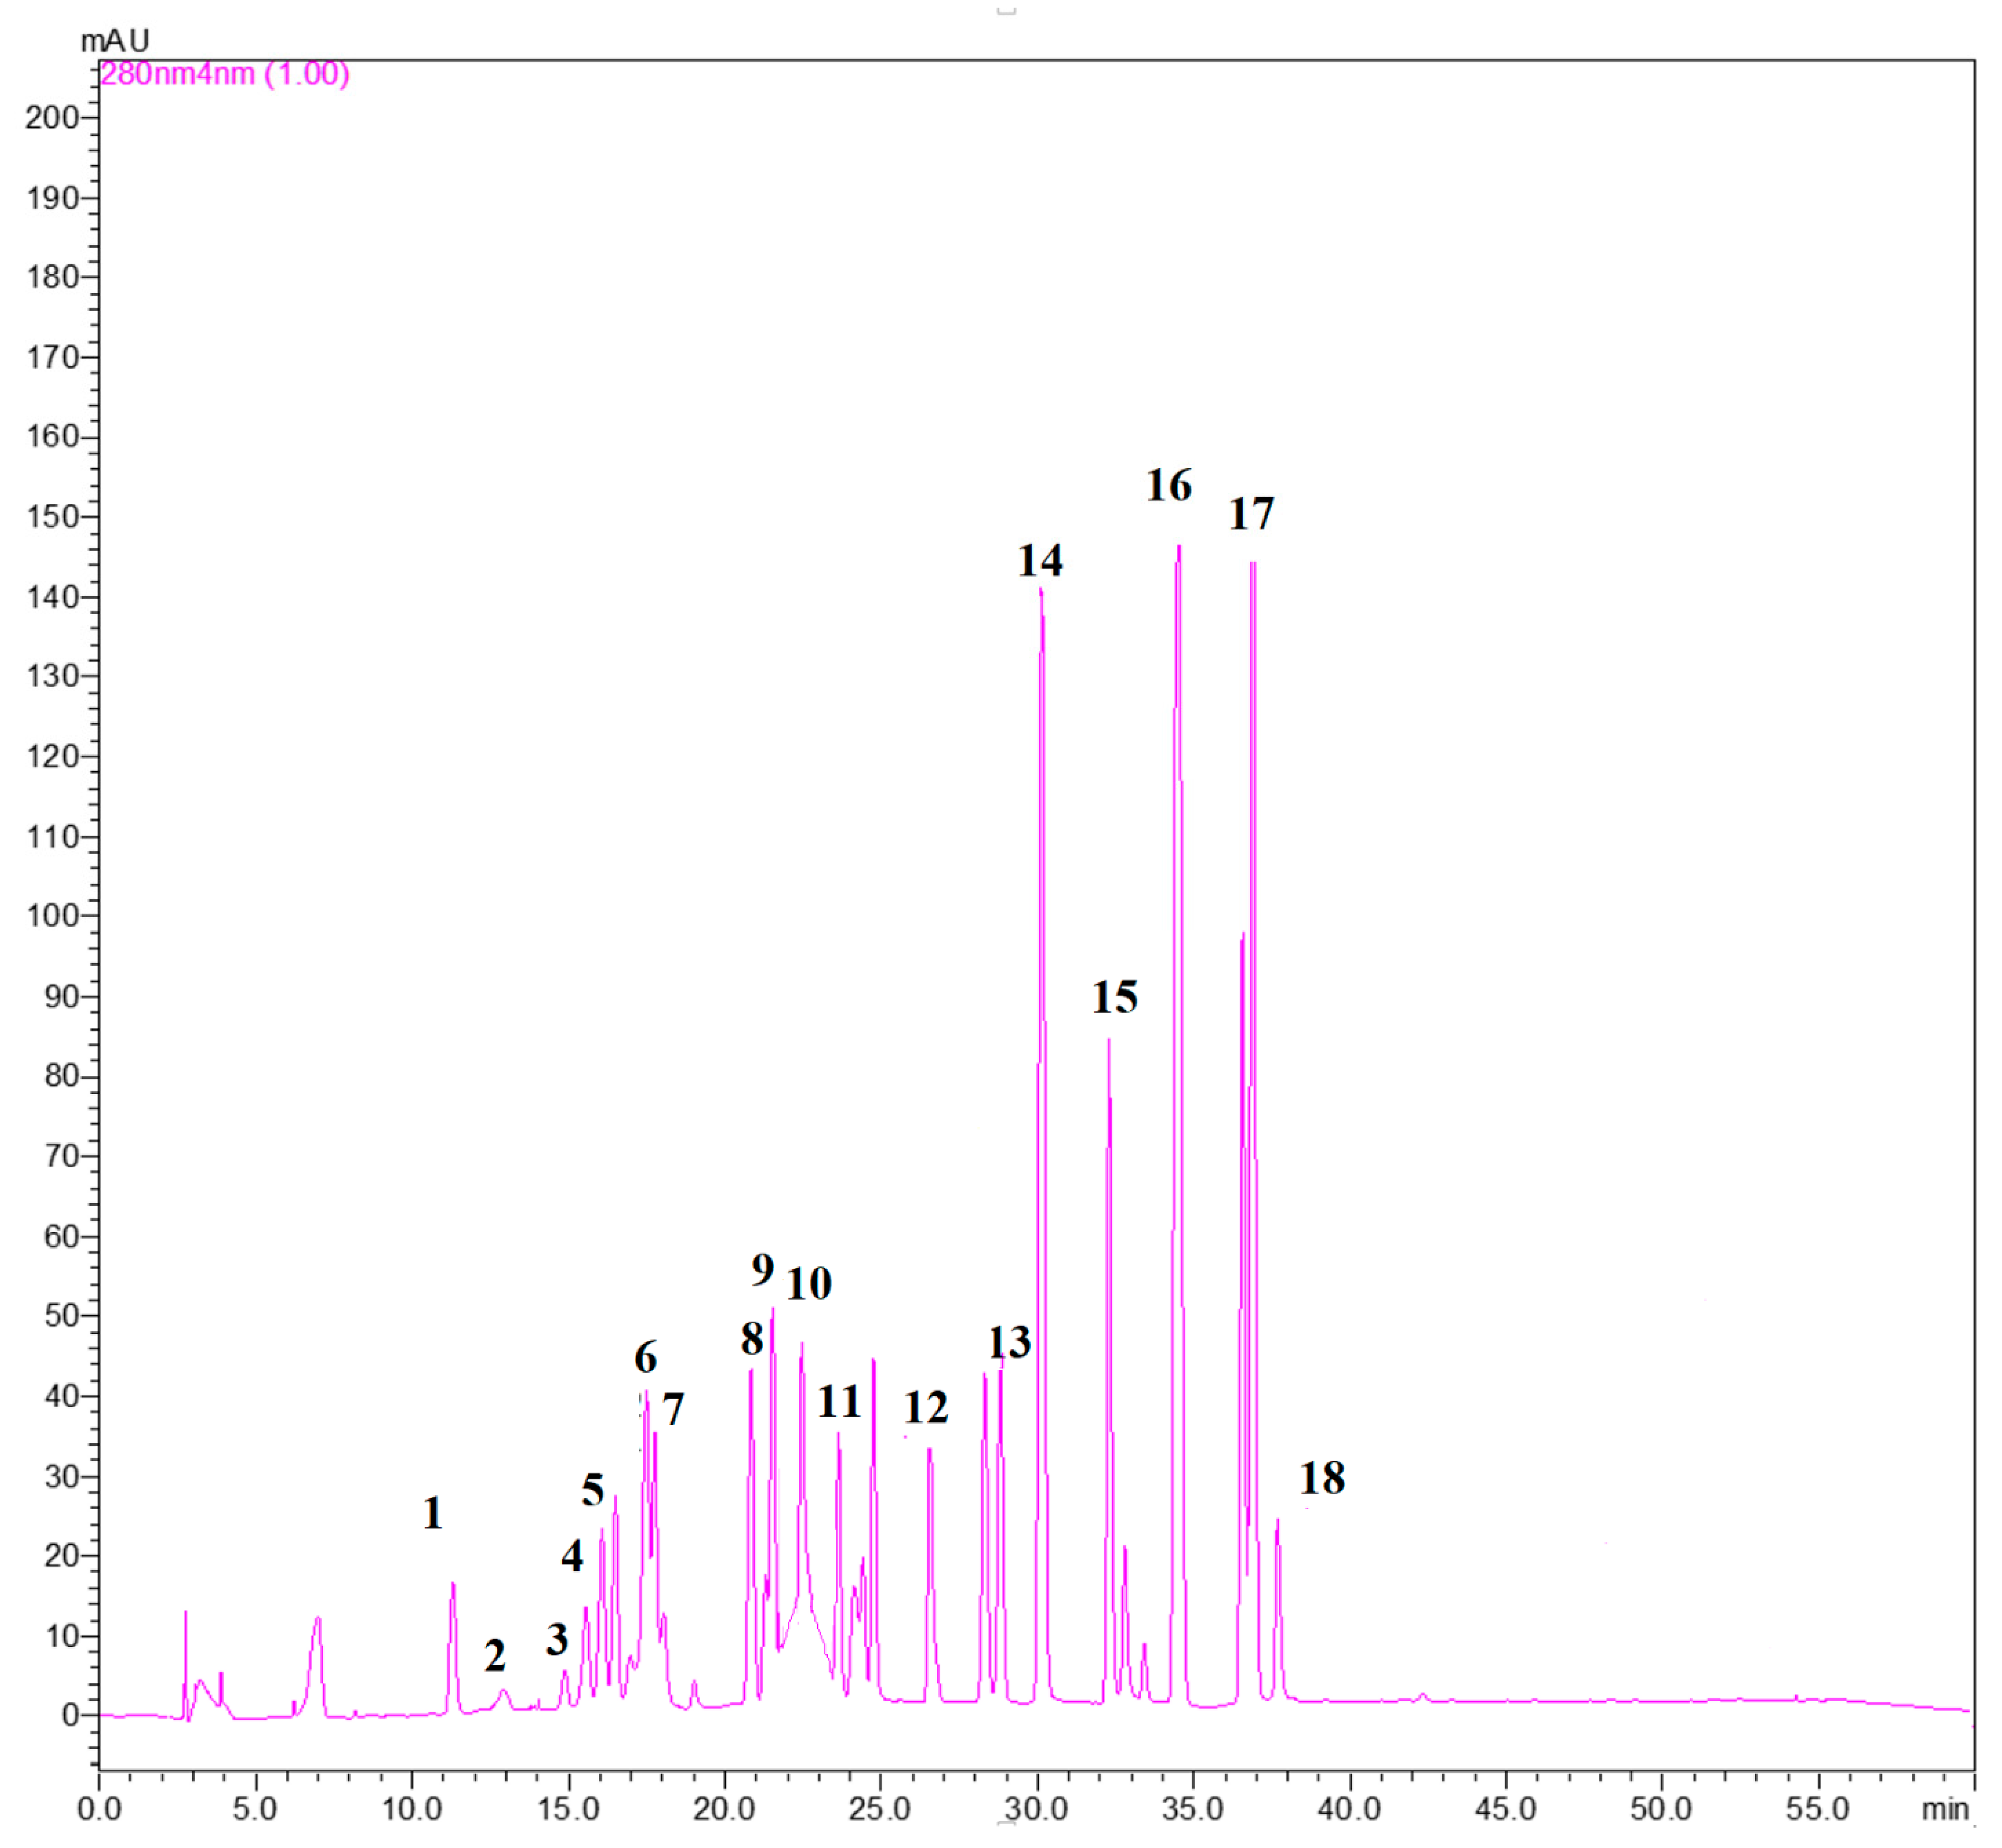
3.3. Walnut Analysis

The optimized and validated HPLC-DAD analytical method was applied in the analysis of real samples. Twenty-six walnut samples belonging to the Chandler variety originating from Bulgaria, Greece, and France were analyzed and eighteen phenolic compounds were determined, in total. Those were: caffeic acid, ferulic acid, gallic acid, p-coumaric acid, rosmarinic acid, sinapic acid, syringic acid, and vanillic acid, from the class of phenolic acids, and catechin, diosmin, epigallocatechin gallate, gallocatechin gallate, kaempferol, myricetin, myricitrin, quercetin-3-o-glucoside, rutin, and vanillin from the class of flavonoids. Table 4 lists the identified phenolic compounds along with their retention times Rts and maximum absorption wavelengths (λ, nm). Figure 2 presents a characteristic chromatogram of a walnut sample spiked with a standard mixture at 2 μg/g and monitored at 280 nm.

Quantification Results
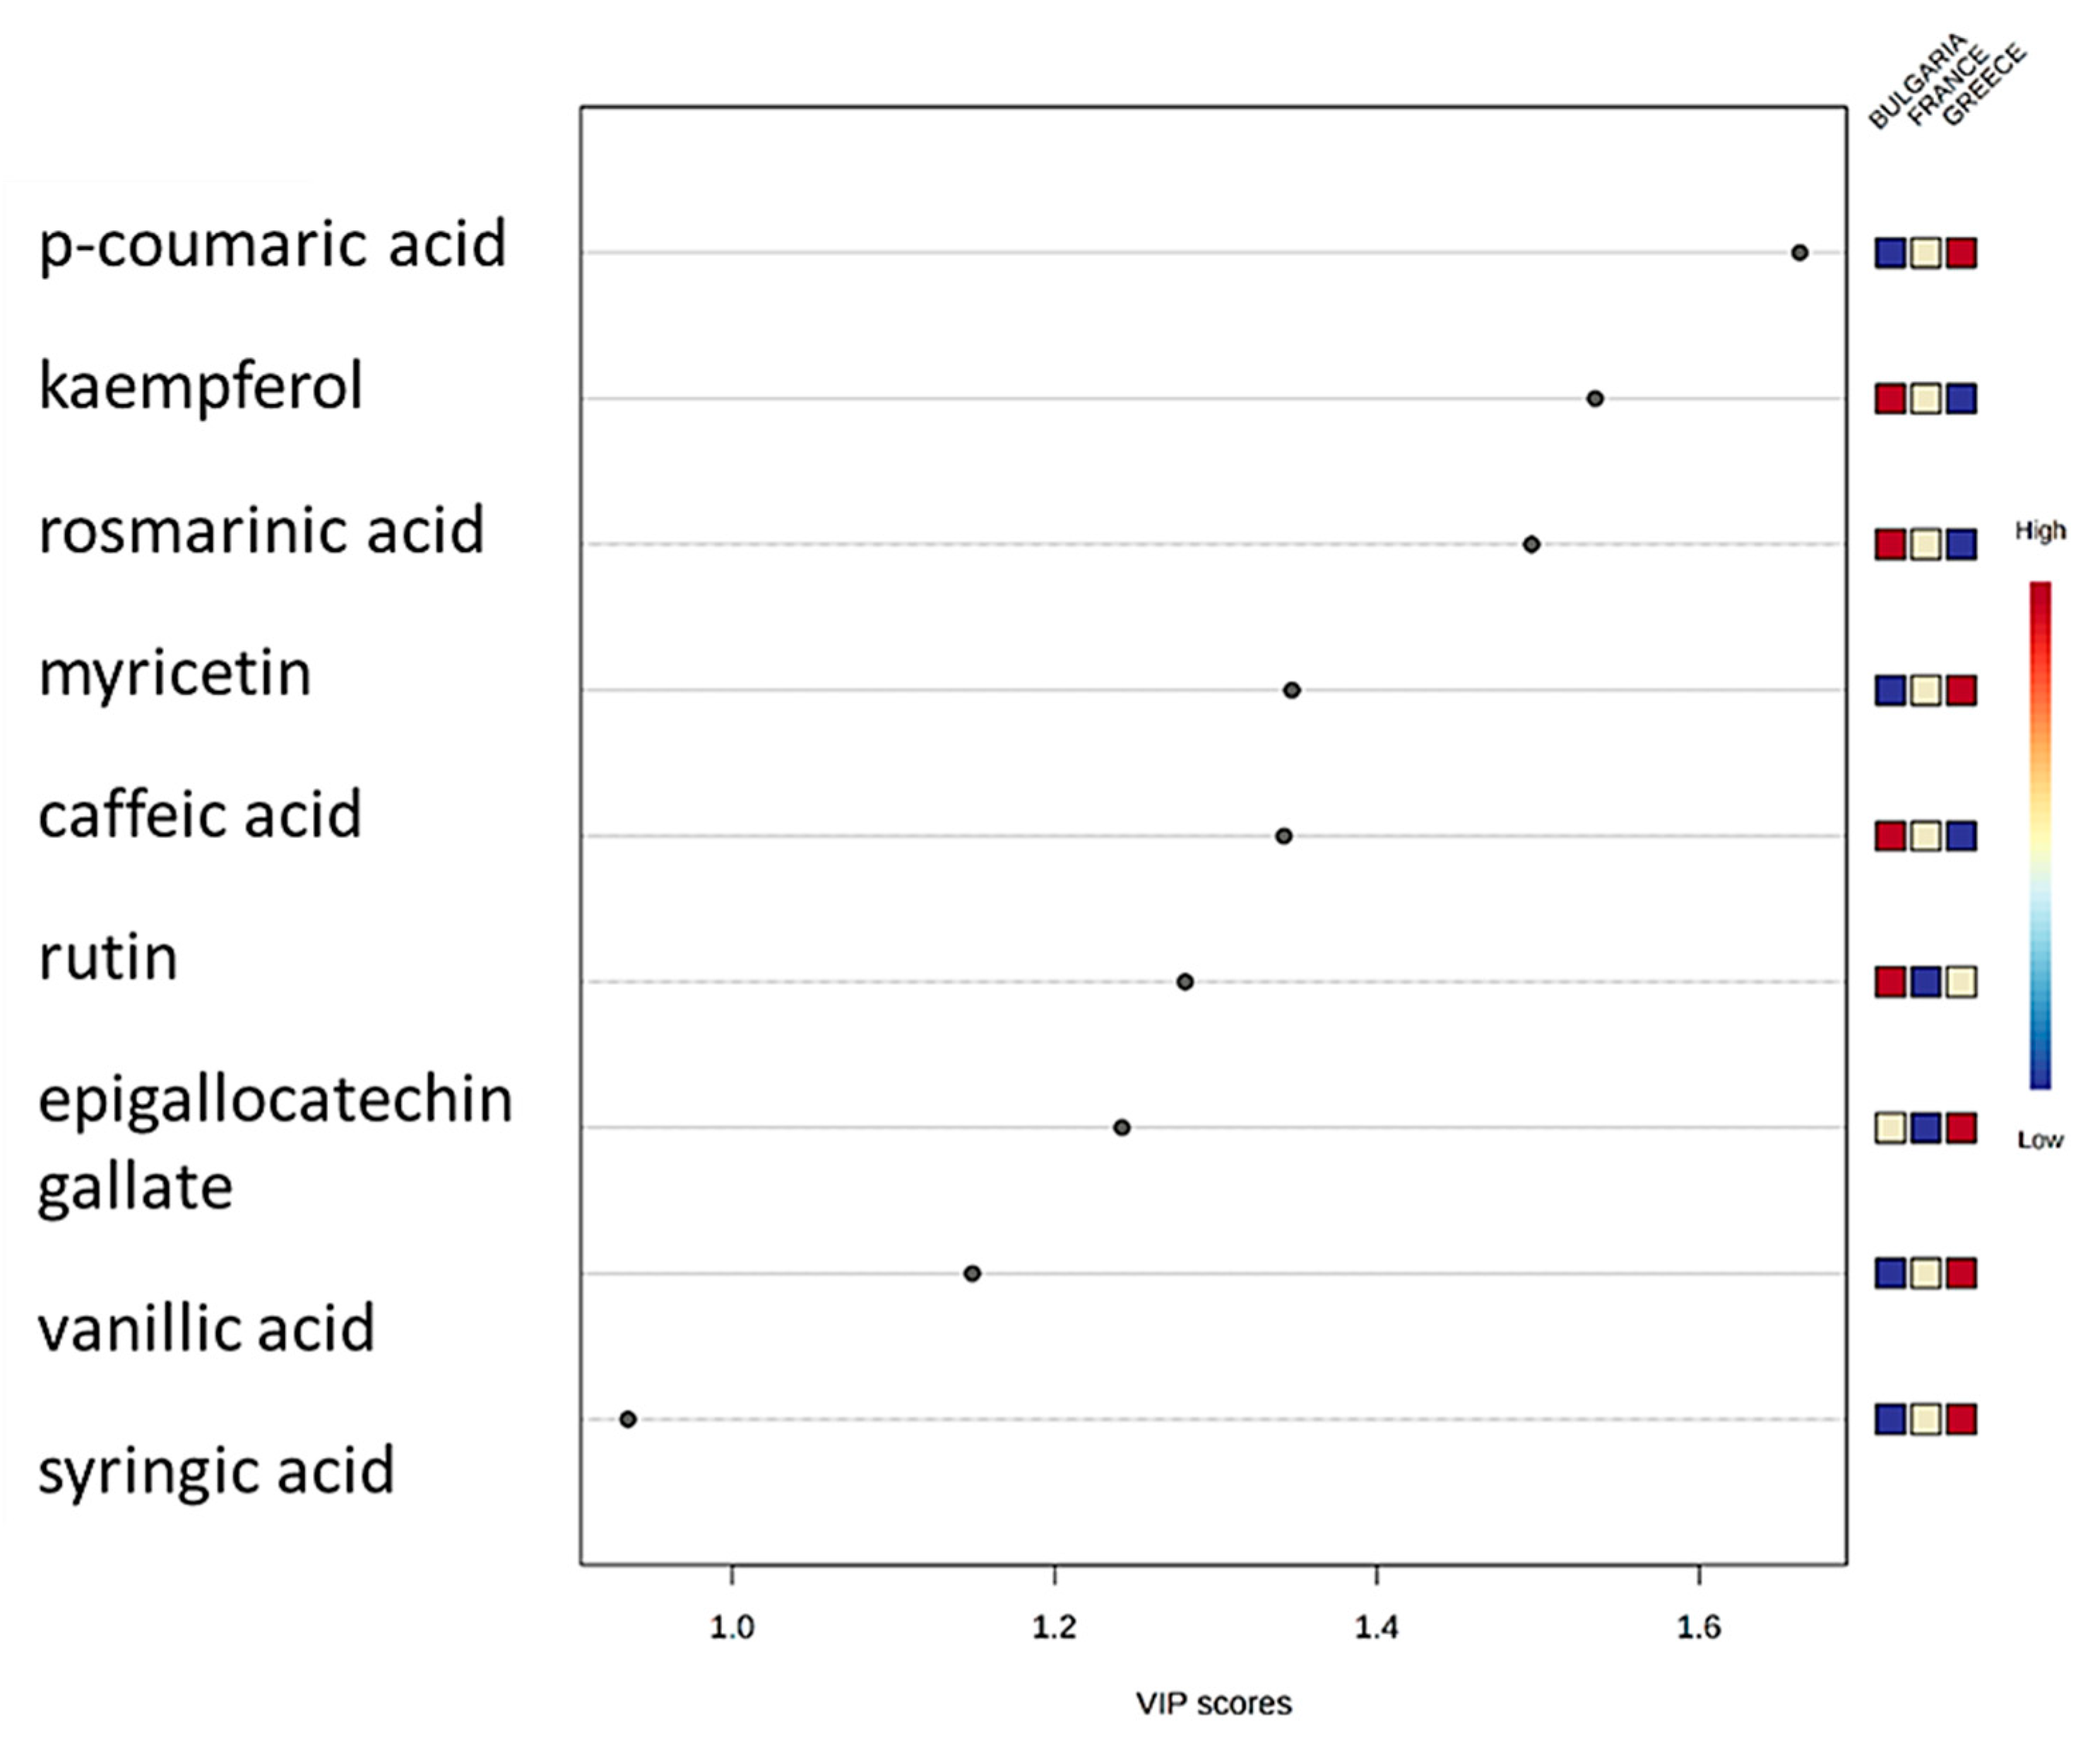
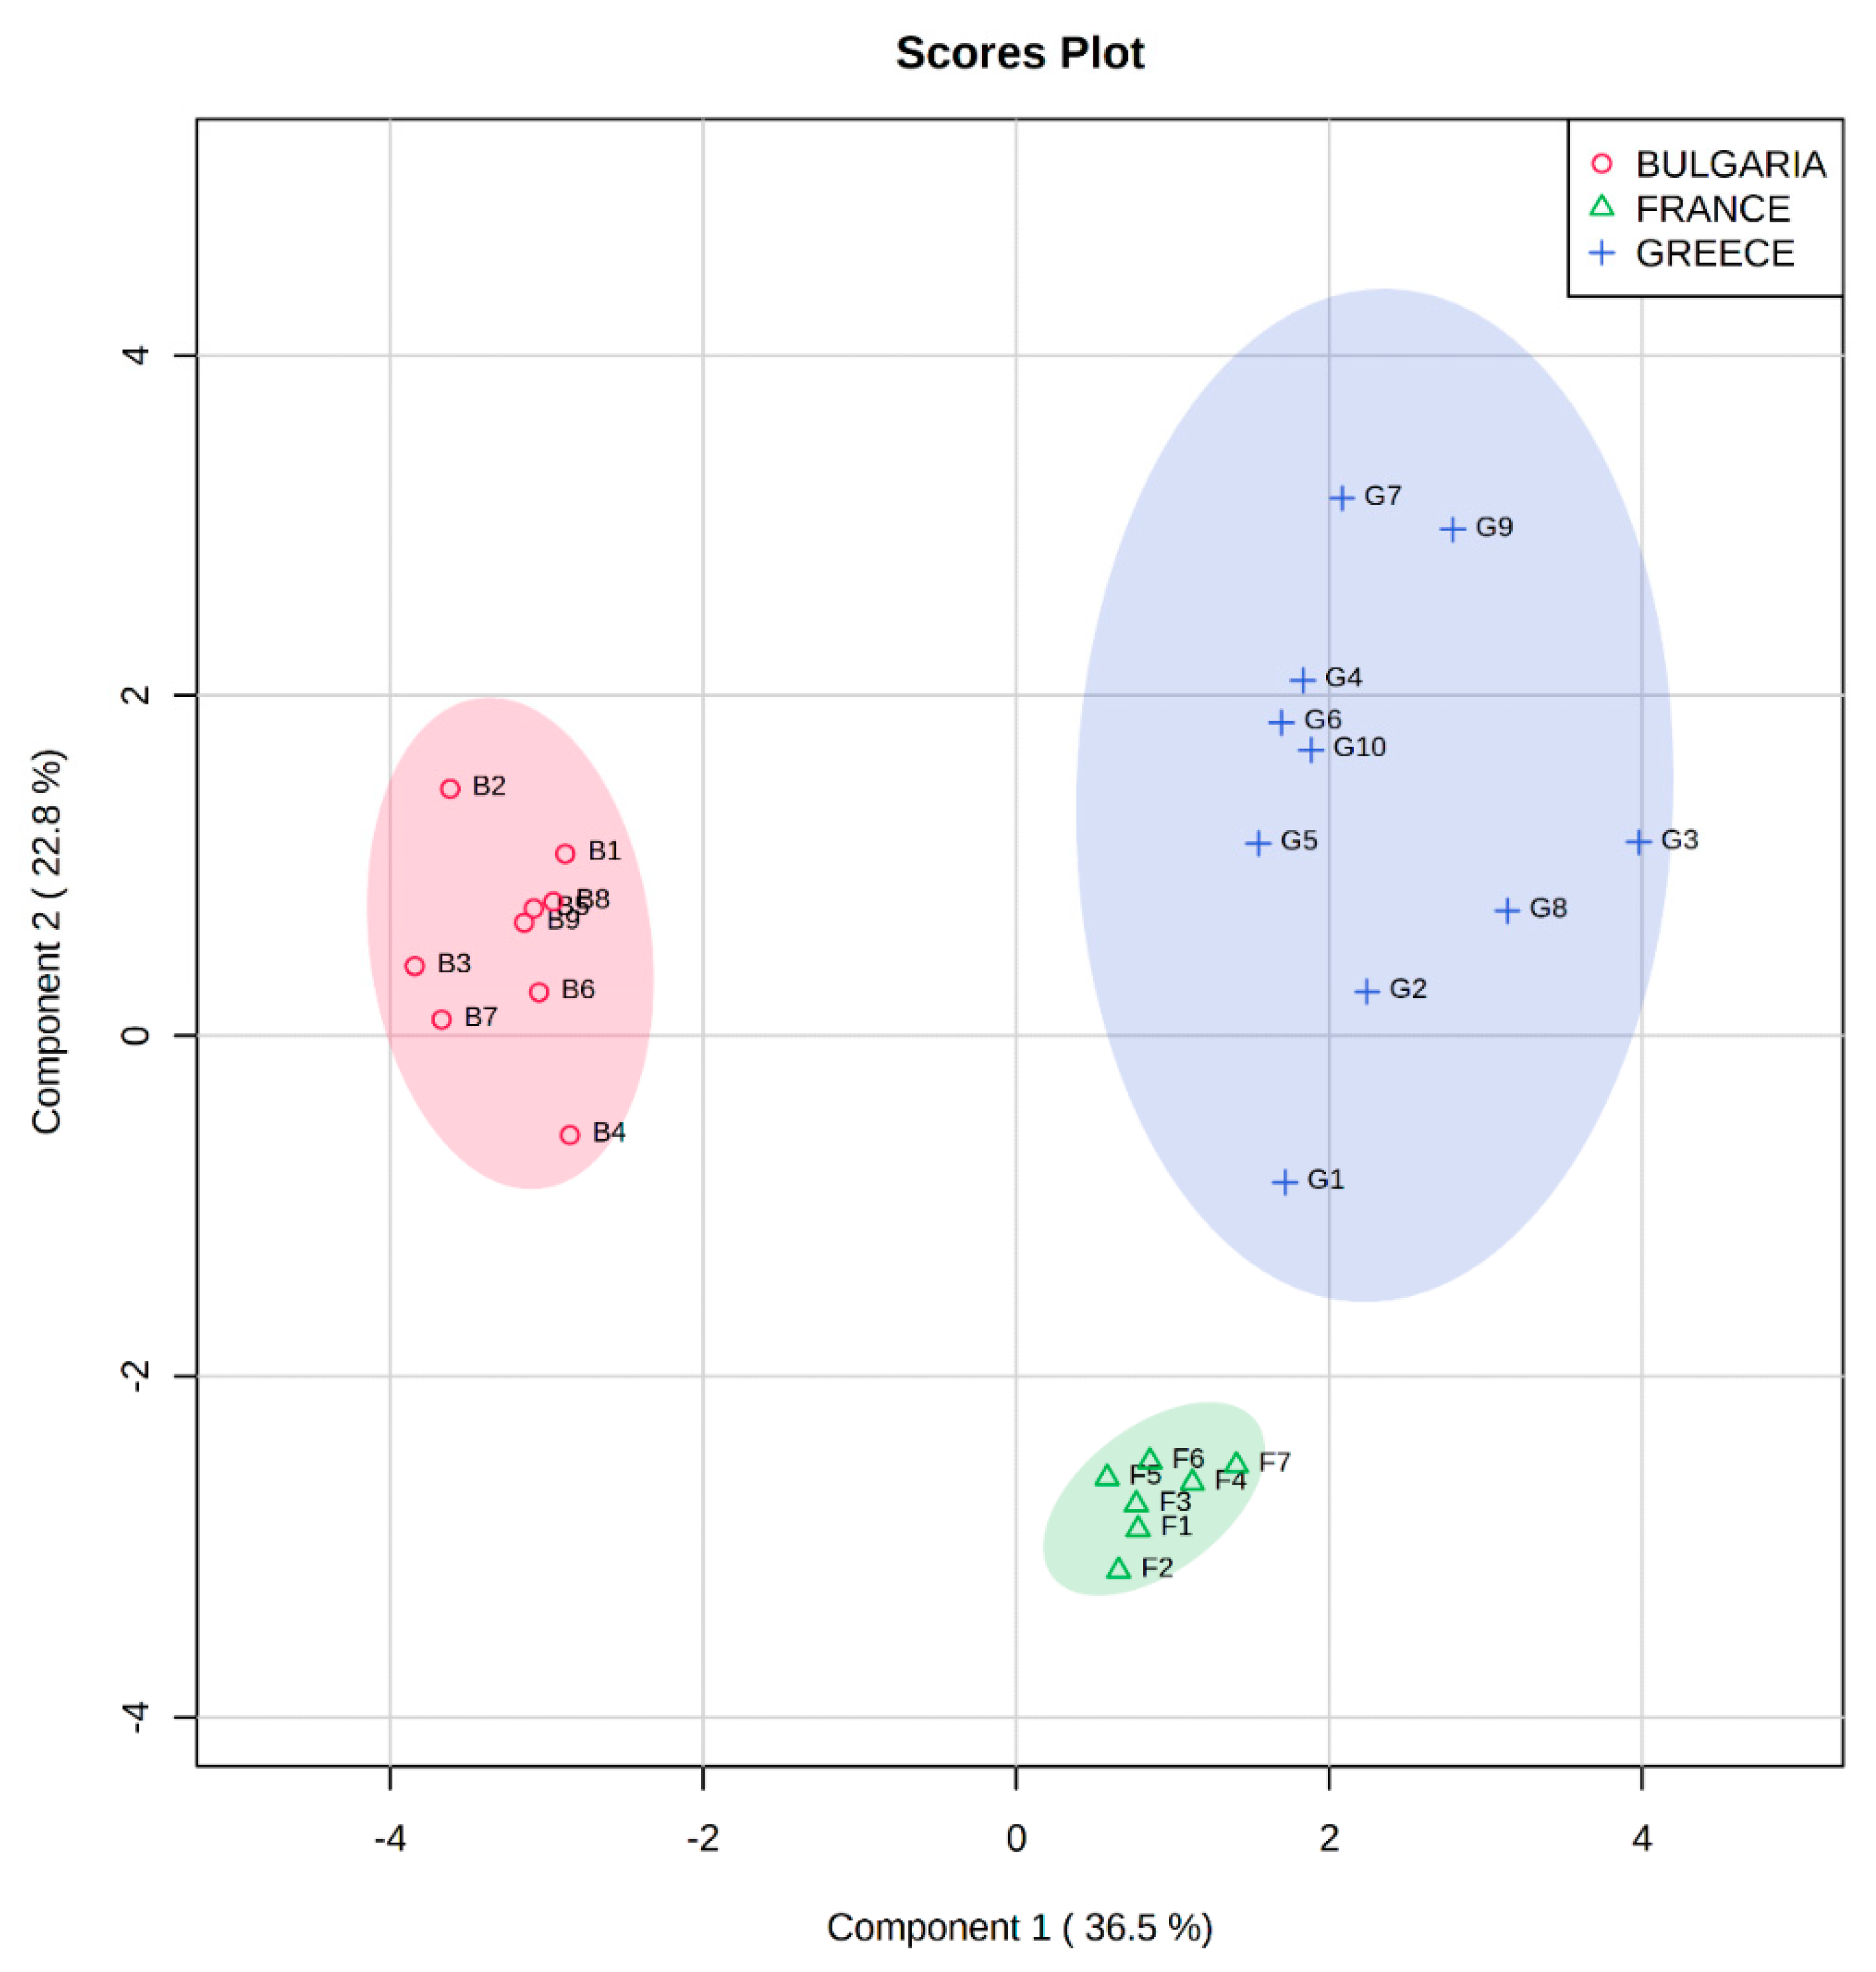
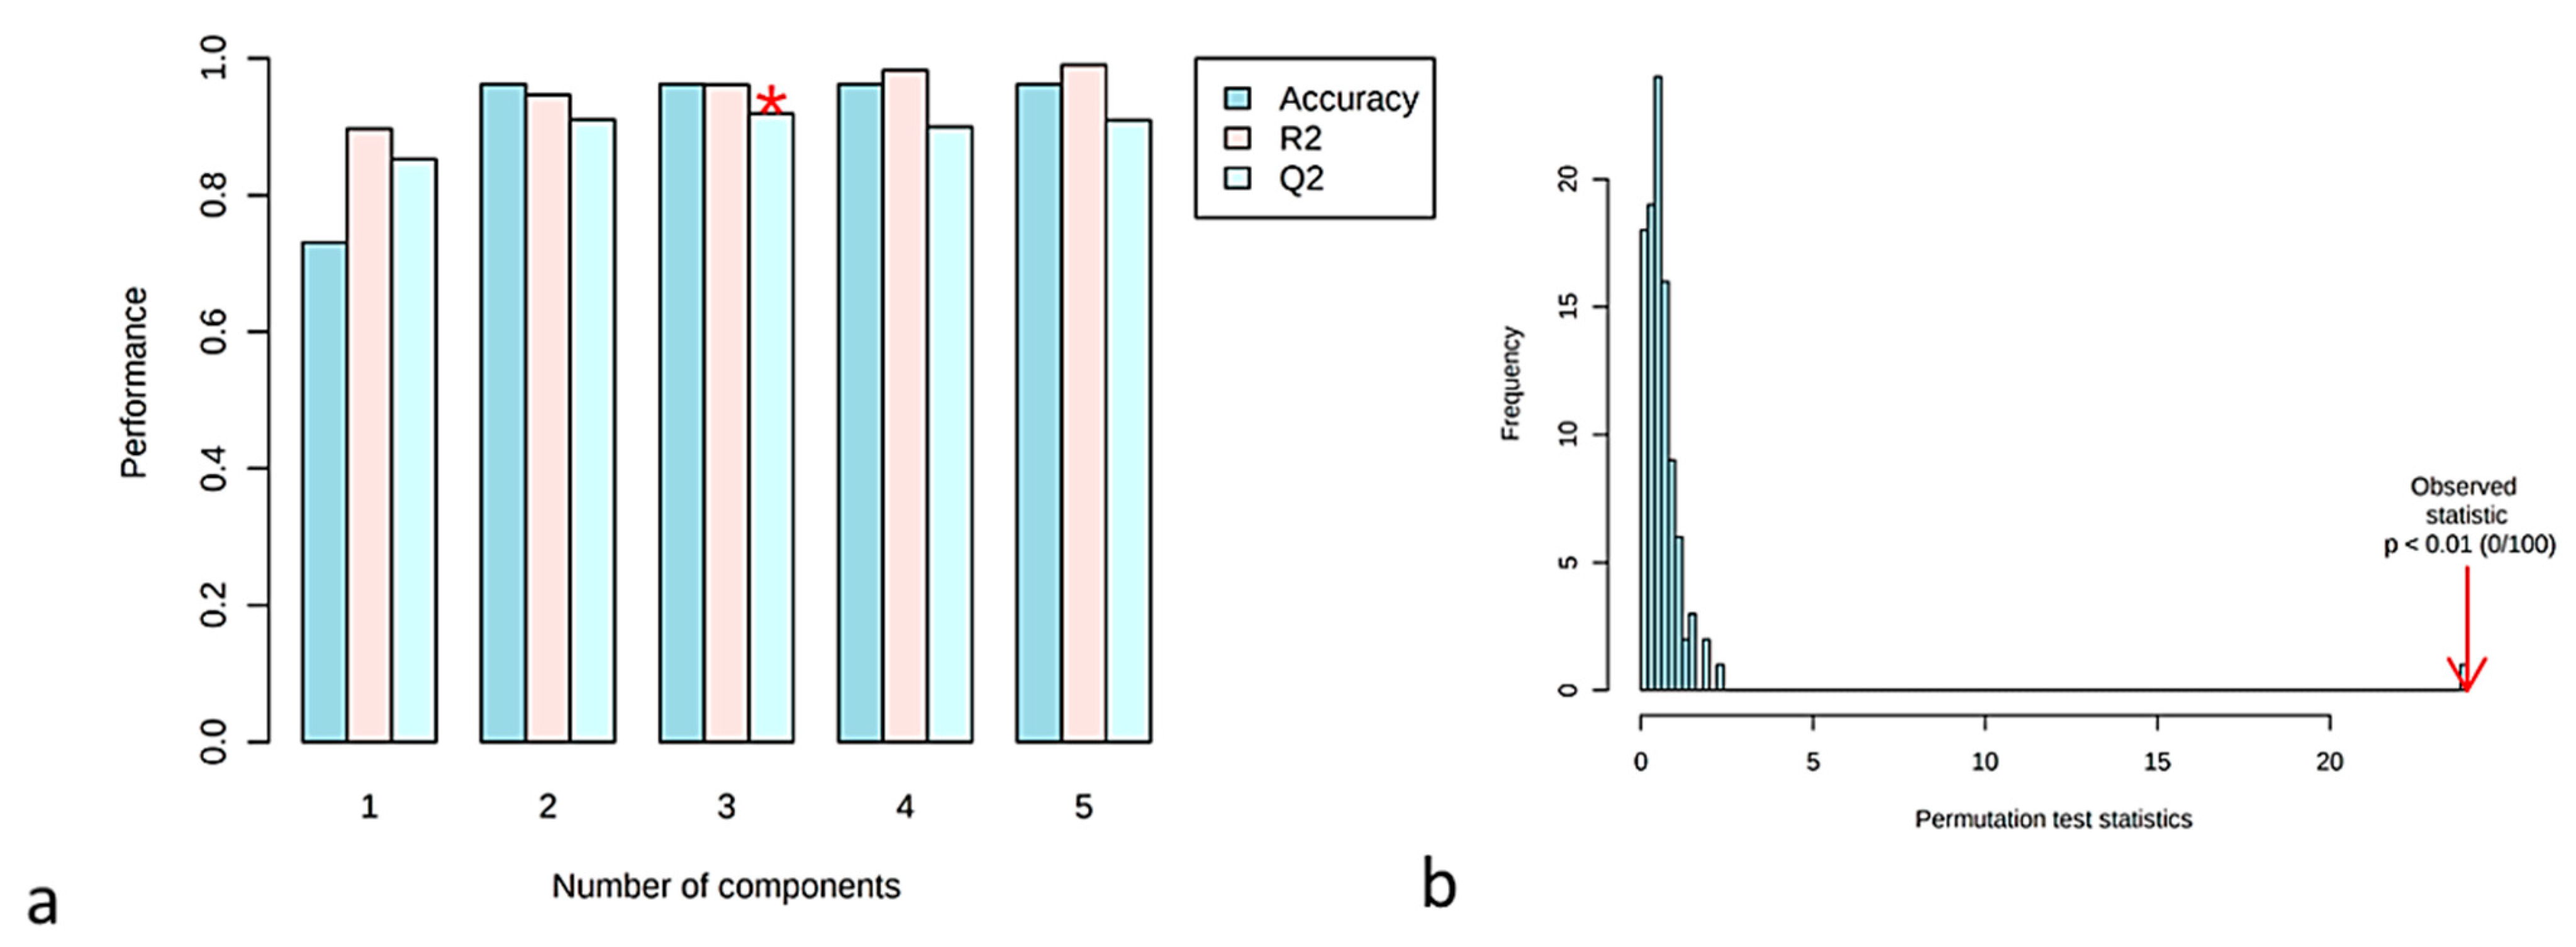
All samples were analyzed in triplicate (n = 3). The identified analytes were quantified using their maximum absorption wavelengths. The quantification ranges of each phenolic compounds as well as the mean values (±SD) are presented in Table 5. The quantification results are in accordance with those previously reported by Slatnar et al. [38], Ho et al. [39], and Vu et al. [40].
Eighteen phenolic compounds were determined proving that walnut kernels are rich in phenolics. Variations in the phenolic concentration ranges have already been reported in walnuts of different varieties [38,39,40], but there are limited reports concerning the effects of the geographical origin on the concentrations of the phenolic compounds.
The highest mean concentration in Greek walnuts was observed for myricetin (125.3 μg/g), and the second highest mean value was observed for epigallocatechin gallate (121.6 μg/g), while p-coumaric acid was ranked third with a mean concentration equal to 89.5 μg/g, and catechin followed with a mean concentration of 81.5 μg/g. As for Bulgarian walnuts, the highest mean concentration was observed for epigallocatechin gallate (114 μg/g). The second most abundant phenolic compound was myricetin with a mean value equal to 85.1 μg/g, and catechin followed with a mean concentration of 75.1 μg/g. As far as French walnuts are concerned, the highest mean concentration was observed for myricetin (131.6 μg/g). The second highest mean concentration was reported for p-coumaric acid (85.3 μg/g), and syringic acid followed with a mean concentration equal to 57.7 μg/g. High concentrations were observed for gallic acid, ferulic acid vanillic acid, from the class of accordingly to Vu et al. [40]. Sinapic acid presented high concentrations, as well, and the highest average concentration was determined in walnuts originating from Bulgaria (72.6 μg/g). Relatively lower concentrations were determined for caffeic acid, compared to the rest of the phenolic acids, which presented mean values of 2.05 μg/g, 4.25 μg/g, and 3.65 μg/g, for Greek, Bulgarian, and French walnuts, respectively. As for the rest of the flavonoids, the highest average concentration of diosmin (5.16 μg/g) was observed in Bulgarian walnuts, and the lowest in French (3.06 μg/g). The highest mean concentrations for vanillin were calculated in Greek walnuts (5.55 μg/g). Bulgarian walnuts were rich in kaempferol (6.32 μg/g), while French walnuts showerd higher values for gallocatechin gallate (7.02 μg/g). The obtained concentrations of querce-tin-3-o-glucoside were similar to other varieties of walnuts, such as Black and English [40].

3.4. PLS-DA Model

A PLS-DA model was developed using the MetaboAnalyst platform [36]. The chemometric model classified the samples according to the geographical origin (Bulgaria, Greece, and France) successfully with an explained variance of 59.5% within the first two dimensions. The score plot of the developed PLS-DA model is presented in Figure 3, showing the clustering of three individual groups of walnut samples. The colored areas around the samples (red for Bulgaria, blue for Greece, green for France) represent the 95% confidence region of the replicates. Variable importance in projection (VIP) algorithm was used to estimate the significance of each variable in projection used to build the PLS-DA model. The VIP scores of the variables show their contribution in the final model. According to Mehmood et al. [41], the cut-off value of above 0.83 was used for the VIP score. The Figure 4 shows the most important features with calculated VIP scores above 0.83. p-Coumaric acid, kaempferol, rosmarinic acid, myricetin, caffeic acid, rutin, epigallocatechin gallate, vanillic acid, and syringic acid were selected as the most important markers responsible for the discrimination between the walnut samples originating from different countries. According to Figure 4, the compounds that cause greater variation and are characteristic for each geographical origin are marked in red. In this respect, p-coumaric acid, myricetin, epigallocatechin gallate, syringic acid and vanillic acid cause greater variation in the Greek samples; while kaempferol, rosmarinic acid, caffeic acid and rutin are characteristic markers of the Bulgarian walnuts. The compounds marked in yellow cause slightly lower variation to each category of samples, and those marked in blue cause the lowest variation.
For validation, the Leave-One-Out Cross-Validation (LOOCV) method was applied using five components. The goodness of fit (R2 = 0.99) and the predictability of the model (Q2 = 0.90) values suggest that this is a PLS-DA model with strong predictive power (Figure 5a). The accuracy = 0.96, was obtained from the third component, shown in Figure 5a with asterisk. Permutation test statistics (100 random permutations) were calculated and the results verified that the walnut samples significantly differed (with one sample t-test with p-value < 0.01) from each other [42] (Figure 5b).

4. Conclusions

A novel HPLC-DAD method was developed and optimized for the determination of phenolic compounds in 26 walnut samples of the Chandler variety originating from Bulgaria, Greece, and France. Overall, eighteen phenolic compounds were determined (caffeic acid, catechin, diosmin, epigallocatechin gallate, ferulic acid, gallic acid, gallocatechin gallate, kaempferol, myricetin, myricitrin, p-coumaric acid, quercetin-3-o-glucoside, rosmarinic acid, rutin, sinapic acid, syringic acid, vanillic acid, and vanillin) in walnut samples. The quantification results were further analyzed with chemometrics, and a PLS-DA model was developed and successfully classified the walnut samples based on their geographical origin, with the first two dimensions explaining the 59.5% of the total variance. p-coumaric acid, kaempferol, rosmarinic acid, myricetin, caffeic acid, rutin, epigallo-catechin gallate, vanillic acid, and syringic acid were proposed as markers responsible for the discrimination between the walnut samples of different geographical origins.
This work has made progress towards the phenolic characterization of walnuts of the Chandler variety originating from Bulgaria, Greece, and France highlighting that the geographical affects the phenolic profile and proposing a robust PLS-DA model that could be used for the prediction of the geographical origin in authenticity studies and the detection of fraudulent indices.

Author Contributions

Conceptualization, N.P.K. and V.F.S.; methodology, N.P.K.; validation, N.P.K.; formal analysis, N.P.K.; investigation, N.P.K.; resources, V.F.S.; data curation, N.P.K.; writing—original draft preparation, N.P.K.; writing—review and editing, V.F.S.; visualization, N.P.K.; supervision, V.F.S.; project administration, N.P.K. and V.F.S. Both authors have read and agreed to the published version of the manuscript.

Funding

This research was co-financed by Greece and the European Union (European Social Fund, ESF) through the Operational Programme “Human Resources Development, Education and Lifelong Learning” in the context of the project “Reinforcement of Postdoctoral Researchers—2nd Cycle” (MIS- 5033021), implemented by the State Scholarships Foundation (IKY) with grant no. 2019-050-0503-17749.

Acknowledgments

The authors would like to thank Terra Rossa di Olimpo and Ioannis Tsirogiannis and for supporting the sampling of Chandler walnuts originating from Thessaly in Greece used in this study.

Conflicts of Interest

The authors declare no conflict of interest.

References

  1. Dennis, M.J. Recent developments in food authentication†. Analyst 1998, 123, 151–156. [Google Scholar] [CrossRef]
  2. Production, F.; Cervantes-Godoy, D.; Dewbre, J.; PIN; Amegnaglo, C.J.; Soglo, Y.Y.; Akpa, A.F.; Bickel, M.; Sanyang, S.; Ly, S.; et al. The Future of Food and Agriculture: Trends and Challenges; Food and Agriculture Organization of the United Nations: Rome, Italy, 2017; Volume 4, ISBN 1815-6797. [Google Scholar]
  3. Abdallah, I.B.; Tlili, N.; Martinez-Force, E.; Rubio, A.G.P.; Perez-Camino, M.C.; Albouchi, A.; Boukhchina, S. Content of carotenoids, tocopherols, sterols, triterpenic and aliphatic alcohols, and volatile compounds in six walnuts (Juglans regia L.) varieties. Food Chem. 2015, 173, 972–978. [Google Scholar] [CrossRef] [Green Version]
  4. Martinez, M.L.; O Labuckas, D.; Lamarque, A.L.; Maestri, D.M. Walnut (Juglans regia L.): Genetic resources, chemistry, by-products. J. Sci. Food Agric. 2010, 90, 1959–1967. [Google Scholar] [CrossRef]
  5. Kalogiouri, N.; Manousi, N.; Zachariadis, G. Determination of the Toxic and Nutrient Element Content of Almonds, Walnuts, Hazelnuts and Pistachios by ICP-AES. Separations 2021, 8, 28. [Google Scholar] [CrossRef]
  6. Poggetti, L.; Ferfuia, C.; Chiabà, C.; Testolin, R.; Baldini, M. Kernel oil content and oil composition in walnut (Juglans regia L.) accessions from north-eastern Italy. J. Sci. Food Agric. 2017, 98, 955–962. [Google Scholar] [CrossRef] [Green Version]
  7. Gandev, S.; Arnaudov, V.; Serbezova, D. Selection and cultivation of a local wild walnut type in Bulgaria. Acta Hortic. 2015, 135–139. [Google Scholar] [CrossRef]
  8. Kalogiouri, N.P.; Manousi, N.; Rosenberg, E.; Zachariadis, G.A.; Samanidou, V.F. Advances in the Chromatographic Separation and Determination of Bioactive Compounds for Assessing the Nutrient Profile of Nuts. Curr. Anal. Chem. 2021, 17, 495–511. [Google Scholar] [CrossRef]
  9. Maguire, L.S.; O’Sullivan, S.M.; Galvin, K.; O’Connor, T.P.; O’Brien, N.M. Fatty acid profile, tocopherol, squalene and phytosterol content of walnuts, almonds, peanuts, hazelnuts and the macadamia nut. Int. J. Food Sci. Nutr. 2004, 55, 171–178. [Google Scholar] [CrossRef] [PubMed]
  10. Lavedrine, F.; Ravel, A.; Poupard, A.; Alary, J. Effect of geographic origin, variety and storage on tocopherol concentrations in walnuts by HPLC. Food Chem. 1997, 58, 135–140. [Google Scholar] [CrossRef]
  11. Martinez, M.L.; Mattea, M.A.; Maestri, D.M. Varietal and crop year effects on lipid composition of walnut (Juglans regia) genotypes. J. Am. Oil Chem. Soc. 2006, 83, 791–796. [Google Scholar] [CrossRef]
  12. Amaral, J.; Casal, S.; Pereira, J.A.; Seabra, R.M.; Oliveira, B. Determination of Sterol and Fatty Acid Compositions, Oxidative Stability, and Nutritional Value of Six Walnut (Juglans regia L.) Cultivars Grown in Portugal. J. Agric. Food Chem. 2003, 51, 7698–7702. [Google Scholar] [CrossRef] [Green Version]
  13. Pereira, J.A.; Oliveira, I.; Sousa, A.; Ferreira, I.; Bento, A.A.; Estevinho, M.L.M.F. Bioactive properties and chemical composition of six walnut (Juglans regia L.) cultivars. Food Chem. Toxicol. 2008, 46, 2103–2111. [Google Scholar] [CrossRef]
  14. Kalogiouri, N.P.; Manousi, N.; Rosenberg, E.; Zachariadis, G.A.; Paraskevopoulou, A.; Samanidou, V. Exploring the volatile metabolome of conventional and organic walnut oils by solid-phase microextraction and analysis by GC-MS combined with chemometrics. Food Chem. 2021, 363, 130331. [Google Scholar] [CrossRef]
  15. Cindrić, I.J.; Zeiner, M.; Hlebec, D. Mineral Composition of Elements in Walnuts and Walnut Oils. Int. J. Environ. Res. Public Health 2018, 15, 2674. [Google Scholar] [CrossRef] [PubMed] [Green Version]
  16. Lavedrine, F.; Ravel, A.; Villet, A.; Ducros, V.; Alary, J. Mineral composition of two walnut cultivars originating in France and California. Food Chem. 2000, 68, 347–351. [Google Scholar] [CrossRef]
  17. Lavedrine, F.; Zmirou, D.; Ravel, A.; Balducci, F.; Alary, J. Blood Cholesterol and Walnut Consumption: A Cross-sectional Survey in France. Prev. Med. 1999, 28, 333–339. [Google Scholar] [CrossRef]
  18. Verardo, V.; Bendini, A.; Cerretani, L.; Malaguti, D.; Cozzolino, E.; Caboni, M.F. Capillary Gas Chromatography Analysis of Lipid Composition and Evaluation of Phenolic Compounds by Micellar Electrokinetic Chromatography in Italian Walnut (Juglans Regial): Irrigation and Fertilization Influence. J. Food Qual. 2009, 32, 262–281. [Google Scholar] [CrossRef]
  19. Dogan, M.; Akgül, A. Fatty acid composition of some walnut (Juglans regia L.) cultivars from east Anatolia. Grasas Aceites 2005, 56, 328–331. [Google Scholar] [CrossRef] [Green Version]
  20. Lee, J.; Vázquez-Araújo, L.; Adhikari, K.; Warmund, M.; Elmore, J. Volatile Compounds in Light, Medium, and Dark Black Walnut and Their Influence on the Sensory Aromatic Profile. J. Food Sci. 2011, 76, C199–C204. [Google Scholar] [CrossRef]
  21. Esteki, M.; Farajmand, B.; Amanifar, S.; Barkhordari, R.; Ahadiyan, Z.; Dashtaki, E.; Mohammadlou, M.; Heyden, Y.V. Classification and authentication of Iranian walnuts according to their geographical origin based on gas chromatographic fatty acid fingerprint analysis using pattern recognition methods. Chemom. Intell. Lab. Syst. 2017, 171, 251–258. [Google Scholar] [CrossRef]
  22. Grilo, F.; Wang, S. Walnut (Juglans regia L.) Volatile Compounds Indicate Kernel and Oil Oxidation. Foods 2021, 10, 329. [Google Scholar] [CrossRef]
  23. Medic, A.; Jakopic, J.; Hudina, M.; Solar, A.; Veberic, R. Identification and quantification of the major phenolic constituents in Juglans regia L. peeled kernels and pellicles, using HPLC–MS/MS. Food Chem. 2021, 352, 129404. [Google Scholar] [CrossRef]
  24. Kritikou, E.; Kalogiouri, N.P.; Kolyvira, L.; Thomaidis, N.S. Target and Suspect HRMS Metabolomics for the Determination of Functional Ingredients in 13 Varieties of Olive Leaves and Drupes from Greece. Molecules 2020, 25, 4889. [Google Scholar] [CrossRef] [PubMed]
  25. Andrade, P.; Pereira, D.; Ferreres, F.; Valentao, P. Recent Trends in High Throughput Analysis and Antioxidant Potential Screening for Phenolics. Curr. Pharm. Anal. 2008, 4, 137–150. [Google Scholar] [CrossRef]
  26. Kalogiouri, N.; Samanidou, V. Advances in the Optimization of Chromatographic Conditions for the Separation of Antioxidants in Functional Foods. Rev. Sep. Sci. 2019, 1, 17–33. [Google Scholar] [CrossRef]
  27. Pyrzynska, K.; Sentkowska, A. Recent Developments in the HPLC Separation of Phenolic Food Compounds. Crit. Rev. Anal. Chem. 2014, 45, 41–51. [Google Scholar] [CrossRef]
  28. Rodríguez, L.C.; Ruiz-Samblás, C.; Valverde-Som, L.; Pérez-Castaño, E.; González-Casado, A. Chromatographic fingerprinting: An innovative approach for food ‘identitation’ and food authentication—A tutorial. Anal. Chim. Acta 2016, 909, 9–23. [Google Scholar] [CrossRef]
  29. Wang, Y.-P.; Zou, Y.-R.; Shi, J.-T.; Shi, J. Review of the chemometrics application in oil-oil and oil-source rock correlations. J. Nat. Gas Geosci. 2018, 3, 217–232. [Google Scholar] [CrossRef]
  30. Jolliffe, I.T.; Cadima, J. Principal component analysis: A review and recent developments. Philos. Trans. R. Soc. A Math. Phys. Eng. Sci. 2016, 374, 20150202. [Google Scholar] [CrossRef] [PubMed]
  31. Brereton, R.G.; Lloyd, G. Partial least squares discriminant analysis: Taking the magic away. J. Chemom. 2014, 28, 213–225. [Google Scholar] [CrossRef]
  32. Kalogiouri, N.P.; Samanidou, V.F. Liquid chromatographic methods coupled to chemometrics: A short review to present the key workflow for the investigation of wine phenolic composition as it is affected by environmental factors. Environ. Sci. Pollut. Res. 2020, 1–15. [Google Scholar] [CrossRef] [PubMed]
  33. Pinasseau, L.; Vallverdú-Queralt, A.; Verbaere, A.; Roques, M.; Meudec, E.; Le Cunff, L.; Péros, J.-P.; Ageorges, A.; Sommerer, N.; Boulet, J.-C.; et al. Cultivar Diversity of Grape Skin Polyphenol Composition and Changes in Response to Drought Investigated by LC-MS Based Metabolomics. Front. Plant Sci. 2017, 8, 1826. [Google Scholar] [CrossRef] [Green Version]
  34. Czitrom, V. One-Factor-at-a-Time versus Designed Experiments. Am. Stat. 1999, 53, 126. [Google Scholar] [CrossRef]
  35. Rifna, E.J.; Pandiselvam, R.; Kothakota, A.; Subba Rao, K.V.; Dwivedi, M.; Kumar, M.; Thirumdas, R.; Ramesh, S.V. Advanced process analytical tools for identification of adulterants in edible oils—A review. Food Chem. 2022, 369, 130898. [Google Scholar] [CrossRef]
  36. Pang, Z.; Chong, J.; Zhou, G.; de Lima Morais, D.A.; Chang, L.; Barrette, M.; Gauthier, C.; Jacques, P.; Li, S.; Xia, J. MetaboAnalyst 5.0: Narrowing the gap between raw spectra and functional insights. Nucleic Acids Res. 2021, 49, W388–W396. [Google Scholar] [CrossRef]
  37. Setyaningsih, W.; Saputro, I.E.; Palma, M.; Barroso, C.G. Stability of 40 phenolic compounds during ultrasound-assisted extractions (UAE). In AIP Conference Proceedings; AIP Publishing LLC: Melville, NY, USA, 2016; Volume 1755, p. 080009. [Google Scholar] [CrossRef] [Green Version]
  38. Slatnar, A.; Mikulic-Petkovsek, M.; Stampar, F.; Veberic, R.; Solar, A. Identification and quantification of phenolic compounds in kernels, oil and bagasse pellets of common walnut (Juglans regia L.). Food Res. Int. 2015, 67, 255–263. [Google Scholar] [CrossRef]
  39. Ho, K.-V.; Roy, A.; Foote, S.; Vo, P.H.; Lall, N.; Lin, C.-H. Profiling Anticancer and Antioxidant Activities of Phenolic Compounds Present in Black Walnuts (Juglans nigra) Using a High-Throughput Screening Approach. Molecules 2020, 25, 4516. [Google Scholar] [CrossRef]
  40. Vu, D.C.; Vo, P.H.; Coggeshall, M.V.; Lin, C.-H. Identification and Characterization of Phenolic Compounds in Black Walnut Kernels. J. Agric. Food Chem. 2018, 66, 4503–4511. [Google Scholar] [CrossRef] [PubMed]
  41. Mehmood, T.; Liland, K.H.; Snipen, L.; Sæbø, S. A review of variable selection methods in Partial Least Squares Regression. Chemom. Intell. Lab. Syst. 2012, 118, 62–69. [Google Scholar] [CrossRef]
  42. Szymańska, E.; Saccenti, E.; Smilde, A.K.; Westerhuis, J.A. Double-check: Validation of diagnostic statistics for PLS-DA models in metabolomics studies. Metabolomics 2011, 8, 3–16. [Google Scholar] [CrossRef] [Green Version]
Figure 1. Effect of (a) extraction solvent; (b) extraction time, (c) extraction temperature on the extraction efficiency.
Foods 10 02145 g001
Figure 2. Characteristic chromatogram of a walnut sample spiked with a standard mixture at 2 μg/g; monitored at 280 nm.
Foods 10 02145 g002
Figure 3. PLS-DA prediction model score plot showing the discrimination of the walnuts originating from Bulgaria (B1−B9) in red color, France (F1−F7) in green color, and Greece (G1−G10) in blue color.
Foods 10 02145 g003
Figure 4. VIP scores of the most important features causing greater variation in the developed PLS-DA model.
Foods 10 02145 g004
Figure 5. (a) Cross validation parameters of the developed PLS-PDA model with the prediction error measure: accuracy, R2, Q2 (The accuracy = 0.96, was obtained from the third component shown with asterisk.); (b) Permutation test statistics (100 random permutations).
Foods 10 02145 g005
Table 1. HPLC-DAD method analytical parameters.
CompoundCalibration Equation
(Linear Range: 2–20 μg/g)
r2LOD
(μg/g)
LOQ
(μg/g)
caffeic acidy = 110028.53x + 55320.9920.150.45
catechiny = 12565x + 12040.9940.300.90
diosminy = 14007.23x + 13530.9910.200.60
epigallocatechin gallatey = 19304x − 12120.9960.401.20
ferulic acidy = 88455x + 43280.9940.250.75
gallic acidy = 10562x − 11.80.9970.100.30
gallocatechin gallatey = 2004x − 14500.9960.451.35
kaempferoly = 1878x + 22420.9980.451.35
myricetiny = 19502x + 10260.9970.481.44
myricitriny = 20521x + 14080.9960.320.96
p-coumaric acidy = 107385x + 43250.9990.250.75
quercetin-3-o-glucosidey = 17542x + 24040.9970.280.84
rosmarinic acidy = 1508x + 48.30.9980.150.45
sinapic acidy = 107562x + 23850.9940.240.72
rutiny = 20008x + 4230.9930.340.96
syringic acidy = 105424x + 47280.9950.250.75
vanillic acidy = 65405x + 11250.9980.200.60
vanilliny = 138452x − 45850.9940.351.05
caffeic acidy = 125475x + 18420.9930.200.60
LOD: limit of detection, LOQ: limit of quantitation.
Table 2. %Recoveries (%R, n = 6) for the evaluation of repeatability.
Compound%R
Low Conc. Level (2 μg/g)
%RSD%R
Medium Conc. Level (10 μg/g)
%RSD%R
Maximum Conc. Level (20 μg/g)
%RSD
caffeic acid91.44.792.52.298.42.5
catechin90.55.594.43.191.21.7
diosmin96.43.195.65.193.63.9
epigallocatechin gallate92.31.390.84.494.14.2
ferulic acid91.72.591.76.190.85.1
gallic acid92.13.692.43.192.16.3
gallocatechin gallate93.34.191.62.494.65.5
kaempferol91.85.289.75.392.83.7
myricetin90.94.392.41.893.54.9
myricitrin94.51.993.22.694.33.4
p-coumaric acid95.62.591.43.191.14.8
quercetin-3-o-glucoside93.02.795.25.493.12.7
rosmarinic acid92.23.593.74.989.45.6
sinapic acid91.12.892.46.386.42.8
rutin94.23.693.53.992.65.7
syringic acid93.15.492.62.792.36.2
vanillic acid92.86.290.71.694.54.3
vanillin93.75.192.43.593.92.5
Conc.: Concentration.
Table 3. %Recoveries (%R n = 3 × 3) for the evaluation of intermediate precision.
Compound%R
Low Conc. Level (2 μg/g)
%RSD%R
Medium Conc. Level (10 μg/g)
%RSD%R
Maximum Conc. Level (10 μg/g)
%RSD
caffeic acid95.35.397.27.293.27.2
catechin92.87.196.55.492.46.8
diosmin97.48.893.14.891.55.5
epigallocatechin gallate93.57.991.49.194.35.9
ferulic acid97.16.395.87.492.26.4
gallic acid98.26.8100.65.295.67.1
gallocatechin gallate91.97.297.86.690.16.9
kaempferol95.19.493.55.492.47.3
myricetin93.78.394.28.893.38.1
myricitrin92.27.696.67.196.16.5
p-coumaric acid91.66.795.111.195.57.1
quercetin-3-o-glucoside94.48.598.35.994.76.8
rosmarinic acid92.39.195.78.792.15.2
sinapic acid91.77.597.59.191.53.4
rutin92.27.198.26.795.59.2
syringic acid90.58.391.15.890.76.5
vanillic acid93.18.495.37.391.15.8
vanillin94.45.792.46.492.17.5
Conc.: Concentration.
Table 4. Retention time and maximum absorption wavelength of the phenolic analytes determined in walnuts.
CompoundRtλ (nm)
gallic acid11.1278
gallocatechin gallate12.6285
catechin14.6280
vanillic acid15.5260
epigallocatechin gallate17.4280
syringic acid18.1274
rutin19.3353
myricitrin20.6360
p-coumaric acid21.4270
vanillin22.6278
sinapic acid23.5260
quercetin-3-o-glucoside26.5365
diosmin28.8345
ferulic acid29.8293
caffeic acid32.2284
myricetin34.3370
rosmarinic acid37.1272
kaempferol37.9360
Rt: retention time.
Table 5. Quantification results of the phenolic compounds determined in walnuts originating from Greece, Bulgaria, and France (samples analyzed in triplicate, n = 3).
OriginGreeceBulgariaFrance
CompoundConcentration Range (μg/g)Mean Value
(μg/g ± SD)
Concentration Range (μg/g)Mean Value
(μg/g ± SD)
Concentration Range (μg/g)Mean Value
(μg/g ± SD)
caffeic acidLOQ–2.562.05 ± 0.282.67–5.584.25 ± 0.542.35–4.423.65 ± 0.33
catechin78–14881.5 ± 5.2434–12275.1 ± 2.354.21–75.334.2 ± 6.05
diosminLOQ–23.84.32 ± 0.14LOQ–22.15.16 ± 0.392.25–8.323.06 ± 0.21
epigallocatechin gallate75.1–173.4121.6 ± 14.918.7–125.6114 ± 11.540.8–63.951.6 ± 7.66
ferulic acid25.1–168.467.4 ± 7.5231.2–86.455.9 ± 3.3522.1–29.823.5 ± 2.11
gallic acid4.21–75.645.3 ± 6.1820.3–78.557.5 ± 8.422.14–45.825.6 ± 5.24
gallocatechin gallate3.20–4.644.12 ± 0.082.24–5.364.78 ± 0.235.78–8.207.02 ± 0.69
kaempferolLOQ-5.212.04 ± 0.325.12–9.206.32 ± 2.542.75 ± 4.253.04 ± 0.41
myricetin73.4–148.23125.3 ± 16.6 26.1–98.885.1 ± 9.27105.4–178.3131.6 ± 27.8
myricitrin2.30–3.653.08 ± 0.782.18–2.992.36 ± 0.132.65–3.562.85 ±0.22
p-coumaric acid83.1–107.489.5 ± 12.229.4–40.531.3 ± 2.3572.1–93.585.3 ± 7.72
quercetin-3-o-glucoside3.31–6.124.78 ± 0.545.61–0.246.28 ± 0.752.98–3.653.14 ± 0.09
rosmarinic acid2.85–19.67.85 ± 1.0535.7–56.442.6 ± 2.3718.3–30.423.6 ± 2.33
rutin21.5–35.427.4 ± 7.2253.2–66.857.7 ± 3.8512.5–28.8 21.4 ± 3.44
sinapic acidLOQ–83.435.4 ± 3.3153.5–121.872.6 ± 11.320.7–47.831.1 ± 4.06
syringic acid32.1–75.446.2 ± 3.6619.3–58.637.2 ± 1.8953.1–67.857.7 ± 5.32
vanillic acid7.53–95.662.7 ± 5.65LOQ–73.565.4 ± 7.047.58–41.237.3 ± 5.32
vanillin1.81–8.565.55 ± 0.891.71–4.423.78 ± 0.651.85–5.564.68 ± 1.85
Publisher’s Note: MDPI stays neutral with regard to jurisdictional claims in published maps and institutional affiliations.

