
Non-Destructive Spectroscopic and Imaging Techniques for the Detection of Processed Meat Fraud


Abstract
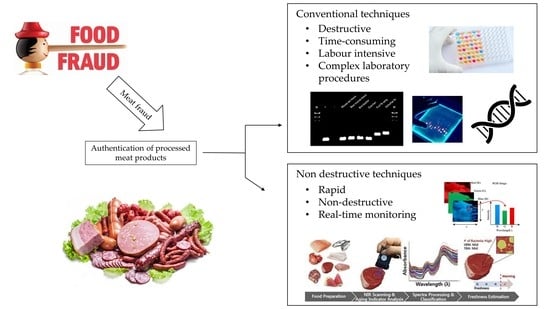
1. Introduction
2. Non-Destructive Spectroscopic and Imaging Methods
3. Vibrational Spectroscopy
3.1. Near-Infrared- and Mid-Infrared Spectroscopy
3.2. Fourier Transform Spectroscopy
3.3. Raman Spectroscopy
4. Colour Imaging
5. Hyperspectral Imaging
6. X-Ray Imaging and Computed Tomography
7. General Discussion and Recommendations
7.1. Experimental Design
7.2. Multivariate Data Analysis
8. In-Situ Applications
9. Challenges and Future Trends
10. Conclusions
Author Contributions
Funding
Institutional Review Board Statement
Informed Consent Statement
Data Availability Statement
Conflicts of Interest
References
- Ballin, N.Z.; Lametsch, R. Analytical methods for authentication of fresh vs. thawed meat—A review. Meat Sci. 2008, 80, 151–158. [Google Scholar] [CrossRef] [PubMed]
- Baltic, M.Z.; Boskovic, M. When man met meat: Meat in human nutrition from ancient times till today. Procedia Food Sci. 2015, 5, 6–9. [Google Scholar] [CrossRef]
- Bender, A. Meat and Meat Products in Human Nutrition in Developing Countries; Food and Agriculture Organization of the United Nations: Rome, Italy, 1992; ISBN 9251031460. [Google Scholar]
- Pereira, P.M.d.C.C.; Vicente, A.F.d.R.B. Meat nutritional composition and nutritive role in the human diet. Meat Sci. 2013, 93, 586–592. [Google Scholar] [CrossRef] [PubMed]
- Downey, G.; Beauchêne, D. Discrimination between fresh and frozen-then-thawed beef m. longissimus dorsi by combined visible-near infrared reflectance spectroscopy: A feasibility study. Meat Sci. 1997, 45, 353–363. [Google Scholar] [CrossRef]
- Nakyinsige, K.; Che Man, Y.B.; Sazili, A.Q. Halal authenticity issues in meat and meat products. Meat Sci. 2012, 91, 207–214. [Google Scholar] [CrossRef]
- Cawthorn, D.-M.; Steinman, H.A.; Hoffman, L.C. A high incidence of species substitution and mislabelling detected in meat products sold in South Africa. Food Control 2013, 32, 440–449. [Google Scholar] [CrossRef]
- Meza-Márquez, O.G.; Gallardo-Velázquez, T.; Osorio-Revilla, G. Application of mid-infrared spectroscopy with multivariate analysis and soft independent modeling of class analogies (SIMCA) for the detection of adulterants in minced beef. Meat Sci. 2010, 86, 511–519. [Google Scholar] [CrossRef]
- Alamprese, C.; Amigo, J.M.; Casiraghi, E.; Engelsen, S.B. Identification and quantification of turkey meat adulteration in fresh, frozen-thawed and cooked minced beef by FT-NIR spectroscopy and chemometrics. Meat Sci. 2016, 121, 175–181. [Google Scholar] [CrossRef]
- Dean, N.; Murphy, T.B.; Downey, G. Using unlabelled data to update classification rules with applications in food authenticity studies. J. R. Stat. Soc. Appl. Stat. 2006, 55, 1–14. [Google Scholar] [CrossRef]
- Kademi, H.I.; Ulusoy, B.H.; Hecer, C. Applications of miniaturized and portable near infrared spectroscopy (NIRS) for inspection and control of meat and meat products. Food Rev. Int. 2019, 35, 201–220. [Google Scholar] [CrossRef]
- Premanandh, J. Horse meat scandal—A wake-up call for regulatory authorities. Food Control 2013, 34, 568–569. [Google Scholar] [CrossRef]
- Ballin, N.Z. Authentication of meat and meat products. Meat Sci. 2010, 86, 577–587. [Google Scholar] [CrossRef]
- Martín, R.; Azcona, J.I.; García, T.; Hernández, P.E.; Sanz, B. Sandwich ELISA for detection of horse meat in raw meat mixtures using antisera to muscle soluble proteins. Meat Sci. 1988, 22, 143–153. [Google Scholar] [CrossRef]
- Patterson, R.L.S.; Jones, S.J. Review of current techniques for the verification of the species origin of meat. Analyst 1990, 115, 501–506. [Google Scholar] [CrossRef]
- Smith, C. Application of immunoassay to the detection of food adulteration. In Food Safety and Quality Assurance—Applications of Immunoassay System; Elsevier Applied Science: London, UK, 1992; pp. 13–32. [Google Scholar]
- Jha, V.K.; Kumar, A.; Mandokhot, U.V. Indirect enzyme-linked immunosorbent assay in detection and differentiation of cooked and raw pork from meats of other species. J. Food Sci. Technol. 2003, 40, 254–256. [Google Scholar]
- Calvo, J.; Zaragoza, P.; Osta, R. Random amplified polymorphic DNA fingerprints for identification of species in poultry pate. Poult. Sci. 2001, 80, 522–524. [Google Scholar] [CrossRef]
- Calvo, J.H.; Osta, R.; Zaragoza, P. Quantitative PCR detection of pork in raw and heated ground beef and pate. J. Agric. Food Chem. 2002, 50, 5265–5267. [Google Scholar] [CrossRef] [PubMed]
- Rodriguez, M.A.; García, T.; González, I.; Asensio, L.; Hernández, P.E.; Martin, R. Qualitative PCR for the detection of chicken and pork adulteration in goose and mule duck foie gras. J. Sci. Food Agric. 2003, 83, 1176–1181. [Google Scholar] [CrossRef]
- Vasconcellos, L.P.d.M.K.; Tambasco-Talhari, D.; Pereira, A.P.; Coutinho, L.L.; Regitano, L.C.d.A. Genetic characterization of Aberdeen Angus cattle using molecular markers. Genet. Mol. Biol. 2003, 26, 133–137. [Google Scholar] [CrossRef][Green Version]
- Fajardo, V.; González, I.; López-Calleja, I.; Martín, I.; Rojas, M.; García, T.; Hernandez, P.; Martín, R. PCR identification of meats from chamois (Rupicapra rupicapra), pyrenean ibex (Capra pyrenaica), and mouflon (Ovis ammon) targeting specific sequences from the mitochondrial D-loop region. Meat Sci. 2007, 76, 644–652. [Google Scholar] [CrossRef] [PubMed]
- Fajardo, V.; González, I.; Martín, I.; Rojas, M.; Hernández, P.E.; García, T.; Martín, R. Real-time PCR for detection and quantification of red deer (Cervus elaphus), fallow deer (Dama dama), and roe deer (Capreolus capreolus) in meat mixtures. Meat Sci. 2008, 79, 289–298. [Google Scholar] [CrossRef] [PubMed]
- Kesmen, Z.; Gulluce, A.; Sahin, F.; Yetim, H. Identification of meat species by TaqMan-based real-time PCR assay. Meat Sci. 2009, 82, 444–449. [Google Scholar] [CrossRef]
- Soares, S.; Amaral, J.S.; Mafra, I.; Oliveira, M.B.P. Quantitative detection of poultry meat adulteration with pork by a duplex PCR assay. Meat Sci. 2010, 85, 531–536. [Google Scholar] [CrossRef] [PubMed]
- Siebert, S.; Beneke, B.; Bentler, W. Beef, pork and sheep meat-detecting previous frozen treatment by isoelectric-focusing in polyamide acryl gel (PAGIF) during routine diagnosis. Fleischwirtschaft 1994, 74, 417–420. [Google Scholar]
- Lerma-García, M.; Herrero-Martínez, J.; Ramis-Ramos, G.; Mongay-Fernández, C.; Simó-Alfonso, E. Prediction of the curing time of Spanish hams using peptide profiles established by capillary zone electrophoresis. Food Chem. 2009, 113, 635–639. [Google Scholar] [CrossRef]
- Vallejo-Cordoba, B.; Rodríguez-Ramírez, R.; González-Córdova, A.F. Capillary electrophoresis for bovine and ostrich meat characterisation. Food Chem. 2010, 120, 304–307. [Google Scholar] [CrossRef]
- Hung, C.-J.; Ho, H.-P.; Chang, C.-C.; Lee, M.-R.; Franje, C.A.; Kuo, S.-I.; Lee, R.-J.; Chou, C.-C. Electrochemical profiling using copper nanoparticle-plated electrode for identification of ostrich meat and evaluation of meat grades. Food Chem. 2011, 126, 1417–1423. [Google Scholar] [CrossRef]
- Montowska, M.; Pospiech, E. Differences in two-dimensional gel electrophoresis patterns of skeletal muscle myosin light chain isoforms between Bos taurus, Sus scrofa and selected poultry species. J. Sci. Food Agric. 2011, 91, 2449–2456. [Google Scholar] [CrossRef] [PubMed]
- Mazorra-Manzano, M.A.; Torres-Llanez, M.J.; González-Córdova, A.F.; Vallejo-Cordoba, B. A capillary electrophoresis method for the determination of hydroxyproline as a collagen content index in meat products. Food Anal. Methods 2012, 5, 464–470. [Google Scholar] [CrossRef]
- Elmasry, G.; Kamruzzaman, M.; Sun, D.-W.; Allen, P. Principles and applications of hyperspectral imaging in quality evaluation of agro-food products: A review. Crit. Rev. Food Sci. Nutr. 2012, 52, 999–1023. [Google Scholar] [CrossRef] [PubMed]
- Kamruzzaman, M.; Barbin, D.; ElMasry, G.; Sun, D.-W.; Allen, P. Potential of hyperspectral imaging and pattern recognition for categorization and authentication of red meat. Innov. Food Sci. Emerg. Technol. 2012, 16, 316–325. [Google Scholar] [CrossRef]
- Morsy, N.; Sun, D.-W. Robust linear and non-linear models of NIR spectroscopy for detection and quantification of adulterants in fresh and frozen-thawed minced beef. Meat Sci. 2013, 93, 292–302. [Google Scholar] [CrossRef] [PubMed]
- Rady, A.; Adedeji, A. Assessing different processed meats for adulterants using visible-near-infrared spectroscopy. Meat Sci. 2018, 136, 59–67. [Google Scholar] [CrossRef] [PubMed]
- Sowoidnich, K.; Kronfeldt, H.-D. Shifted excitation Raman difference spectroscopy at multiple wavelengths for in-situ meat species differentiation. Appl. Phys. B 2012, 108, 975–982. [Google Scholar] [CrossRef]
- Nolasco-Perez, I.M.; Rocco, L.A.C.M.; Cruz-Tirado, J.P.; Pollonio, M.A.R.; Barbon, S.; Barbon, A.P.A.C.; Barbin, D.F. Comparison of rapid techniques for classification of ground meat. Biosys. Eng. 2019, 183, 151–159. [Google Scholar] [CrossRef]
- Kamruzzaman, M.; Makino, Y.; Oshita, S.; Liu, S. Assessment of visible near-infrared hyperspectral imaging as a tool for detection of horsemeat adulteration in minced beef. Food Bioprocess Technol. 2015, 8, 1054–1062. [Google Scholar] [CrossRef]
- Zheng, X.; Li, Y.; Wei, W.; Peng, Y. Detection of adulteration with duck meat in minced lamb meat by using visible near-infrared hyperspectral imaging. Meat Sci. 2019, 149, 55–62. [Google Scholar] [CrossRef] [PubMed]
- Pospiech, M.; Zikmund, T.; Javůrková, Z.; Kaiser, J.; Tremlová, B. An Innovative Detection of Mechanically Separated Meat in Meat Products. Food Anal. Methods 2019, 12, 652–657. [Google Scholar] [CrossRef]
- Danezis, G.P.; Tsagkaris, A.S.; Camin, F.; Brusic, V.; Georgiou, C.A. Food authentication: Techniques, trends & emerging approaches. Trends Anal. Chem. 2016, 85, 123–132. [Google Scholar] [CrossRef]
- Esteki, M.; Shahsavari, Z.; Simal-Gandara, J. Use of spectroscopic methods in combination with linear discriminant analysis for authentication of food products. Food Control 2018, 91, 100–112. [Google Scholar] [CrossRef]
- Abbas, O.; Dardenne, P.; Baeten, V. Near-infrared, mid-infrared, and Raman spectroscopy. In Chemical Analysis of Food: Techniques and Applications, 1st ed.; Pico, Y., Ed.; Elsevier Inc.: San Diego, CA, USA, 2012; Volume 3, pp. 59–91. ISBN 978-0-12-384862-8. [Google Scholar]
- Bokobza, L. Near infrared spectroscopy. J. Near Infrared Spectrosc. 1998, 6, 3–18. [Google Scholar] [CrossRef]
- Bokobza, L. Origin of near-infrared absorption bands. In Near Infrared Spectroscopy: Principles, Instruments, Applications; Ozaki, S.Y., Heise, H.M., Eds.; Wiley-VCH Verlag: Weinheim, Germany, 2002; pp. 11–41. ISBN 978-3-527-61267-3. [Google Scholar]
- Barton, F.E. Theory and principles of near infrared spectroscopy. Spectrosc. Eur. 2002, 14, 12–19. [Google Scholar]
- Cen, H.; He, Y. Theory and application of near infrared reflectance spectroscopy in determination of food quality. Trends Food Sci. Technol. 2007, 18, 72–83. [Google Scholar] [CrossRef]
- Williams, P. Near-infrared technology—Getting the best out of light. In A Short Course in the Practical Implementation of Near-Infrared Spectroscopy for the User; PDK Projects, Inc.: Nanaimo, BC, Canada, 2006; ISBN 0975216708. [Google Scholar]
- Siesler, H.W. Basic principles of near-infrared spectroscopy. In Handbook of Near-Infrared Analysis, 3rd ed.; Burns, D.A., Ciurczak, E.W., Eds.; CRC Press, Taylor & Francis Group: Boca Raton, FL, USA, 2008; pp. 7–19. ISBN 978-0-8493-7393-0. [Google Scholar]
- Manley, M. Near-infrared spectroscopy and hyperspectral imaging: Non-destructive analysis of biological materials. Chem. Soc. Rev. 2014, 43, 8200–8214. [Google Scholar] [CrossRef]
- Manley, M.; Baeten, V. Spectroscopic Technique: Near Infrared (NIR) Spectroscopy. In Modern Techniques for Food Authentication; Sun, D.-W., Ed.; Elsevier: Oxford, UK, 2018; pp. 51–102. [Google Scholar]
- Givens, D.I.; De Boever, J.; Deaville, E. The principles, practices and some future applications of near infrared spectroscopy for predicting the nutritive value of foods for animals and humans. Nutr. Res. Rev. 1997, 10, 83–114. [Google Scholar] [CrossRef]
- Workman, J. A brief review of the near infrared measurement technique. NIR News 1993, 4, 8–16. [Google Scholar] [CrossRef]
- Blanco, M.; Villarroya, I. NIR spectroscopy: A rapid-response analytical tool. Trends Anal. Chem. 2002, 21, 240–250. [Google Scholar] [CrossRef]
- Al-Jowder, O.; Defernez, M.; Kemsley, E.K.; Wilson, R.H. Mid-infrared spectroscopy and chemometrics for the authentication of meat products. J. Agric. Food Chem. 1999, 47, 3210–3218. [Google Scholar] [CrossRef]
- McCharthy, W.J.; Kemeny, G.J. Fourier transform spectrophotometers in the near-infrared. In Handbook of Near-Infrared Analysis, 3rd ed.; Burns, D.A., Ciurczak, E.W., Eds.; CRC Press, Taylor & Francis Group: Boca Raton, FL, USA, 2008; pp. 79–91. ISBN 978-0-8493-7393-0. [Google Scholar]
- Fourier, J. Thèorie Analytique de la Chaleur, par M. Fourier; Chez Firmin Didot, Père et Fils: Paris, France, 1822; p. 639. [Google Scholar]
- Nielsen, S.S. Infrared Spectroscopy. In Food Analysis; Springer: New York, NY, USA, 2010; pp. 407–420. ISBN 1441914773. [Google Scholar]
- Schmutzler, M.; Beganovic, A.; Böhler, G.; Huck, C.W. Methods for detection of pork adulteration in veal product based on FT-NIR spectroscopy for laboratory, industrial and on-site analysis. Food Control 2015, 57, 258–267. [Google Scholar] [CrossRef]
- Bumbrah, G.S.; Sharma, R.M. Raman spectroscopy—Basic principle, instrumentation and selected applications for the characterization of drugs of abuse. Egypt. J. Forensic Sci. 2016, 6, 209–215. [Google Scholar] [CrossRef]
- Craig, A.P.; Franca, A.S.; Irudayaraj, J. Pattern recognition applied to spectroscopy: Conventional methods and future directions. In Pattern Recognition: Practices, Perspectives and Challenges; Vincent, D.B., Ed.; Nova Science Publishers, Inc.: New York, NY, USA, 2013; pp. 1–46. ISBN 978-1-62618-196-0. [Google Scholar]
- Larkin, P. IR and Raman Spectra-Structure Correlations: Characteristic Group Frequencies, Infrared and Raman Spectroscopy. In Principles and Spectral Interpretation; Elsevier: San Diego, CA, USA, 2011; pp. 73–115. [Google Scholar]
- Yang, D.; Ying, Y. Applications of Raman spectroscopy in agricultural products and food analysis: A review. Appl. Spectrosc. Rev. 2011, 46, 539–560. [Google Scholar] [CrossRef]
- Skoog, D.A.; Holler, F.J.; Crouch, S.R. Principles of Instrumental Analysis; Cengage Learning: Belmont, CA, USA, 2007; Volume 47. [Google Scholar]
- Willard, H.H.; Merritt, L.L., Jr.; Dean, J.A.; Settle, F.A., Jr. Instrumental Methods of Analysis; Wadsworth Company: New York, NY, USA, 1988. [Google Scholar]
- Long, D.A. The Raman Effect: A Unified Treatment of the Theory of Raman Scattering by Molecules; John Wiley & Sons, Ltd.: West Sussex, UK, 2002; pp. 1–585. [Google Scholar]
- Boyaci, I.H.; Genis, H.E.; Guven, B.; Tamer, U.; Alper, N. A novel method for quantification of ethanol and methanol in distilled alcoholic beverages using Raman spectroscopy. J. Raman Spectrosc. 2012, 43, 1171–1176. [Google Scholar] [CrossRef]
- Özbalci, B.; Boyaci, İ.H.; Topcu, A.; Kadılar, C.; Tamer, U. Rapid analysis of sugars in honey by processing Raman spectrum using chemometric methods and artificial neural networks. Food Chem. 2013, 136, 1444–1452. [Google Scholar] [CrossRef]
- Boyacı, I.H.; Temiz, H.T.; Uysal, R.S.; Velioğlu, H.M.; Yadegari, R.J.; Rishkan, M.M. A novel method for discrimination of beef and horsemeat using Raman spectroscopy. Food Chem. 2014, 148, 37–41. [Google Scholar] [CrossRef]
- Zhao, M.; Downey, G.; O’Donnell, C.P. Dispersive Raman spectroscopy and multivariate data analysis to detect offal adulteration of thawed beefburgers. J. Agric. Food Chem. 2015, 63, 1433–1441. [Google Scholar] [CrossRef] [PubMed]
- Barbin, D.F.; Mastelini, S.M.; Barbon, S.; Campos, G.F.C.; Barbon, A.P.A.C.; Shimokomaki, M. Digital image analyses as an alternative tool for chicken quality assessment. Biosys. Eng. 2016, 144, 85–93. [Google Scholar] [CrossRef]
- Gunasekaran, S. Computer vision technology for food quality assurance. Trends Food Sci. Technol. 1996, 7, 245–256. [Google Scholar] [CrossRef]
- Vithu, P.; Moses, J.A. Machine vision system for food grain quality evaluation: A review. Trends Food Sci. Technol. 2016, 56, 13–20. [Google Scholar] [CrossRef]
- Wu, D.; Sun, D.-W. Colour measurements by computer vision for food quality control—A review. Trends Food Sci. Technol. 2013, 29, 5–20. [Google Scholar] [CrossRef]
- Patel, K.K.; Kar, A.; Jha, S.N.; Khan, M.A. Machine vision system: A tool for quality inspection of food and agricultural products. J. Food Sci. Technol. 2012, 49, 123–141. [Google Scholar] [CrossRef] [PubMed]
- Du, C.-J.; Sun, D.-W. Recent developments in the applications of image processing techniques for food quality evaluation. Trends Food Sci. Technol. 2004, 15, 230–249. [Google Scholar] [CrossRef]
- Sun, D.-W. Inspecting pizza topping percentage and distribution by a computer vision method. J. Food Eng. 2000, 44, 245–249. [Google Scholar] [CrossRef]
- de Sousa Fernandes, D.D.; Romeo, F.; Krepper, G.; Di Nezio, M.S.; Pistonesi, M.F.; Centurión, M.E.; de Araújo, M.C.U.; Diniz, P.H.G.D. Quantification and identification of adulteration in the fat content of chicken hamburgers using digital images and chemometric tools. LWT Food Sci. Technol. 2019, 100, 20–27. [Google Scholar] [CrossRef]
- A.N.M.A.T. Argentine Food Code. Chapter VI: Meat and Related Foods, Article 330. Available online: http://www.anmat.gov.ar/alimentos/codigoa/Capitulo_VI_2017.pdf (accessed on 25 March 2020).
- Feng, Y.; ElMasry, G.; Sun, D.; Scannell, A.G.M.; Walsh, D.; Morcy, N. Near-infrared hyperspectral imaging and partial least squares regression for rapid and reagentless determination of Enterobacteriaceae on chicken fillets. Food Chem. 2013, 138, 1829–1836. [Google Scholar] [CrossRef]
- Goetz, A.F.H.; Vane, G.; Solomon, J.E.; Rock, B.N. Imaging spectrometry for earth remote sensing. Science 1985, 228, 1147–1153. [Google Scholar] [CrossRef]
- Burger, J.; Gowen, A. Data handling in hyperspectral image analysis. Chemom. Intell. Lab. Syst. 2011, 108, 13–22. [Google Scholar] [CrossRef]
- Geladi, P.; Grahn, H.; Burger, J. Multivariate images, hyperspectral imaging: Background and equipment. In Techniques and Applications of Hyperspectral Image Analysis; John Wiley & Sons Ltd.: Southern West Sussex, UK, 2007; pp. 1–15. [Google Scholar]
- Gowen, A.A.; O’Donnell, C.P.; Cullen, P.J.; Downey, G.; Frias, J.M. Hyperspectral imaging—An emerging process analytical tool for food quality and safety control. Trends Food Sci. Technol. 2007, 18, 590–598. [Google Scholar] [CrossRef]
- Williams, P.J. Near Infrared (NIR) Hyperspectral Imaging and X-Ray Computed Tomography Combined with Statistical and Multivariate Data Analysis to Study Fusarium Infection in Maize. Ph.D. Thesis, University of Stellenbosch, Stellenbosch, South Africa, 2013. [Google Scholar]
- Williams, P.J. Near Infrared (NIR) Hyperspectral Imaging for Evaluation of Whole Maize Kernels: Chemometrics for Exploration and Classification. Master’s Thesis, University of Stellenbosch, Stellenbosch, South Africa, 2009. [Google Scholar]
- Cheng, J.-H.; Qu, J.-H.; Sun, D.-W.; Zeng, X.-A. Visible/near-infrared hyperspectral imaging prediction of textural firmness of grass carp (Ctenopharyngodon idella) as affected by frozen storage. Food Res. Int. 2014, 56, 190–198. [Google Scholar] [CrossRef]
- Qin, J.; Chao, K.; Kim, M.S.; Lu, R.; Burks, T.F. Hyperspectral and multispectral imaging for evaluating food safety and quality. J. Food Eng. 2013, 118, 157–171. [Google Scholar] [CrossRef]
- Kamruzzaman, M.; Sun, D.-W.; ElMasry, G.; Allen, P. Fast detection and visualization of minced lamb meat adulteration using NIR hyperspectral imaging and multivariate image analysis. Talanta 2013, 103, 130–136. [Google Scholar] [CrossRef]
- Jiang, H.; Cheng, F.; Shi, M. Rapid Identification and Visualization of Jowl Meat Adulteration in Pork Using Hyperspectral Imaging. Foods 2020, 9, 154. [Google Scholar] [CrossRef]
- Chen, Q.; Zhang, C.; Zhao, J.; Ouyang, Q. Recent advances in emerging imaging techniques for non-destructive detection of food quality and safety. TracTrends Anal. Chem. 2013, 52, 261–274. [Google Scholar] [CrossRef]
- Kotwaliwale, N.; Singh, K.; Kalne, A.; Jha, S.N.; Seth, N.; Kar, A. X-ray imaging methods for internal quality evaluation of agricultural produce. J. Food Sci. Technol. 2014, 51, 1–15. [Google Scholar] [CrossRef] [PubMed]
- Neethirajan, S.; Jayas, D.S.; White, N.D.G. Detection of sprouted wheat kernels using soft X-ray image analysis. J. Food Eng. 2007, 81, 509–513. [Google Scholar] [CrossRef]
- Cnudde, V.; Boone, M.N. High-resolution X-ray computed tomography in geosciences: A review of the current technology and applications. Earth-Sci. Rev. 2013, 123, 1–17. [Google Scholar] [CrossRef]
- Landis, E.N.; Keane, D.T. X-ray microtomography. Mater. Charact. 2010, 61, 1305–1316. [Google Scholar] [CrossRef]
- Haff, R.P.; Toyofuku, N. X-ray detection of defects and contaminants in the food industry. Sens. Instrum. Food Qual. Saf. 2008, 2, 262–273. [Google Scholar] [CrossRef]
- Curry, T.S.; Dowdey, J.E.; Murry, R.C. Christensen’s Physics of Diagnostic Radiology, 4th ed.; Lippincott Williams & Wilkins: Philadelphia, PA, USA, 1990; ISBN 0812113101. [Google Scholar]
- Schoeman, L.; Williams, P.; du Plessis, A.; Manley, M. X-ray micro-computed tomography (μCT) for non-destructive characterisation of food microstructure. Trends Food Sci. Technol. 2016, 47, 10–24. [Google Scholar] [CrossRef]
- Zwiggelaar, R.; Bull, C.R.; Mooney, M.J. X-ray simulations for imaging applications in the agricultural and food industries. J. Agric. Eng. Res. 1996, 63, 161–170. [Google Scholar] [CrossRef]
- Baker, D.R.; Mancini, L.; Polacci, M.; Higgins, M.D.; Gualda, G.A.R.; Hill, R.J.; Rivers, M.L. An introduction to the application of X-ray microtomography to the three-dimensional study of igneous rocks. Lithos 2012, 148, 262–276. [Google Scholar] [CrossRef]
- Lim, K.S.; Barigou, M. X-ray micro-computed tomography of cellular food products. Food Res. Int. 2004, 37, 1001–1012. [Google Scholar] [CrossRef]
- Frisullo, P.; Laverse, J.; Marino, R.; Del Nobile, M.A. X-ray computed tomography to study processed meat microstructure. J. Food Eng. 2009, 94, 283–289. [Google Scholar] [CrossRef]
- Alamprese, C.; Casale, M.; Sinelli, N.; Lanteri, S.; Casiraghi, E. Detection of minced beef adulteration with turkey meat by UV–vis, NIR and MIR spectroscopy. LWT Food Sci. Technol. 2013, 53, 225–232. [Google Scholar] [CrossRef]
- Zamora-Rojas, E.; Pérez-Marín, D.; De Pedro-Sanz, E.; Guerrero-Ginel, J.; Garrido-Varo, A. In-situ Iberian pig carcass classification using a micro-electro-mechanical system (MEMS)-based near infrared (NIR) spectrometer. Meat Sci. 2012, 90, 636–642. [Google Scholar] [CrossRef]
- Piotrowski, C.; Garcia, R.; Garrido-Varo, A.; Pérez-Marín, D.; Riccioli, C.; Fearn, T. The potential of portable near infrared spectroscopy for assuring quality and authenticity in the food chain, using Iberian hams as an example. Animal 2019, 13, 3018–3021. [Google Scholar] [CrossRef]
- Pérez-Marín, D.; Fearn, T.; Riccioli, C.; De Pedro, E.; Garrido, A. Probabilistic classification models for the in situ authentication of iberian pig carcasses using near infrared spectroscopy. Talanta 2021, 222, 121511. [Google Scholar] [CrossRef]
- Brereton, R.G. Chemometrics: Data Analysis for the Laboratory and Chemical Plant; John Wiley & Sons, Ltd.: West Sussex, UK, 2003; ISBN 0470845740. [Google Scholar]
- Barbin, D.F.; Valous, N.A.; Sun, D.-W. Tenderness prediction in porcine longissimus dorsi muscles using instrumental measurements along with NIR hyperspectral and computer vision imagery. Innov. Food Sci. Emerg. Technol. 2013, 20, 335–342. [Google Scholar] [CrossRef]
- Huang, L.; Zhao, J.; Chen, Q.; Zhang, Y. Nondestructive measurement of total volatile basic nitrogen (TVB-N) in pork meat by integrating near infrared spectroscopy, computer vision and electronic nose techniques. Food Chem. 2014, 145, 228–236. [Google Scholar] [CrossRef]
- Khulal, U.; Zhao, J.; Hu, W.; Chen, Q. Intelligent evaluation of total volatile basic nitrogen (TVB-N) content in chicken meat by an improved multiple level data fusion model. Sens. Actuators B Chem. 2017, 238, 337–345. [Google Scholar] [CrossRef]
- Aheto, J.H.; Huang, X.; Tian, X.; Ren, Y.; Ernest, B.; Alenyorege, E.A.; Dai, C.; Hongyang, T.; Xiaorui, Z.; Wang, P. Multi-sensor integration approach based on hyperspectral imaging and electronic nose for quantitation of fat and peroxide value of pork meat. Anal. Bioanal. Chem. 2020, 412, 1169–1179. [Google Scholar] [CrossRef]


| Advantages | Disadvantages |
|---|---|
| Vibrational Spectroscopy | |
|
|
|
|
|
|
| Raman Spectroscopy | |
|
|
|
|
| Colour Imaging | |
|
|
|
|
|
|
| Hyperspectral Imaging | |
|
|
|
|
|
|
| X-ray Imaging and Computed Tomography | |
|
|
| Technique | Principle | Features | Application | Chemometric Techniques | R2 value | Reference |
|---|---|---|---|---|---|---|
| MIR spectroscopy | Spectral differences | Spectral features | Detection of offal adulterants in minced beef | PCA *; PLSR; CVA; SIMCA | 92–100% ** | Al-Jowder, et al. [55] |
| NIR and MIR spectroscopy | Detection of minced beef adulteration with turkey meat | PCA *; LDA; PLSR | 81–99% ** | Alamprese, et al. [103] | ||
| NIR spectroscopy | Detection and quantification of different adulterants in minced beef | PCA *; PLSR; LDA; PLS–DA | 0.94–0.96; 100% ** | Morsy and Sun [34] | ||
| Vis–NIR spectroscopy | Detection of plant and animal proteins as adulterants in minced beef and pork | PCA *; LDA; PLSR | 69–100% **; 0.78–0.86 | Rady and Adedeji [35] | ||
| Portable handheld NIR spectroscopy | Authentication of Iberian pork carcasses | PCA *; PLS–DA | 93.9% **; 96.4% **; 60.6% ** | Zamora-Rojas, et al. [104] | ||
| Portable handheld NIR spectroscopy | Classification of ‘premium’ and ‘non-premium’ Iberian hams | PCA *; LDA; QDA, NPB | 1.5–2.5% error; 98% ** | Piotrowski, et al. [105] | ||
| Portable handheld NIR spectroscopy | Classification of ‘premium’ and ‘non-premium’ Iberian pigs | PCA *; LDA; QDA; Kernel Bayes; Logistic regression | 93.5% ** | Pérez-Marín, et al. [106] | ||
| Raman spectroscopy | Provides structural fingerprints by which molecules and compounds can be identified | Spectral features | Discrimination of beef and horsemeat | PCA | 100% ** | Boyacı, et al. [69] |
| Adulterant detection and quantification in beef burgers | PCA *; PLS–DA; SIMCA | 89–100% ** | Zhao, et al. [70] | |||
| MID–FTIR spectroscopy | Fourier transform algorithm turns raw data into an optical spectrum | Spectral features | Detection of adulterants in minced beef | PCA *; PLSR; SIMCA | 0.99; 100% ** | Meza-Márquez, et al. [8] |
| FT–NIR spectroscopy | Detection of pork adulteration in veal product | PCA *; SVM | Schmutzler, et al. [59] | |||
| Detection of minced beef adulterated with turkey meat | PCA *; PLSR; PLS–DA | >0.88; 100% ** | Alamprese, et al. [9] | |||
| Colour imaging | Colour variation (red, green, blue) | Hue, saturation, intensity, RGB histograms, chromaticity, coordinates, textural features | Identification and quantification of fat content adulteration in chicken burgers | PCA *; PLSR; PLS–DA; SPA–LDA | 0.95; 96% ** | de Sousa Fernandes, et al. [78] |
| Differentiate and quantify ground chicken adulteration with pork and beef | PCA *; LDA; PLSR; | 100% **; 0.82 (pork); 0.86 (beef) | Nolasco-Perez, et al. [37] | |||
| Hyperspectral imaging | Spectral and spatial differences | Spectral features and image pixels | Classification of pork, beef, and lamb | PCA *; PLS–DA | 98.7% ** | Kamruzzaman, et al. [33] |
| Detect and quantify the adulteration level in minced lamb | PCA *; PLSR; MLR | 0.99; 0.98 | Kamruzzaman, et al. [89] | |||
| Horsemeat adulteration detection in minced beef | PCA *; PLSR | 0.98 | Kamruzzaman, et al. [38] | |||
| Detection of duck adulteration in minced lamb | PCA *; PLSR | 0.98 | Zheng, et al. [39] | |||
| Detection of minced pork adulterated with pork jowl meat | PCA *; PLSR; 2D-COS–PLSR; PC-loadings–PLSR; RC–PLSR | 0.96; 0.27; 0.74; 0.91 | Jiang, et al. [90] | |||
| X-ray imaging and computed tomography | Absorption and scattering of X-ray beams | Mean grey value, grey level histogram, porosity, textural features | Detection of mechanically separated meat (MSM) in meat products | Pospiech, et al. [40] |
Publisher’s Note: MDPI stays neutral with regard to jurisdictional claims in published maps and institutional affiliations. |
© 2021 by the authors. Licensee MDPI, Basel, Switzerland. This article is an open access article distributed under the terms and conditions of the Creative Commons Attribution (CC BY) license (http://creativecommons.org/licenses/by/4.0/).
Share and Cite
Edwards, K.; Manley, M.; Hoffman, L.C.; Williams, P.J. Non-Destructive Spectroscopic and Imaging Techniques for the Detection of Processed Meat Fraud. Foods 2021, 10, 448. https://doi.org/10.3390/foods10020448
Edwards K, Manley M, Hoffman LC, Williams PJ. Non-Destructive Spectroscopic and Imaging Techniques for the Detection of Processed Meat Fraud. Foods. 2021; 10(2):448. https://doi.org/10.3390/foods10020448
Chicago/Turabian StyleEdwards, Kiah, Marena Manley, Louwrens C. Hoffman, and Paul J. Williams. 2021. "Non-Destructive Spectroscopic and Imaging Techniques for the Detection of Processed Meat Fraud" Foods 10, no. 2: 448. https://doi.org/10.3390/foods10020448
APA StyleEdwards, K., Manley, M., Hoffman, L. C., & Williams, P. J. (2021). Non-Destructive Spectroscopic and Imaging Techniques for the Detection of Processed Meat Fraud. Foods, 10(2), 448. https://doi.org/10.3390/foods10020448