
Design, Synthesis, and Characterization of Tracers and Development of a Fluorescence Polarization Immunoassay for Rapid Screening of 4,4′-Dinitrocarbanilide in Chicken Muscle

Abstract
:1. Introduction
2. Materials and Methods
2.1. Reagents and Equipments
2.2. Preparation of FITC-DNC Tracers
2.3. FPIA Procedure
2.4. Curve Fitting and Statistical Analysis
2.5. FPIA Development and Optimization
2.6. Chicken Sample Analysis for FPIA
3. Results and Discussion
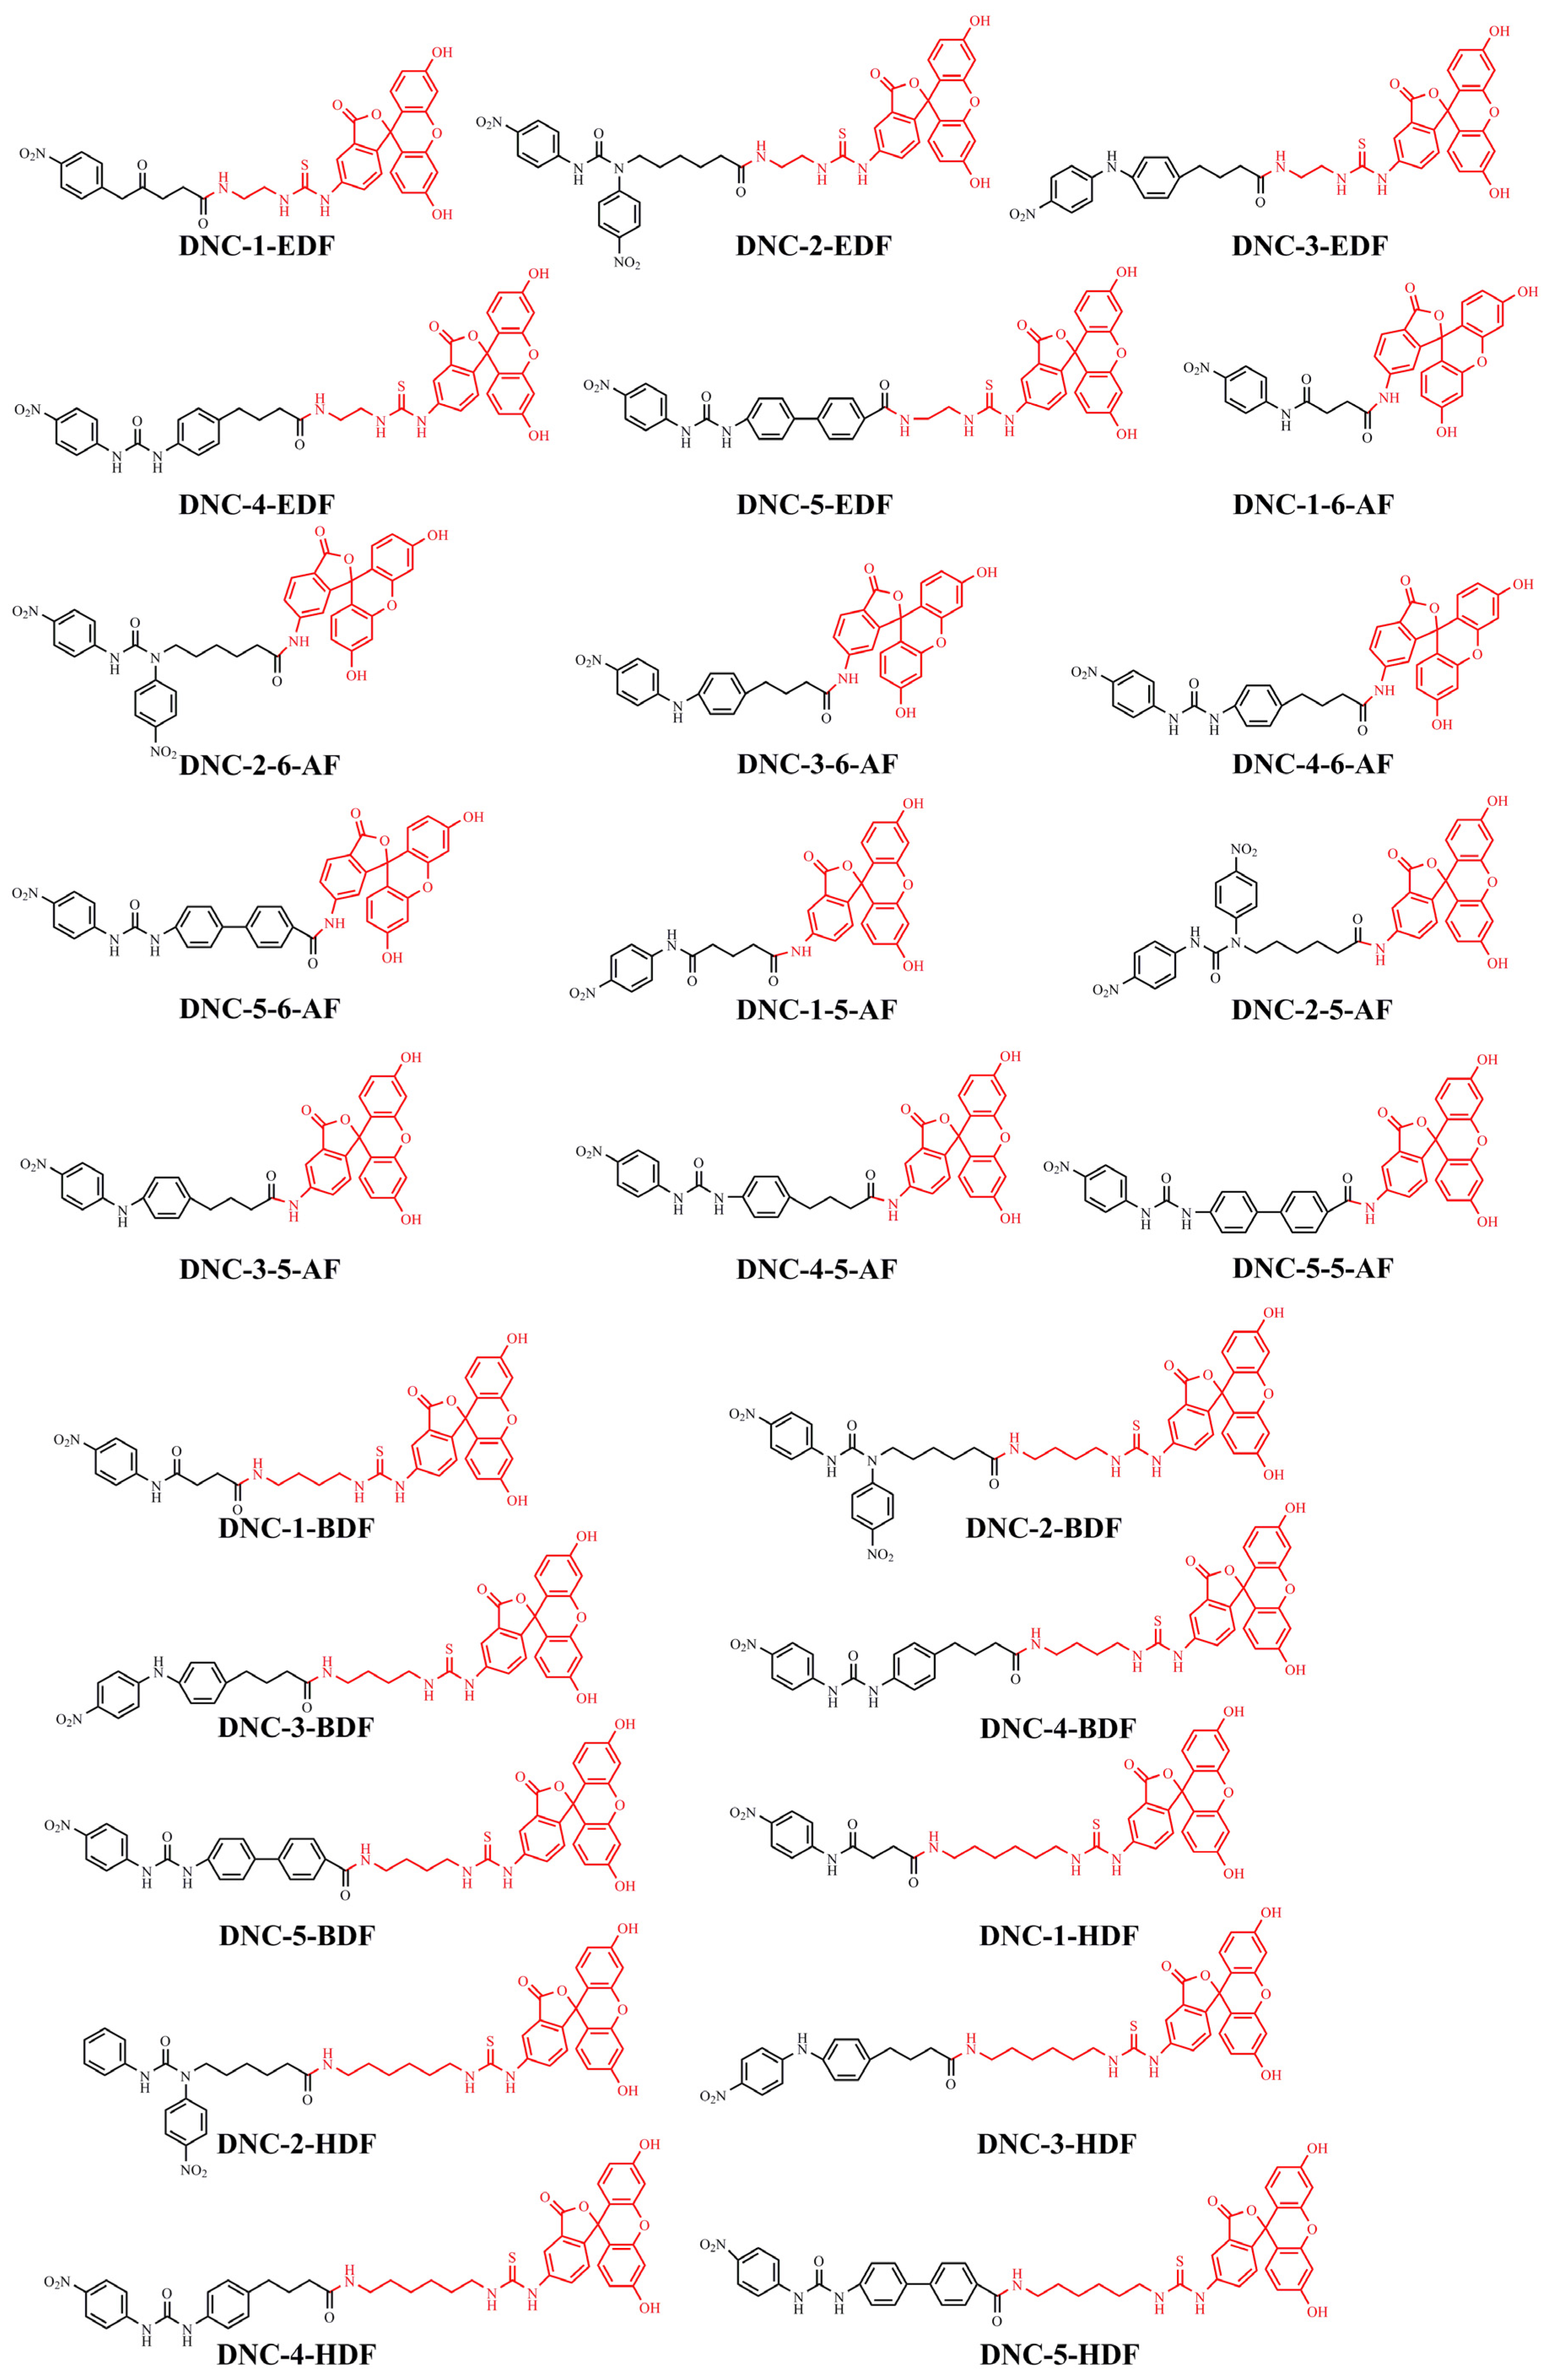
3.1. Synthesis and Characterization of FITC-DNC Tracers
3.2. FPIA Development and Optimization
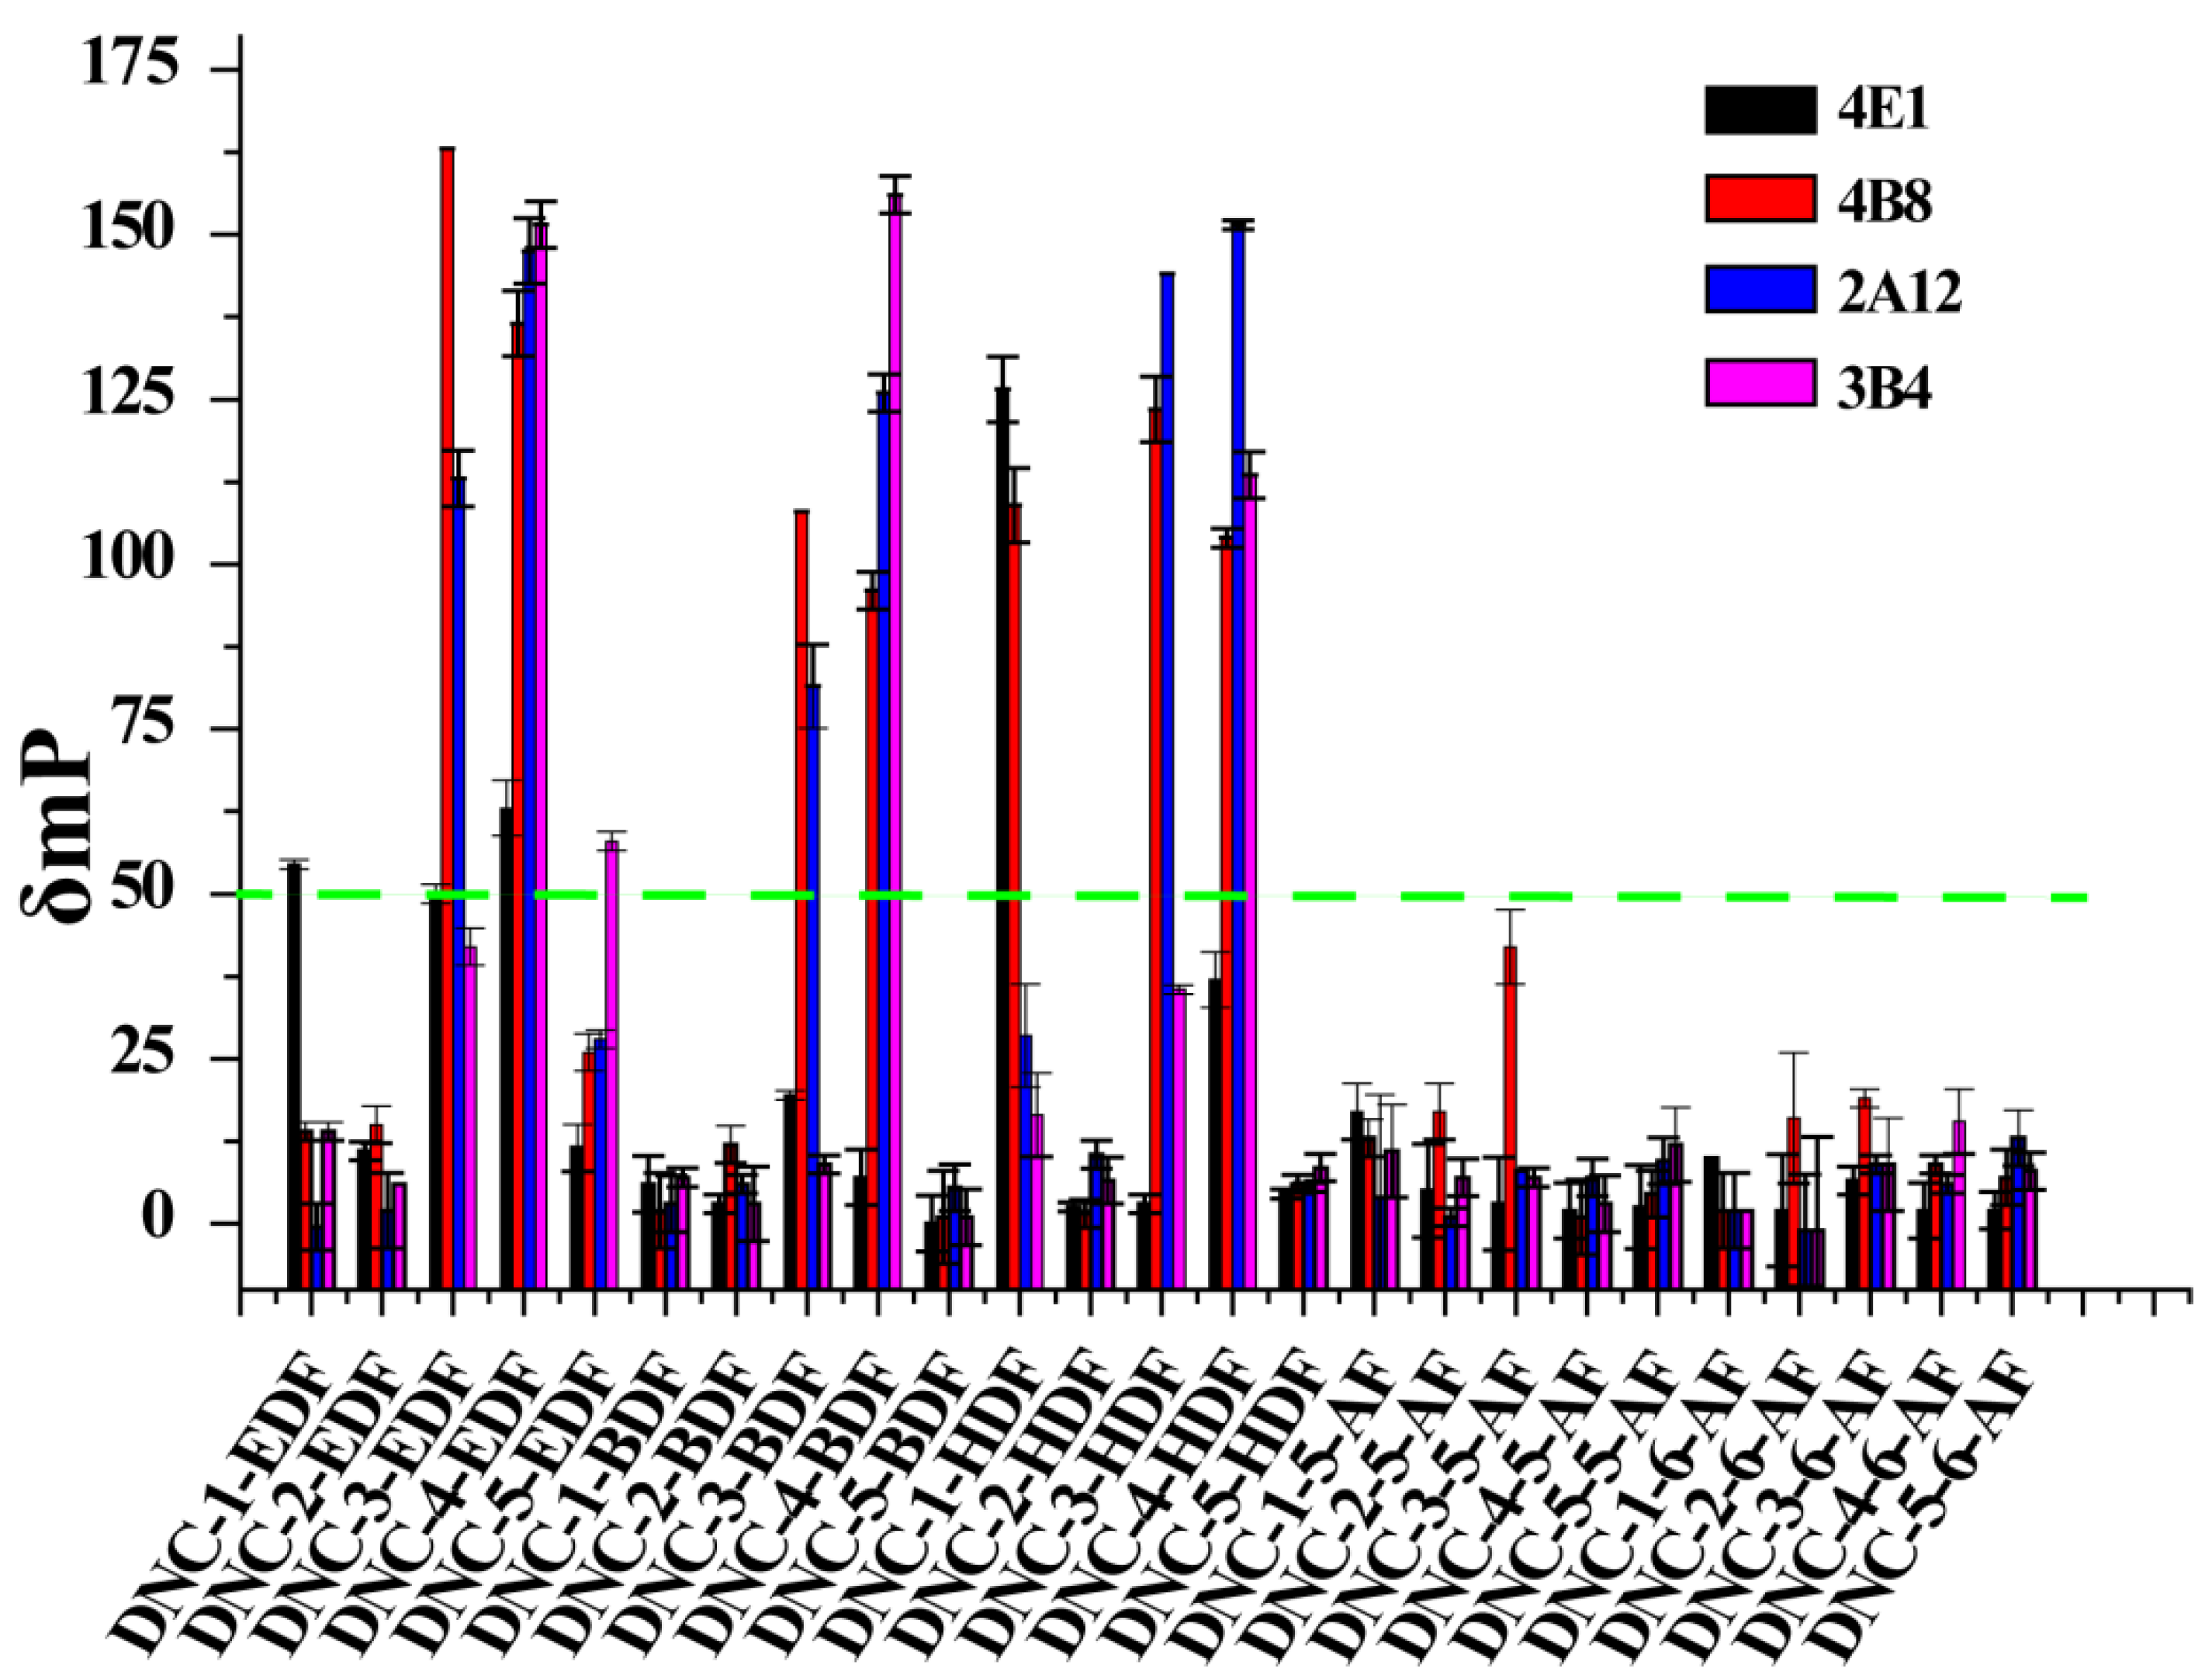
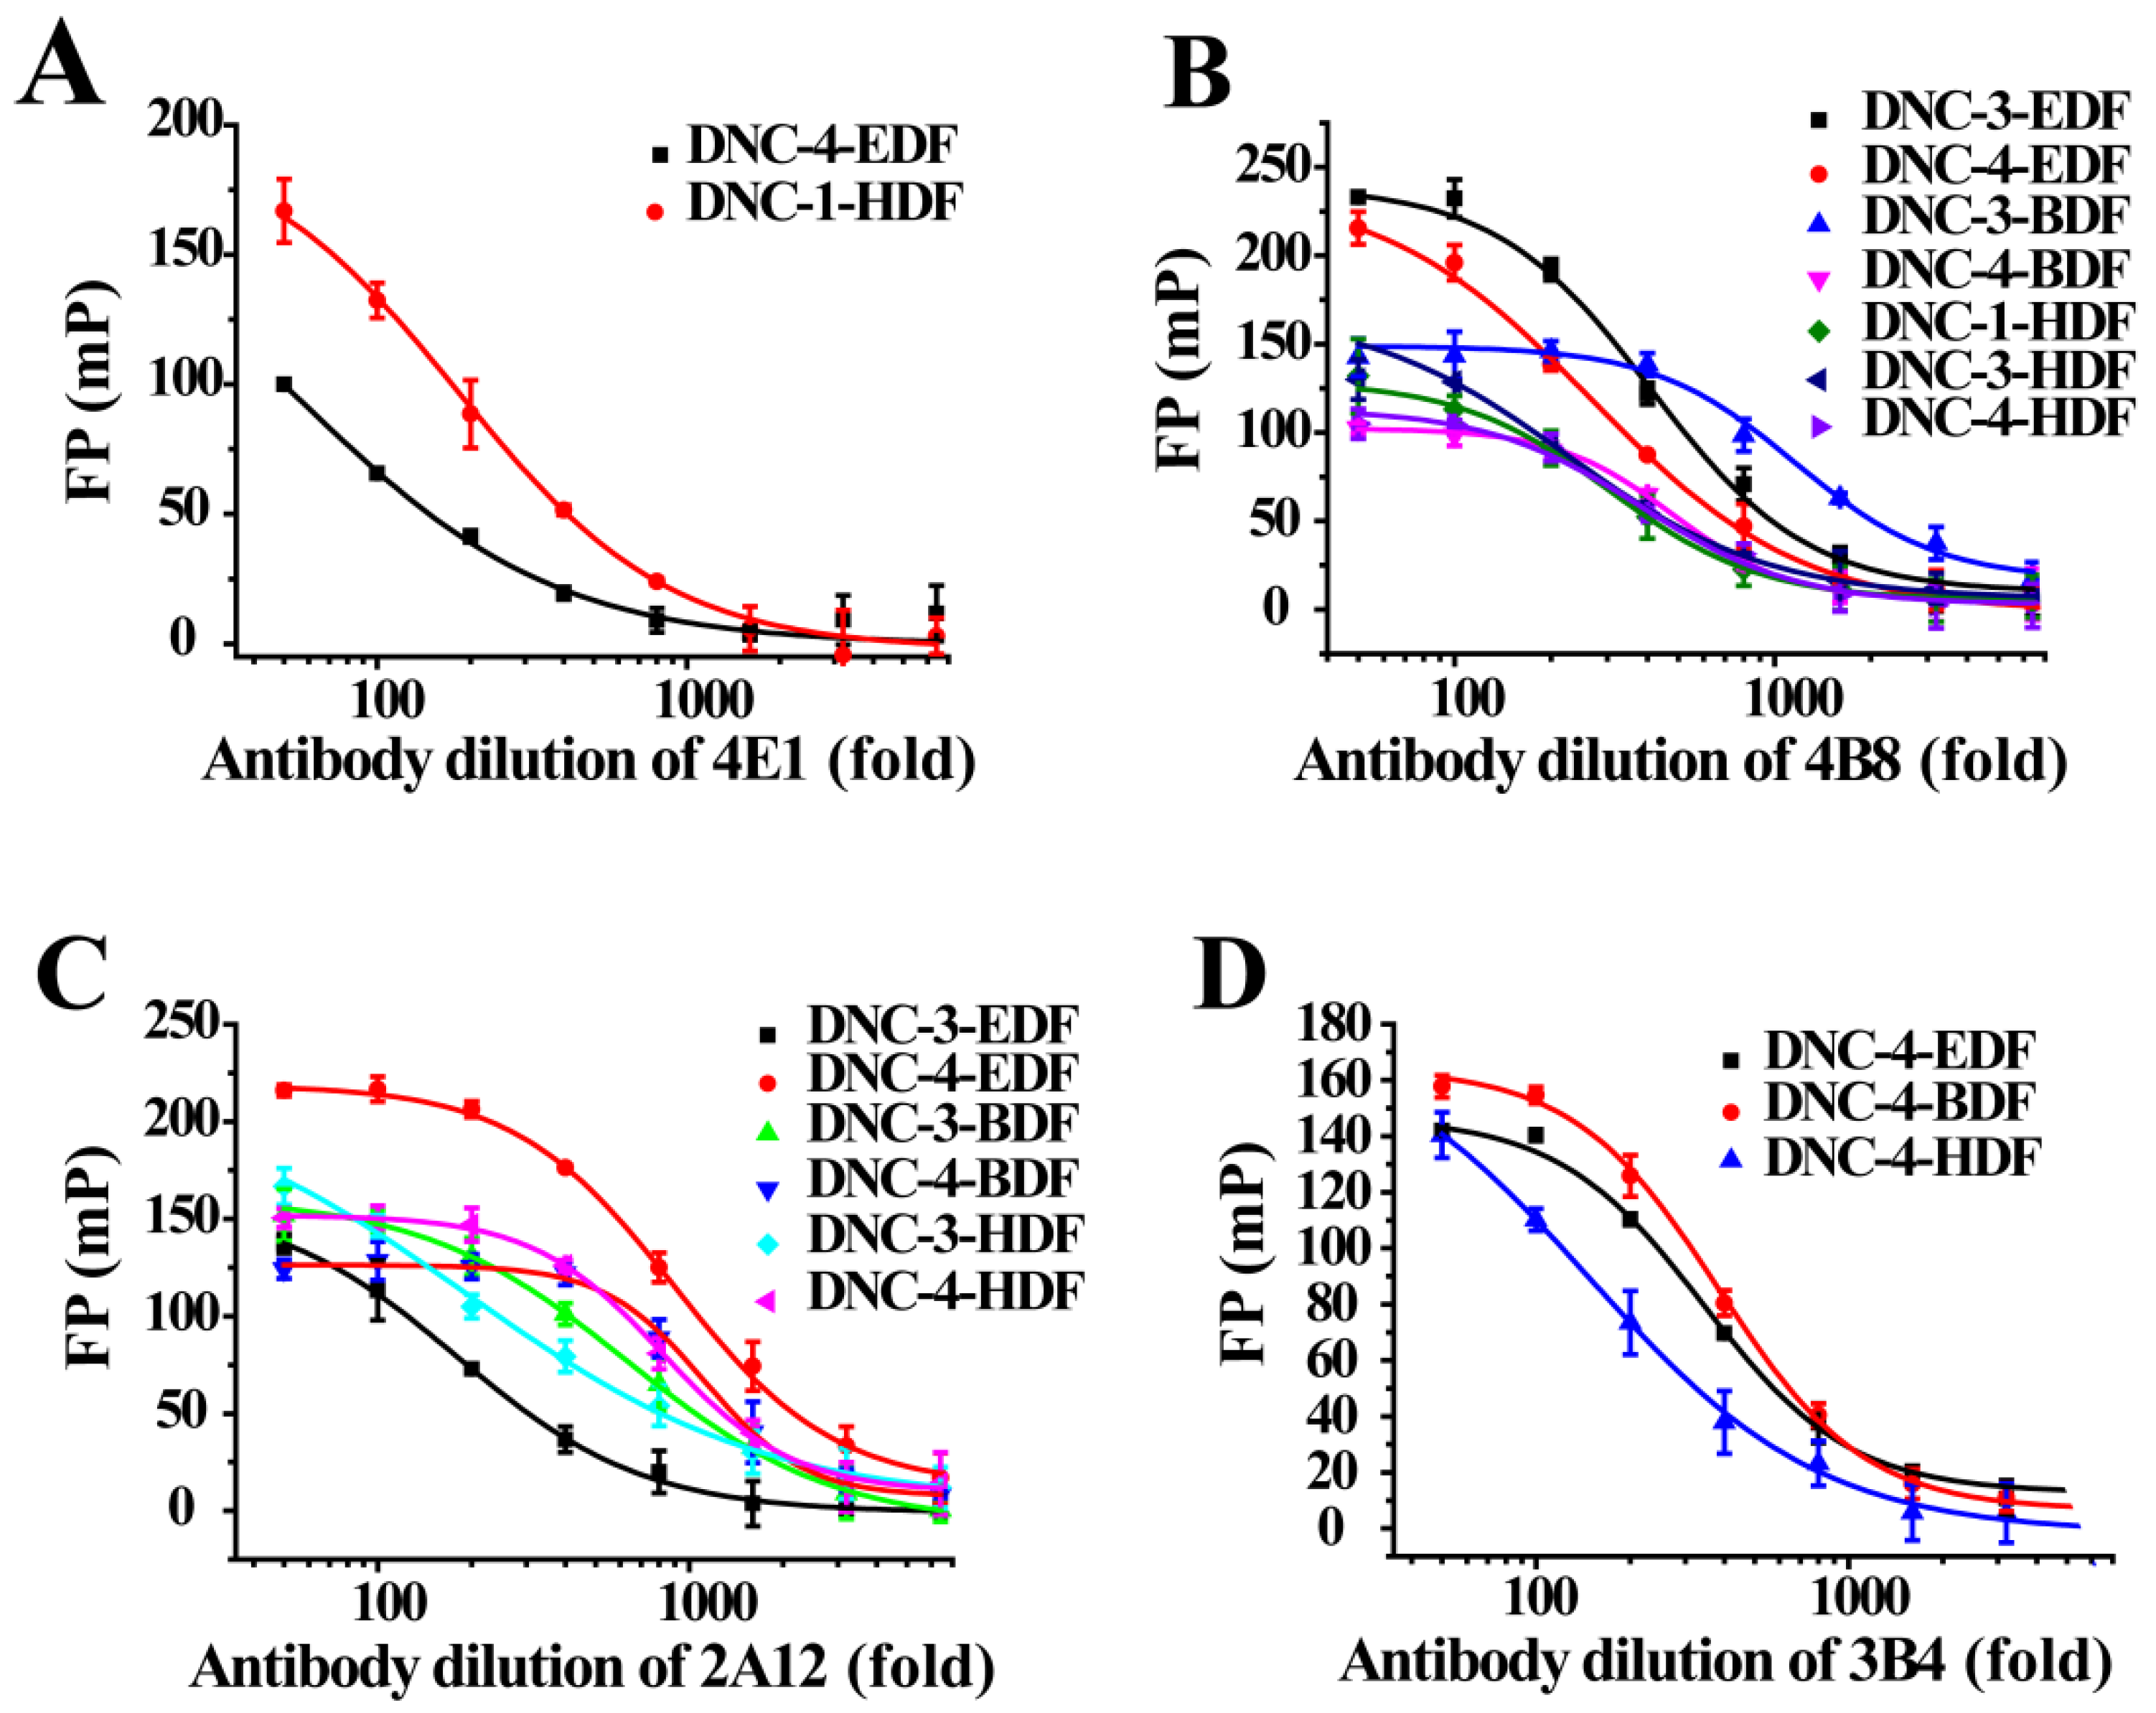
3.2.1. Selection of Antibody—Tracer Pairs
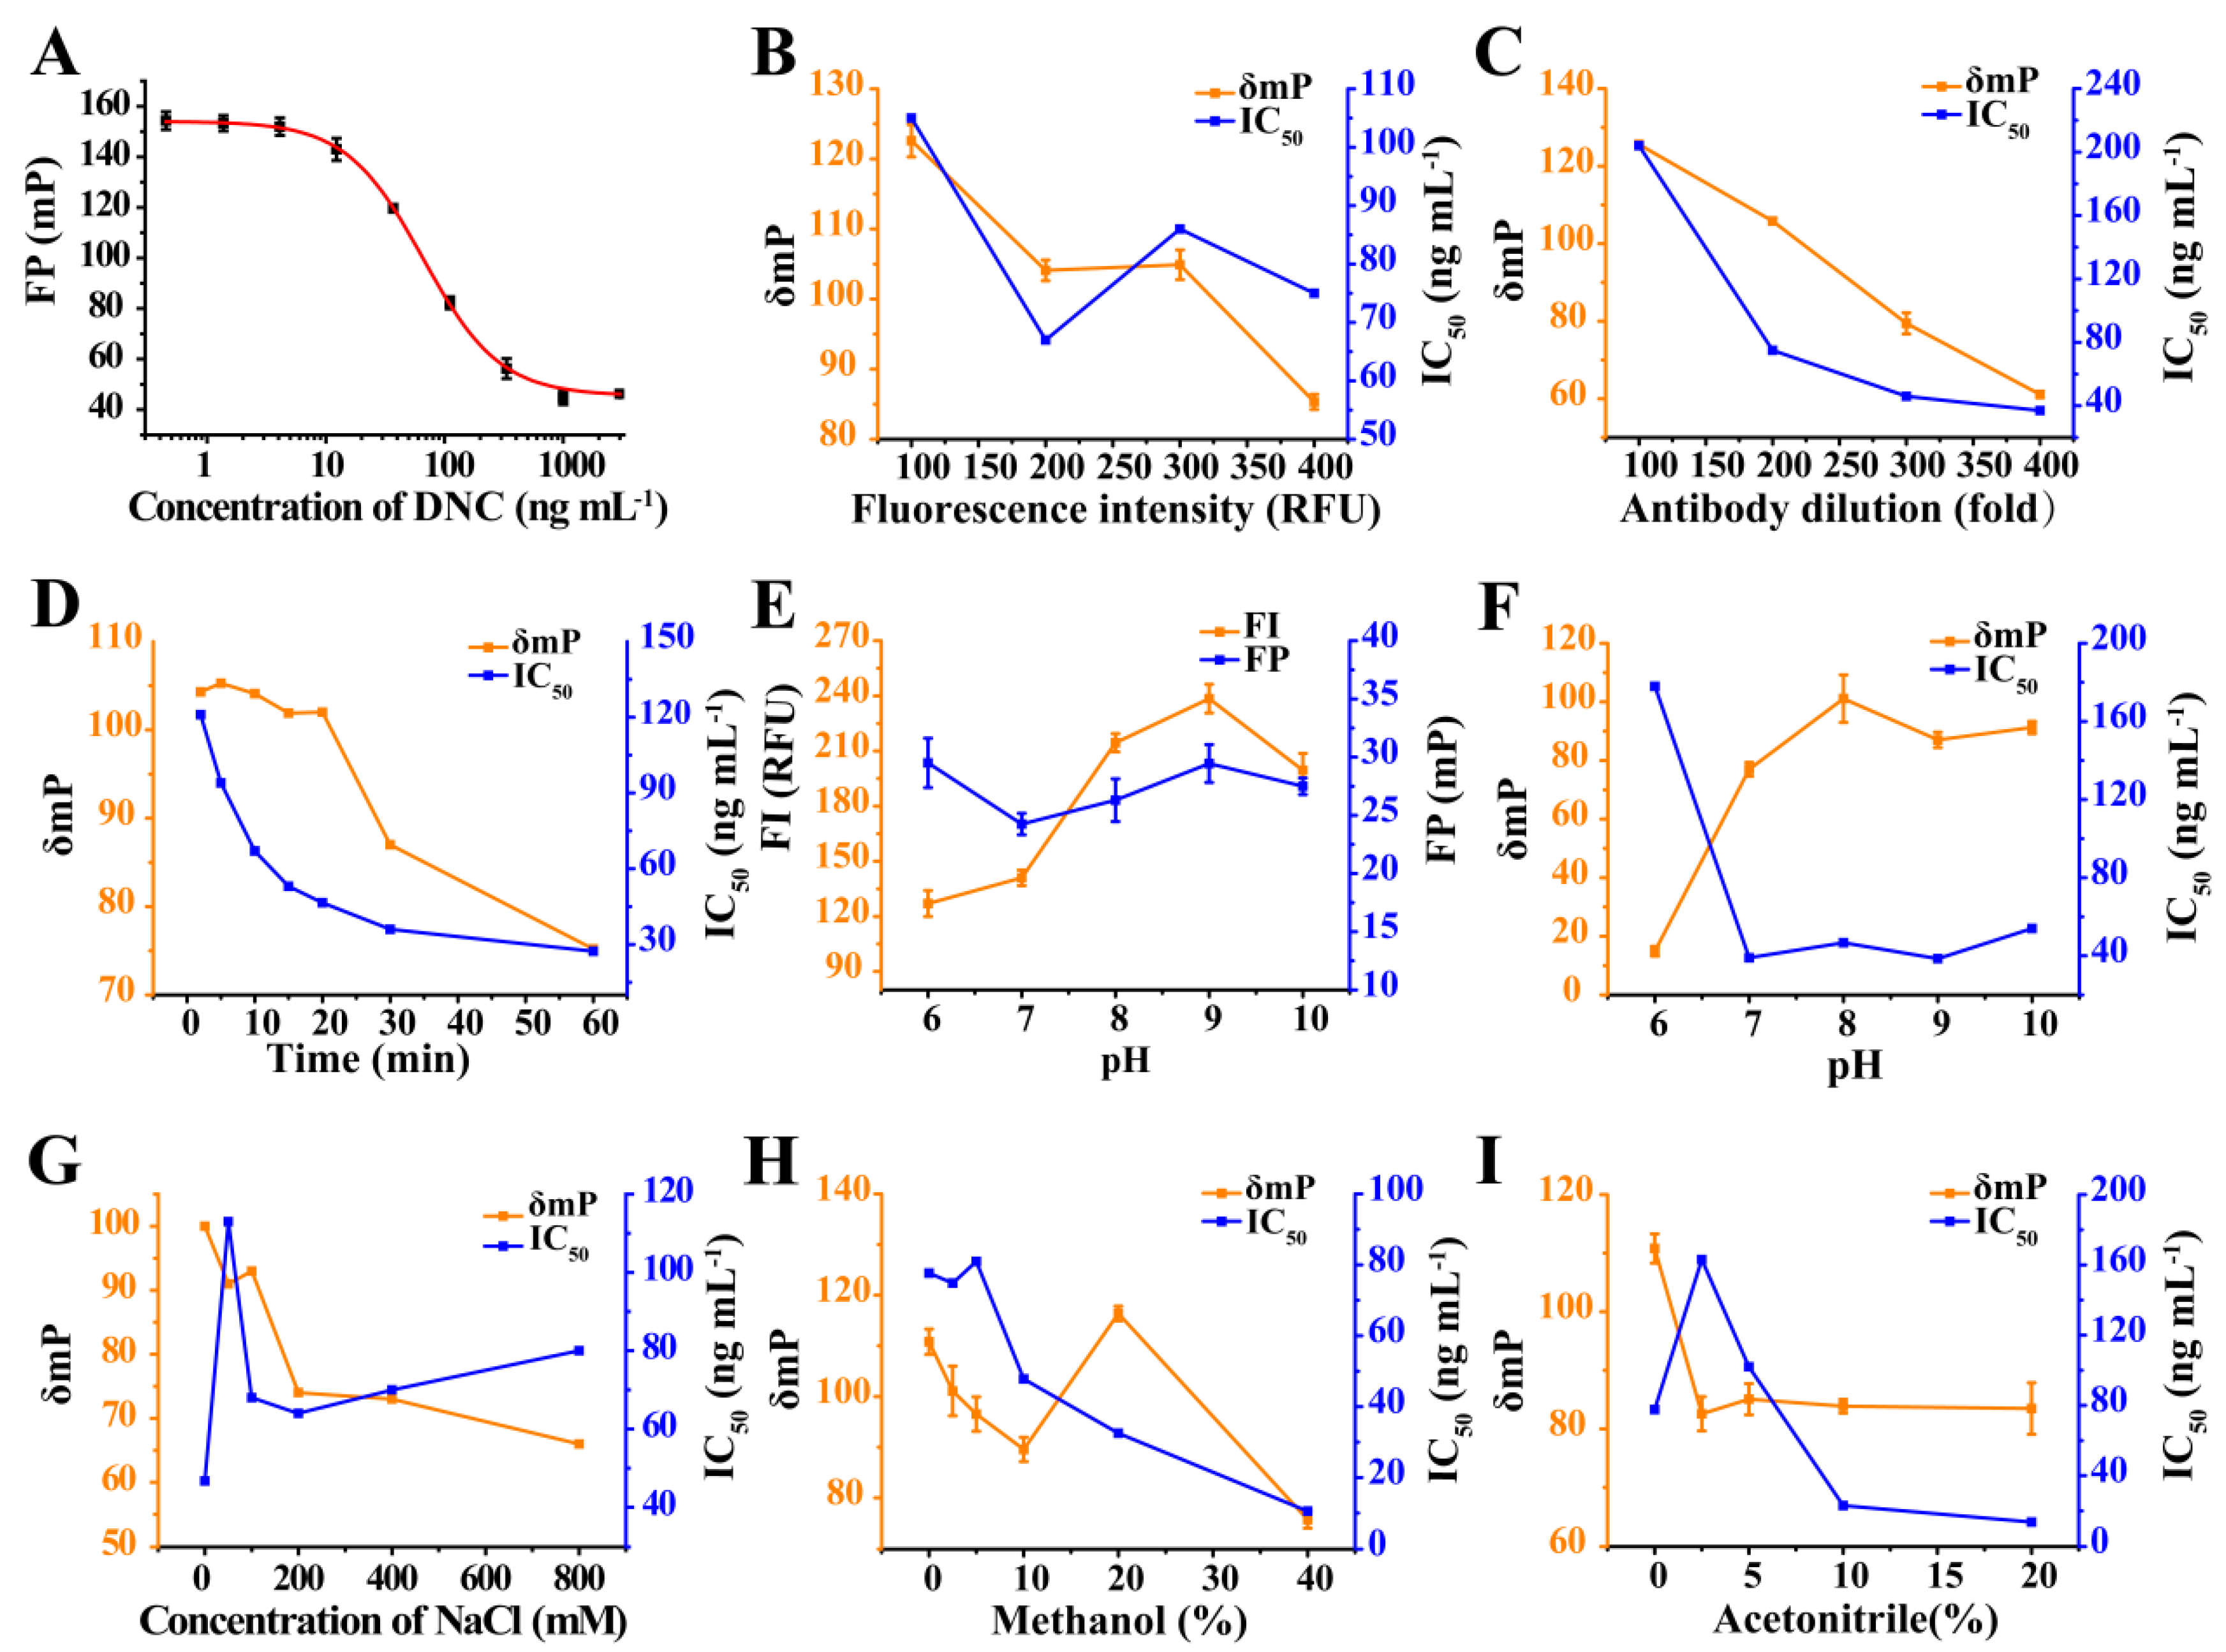
3.2.2. Optimization of Tracer and mAb Concentrations
3.2.3. Optimization of Incubation Time
3.2.4. Optimization of Physicochemical Conditions
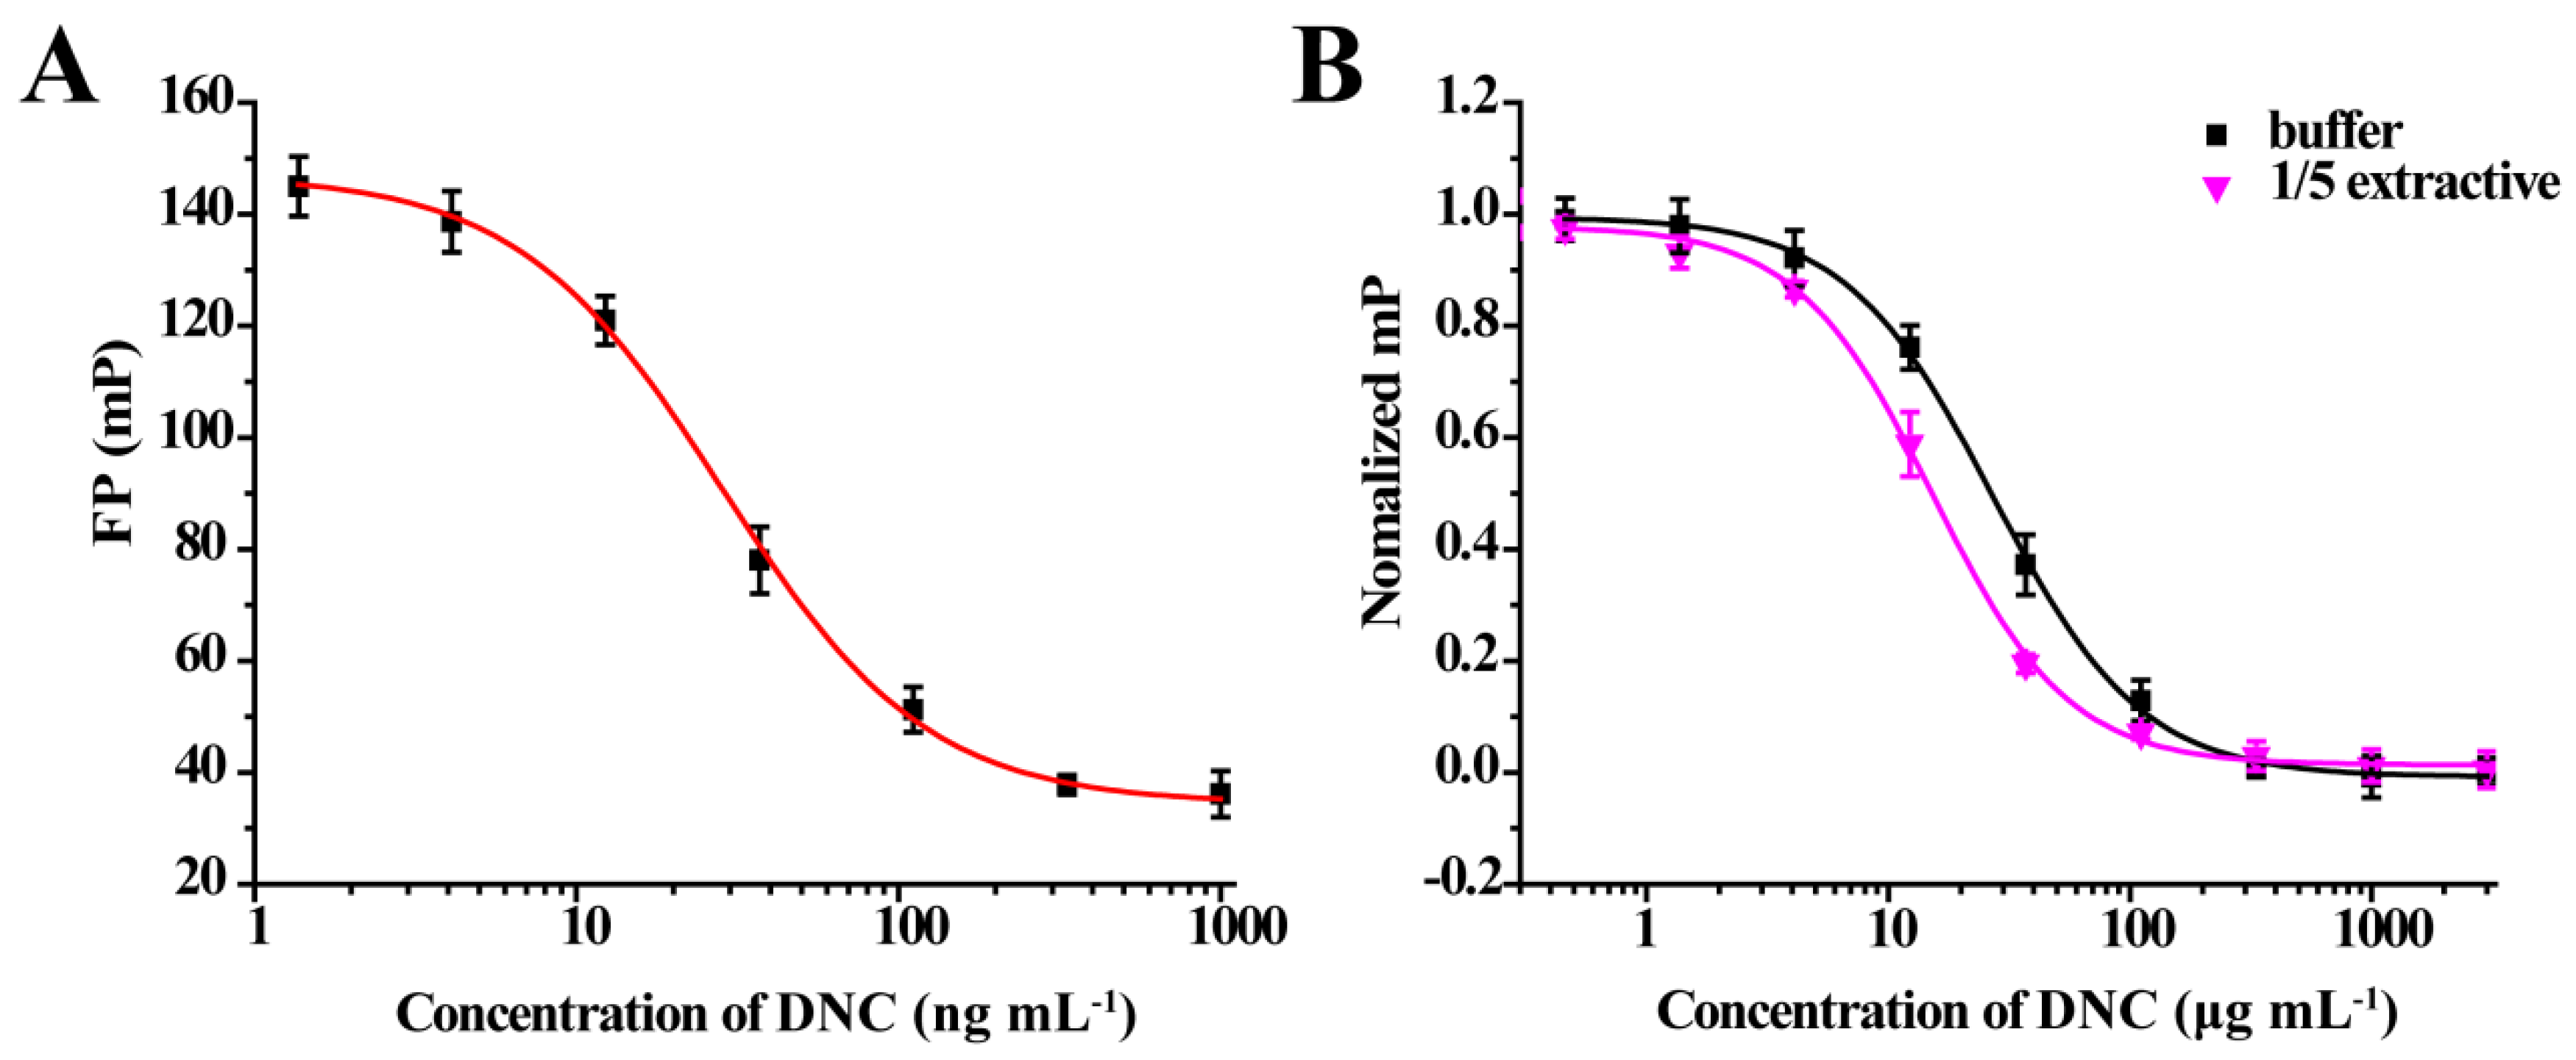
3.3. Sensitivity and Cross-Reactivity of FPIA
3.4. Chicken Sample Analysis for FPIA
4. Conclusions
Supplementary Materials
Author Contributions
Funding
Institutional Review Board Statement
Informed Consent Statement
Data Availability Statement
Conflicts of Interest
Ethical Approval
References
- Beier, R.C.; Ripley, L.H.; Young, C.R.; Kaiser, C.M. Production, Characterization, and Cross-Reactivity Studies of Monoclonal Antibodies against the Coccidiostat Nicarbazin. J. Agric. Food Chem. 2001, 49, 4542–4552. [Google Scholar] [CrossRef]
- Clarke, L.; Fodey, T.L.; Crooks, S.R.; Moloney, M.; O’Mahony, J.; Delahaut, P.; O’Kennedy, R.; Danaher, M. A review of coccidiostats and the analysis of their residues in meat and other food. Meat Sci. 2014, 97, 358–374. [Google Scholar] [CrossRef]
- Protasiuk, E.; Olejnik, M.; Szprengier–Juszkiewicz, T.; Jedziniak, P.; Zmudzki, J. Determination of Nicarbazin in Animal Feed by High-Performance Liquid Chromatography with Interlaboratory Evaluation. Anal. Lett. 2015, 48, 2183–2194. [Google Scholar] [CrossRef]
- Bacila, D.M.; Feddern, V.; Mafra, L.I.; Scheuermann, G.N.; Molognoni, L.; Daguer, H. Current research, regulation, risk, analytical methods and monitoring results for nicarbazin in chicken meat: A perspective review. Food Res. Int. 2017, 99, 31–40. [Google Scholar] [CrossRef] [Green Version]
- Bacila, D.M.; Lazzarotto, M.; Hansel, F.A.; Scheuermann, G.N.; Feddern, V.; Cunha Junior, A.; Igarashi-Mafra, L. Thermal profile of 4,4′-dinitrocarbanilide determined by thermogravimetry–differential scanning calorimetry–mass spectrometry (TG–DSC–MS) and pyrolysis–gas chromatography–mass spectrometry (Py–GC–MS). J. Therm. Anal. Calorim. 2019, 138, 697–701. [Google Scholar] [CrossRef]
- Tarbin, J.A.; Bygrave, J.; Bigwood, T.; Hardy, D.; Rose, M.; Sharman, M. The effect of cooking on veterinary drug residues in food: Nicarbazin (dinitrocarbanilide component). Food Addit. Contam. 2005, 22, 1126–1131. [Google Scholar] [CrossRef] [PubMed]
- Capurro, E.; Danaher, M.; Anastasio, A.; Cortesi, M.L.; O’Keeffe, M. Efficient HPLC method for the determination of nicarbazin, as dinitrocarbanilide in broiler liver. J. Chromatogr. B 2005, 822, 154–159. [Google Scholar] [CrossRef]
- Mortier, L.; Daeseleire, E.; Van Peteghem, C. Liquid chromatographic tandem mass spectrometric determination of five coccidiostats in poultry eggs and feed. J. Chromatogr. B 2005, 820, 261–270. [Google Scholar] [CrossRef] [PubMed]
- Teglia, C.M.; Gonzalo, L.; Culzoni, M.J.; Goicoechea, H.C. Determination of six veterinary pharmaceuticals in egg by liquid chromatography: Chemometric optimization of a novel air assisted-dispersive liquid-liquid microextraction by solid floating organic drop. Food Chem. 2019, 273, 194–202. [Google Scholar] [CrossRef] [PubMed]
- Barreto, F.; Ribeiro, C.; Hoff, R.B.; Costa, T.D. A simple and high-throughput method for determination and confirmation of 14 coccidiostats in poultry muscle and eggs using liquid chromatography–quadrupole linear ion trap-tandem mass spectrometry (HPLC–QqLIT-MS/MS): Validation according to European Union 2002/657/EC. Talanta 2017, 168, 43–51. [Google Scholar]
- Bacila, D.; Cunha, A., Jr.; Gressler, V.; Scheuermann, G.; Coldebella, A.; Caron, L.; Mafra, L.; Feddern, V. Detection of p-Nitroaniline Released from Degradation of 4,4′-Dinitrocarbanilide in Chicken Breast during Thermal Processing. J. Agric. Food Chem. 2019, 67, 9002–9008. [Google Scholar] [CrossRef]
- de Lima, A.L.; Barreto, F.; Rau, R.B.; da Silva, G.R.; Lara, L.J.C.; de Figueiredo, T.C.; de Assis, D.C.S.; de Vasconcelos Cançado, S. Determination of the residue levels of nicarbazin and combination nicarbazin-narasin in broiler chickens after oral administration. PLoS ONE 2017, 12, e0181755. [Google Scholar]
- Moretti, S.; Fioroni, L.; Giusepponi, D.; Pettinacci, L.; Saluti, G.; Galarini, R. Development and validation of a multiresidue liquid chromatography/tandem mass spectrometry method for 11 coccidiostats in feed. J. AOAC Int. 2013, 96, 1245–1257. [Google Scholar] [CrossRef]
- Connolly, L.; Fodey, T.L.; Crooks, S.R.H.; Delahaut, P.; Elliott, C.T. The production and characterisation of dinitrocarbanilide antibodies raised using antigen mimics. J. Immunol. Methods 2002, 264, 45–51. [Google Scholar] [CrossRef] [Green Version]
- Huet, A.C.; Mortier, L.; Daeseleire, E.; Fodey, T.; Elliott, C.; Delahaut, P. Screening for the coccidiostats halofuginone and nicarbazin in egg and chicken muscle: Development of an ELISA. Food Addit. Contam. 2005, 22, 128–134. [Google Scholar] [CrossRef] [PubMed]
- Mi, T.; Wang, Z.; Eremin, S.A.; Shen, J.; Zhang, S. Simultaneous Determination of Multiple (Fluoro) quinolone Antibiotics in Food Samples by a One-Step Fluorescence Polarization Immunoassay. J. Agric. Food Chem. 2013, 61, 9347–9355. [Google Scholar] [CrossRef] [PubMed]
- Wang, Z.; Liang, X.; Wen, K.; Zhang, S.; Li, C.; Shen, J. A highly sensitive and class-specific fluorescence polarisation assay for sulphonamides based on dihydropteroate synthase. Biosens. Bioelectron. 2015, 70, 1–4. [Google Scholar] [CrossRef]
- Gasilova, N.V.; Eremin, S.A. Determination of chloramphenicol in milk by a fluorescence polarization immunoassay. J. Anal. Chem. 2010, 65, 255–259. [Google Scholar] [CrossRef]
- Dong, B.; Zhao, S.; Li, H.; Wen, K.; Ke, Y.; Shen, J.; Zhang, S.; Shi, W.; Wang, Z. Design, synthesis and characterization of tracers and development of a fluorescence polarization immunoassay for the rapid detection of ractopamine in pork. Food Chem. 2019, 271, 9–17. [Google Scholar] [CrossRef] [PubMed]
- Ma, M.; Chen, M.; Feng, L.; You, H.; Yang, R.; Boroduleva, A.; Hua, X.; Eremin, S.A.; Wang, M. Fluorescence Polarization Immunoassay for Highly Efficient Detection of Imidaclothiz in Agricultural Samples. Food Anal. Methods 2016, 9, 2471–2478. [Google Scholar] [CrossRef]
- Li, C.; Wen, K.; Mi, T.; Zhang, X.; Zhang, H.; Zhang, S.; Shen, J.; Wang, Z. A universal multi-wavelength fluorescence polarization immunoassay for multiplexed detection of mycotoxins in maize. Biosens. Bioelectron. 2016, 79, 258–265. [Google Scholar] [CrossRef]
- Raysyan, A.; Moerer, R.; Coesfeld, B.; Eremin, S.A.; Schneider, R.J. Fluorescence polarization immunoassay for the determination of diclofenac in wastewater. Anal. Bioanal. Chem. 2021, 413, 999–1007. [Google Scholar] [CrossRef]
- Qianqian Tang, Z.W. Production of Monoclonal Antibodies and Development of an Enzyme-Linked Immunosobent Assay for Nicarbazin; College of Veterinary Medicine, China Agricultural University: Beijing, China, 2018. [Google Scholar]
- Mi, T.; Liang, X.; Ding, L.; Zhang, S.; Eremin, S.A.; Beier, R.C.; Shen, J.; Wang, Z. Development and optimization of a fluorescence polarization immunoassay for orbifloxacin in milk. Anal. Methods 2014, 6, 3849–3857. [Google Scholar] [CrossRef]
- Li, H.; Ma, S.; Zhang, X.; Li, C.; Dong, B.; Mujtaba, M.G.; Wei, Y.; Liang, X.; Yu, X.; Wen, K.; et al. Generic Hapten Synthesis, Broad-Specificity Monoclonal Antibodies Preparation, and Ultrasensitive ELISA for Five Antibacterial Synergists in Chicken and Milk. J. Agric. Food Chem. 2018, 66, 11170–11179. [Google Scholar] [CrossRef] [PubMed]
- Zhang, X.; Eremin, S.A.; Wen, K.; Yu, X.; Li, C.; Ke, Y.; Jiang, H.; Shen, J.; Wang, Z. Fluorescence Polarization Immunoassay Based on a New Monoclonal Antibody for the Detection of the Zearalenone Class of Mycotoxins in Maize. J. Agric. Food Chem. 2017, 65, 2240–2247. [Google Scholar] [CrossRef]
- Wang, Z.; Zhang, S.; Ding, S.; Eremin, S.A.; Shen, J. Simultaneous determination of sulphamerazine, sulphamethazine and sulphadiazine in honey and chicken muscle by a new monoclonal antibody-based fluorescence polarisation immunoassay. Food Addit. Contam. Part A Chem. 2008, 25, 574–582. [Google Scholar] [CrossRef] [PubMed]
- Yakovleva, J.; Zeravik, J.; Michura, I.; Formanovsky, A.; Fránek, M.; Eremin, S. Hapten Design and Development of Polarization Fluoroimmunoassay for Nonylphenol. Int. J. Environ. Anal. Chem. 2003, 83, 597–607. [Google Scholar] [CrossRef]
- Krasnova, A.I.; Eremin, S.A.; Natangelo, M.; Tavazzi, S.; Benfenati, E. A polarization fluorescence immunoassay for the herbicide propanil. Anal. Lett. 2001, 34, 2285–2301. [Google Scholar] [CrossRef]
- Chun, H.S.; Choi, E.H.; Chang, H.-J.; Choi, S.-W.; Eremin, S.A. A fluorescence polarization immunoassay for the detection of zearalenone in corn. Anal. Chim. Acta 2009, 639, 83–89. [Google Scholar] [CrossRef] [PubMed]
- Wang, Q.; Haughey, S.A.; Sun, Y.-M.; Eremin, S.A.; Li, Z.-F.; Liu, H.; Xu, Z.-L.; Shen, Y.-D.; Lei, H.-T. Development of a fluorescence polarization immunoassay for the detection of melamine in milk and milk powder. Anal. Bioanal. Chem. 2011, 399, 2275–2284. [Google Scholar] [CrossRef] [PubMed]
- McCarney, B.; Traynor, I.M.; Fodey, T.L.; Crooks, S.R.H.; Elliott, C.T. Surface plasmon resonance biosensor screening of poultry liver and eggs for nicarbazin residues. Anal. Chim. Acta 2003, 483, 165–169. [Google Scholar] [CrossRef]
- Hagren, V.; Crooks, S.R.; Elliott, C.T.; Lövgren, T.; Tuomola, M. An all-in-one dry chemistry immunoassay for the screening of coccidiostat nicarbazin in poultry eggs and liver. J. Agric. Food Chem. 2004, 52, 2429–2433. [Google Scholar]
- Campbell, K.; Fodey, T.; Flint, J.; Danks, C.; Danaher, M.; O’Keeffe, M.; Kennedy, D.G.; Elliott, C. Development and validation of a lateral flow device for the detection of nicarbazin contamination in poultry feeds. J. Agric. Food Chem. 2007, 55, 2497–2503. [Google Scholar] [CrossRef] [PubMed]

| Tracers | mAbs | Dilution Fold | IC50 (ng mL−1) | δmP | IC50/δmP | Z′ |
|---|---|---|---|---|---|---|
| DNC-3-EDF | 2A12 | 100 | 1890 | 94 | 20.11 | 0.93 |
| 4B8 | 400 | 26680 | 83.15 | 320.87 | 0.90 | |
| DNC-4-EDF | 2A12 | 1800 | 5160 | 91.58 | 56.34 | 0.88 |
| 4B8 | 500 | 263 | 96 | 2.74 | 0.87 | |
| 3B4 | 200 | 223 | 82.1 | 2.72 | 0.82 | |
| 4E1 | 50 | 7240 | 99.92 | 72.46 | 0.98 | |
| DNC-3-BDF | 2A12 | 100 | 1520 | 98.72 | 15.39 | 0.92 |
| 4B8 | 200 | 11360 | 71.45 | 158.99 | 0.94 | |
| DNC-4-BDF | 2A12 | 400 | 1814 | 82.07 | 22.10 | 0.87 |
| 4B8 | 100 | 3370 | 99 | 34.04 | 0.94 | |
| 3B4 | 200 | 66 | 107.76 | 0.61 | 0.89 | |
| DNC-1-HDF | 4B8 | 200 | 91 | 89.28 | 1.02 | 0.84 |
| 4E1 | 200 | 11600 | 75.65 | 153.33 | 0.81 | |
| DNC-3-HDF | 2A12 | 200 | 290 | 133.07 | 2.18 | 0.91 |
| 4B8 | 200 | 9960 | 68.85 | 144.66 | 0.87 | |
| DNC-4-HDF | 2A12 | 700 | 4130 | 104.6 | 39.48 | 0.97 |
| 4B8 | 200 | 4020 | 117.15 | 34.31 | 0.96 | |
| 3B4 | 100 | 2623 | 132.55 | 19.78 | 0.93 |
| Analogues | Structure | IC50 (ng mL−1) | CR (%) |
|---|---|---|---|
| DNC | 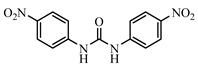 | 28.39 | 100 |
| 2-Nitroaniline |  | >30,000 | <0.1 |
| 3-Nitroaniline | 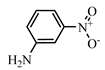 | >30,000 | <0.1 |
| N-(4-Nitrophenyl) propionamide | 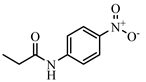 | >30,000 | <0.1 |
| H-Val-Pna HCl | 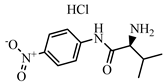 | >30,000 | <0.1 |
| L-Arginine P-Nitroanilide Dihydrochl Oride |  | >30,000 | <0.1 |
| 4-Nitrophenethylamine hydrochloride | 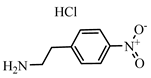 | >30,000 | <0.01 |
| N-Methyl-4-nitrophenethylamine hydrochloride | 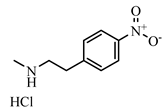 | >30,000 | <0.1 |
| H-Ala-Pna HCl | 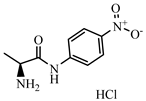 | >30,000 | <0.1 |
| N, N-Dimethyl-4-Nitroaniline | 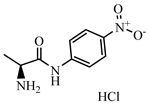 | 26,435 | 0.11 |
| H-Glu-Pna | 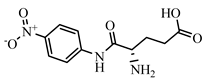 | >30,000 | <0.1 |
| Halofuginone | 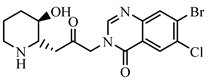 | >30,000 | <0.1 |
| Toltrazuril | 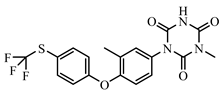 | 3190 | 0.89 |
| 1,3-Diphenylguanidine |  | >30,000 | <0.1 |
| Ronidazole | 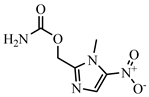 | >30,000 | <0.1 |
| Dinitolmide | 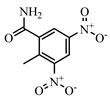 | >30,000 | <0.1 |
| Sample | Spiked (μg kg−1) | Intra-Assay (n = 5) | Inter-Assay (n = 5) | ||
|---|---|---|---|---|---|
| Recovery (%) | CV (%) | Recovery (%) | CV (%) | ||
| Chicken | 50 | 84.41 | 4.39 | 80.45 | 4.81 |
| 100 | 82.6 | 5.12 | 85.80 | 4.00 | |
| 150 | 74.23 | 8.64 | 76.95 | 6.41 | |
Publisher’s Note: MDPI stays neutral with regard to jurisdictional claims in published maps and institutional affiliations. |
© 2021 by the authors. Licensee MDPI, Basel, Switzerland. This article is an open access article distributed under the terms and conditions of the Creative Commons Attribution (CC BY) license (https://creativecommons.org/licenses/by/4.0/).
Share and Cite
Zhang, Q.; Zou, M.; Wang, W.; Li, J.; Liang, X. Design, Synthesis, and Characterization of Tracers and Development of a Fluorescence Polarization Immunoassay for Rapid Screening of 4,4′-Dinitrocarbanilide in Chicken Muscle. Foods 2021, 10, 1822. https://doi.org/10.3390/foods10081822
Zhang Q, Zou M, Wang W, Li J, Liang X. Design, Synthesis, and Characterization of Tracers and Development of a Fluorescence Polarization Immunoassay for Rapid Screening of 4,4′-Dinitrocarbanilide in Chicken Muscle. Foods. 2021; 10(8):1822. https://doi.org/10.3390/foods10081822
Chicago/Turabian StyleZhang, Qidi, Ming Zou, Wanyu Wang, Jinyan Li, and Xiao Liang. 2021. "Design, Synthesis, and Characterization of Tracers and Development of a Fluorescence Polarization Immunoassay for Rapid Screening of 4,4′-Dinitrocarbanilide in Chicken Muscle" Foods 10, no. 8: 1822. https://doi.org/10.3390/foods10081822
APA StyleZhang, Q., Zou, M., Wang, W., Li, J., & Liang, X. (2021). Design, Synthesis, and Characterization of Tracers and Development of a Fluorescence Polarization Immunoassay for Rapid Screening of 4,4′-Dinitrocarbanilide in Chicken Muscle. Foods, 10(8), 1822. https://doi.org/10.3390/foods10081822