
Fermentation as a Tool to Revitalise Brewers’ Spent Grain and Elevate Techno-Functional Properties and Nutritional Value in High Fibre Bread


Abstract
: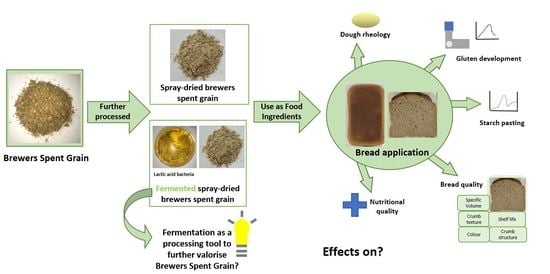
1. Introduction
2. Materials and Methods
2.1. Raw Materials
2.2. Dough Analysis
2.2.1. Water Content Adjustment
2.2.2. Gluten Aggregation Analysis
2.2.3. Starch Pasting Properties
2.2.4. Bread Dough Preparation
2.2.5. Evaluation of Bread Fermentation Quality
2.2.6. Dough Rheology
2.3. Bread Production
2.4. Bread Analysis
2.4.1. Bake Loss
2.4.2. Specific Volume
2.4.3. Crumb Structure
2.4.4. Texture
2.4.5. Colour
2.4.6. Water Activity and Microbial Shelf Life
2.4.7. In Vitro Starch Digestibility
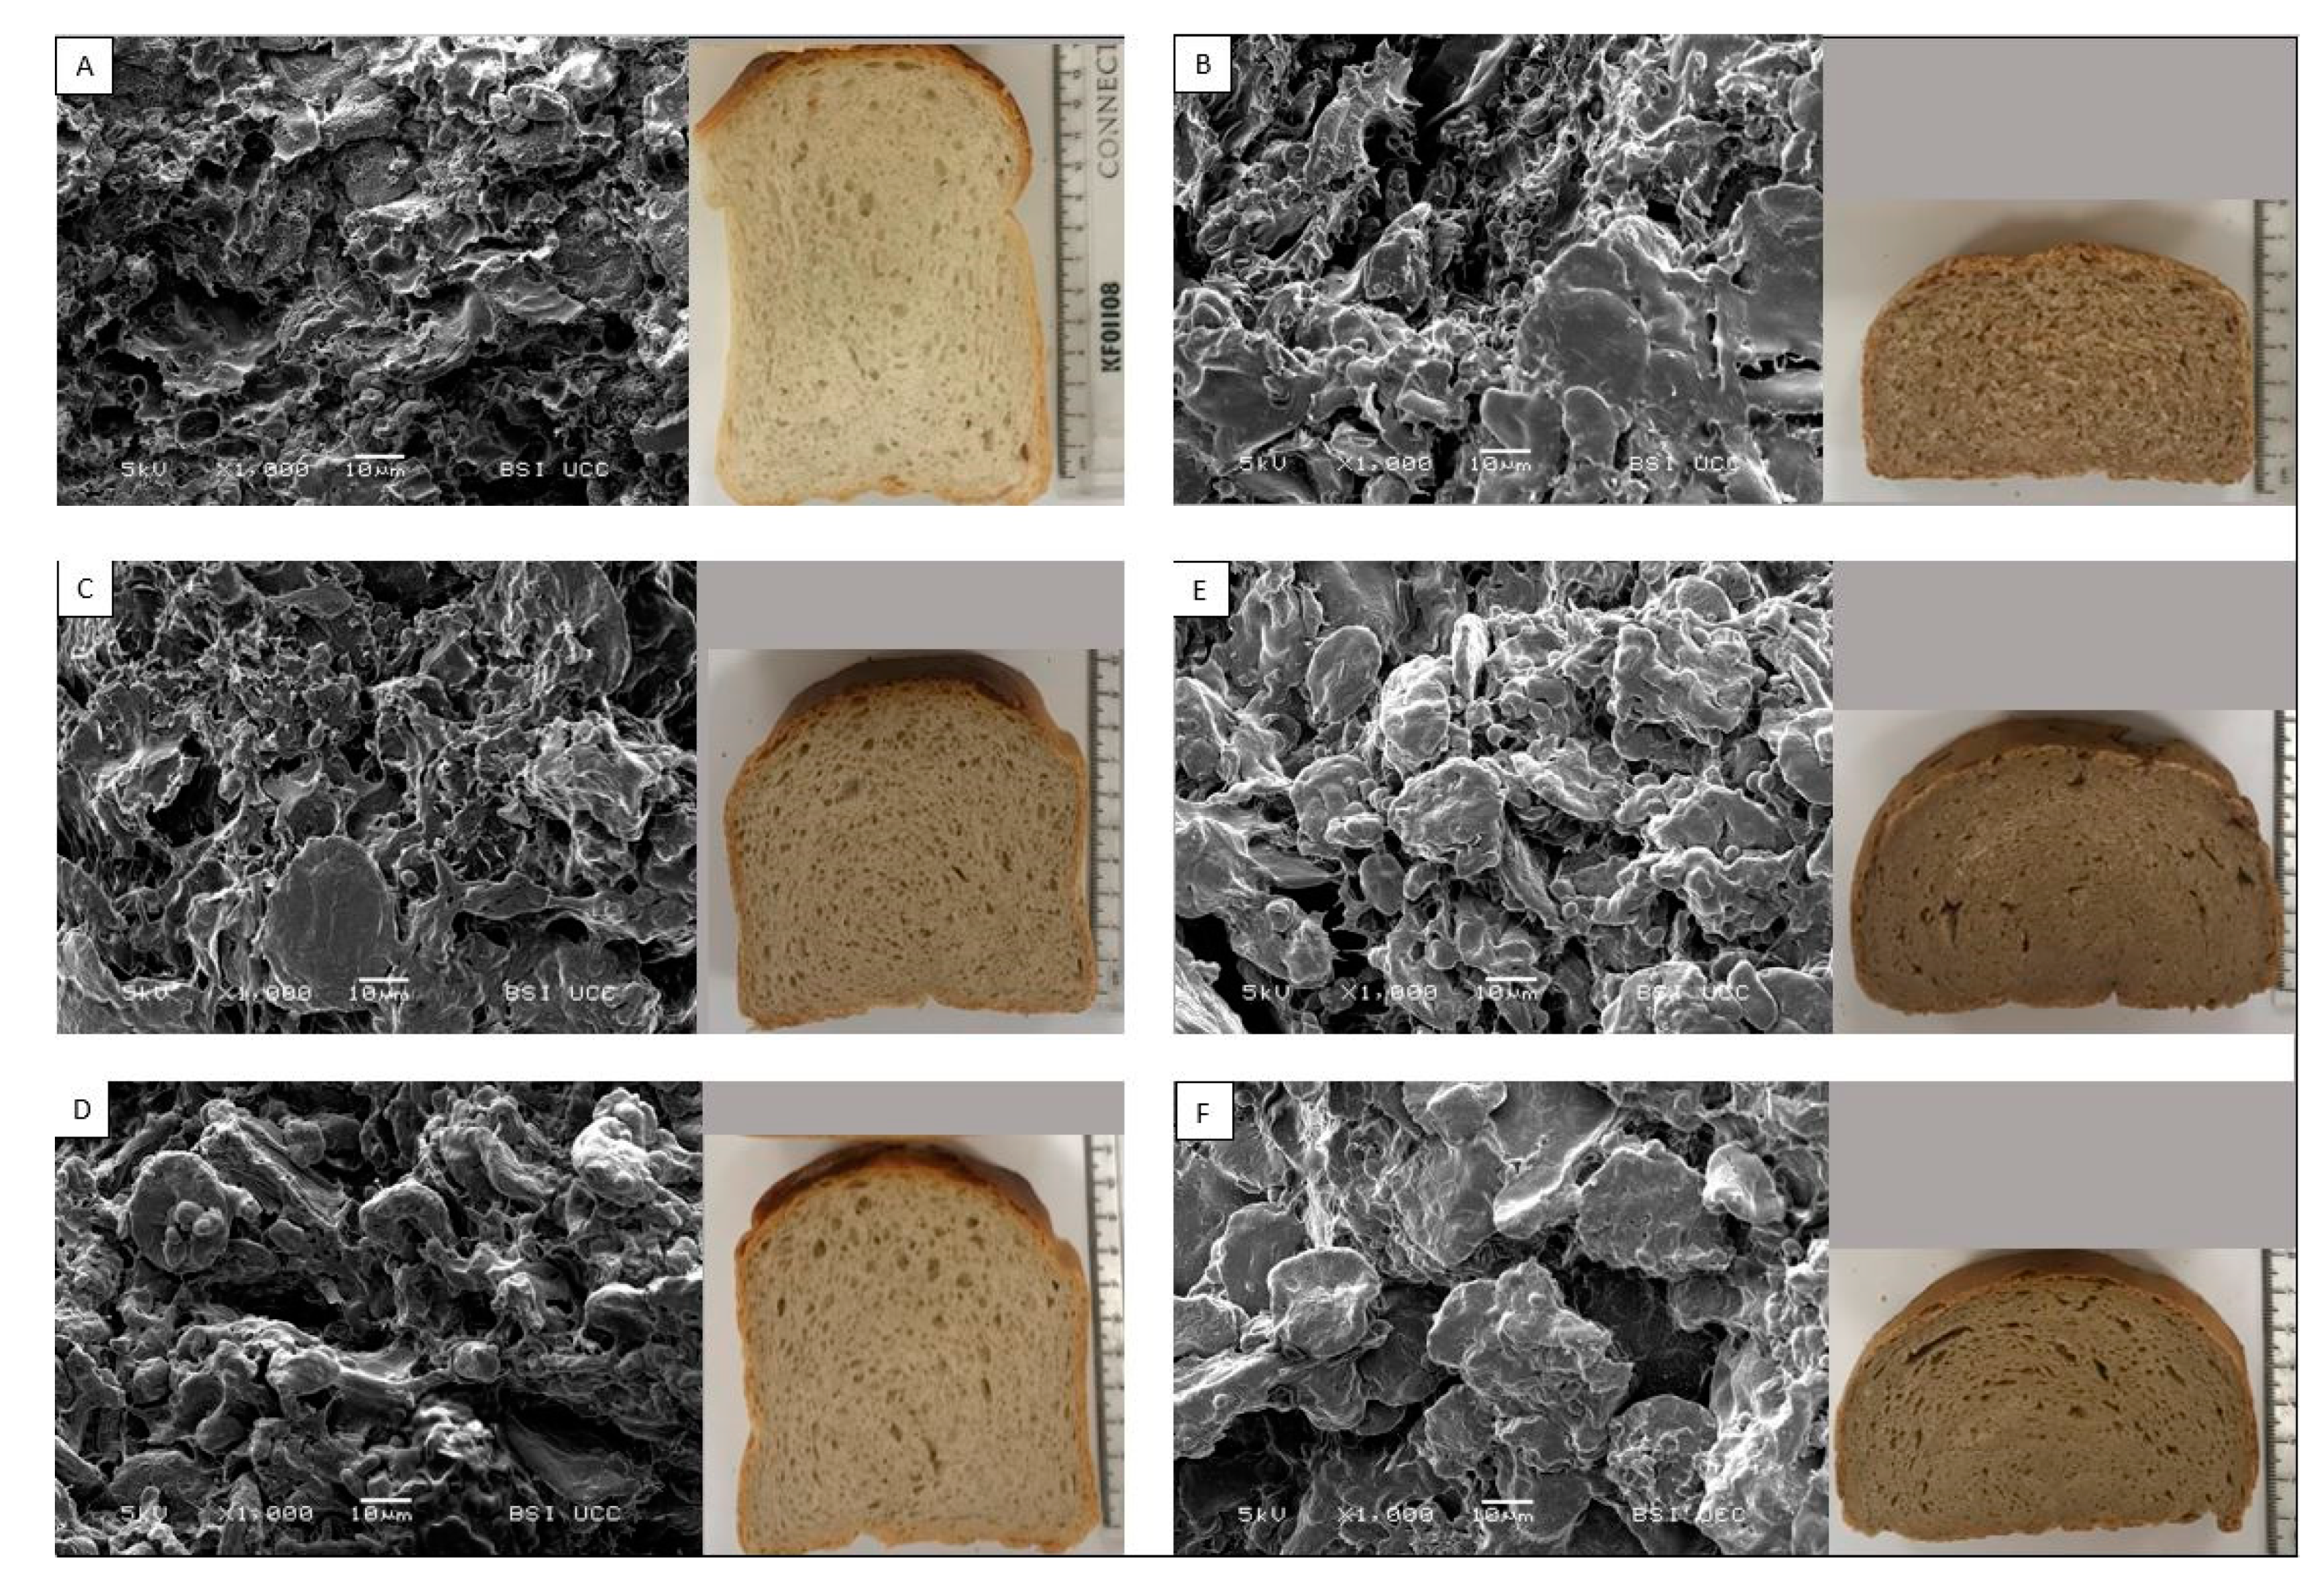
2.4.8. Bread Microstructure
2.5. Statistical Analysis
3. Results
3.1. Dough Analysis
3.1.1. Water Absorption
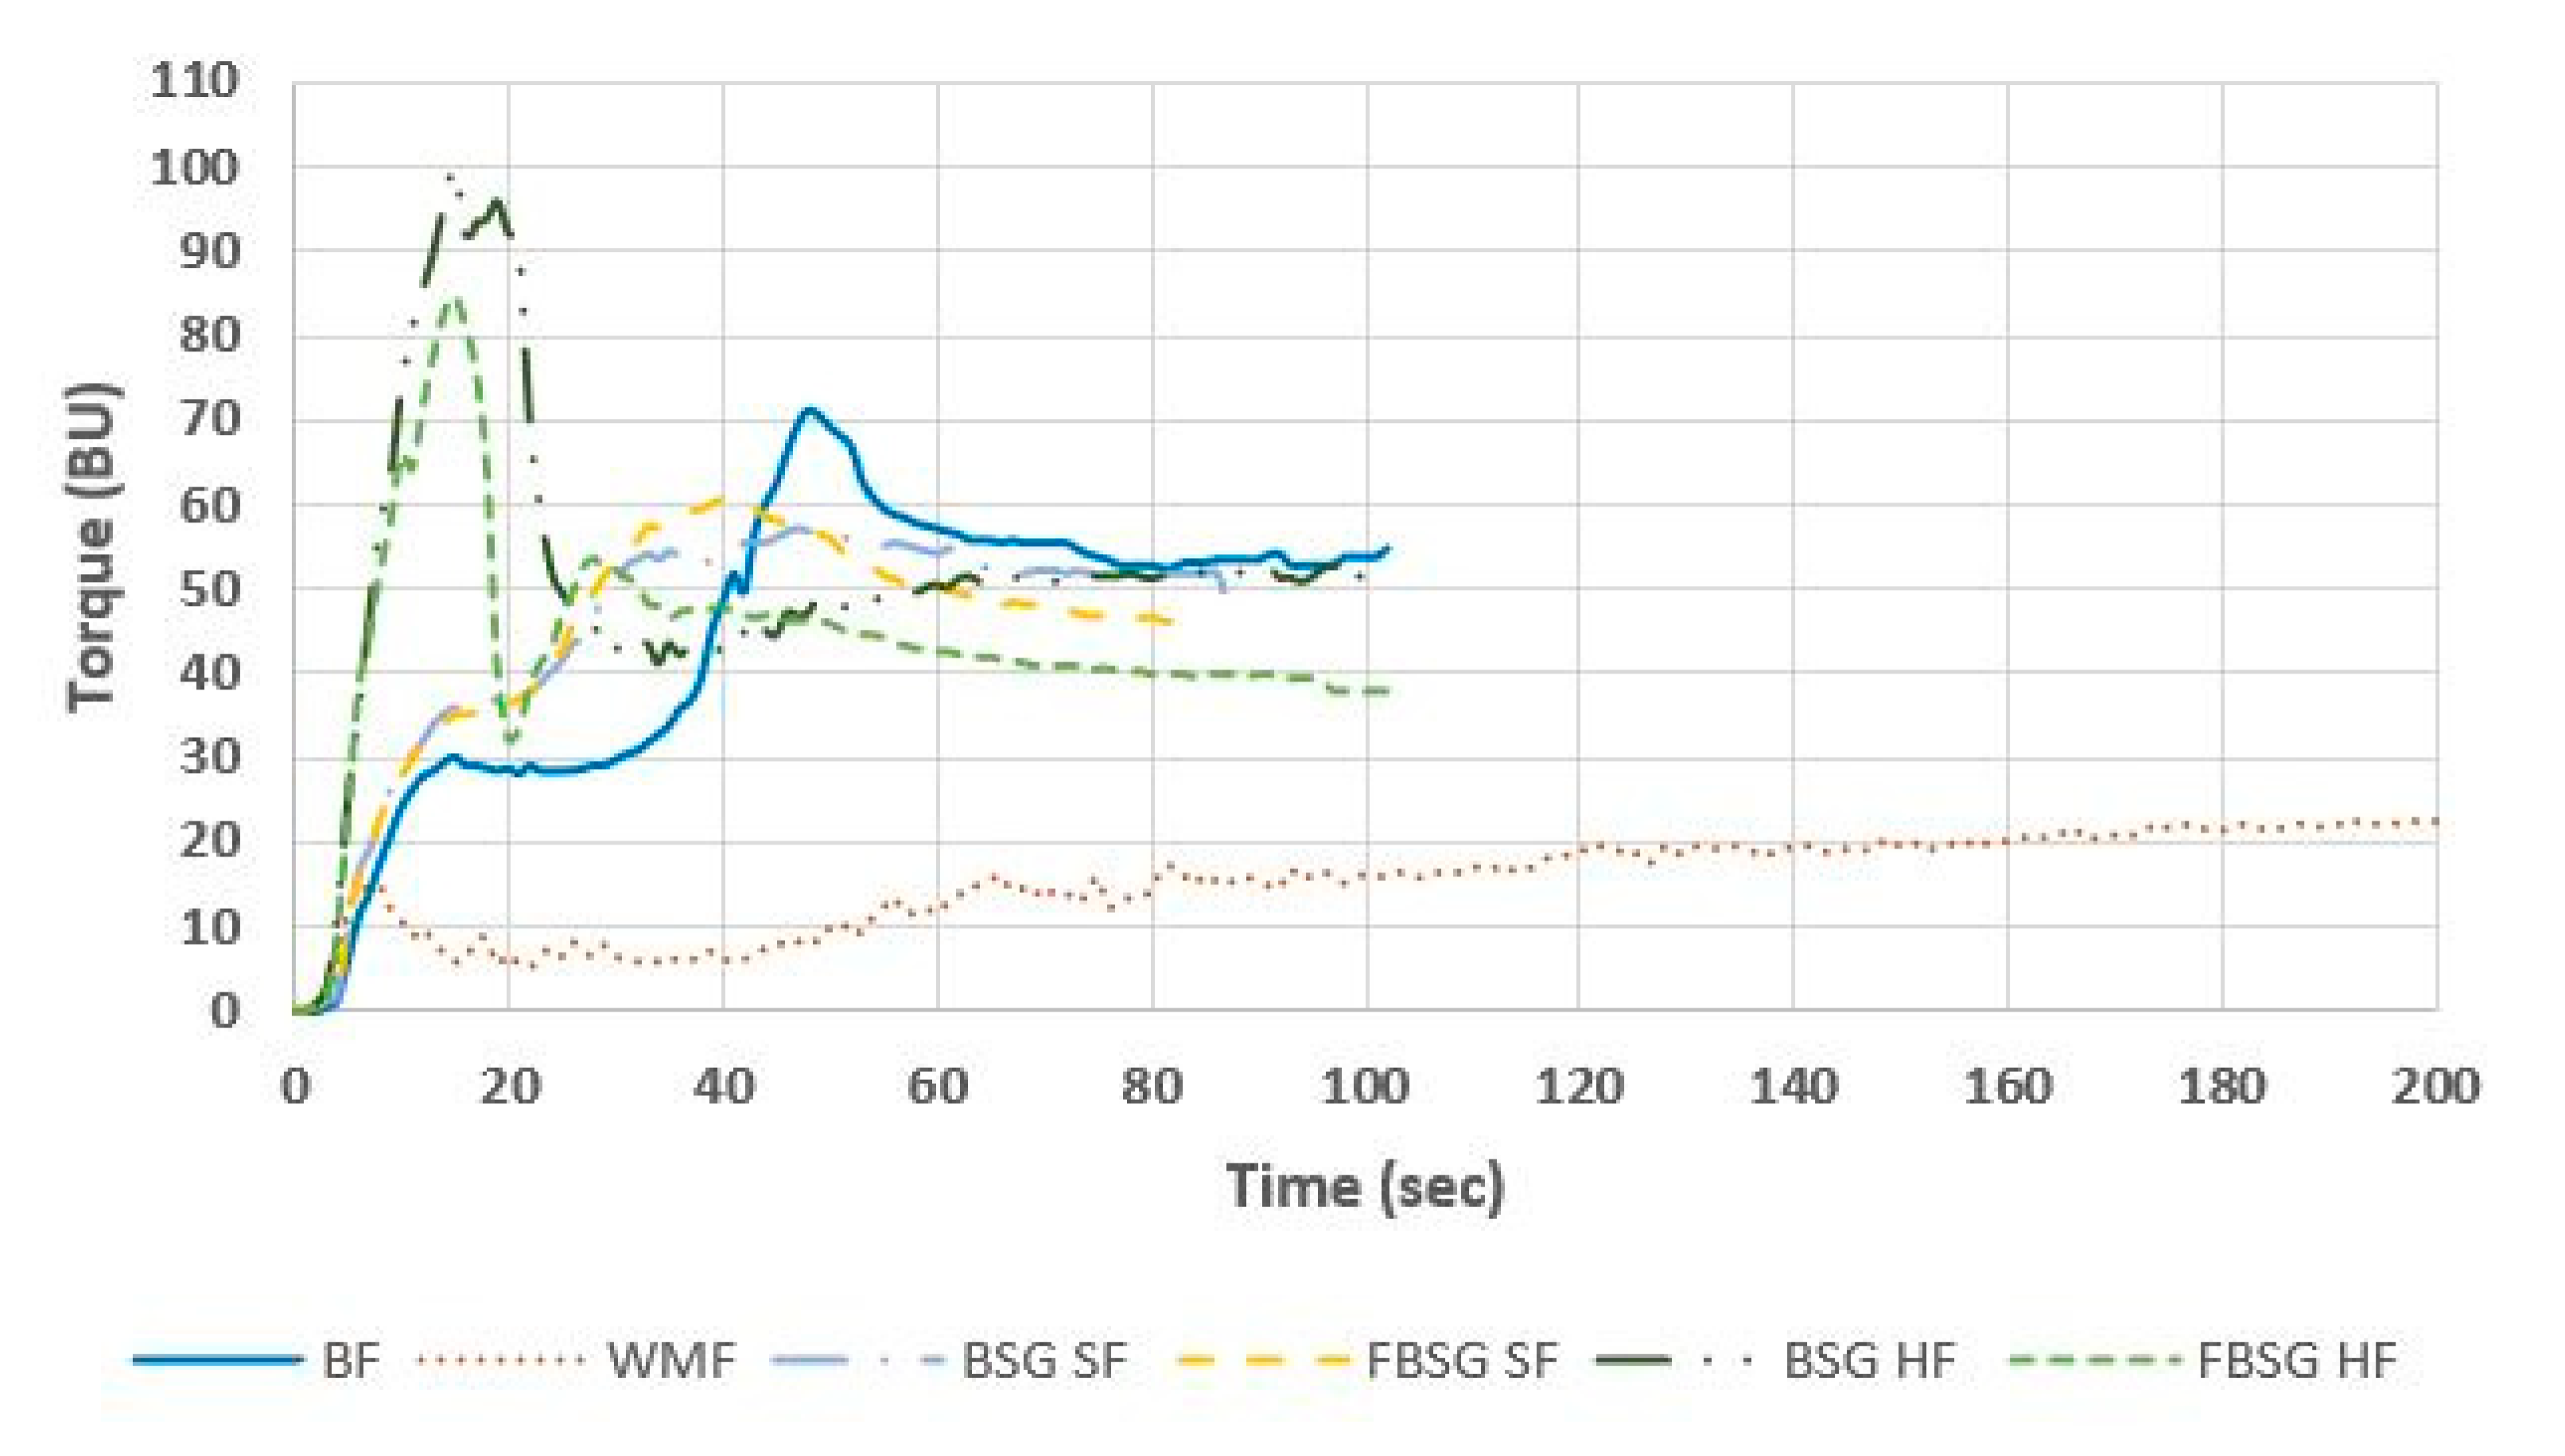
3.1.2. Gluten Network Formation
3.1.3. Effect on Starch Behaviour with Fibre Ingredient Addition
3.1.4. Dough Rheology
3.1.5. Fermentation Capacity of Doughs
3.2. Bread Analysis
3.2.1. Bake Loss
3.2.2. Specific Volume
3.2.3. Crumb Structure
3.2.4. Bread Texture and Staling
3.2.5. Crust and Crumb Colour
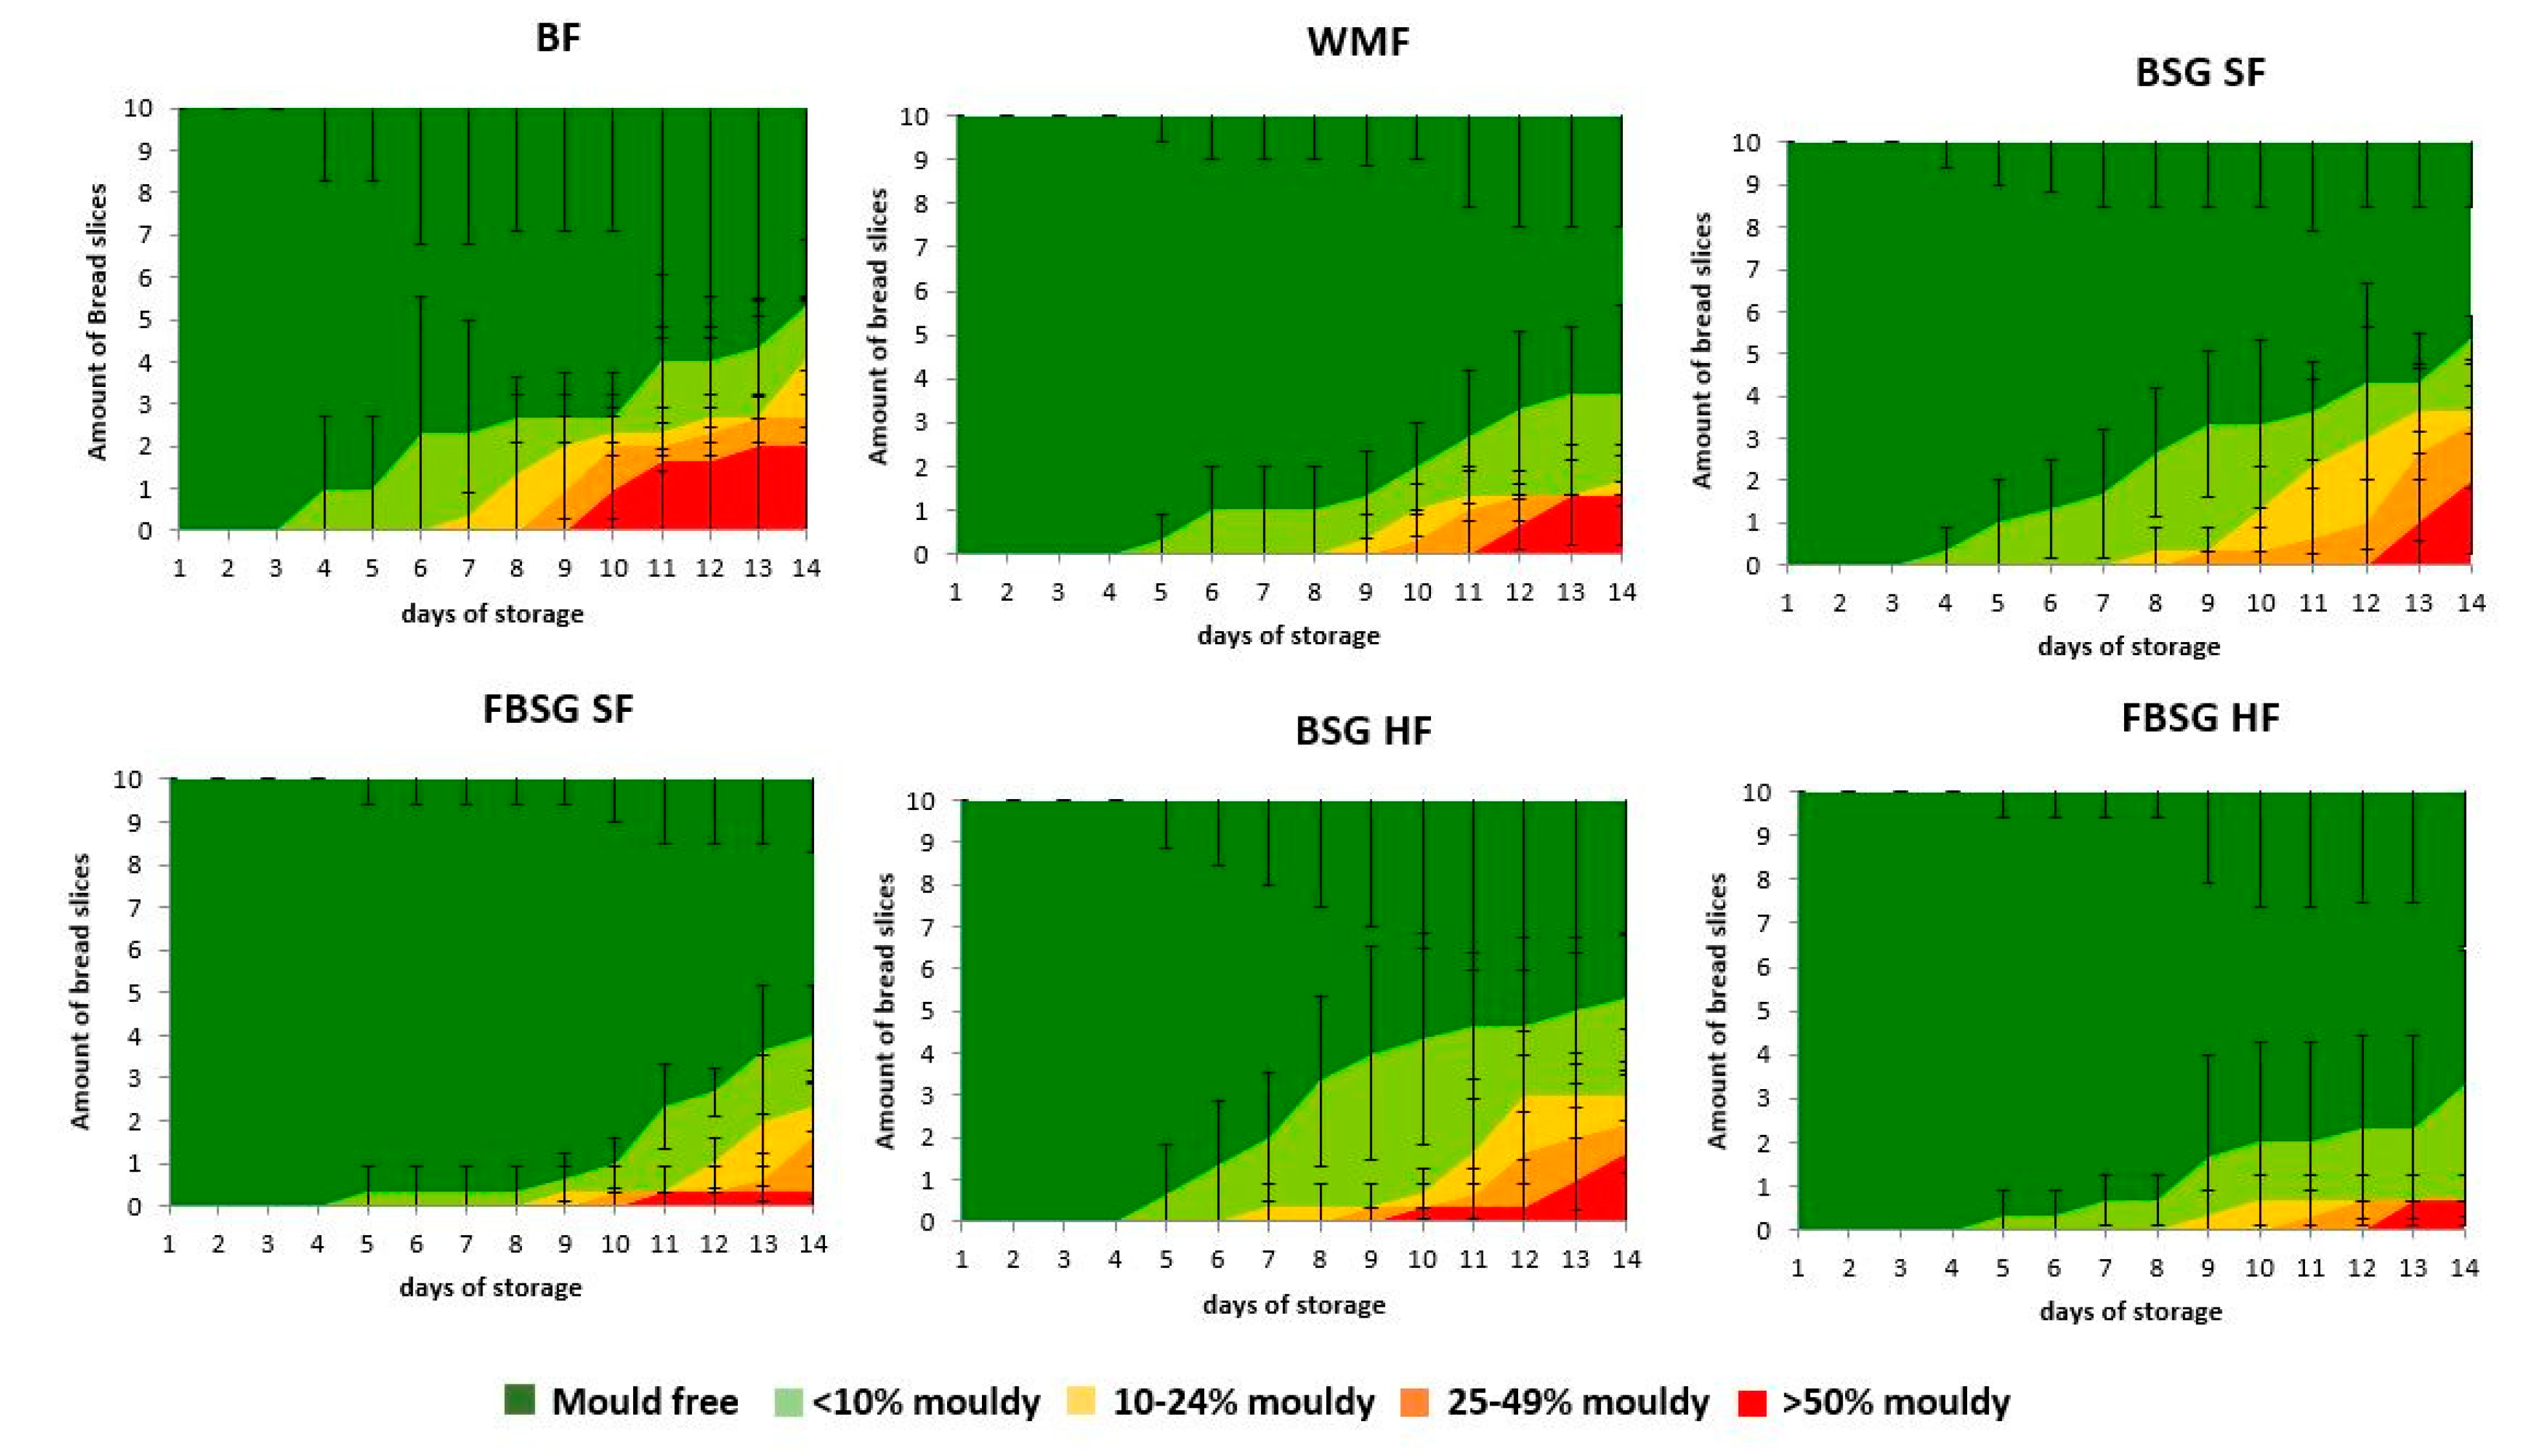
3.2.6. Water Activity and Microbial Shelf Life
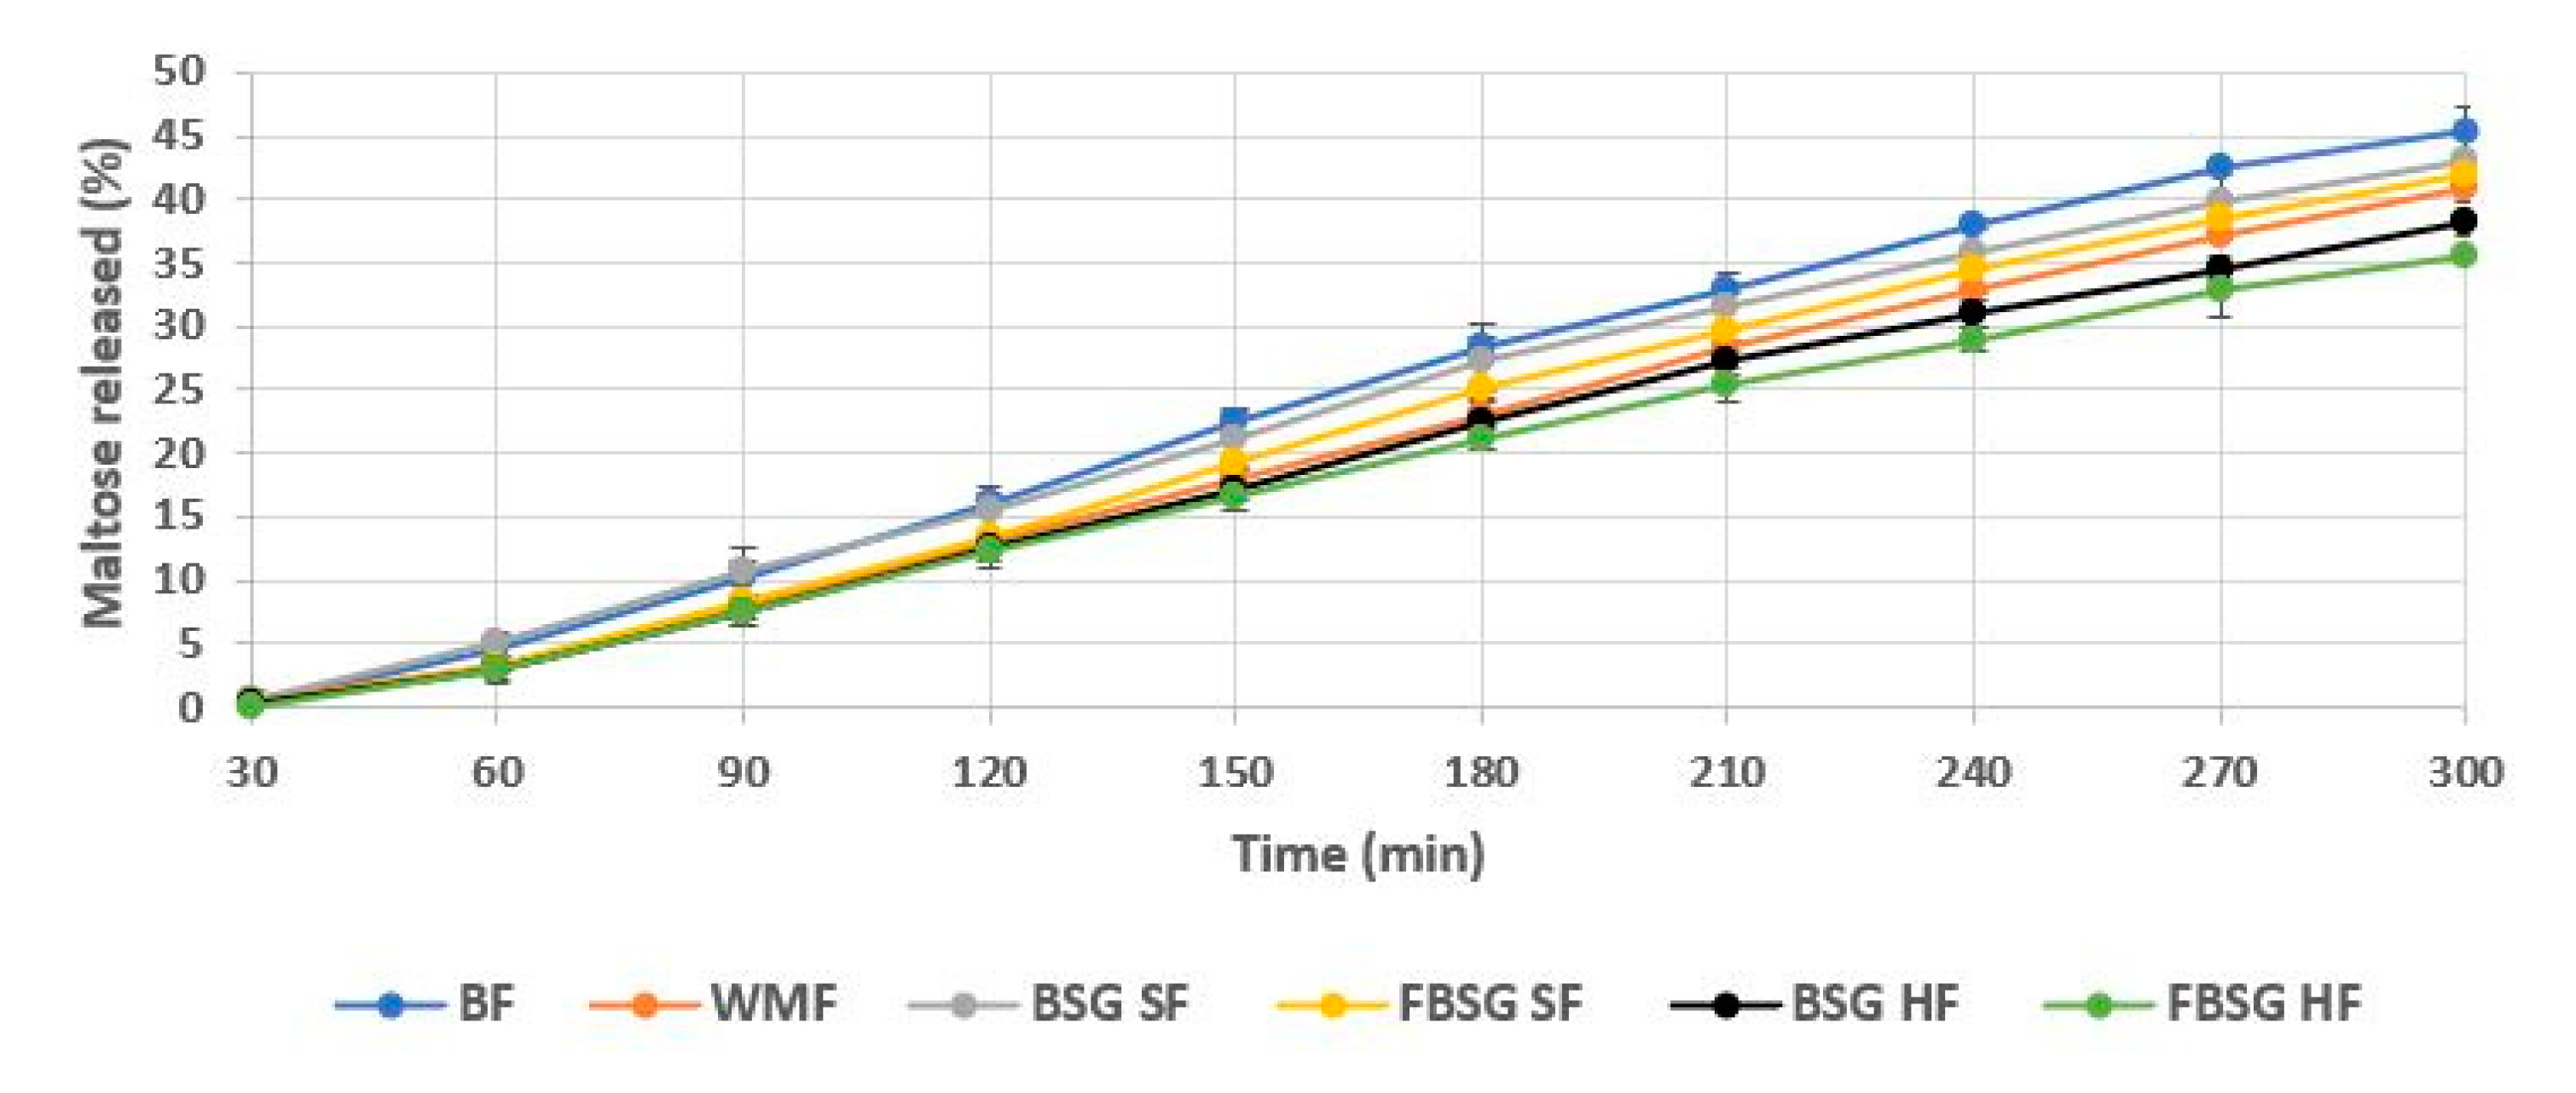
3.2.7. In Vitro Starch Hydrolysis
3.2.8. Bread Ultrastructure
4. Discussion
5. Conclusions
Author Contributions
Funding
Acknowledgments
Conflicts of Interest
References
- Mussatto, S.I.; Dragone, G.; Roberto, I.C. Brewers’ spent grain: Generation, characteristics and potential applications. J. Cereal Sci. 2006, 43, 1–14. [Google Scholar] [CrossRef]
- Lynch, K.M.; Steffen, E.J.; Arendt, E.K. Brewers’ spent grain: A review with an emphasis on food and health. J. Inst. Brew. 2016, 122, 553–568. [Google Scholar] [CrossRef]
- Mussatto, S.I. Brewer’s spent grain: A valuable feedstock for industrial applications. J. Sci. Food Agric. 2014, 94, 1264–1275. [Google Scholar] [CrossRef] [PubMed] [Green Version]
- Santos, M.; Jiménez, J.J.; Bartolomé, B.; Gómez-Cordovés, C.; Del Nozal, M.J. Variability of brewer’s spent grain within a brewery. Food Chem. 2003, 80, 17–21. [Google Scholar] [CrossRef]
- Hennemann, M.; Gastl, M.; Becker, T. Inhomogeneity in the lauter tun: A chromatographic view. Eur. Food Res. Technol. 2019, 245, 521–533. [Google Scholar] [CrossRef]
- Jackowski, M.; Niedźwiecki, Ł.; Jagiełło, K.; Uchańska, O.; Trusek, A. Brewer’s spent grains—Valuable beer industry by-product. Biomolecules 2020, 10, 1669. [Google Scholar] [CrossRef]
- Xiros, C.; Christakopoulos, P. Biotechnological potential of brewers spent grain and its recent applications. Waste Biomass Valorization 2012, 3, 213–232. [Google Scholar] [CrossRef]
- Kendall, C.W.C.; Esfahani, A.; Jenkins, D.J.A. The link between dietary fibre and human health. Food Hydrocoll. 2010, 24, 42–48. [Google Scholar] [CrossRef]
- Whitehead, A.; Beck, E.J.; Tosh, S.; Wolever, T.M.S. Cholesterol-lowering effects of oat b -glucan: A meta-analysis of randomized controlled trials 1–4. Am. J. Clin. Nutr. 2014, 100, 1413–1421. [Google Scholar] [CrossRef] [PubMed] [Green Version]
- Ocvirk, S.; Wilson, A.S.; Appolonia, C.N.; Thomas, T.K.; O’Keefe, S.J.D. Fiber, Fat, and Colorectal Cancer: New Insight into Modifiable Dietary Risk Factors. Curr. Gastroenterol. Rep. 2019, 21. [Google Scholar] [CrossRef]
- European Food Safety Authority. Scientific Opinion on Dietary Reference Values for carbohydrates and dietary fibre. EFSA J. 2010, 8, 1462. [Google Scholar] [CrossRef]
- Waters, D.M.; Jacob, F.; Titze, J.; Arendt, E.K.; Zannini, E. Fibre, protein and mineral fortification of wheat bread through milled and fermented brewer’s spent grain enrichment. Eur. Food Res. Technol. 2012, 235, 767–778. [Google Scholar] [CrossRef]
- Stojceska, V.; Ainsworth, P. The effect of different enzymes on the quality of high-fibre enriched brewer’s spent grain breads. Food Chem. 2008, 110, 865–872. [Google Scholar] [CrossRef] [PubMed]
- Ktenioudaki, A.; Alvarez-Jubete, L.; Smyth, T.J.; Kilcawley, K.; Rai, D.K.; Gallagher, E. Application of bioprocessing techniques (sourdough fermentation and technological aids) for brewer’s spent grain breads. Food Res. Int. 2015, 73, 107–116. [Google Scholar] [CrossRef]
- Fărcaş, A.C.; Socaci, S.A.; Tofană, M.; Mureşan, C.; Mudura, E.; Salanţă, L.; Scrob, S. Nutritional properties and volatile profile of brewer’s spent grain supplemented bread. Rom. Biotechnol. Lett. 2014, 19, 9705–9714. [Google Scholar]
- Aprodu, I.; Simion, A.B.; Banu, I. Valorisation of the Brewers’ Spent Grain Through Sourdough Bread Making. Int. J. Food Eng. 2017, 13, 1–9. [Google Scholar] [CrossRef]
- Nocente, F.; Taddei, F.; Galassi, E.; Gazza, L. Upcycling of brewers’ spent grain by production of dry pasta with higher nutritional potential. LWT Food Sci. Technol. 2019, 114, 108421. [Google Scholar] [CrossRef]
- Cappa, C.; Alamprese, C. Brewer’s spent grain valorization in fiber-enriched fresh egg pasta production: Modelling and optimization study. LWT Food Sci. Technol. 2017, 82, 464–470. [Google Scholar] [CrossRef]
- Ktenioudaki, A.; Chaurin, V.; Reis, S.F.; Gallagher, E. Brewer’s spent grain as a functional ingredient for breadsticks. Int. J. Food Sci. Technol. 2012, 47, 1765–1771. [Google Scholar] [CrossRef] [Green Version]
- Ktenioudaki, A.; Crofton, E.; Scannell, A.G.M.; Hannon, J.A.; Kilcawley, K.N.; Gallagher, E. Sensory properties and aromatic composition of baked snacks containing brewer’s spent grain. J. Cereal Sci. 2013, 57, 384–390. [Google Scholar] [CrossRef]
- Öztürk, S.; Özboy, Ö.; Cavidoğlu, İ.; Köksel, H. Effect of Brewer’s Spent Grain on the Quality and Dietary Fibre Content of Cookies. J. Inst. Brew. 2002, 108, 23–27. [Google Scholar] [CrossRef]
- Ainsworth, P.; Ibanoǧlu, Ş.; Plunkett, A.; Ibanoǧlu, E.; Stojceska, V. Effect of brewers spent grain addition and screw speed on the selected physical and nutritional properties of an extruded snack. J. Food Eng. 2007, 81, 702–709. [Google Scholar] [CrossRef]
- Stojceska, V.; Ainsworth, P.; Plunkett, A.; Ibanoǧlu, S. The recycling of brewer’s processing by-product into ready-to-eat snacks using extrusion technology. J. Cereal Sci. 2008, 47, 469–479. [Google Scholar] [CrossRef]
- Özvural, E.B.; Vural, H.; Gökbulut, I.; Özboy-Özbaş, Ö. Utilization of brewer’s spent grain in the production of Frankfurters. Int. J. Food Sci. Technol. 2009, 44, 1093–1099. [Google Scholar] [CrossRef]
- Sahin, A.W.; Atzler, J.J.; Valdeperez, D.; Münch, S.; Cattaneo, G.; Riordan, P.O.; Arendt, E.K. Rejuvenated Brewer’s Spent Grain: EverVita Ingredients as Game-Changers in Fibre-Enriched Bread. Foods 2021, 6, 1162. [Google Scholar] [CrossRef]
- Sahin, A.W.; Hardiman, K.; Atzler, J.J.; Vogelsang-O’Dwyer, M.; Valdeperez, D.; Münch, S.; Cattaneo, G.; O’Riordan, P.; Arendt, E.K. Rejuvenated Brewer’s Spent Grain: The impact of two BSG-derived ingredients on techno-functional and nutritional characteristics of fibre-enriched pasta. Innov. Food Sci. Emerg. Technol. 2021, 68. [Google Scholar] [CrossRef]
- Sahin, A.W.; Rice, T.; Zannini, E.; Axel, C.; Coffey, A.; Lynch, K.M.; Arendt, E.K. Leuconostoc citreum TR116: In-situ production of mannitol in sourdough and its application to reduce sugar in burger buns. Int. J. Food Microbiol. 2019, 302, 80–89. [Google Scholar] [CrossRef] [PubMed]
- Falade, A.T.; Emmambux, M.N.; Buys, E.M.; Taylor, J.R.N. Improvement of maize bread quality through modification of dough rheological properties by lactic acid bacteria fermentation. J. Cereal Sci. 2014, 60, 471–476. [Google Scholar] [CrossRef] [Green Version]
- Dal Bello, F.; Clarke, C.I.; Ryan, L.A.M.; Ulmer, H.; Schober, T.J.; Ström, K.; Sjögren, J.; van Sinderen, D.; Schnürer, J.; Arendt, E.K. Improvement of the quality and shelf life of wheat bread by fermentation with the antifungal strain Lactobacillus plantarum FST 1.7. J. Cereal Sci. 2007, 45, 309–318. [Google Scholar] [CrossRef]
- Waters, D.M.; Kingston, W.; Jacob, F.; Titze, J.; Arendt, E.K.; Zannini, E. Wheat bread biofortification with rootlets, a malting by-product. J. Sci. Food Agric. 2013, 93, 2372–2383. [Google Scholar] [CrossRef] [PubMed]
- Pontonio, E.; Lorusso, A.; Gobbetti, M.; Rizzello, C.G. Use of fermented milling by-products as functional ingredient to develop a low-glycaemic index bread. J. Cereal Sci. 2017, 77, 235–242. [Google Scholar] [CrossRef]
- Verni, M.; Pontonio, E.; Krona, A.; Jacob, S.; Pinto, D.; Rinaldi, F.; Verardo, V.; Díaz-de-Cerio, E.; Coda, R.; Rizzello, C.G. Bioprocessing of Brewers’ Spent Grain Enhances Its Antioxidant Activity: Characterization of Phenolic Compounds and Bioactive Peptides. Front. Microbiol. 2020, 11, 1831. [Google Scholar] [CrossRef] [PubMed]
- EU REGULATION (EC) No 1924/2006. Available online: https://eur-lex.europa.eu/legal-content/EN/TXT/PDF/?uri=CELEX:32006R1924&from=EN%0Ahttp://eur-lex.europa.eu/legal-content/EN/TXT/PDF/?uri=CELEX:32006R1924&from=en (accessed on 30 November 2020).
- Gil-Martinez, J.; Arendt, E. A Process for Preparing a Beverage or Beverage Component, Prepared by such Process, and Use of Brewers Spent Grains for Preparing such Beverage or Beverage Component. Available online: https://patentscope.wipo.int/search/en/detail.jsf?docId=WO2018033521 (accessed on 30 November 2020).
- McCleary, B.V.; McNally, M.; Monaghan, D.; Mugford, D.C. Collaborators: Measurement of α-amylase activity in white wheat flour, milled malt, and microbial enzyme preparations, using the ceralpha assay: Collaborative study. J. AOAC Int. 2002, 85, 1096–1102. [Google Scholar] [CrossRef] [Green Version]
- Hager, A.S.; Ryan, L.A.M.; Schwab, C.; Gänzle, M.G.; O’Doherty, J.V.; Arendt, E.K. Influence of the soluble fibres inulin and oat β-glucan on quality of dough and bread. Eur. Food Res. Technol. 2011, 232, 405–413. [Google Scholar] [CrossRef]
- Sahin, A.W.; Axel, C.; Zannini, E.; Arendt, E.K. Xylitol, mannitol and maltitol as potential sucrose replacers in burger buns. Food Funct. 2018, 9, 2201–2212. [Google Scholar] [CrossRef]
- Sahin, A.W.; Axel, C.; Arendt, E.K. Understanding the function of sugar in burger buns: A fundamental study. Eur. Food Res. Technol. 2017, 243, 1905–1915. [Google Scholar] [CrossRef]
- Brennan, C.S.; Tudorica, C.M. Evaluation of potential mechanisms by which dietary fibre additions reduce the predicted glycaemic index of fresh pastas. Int. J. Food Sci. Technol. 2008, 43, 2151–2162. [Google Scholar] [CrossRef]
- Goldstein, A.; Ashrafi, L.; Seetharaman, K. Effects of cellulosic fibre on physical and rheological properties of starch, gluten and wheat flour. Int. J. Food Sci. Technol. 2010, 45, 1641–1646. [Google Scholar] [CrossRef]
- Cardone, G.; D’Incecco, P.; Casiraghi, M.C.; Marti, A. Exploiting milling by-products in bread-making: The case of sprouted wheat. Foods 2020, 9, 260. [Google Scholar] [CrossRef] [Green Version]
- Malegori, C.; Grassi, S.; Ohm, J.B.; Anderson, J.; Marti, A. GlutoPeak profile analysis for wheat classification: Skipping the refinement process. J. Cereal Sci. 2018, 79, 73–79. [Google Scholar] [CrossRef]
- Avramenko, N.A.; Tyler, R.T.; Scanlon, M.G.; Hucl, P.; Nickerson, M.T. The chemistry of bread making: The role of salt to ensure optimal functionality of its constituents. Food Rev. Int. 2018, 34, 204–225. [Google Scholar] [CrossRef]
- Belz, M.C.E.; Ryan, L.A.M.; Arendt, E.K. The Impact of Salt Reduction in Bread: A Review. Crit. Rev. Food Sci. Nutr. 2012, 52, 514–524. [Google Scholar] [CrossRef]
- Melnyk, J.P.; Dreisoerner, J.; Marcone, M.F.; Seetharaman, K. Using the Gluten Peak Tester as a tool to measure physical properties of gluten. J. Cereal Sci. 2012, 56, 561–567. [Google Scholar] [CrossRef]
- Nawrocka, A.; Szymańska-Chargot, M.; Miś, A.; Wilczewska, A.Z.; Markiewicz, K.H. Aggregation of gluten proteins in model dough after fibre polysaccharide addition. Food Chem. 2017, 231, 51–60. [Google Scholar] [CrossRef] [PubMed]
- Ktenioudaki, A.; O’Shea, N.; Gallagher, E. Rheological properties of wheat dough supplemented with functional by-products of food processing: Brewer’s spent grain and apple pomace. J. Food Eng. 2013, 116, 362–368. [Google Scholar] [CrossRef]
- Noort, M.W.J.; van Haaster, D.; Hemery, Y.; Schols, H.A.; Hamer, R.J. The effect of particle size of wheat bran fractions on bread quality—Evidence for fibre-protein interactions. J. Cereal Sci. 2010, 52, 59–64. [Google Scholar] [CrossRef]
- Wang, M.; Van Vliet, T.; Hamer, R.J. How gluten properties are affected by pentosans. J. Cereal Sci. 2004, 39, 395–402. [Google Scholar] [CrossRef]
- Hoehnel, A.; Axel, C.; Bez, J.; Arendt, E.K.; Zannini, E. Comparative analysis of plant-based high-protein ingredients and their impact on quality of high-protein bread. J. Cereal Sci. 2019, 89. [Google Scholar] [CrossRef]
- Arendt, E.K.; Ryan, L.A.M.; Dal Bello, F. Impact of sourdough on the texture of bread. Food Microbiol. 2007, 24, 165–174. [Google Scholar] [CrossRef] [PubMed]
- Bouachra, S.; Begemann, J.; Aarab, L.; Hüsken, A. Prediction of bread wheat baking quality using an optimized GlutoPeak®-Test method. J. Cereal Sci. 2017, 76, 8–16. [Google Scholar] [CrossRef]
- Clarke, C.I.; Schober, T.J.; Dockery, P.; O’Sullivan, K.; Arendt, E.K. Wheat Sourdough Fermentation: Effects of Time and Acidification on Fundamental Rheological Properties. Cereal Chem. 2004, 81, 409–417. [Google Scholar] [CrossRef]
- Hoehnel, A.; Bez, J.; Sahin, A.W.; Coffey, A.; Arendt, E.K.; Zannini, E. Leuconostoc citreum TR116 as a Microbial Cell Factory to Functionalise High-Protein Faba Bean Ingredients for Bakery Applications. Foods 2020, 9, 1706. [Google Scholar] [CrossRef]
- Clarke, C.I.; Schober, T.J.; Arendt, E.K. Effect of single strain and traditional mixed strain starter cultures on rheological properties of wheat dough and on bread quality. Cereal Chem. 2002, 79, 640–647. [Google Scholar] [CrossRef]
- Collar, C.; Santos, E.; Rosell, C.M. Significance of dietary fiber on the viscometric pattern of pasted and gelled flour-fiber blends. Cereal Chem. 2006, 83, 370–376. [Google Scholar] [CrossRef]
- Oñate Narciso, J.; Brennan, C. Whey and Pea Protein Fortification of Rice Starches: Effects on Protein and Starch Digestibility and Starch Pasting Properties. Starch/Staerke 2018, 70. [Google Scholar] [CrossRef]
- Kusunose, C.; Fujii, T.; Matsumoto, H. Role of starch granules in controlling expansion of dough during baking. Cereal Chem. 1999, 76, 920–924. [Google Scholar] [CrossRef]
- Leman, P.; Goesaert, H.; Vandeputte, G.E.; Lagrain, B.; Delcour, J.A. Maltogenic amylase has a non-typical impact on the molecular and rheological properties of starch. Carbohydr. Polym. 2005, 62, 205–213. [Google Scholar] [CrossRef]
- Błaszczak, W.; Sadowska, J.; Rosell, C.M.; Fornal, J. Structural changes in the wheat dough and bread with the addition of alpha-amylases. Eur. Food Res. Technol. 2004, 219, 348–354. [Google Scholar] [CrossRef]
- León, A.; Durán, E.; De Barber, C.B. Firming of starch gels and amylopectin retrogradation as related to dextrin production by α-amylase. Eur. Food Res. Technol. 1997, 205, 131–134. [Google Scholar] [CrossRef]
- Morgan, K.R.; Hutt, L.; Zealand, N.; Gerrard, J.; Every, D.; Ross, M.; Gilpin, M.; Zealand, C.N. Staling in Starch Breads: The Effect of Antistaling alpha amylase. Starch 1997, 49, 54–59. [Google Scholar] [CrossRef]
- Hug-Iten, S.; Escher, F.; Conde-Petit, B. Structural properties of starch in bread and bread model systems: Influence of an antistaling α-amylase. Cereal Chem. 2001, 78, 421–428. [Google Scholar] [CrossRef]
- Haros, M.; Perez, O.E.; Rosell, C.M. Effect of Steeping Corn with Lactic Acid on Starch Properties. Cereal Chem. 2004, 81, 10–14. [Google Scholar] [CrossRef]
- Shandera, D.; Jackson, D. Effect of Corn Wet-Milling Conditions (Sulfur Dioxide, Lactic Acid, and Steeping Temperature) on Starch Functionality. Cereal Chem. 1996, 73, 632–637. Available online: https://www.cerealsgrains.org/publications/cc/backissues/1996/Documents/cc1996a132.html (accessed on 2 June 2021).
- Kalina, V. Dynamics of microbial growth and metabolic activity and their control by aeration. Antonie Van Leeuwenhoek 1993, 63, 353–373. [Google Scholar] [CrossRef] [PubMed]
- Axel, C.; Zannini, E.; Arendt, E.K. Mold spoilage of bread and its biopreservation: A review of current strategies for bread shelf life extension. Crit. Rev. Food Sci. Nutr. 2017, 57, 3528–3542. [Google Scholar] [CrossRef]
- Melini, V.; Melini, F. Strategies to extend bread and GF bread shelf-life: From Sourdough to antimicrobial active packaging and nanotechnology. Fermentation 2018, 4, 9. [Google Scholar] [CrossRef] [Green Version]
- López-Barón, N.; Gu, Y.; Vasanthan, T.; Hoover, R. Plant proteins mitigate in vitro wheat starch digestibility. Food Hydrocoll. 2017, 69, 19–27. [Google Scholar] [CrossRef]
- Rizzello, C.G.; Coda, R.; Mazzacane, F.; Minervini, D.; Gobbetti, M. Micronized by-products from debranned durum wheat and sourdough fermentation enhanced the nutritional, textural and sensory features of bread. Food Res. Int. 2012, 46, 304–313. [Google Scholar] [CrossRef]
- Singh, J.; Dartois, A.; Kaur, L. Starch digestibility in food matrix: A review. Trends Food Sci. Technol. 2010, 21, 168–180. [Google Scholar] [CrossRef]
- Zhang, B.; Dhital, S.; Gidley, M.J. Densely packed matrices as rate determining features in starch hydrolysis. Trends Food Sci. Technol. 2015, 43, 18–31. [Google Scholar] [CrossRef] [Green Version]
- Tudoricǎ, C.M.; Kuri, V.; Brennan, C.S. Nutritional and physicochemical characteristics of dietary fiber enriched pasta. J. Agric. Food Chem. 2002, 50, 347–356. [Google Scholar] [CrossRef] [PubMed]
- Li, H.T.; Li, Z.; Fox, G.P.; Gidley, M.J.; Dhital, S. Protein-starch matrix plays a key role in enzymic digestion of high-amylose wheat noodle. Food Chem. 2020, 336, 127719. [Google Scholar] [CrossRef]
- Yang, C.; Zhong, F.; Douglas Goff, H.; Li, Y. Study on starch-protein interactions and their effects on physicochemical and digestible properties of the blends. Food Chem. 2019, 280, 51–58. [Google Scholar] [CrossRef] [PubMed]
- Cantatore, V.; Filannino, P.; Gambacorta, G.; De Pasquale, I.; Pan, S.; Gobbetti, M.; Di Cagno, R. Lactic Acid Fermentation to Re-cycle Apple By-Products for Wheat Bread Fortification. Front. Microbiol. 2019, 10, 2574. [Google Scholar] [CrossRef] [Green Version]
- De Angelis, M.; Rizzello, C.G.; Alfonsi, G.; Arnault, P.; Cappelle, S.; Di Cagno, R.; Gobbetti, M. Use of sourdough lactobacilli and oat fibre to decrease the glycaemic index of white wheat bread. Br. J. Nutr. 2007, 98, 1196–1205. [Google Scholar] [CrossRef] [PubMed] [Green Version]
- Rizzello, C.G.; Lorusso, A.; Montemurro, M.; Gobbetti, M. Use of sourdough made with quinoa (Chenopodium quinoa) flour and autochthonous selected lactic acid bacteria for enhancing the nutritional, textural and sensory features of white bread. Food Microbiol. 2016, 56, 1–13. [Google Scholar] [CrossRef]
- Wolter, A.; Hager, A.S.; Zannini, E.; Arendt, E.K. Influence of sourdough on in vitro starch digestibility and predicted glycemic indices of gluten-free breads. Food Funct. 2014, 5, 564–572. [Google Scholar] [CrossRef]
- Östman, E.M.; Nilsson, M.; Liljeberg Elmståhl, H.G.M.; Molin, G.; Björck, I.M.E. On the effect of lactic acid on blood glucose and insulin responses to cereal products: Mechanistic studies in healthy subjects and in vitro. J. Cereal Sci. 2002, 36, 339–346. [Google Scholar] [CrossRef]


| BF | WMF | BSG | FBSG | |
|---|---|---|---|---|
| Protein | 12.9 | 11.4 | 31.4 | 32.4 |
| Moisture | 12.6 | 12.0 | 4.7 | 5.0 |
| Fat | 0.86 | 1.6 | 10.3 | 6.5 |
| Ash | 0.70 | 1.3 | 3.7 | 3.7 |
| Total Carbohydrate | 72.9 | 73.7 | 49.9 | 52.37 |
| Of which dietary fibre | 3.1 | 7.1 | 42.6 | 49.4 |
| α-amylase (cu/g) * | 0.12 ± 0.01 | 0.12 ± 0.02 | 0.12 ± 0.00 | 0.24 ± 0.00 |
| Ingredient | BF | WMF | BSG (SF) | FBSG (SF) | BSG (HF) | FBSG (HF) |
|---|---|---|---|---|---|---|
| Baker’s flour | 100 | - | 95.0 | 96.0 | 82.0 | 85.0 |
| Wholemeal | - | 100 | - | - | - | - |
| Fibre ingredient | - | - | 5.0 | 4.0 | 18.0 | 15.0 |
| Salt | 1.2 | 1.2 | 1.2 | 1.2 | 1.2 | 1.2 |
| Sugar | 2.0 | 2.0 | 2.0 | 2.0 | 2.0 | 2.0 |
| Sunflower oil | 3.2 | 3.2 | 3.2 | 3.2 | 3.2 | 3.2 |
| Dry Yeast | 2.0 | 2.0 | 2.0 | 2.0 | 2.0 | 2.0 |
| Water | 57.3 | 59.3 | 61.6 | 60.1 | 68.6 | 66.9 |
| BF | WMF | BSG (SF) | FBSG (SF) | BSG (HF) | FBSG (HF) | |
|---|---|---|---|---|---|---|
| Farinograph | ||||||
| Water Absorption % | 57.30 ± 0.2 f | 59.33 ± 0.15 e | 61.60 ± 0.1 c | 60.10 ± 0.1 d | 68.60 ± 0.35 a | 66.93 ± 0.31 b |
| GlutoPeak | ||||||
| Peak Max Time (s) | 48.67 ± 1.53 b | 141.33 ± 15.18 a | 47.67 ± 1.15 b | 40.33 ± 0.58 c | 15.67 ± 2.08 d | 14.67 ± 0.58 d |
| Torque Max (BU) | 71.67 ± 0.58 c | 29.0 ± 1.0 e | 57.33 ± 0.58 d | 60.67 ± 0.58 d | 100.0 ± 2.0 a | 84.0 ± 2.65 b |
| Rapid Visco Analyser | ||||||
| Peak Viscosity (cP) | 1007.67 ± 14.57 a | 591.33 ± 30.85 e | 911.0 ± 15.13 b | 900.66 ± 13.05 b | 701.33 ± 5.13 d | 760.67 ± 10.69 c |
| Final Viscosity (cP) | 1327.33 ± 26.58 a | 1371.67 ± 27.61 a | 1229.69 ± 23.69 b | 1038.0 ± 11.79 c | 992.67 ± 8.33 c | 643.0 ± 6.24 d |
| Trough (cP) | 607.0 ± 15.52 a | 486.0 ± 25.71 c | 543.67 ± 11.59 b | 486.67 ± 13.58 c | 438.67 ± 3.79 d | 321.33 ± 10.26 e |
| Breakdown (cP) | 400.67 ± 1.15 b | 105.33 ± 10.96 e | 367.33 ± 4.04 c | 414.0 ± 3.61 a,b | 262.67 ± 1.53 d | 439.33 ± 7.23 a |
| Rheology | ||||||
| Damping factor | 0.368 ± 0.015 a | 0.341 ± 0.007 b | 0.331 ± 0.004 b | 0.330 ± 0.004 b | 0.264 ± 0.005 d | 0.280 ± 0.003 c |
| Rheofermentometer | ||||||
| Height max (mm) | 53.33 ± 1.7 a | 20.3 ± 0.44 c | 35.03 ± 0.6 b | 38.4 ± 3.48 b | 0 ± 0 d | 0 ± 0 d |
| Total Vol CO2 (mL) | 2159.3 ± 132.03 a | 2237.7 ± 71.93 a | 2139.6 ± 118.5 a | 2124.0 ± 62.81 a | 2114.6 ± 76.8 a | 2047.6 ± 89.51 a |
| CO2 retention coefficient (%) | 98.73 ± 0.74 a,c | 99.60 ± 0.10 a,b | 99.36 ± 0.15 a,c | 99.20 ± 0.10 c | 99.73 ± 0.06 a | 99.70 ± 0.10 a |
| BF | WMF | BSG (SF) | FBSG (SF) | BSG (HF) | FBSG (HF) | |
|---|---|---|---|---|---|---|
| Fibre Content (g/100) | 2.10 | 4.76 | 3.32 | 3.27 | 6.41 | 6.37 |
| Digestible Starch content of breads (g/100) | 38.74 ± 0.55 a | 33.81 ± 0.21 c | 37.03 ± 0.97 a | 35.70 ± 0.97 b | 29.38 ± 0.74 d | 31.37 ± 0.43 c |
| Bake loss (%) | 15.04 ± 0.53 a | 12.03 ± 0.51 c | 12.89 ± 0.40 b | 13.00 ± 0.69 b | 10.23 ± 0.26 d | 10.47 ± 0.40 d |
| Specific Volume (mL/g) | 5.49 ± 0.11 a | 2.07 ± 0.11 d | 3.49 ± 0.13 c | 3.86 ± 0.21 b | 1.45 ± 0.05 f | 1.69 ± 0.03 e |
| Slice Area (mm2) | 11654 ± 361 a | 5127 ± 361 d | 8060 ± 313 c | 8788 ± 471 b | 4776 ± 278 e | 5214 ± 234 d |
| Number of cells | 6472 ± 282 a | 3250 ± 168 c | 5556 ± 225 b | 5593 ± 246 b | 5483 ± 426 b | 5441 ± 387 b |
| Cell diameter (mm) | 2.28 ± 0.07 a | 2.18 ± 0.14 b | 1.72 ± 0.08 d | 1.86 ± 0.10 c | 1.09 ± 0.06 f | 1.15 ± 0.07 e |
| Bread Texture | ||||||
| Hardness T2 (N) | 2.99 ± 0.36 f | 30.13 ± 6.15 c | 10.91 ± 1.32 d | 7.91 ± 1.31 e | 79.22 ± 5.88 a | 47.24 ± 3.97 b |
| Resilience (T2) | 0.49 ± 0.02 a | 0.41 ± 0.02 c | 0.46 ± 0.02 b | 0.47 ± 0.02 b | 0.34 ± 0.02 d | 0.34 ± 0.02 d |
| Stale rate | 2.20 + 0.48 a | 0.95 ± 0.46 c,d | 1.22 ± 0.36 b,c | 1.59 ± 0.34 b | 0.72 ± 0.24 d | 1.04 ± 0.21 c,d |
| Colour | ||||||
| ΔE Crust (Baker’s Flour) | - | - | 8.90 ± 1.03 b | 8.39 ± 1.30 b | 9.26 ± 1.25 b | 11.99 ± 1.25 a |
| ΔE Crust (Wholemeal flour) | - | - | 20.91 ± 1.11 a | 20.59 ± 1.07 a | 12.85 ± 0.96 b | 10.52 ± 0.71 c |
| ΔE Crumb (Baker’s Flour) | - | - | 14.64 ± 1.16 c | 15.24 ± 0.95 c | 29.18 ± 0.55 a | 28.31 ± 0.86 b |
| ΔE Crumb (Wholemeal flour) | - | - | 8.54 ± 0.66 d | 9.17 ± 0.75 c | 11.61 ± 0.77 a | 10.50 ± 0.75 b |
| Water Activity | 0.95 ± 0.01 b | 0.96 ± 0.01 a,b | 0.97 ± 0.01 a | 0.97 ± 0.01 a | 0.97 ± 0.01 a | 0.97 ± 0.01 a |
Publisher’s Note: MDPI stays neutral with regard to jurisdictional claims in published maps and institutional affiliations. |
© 2021 by the authors. Licensee MDPI, Basel, Switzerland. This article is an open access article distributed under the terms and conditions of the Creative Commons Attribution (CC BY) license (https://creativecommons.org/licenses/by/4.0/).
Share and Cite
Neylon, E.; Arendt, E.K.; Zannini, E.; Sahin, A.W. Fermentation as a Tool to Revitalise Brewers’ Spent Grain and Elevate Techno-Functional Properties and Nutritional Value in High Fibre Bread. Foods 2021, 10, 1639. https://doi.org/10.3390/foods10071639
Neylon E, Arendt EK, Zannini E, Sahin AW. Fermentation as a Tool to Revitalise Brewers’ Spent Grain and Elevate Techno-Functional Properties and Nutritional Value in High Fibre Bread. Foods. 2021; 10(7):1639. https://doi.org/10.3390/foods10071639
Chicago/Turabian StyleNeylon, Emma, Elke K. Arendt, Emanuele Zannini, and Aylin W. Sahin. 2021. "Fermentation as a Tool to Revitalise Brewers’ Spent Grain and Elevate Techno-Functional Properties and Nutritional Value in High Fibre Bread" Foods 10, no. 7: 1639. https://doi.org/10.3390/foods10071639
APA StyleNeylon, E., Arendt, E. K., Zannini, E., & Sahin, A. W. (2021). Fermentation as a Tool to Revitalise Brewers’ Spent Grain and Elevate Techno-Functional Properties and Nutritional Value in High Fibre Bread. Foods, 10(7), 1639. https://doi.org/10.3390/foods10071639