Article

Construction of IsoVoc Database for the Authentication of Natural Flavours

1
Department of Environmental Sciences, Jožef Stefan Institute, 1000 Ljubljana, Slovenia
2
Jožef Stefan International Postgraduate School, 1000 Ljubljana, Slovenia
3
Agricultural Institute of Slovenia, 1000 Ljubljana, Slovenia
4
Biotechnical Faculty, University of Ljubljana, 1000 Ljubljana, Slovenia
5
Elaphe, 1000 Ljubljana, Slovenia
*
Author to whom correspondence should be addressed.
Foods 2021, 10(7), 1550; https://doi.org/10.3390/foods10071550
Submission received: 2 May 2021 / Revised: 24 June 2021 / Accepted: 30 June 2021 / Published: 5 July 2021
(This article belongs to the Special Issue Food Origin Analysis with Isotope Fingerprints)

Abstract

:
Flavour is an important quality trait of food and beverages. As the demand for natural aromas increases and the cost of raw materials go up, so does the potential for economically motivated adulteration. In this study, gas chromatography-combustion-isotope ratio mass spectrometry (GC-C-IRMS) analysis of volatile fruit compounds, sampled using headspace-solid phase microextraction (HS-SPME), is used as a tool to differentiate between synthetic and naturally produced volatile aroma compounds (VOCs). The result is an extensive stable isotope database (IsoVoc—Isotope Volatile organic compounds) consisting of 39 authentic flavour compounds with well-defined origin: apple (148), strawberry (33), raspberry (12), pear (9), blueberry (7), and sour cherry (4) samples. Synthetically derived VOCs (48) were also characterised. Comparing isotope ratios of volatile compounds between distillates and fresh apples and strawberries proved the suitability of using fresh samples to create a database covering the natural variability in δ13C values and range of VOCs. In total, 25 aroma compounds were identified and used to test 33 flavoured commercial products to evaluate the usefulness of the IsoVoc database for fruit flavour authenticity studies. The results revealed the possible falsification for several fruit aroma compounds.

Graphical Abstract

1. Introduction

Fruits play a significant role in human nutrition. While their consumption depends on several factors, including colour, texture, appearance, and nutritional value, the flavour, which is a combination of aroma and taste, remains the primary selection criteria [1]. The same is valid for fruit-flavoured products where fruity notes continue to play well with all consumers, including those who associate them with health and wellness. The most popular are classic fruit flavours such as apple, berry, and citrus fruits, although flavour preferences are continuously evolving [2]. Most flavourings are produced either by chemical synthesis or by extracting natural materials, although today’s consumers increasingly demand naturally flavoured products [3]. The problem is that the pressure to satisfy consumers and the higher market value of natural flavourings makes naturally flavoured products vulnerable to economically motivated adulteration [4].
New methodologies are being developed to detect food fraud since the analysis of chiral separation of enantiomers, single components, and total aroma spectra have limited applicability [5,6,7]. One such method involves using isotope ratios of light elements such as hydrogen and carbon (2H/1H, 13C/12C), which is increasingly being applied in food quality control and in determining the authenticity of natural flavourings. Much effort has also gone into developing isotopic methods to detect adulteration of natural products with synthetic compounds. Among them, gas chromatography-combustion-isotope ratio mass spectrometry (GC-C-IRMS) seems to be the most specific and sophisticated method that can discriminate between natural and synthetic aromas based on the isotopic values of selected volatile organic compounds, VOCs [7,8,9,10,11,12,13,14,15,16,17,18,19,20,21,22,23,24,25]. The use of GC-C-IRMS is the subject of a review by van Leeuwen et al. [8] and a paper by Strojnik et al. [26] in which the authors emphasise the importance of the relevant analytical conditions to obtain precise isotopic ratios.
Articles on determining the authenticity of fruit volatile organic compounds based on GC-C-IRMS are summarised in Appendix A (Table A1). These studies cover, for example, raspberry [10,13,18,19,27], peach [7,11,23,25], strawberry [7,8,20], apple [16,25,28], nectarine [11,23,25], pineapple [7,9], and orange [15,25]. Many aromatic characteristics are shared between different fruits. However, each fruit is characterised by a distinctive aroma that depends on the VOCs present, concentration and perception threshold of individual volatile compounds [29]. Among these aromatic substances, special attention is paid to those compounds that create a fruit’s characteristic aroma and are, therefore, likely to be falsified [29,30]. Studies looking at more than five different VOCs are scarce [7,12,16,20,22], and within those, only two address more than one fruit type [7,16]. In both studies, headspace solid-phase microextraction (HS-SPME) is used to extract the VOCs. The method offers many advantages such as simplicity, reduced time, improved repeatability, lower sample contamination probability [31], and finally, it does not cause isotopic fractionation [26]. HS-SPME-GC-C-IRMS has been used in all four fruit authenticity studies after 2010, proving its suitability as a tool for authenticity verification [7,15,16,32]. Besides fruits, the method has been successfully applied for determining the authenticity of other aromas such as vanilla [31,33,34], citrus essential oils [15,35], wine [36,37,38], and truffle oil [39].
When assessing authenticity, it is essential to have a comprehensive database of authentic samples [16,40,41,42]. The guidelines on the structure and data collection of such a database are presented by Donarski et al. [41]. For example, verification of aroma authenticity is achieved by measuring the isotope values of investigated aroma compounds and comparing the obtained isotopic values with those of reference samples present in the database. Samples containing one or more compounds outside the range established for authentic aroma compounds will be suspected of being adulterated [18]. A limitation of such a database is that it represents only a snapshot in time and requires continuous updating, evaluation, and processing. In addition, using a single fruit type, which is the case in several studies, is insufficient for determining authenticity since different fruit types can have different isotopic ratios [7,8,11]. In addition, all properties that might influence isotopic values must be carefully studied and included in the database. For example, the aroma extraction process must be investigated for evidence of isotopic fractionation, i.e., enrichment of one isotope relative to another. So far, this phenomena has only been addressed by Elss et al. [28] when investigating the technological processing of apple aroma. In this instance, the authors did not observe any isotopic fractionation.
Obtaining all of the necessary distillates of various fruit types to build a database requires extensive resources. However, this task could be significantly reduced by directly analysing the aroma of fresh fruits. Therefore, the present study deals with constructing a stable isotope database (IsoVoc) based on HS-SPME-GC-C-IRMS data to recognise the authenticity of fruit aroma used in food products. Further, the possibility to use fresh fruits instead of distillates for constructing the authentic database on aroma compounds was also investigated. Thus, the specific objectives were to (1) compare δ13C values of multiple VOCs between distillates and fresh fruit samples (apples and strawberries), (2) compare δ13C values of VOCs between different fruit types to define the natural variability in δ13C values of VOCs, (3) establish a database of δ13C values of authentic natural and synthetic aroma compounds, and (4) identify aroma compounds as markers of fruit flavour authenticity.

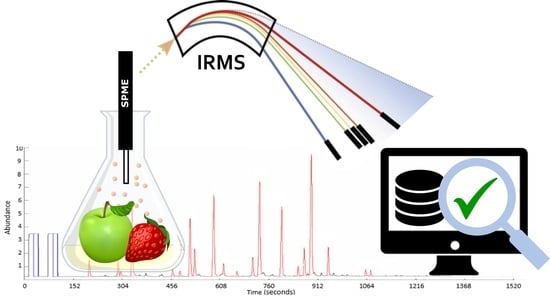
2. Materials and Methods

2.1. Samples

Fresh apples (n = 86), strawberries (n = 17), raspberries (n = 4), blueberries (n = 3) and pears (n = 2) harvested in Slovenia were obtained from the Agricultural institute of Slovenia and from local food producers, between 2016 and 2019. Additional fresh apples were obtained from the Czech Republic (n = 4), Italy (n = 2), Japan (n = 2), Poland (n = 2), and Slovakia (n = 3). Samples of aroma volatiles, recovered in the water phase (used in text as distillates) in apples (n = 43) and strawberries (n = 17), were prepared by steam distillation at the Biotechnical Faculty, University of Ljubljana. Additional distillates of apples (n = 6), strawberries (n = 2), blueberries (n = 4), raspberries (n = 8), sour cherries (n = 4) and pears (n = 7) with known origin were obtained from a commercial flavour supplier.
Pure synthetically derived aroma compounds were obtained from Sigma Aldrich and from a commercial flavour supplier and include (number in the brackets present the number of obtained samples): 1, ethyl acetate (n = 2); 2, ethyl butyrate (n = 2); 3, ethyl 2-methyl butyrate (n = 2); 4, butyl acetate (n = 1); 5, hexanal (n = 3); 6, 2-methyl butyl acetate (n = 2); 7, 1-butanol (n = 1); 8, amyl acetate (n = 1); 9, butyl butyrate (n = 1); 10, (E)-2-hexenal (n = 3); 11, hexyl acetate (n = 1); 12, (E)-2-hexen-1-ol, acetate (n = 2); 13, 1-hexanol (n = 1); 14, (E)-2-hexen-1-ol, (n = 3); 15, benzaldehyde (n = 2); 16, hexyl 2-methyl butyrate (n = 1); 17, methyl butyrate (n = 1); 18, hexyl butyrate (n = 1); 19, propyl acetate (n = 1); 20, methyl acetate (n = 1); 21, 2-heptanone (n = 1); 22, 1-octanol (n = 2); 23, linalool (n = 1); 24, isopropyl butyrate (n = 1); 25, propyl propionate (n = 1); 26, hexanoic acid (n = 1); 27, isoamyl acetate (n = 3); 28, methyl hexanoate (n = 2); 29, acetic acid (n = 1); 30, E-nerolidol (n = 1) and 31, ethyl hexanoate (n = 2).

2.2. Sample Preparation

Fruit samples were mashed and filtered to obtain fresh juice immediately before analysis. Volatile organic components were extracted from both juice, and the distillates using a Divinylbenzene/Carboxen/Polydimethylsiloxane (DVB/CAR/PDMS) SPME fibre (50/30 µm thickness) purchased from Sigma-Aldrich (Supelco, Bellefonte, PA, USA). The SPME fibre was previously conditioned according to the supplier recommendation. The analysis of the VOCs was performed by sampling the headspace of a 10 mL SPME vial (with silicone/PTFE septa) containing 1 mL of sample. The equilibration time was 10 min at 30 °C, followed by extraction for 20 min at the same temperature. The analytes were then desorbed at 250 °C for 1 min. A working standard solution was prepared by diluting 1 µL of each synthetically derived aroma compound (samples 2 to 15) in 20 mL of water, which was then stored at 4 °C before use. All analyses were performed within three months.

2.3. Elemental Analysis-Isotope Ratio Mass Spectrometry (EA-IRMS)

The 13C/12C ratios were determined using a Vario PYRO Cube analyser (OH/CNS Pyrolyser/Elemental Analyzer) couple to an IsoPrime 100 isotope ratio mass spectrometer, IRMS (IsoPrime, Cheadle, Hulme, UK). The accuracy and precision of measurements were controlled using internal working standards: absolute ethanol (δ13C = −27.38 ± 0.09‰) and a rum distillate (δ13C = −13.81 ± 0.09‰) previously calibrated against the certified reference material BCR-656 wine alcohol (δ13C value = −26.91 ± 0.07‰) from the Institute for Reference Materials and Measurements—IRMM, Belgium).
Carbon isotope ratios are expressed in the δ-notation in per mil (‰) relative to the VPDB international standard as follows:
δ13CVPDB (‰) = [(Rsample − Rstandard)/Rstandard] × 1000,
where R refers to the 13C/12C ratios in the sample and standard, respectively. The precision of the measurements was ± 0.1‰.

2.4. Gas Chromatography-Mass Spectrometry (GC-MS)

VOCs were identified using a 7890B & 5977A Series GC/MSD (Agilent Technologies, Santa Clara, CA, USA), where chromatographic separation was achieved on a VF-WAXms capillary column (30 m × 0.25 mm × 0.25 µm; Agilent Technologies, Santa Clara, CA, USA). The overall temperature program was as follows: 40 °C (1 min) to 60 °C at 5 °C min−1 (held 1 min), then to 100 °C at 7 °C min−1, to 180 °C at 10 °C min−1 and finally to 200 °C at 15 °C min−1 (held 1 min). The carrier gas was helium at a constant flow of 1.5 mL min−1. The injection was performed at 250 °C in the split mode (1:10), using a Straight Ultra Inert Liner for SPME (Agilent Technologies, Santa Clara, CA, USA). The ion source was set to 230 °C and the interface temperature to 250 °C, with a scan range of 30 to 400 m/z. The system was controlled using the ChemStation software (Agilent Technologies, Santa Clara, CA, USA). The identification procedure was performed by comparing retention times and mass spectra with the NIST 14 Mass Spectral Library (Agilent Technologies, Santa Clara, CA, USA) and pure standards.

2.5. Gas Chromatography-Combustion-Isotope Ratio Mass Spectrometry (GC-C-IRMS)

Method optimisation and validation are described in detail in Strojnik et al. [26]. Briefly, GC-C-IRMS analysis was performed on Agilent 6890N GC-C system coupled to an IsoPrime GV IRMS. Separation was achieved using an Agilent J&W VF-WAXms capillary column (30 m × 0.25 × 0.25). The overall temperature program was the same as for GC-MS analysis. The carrier gas was also helium at a constant flow of 1.5 mL min−1. Injections were performed at 250 °C in splitless mode. The oxidation reactor (Cu/O) in the 6890N GC/C system was set to 900 °C.
Before each measurement, stability and linearity were checked. Acceptable values were < 0.03‰. Reproducibility and accuracy were determined routinely using the working standard. The 13C/12C ratio was first determined in pure standards and compared with the values obtained by EA-IRMS. Next, the 13C/12C ratios were determined in the distillates and fruit samples. The multiple-point linear method was used for data normalisation [26]. The reproducibility of the measurements based on duplicate analysis ranged from ±0.1 to ±0.5‰. Finally, the identification of aroma compounds was performed by matching the retention times of pure standards and comparing the chromatograms obtained by GC-MS.

2.6. Data Analysis

Metadata (fruit type, fruit variety, processing method, geographical location, and data type, i.e., training or test data) and isotopic values were imported into Excel. Then, data visualisation and data analysis were performed in RStudio. A Mann-Whitney U test for non-normally distributed data was then used to reveal any statistically significant differences. In this case, principal component analysis (PCA) could not be applied since the dataset included many missing values of individual variables.

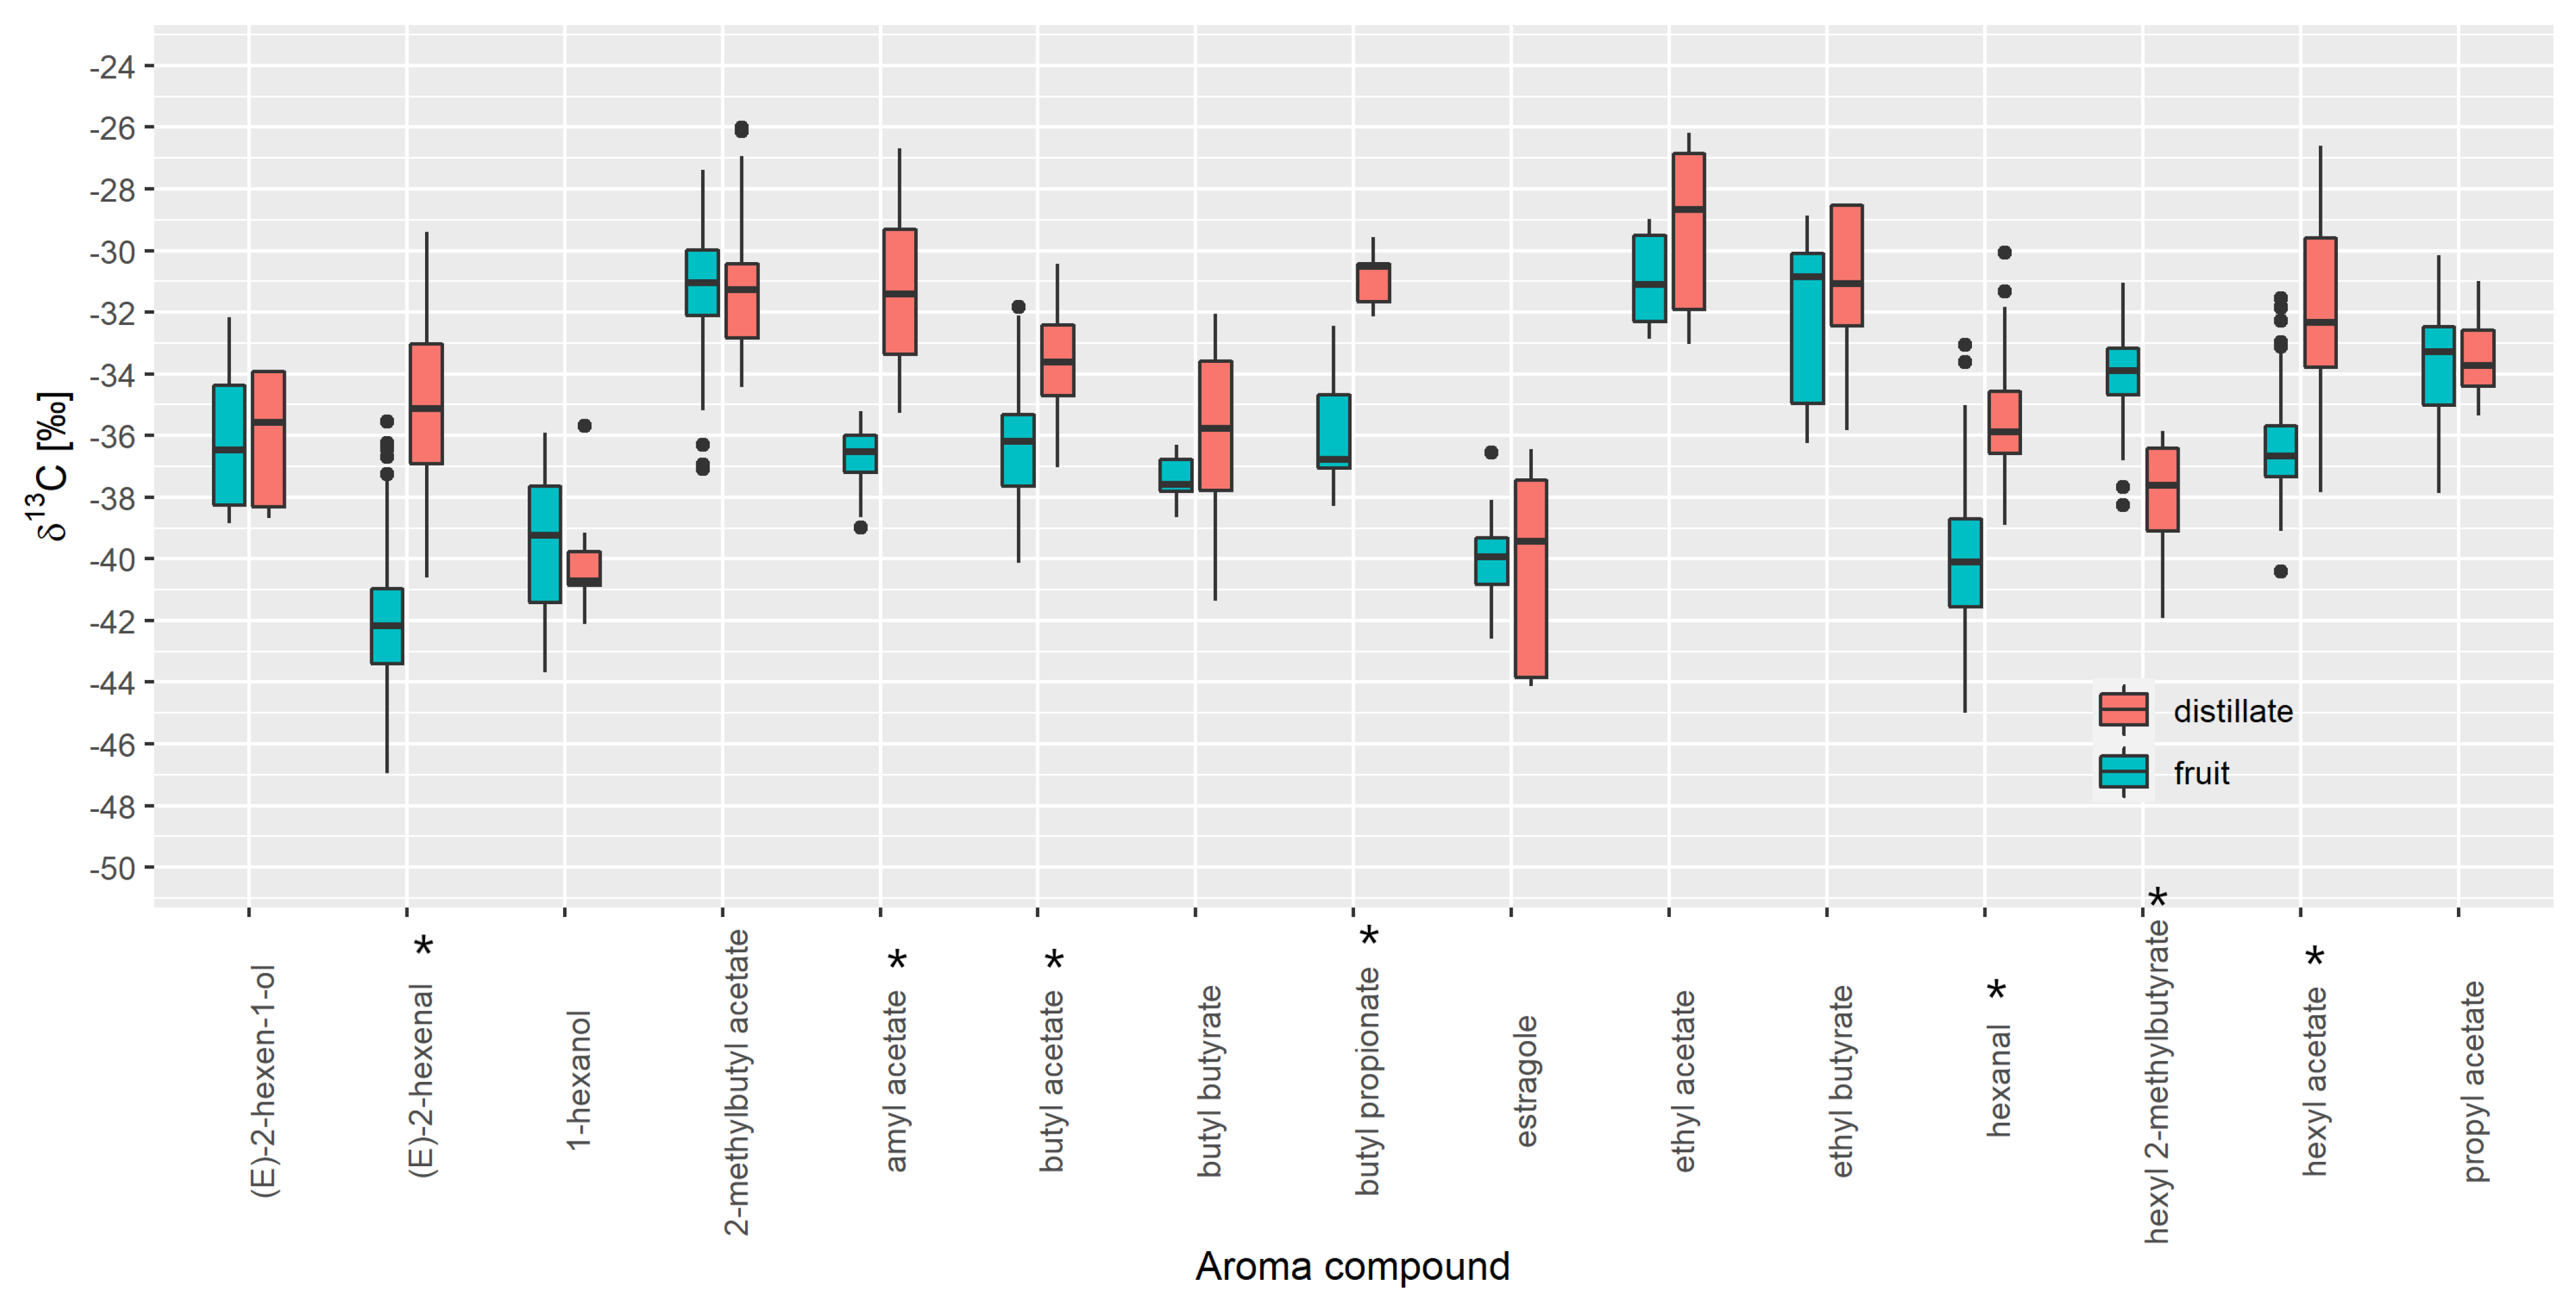
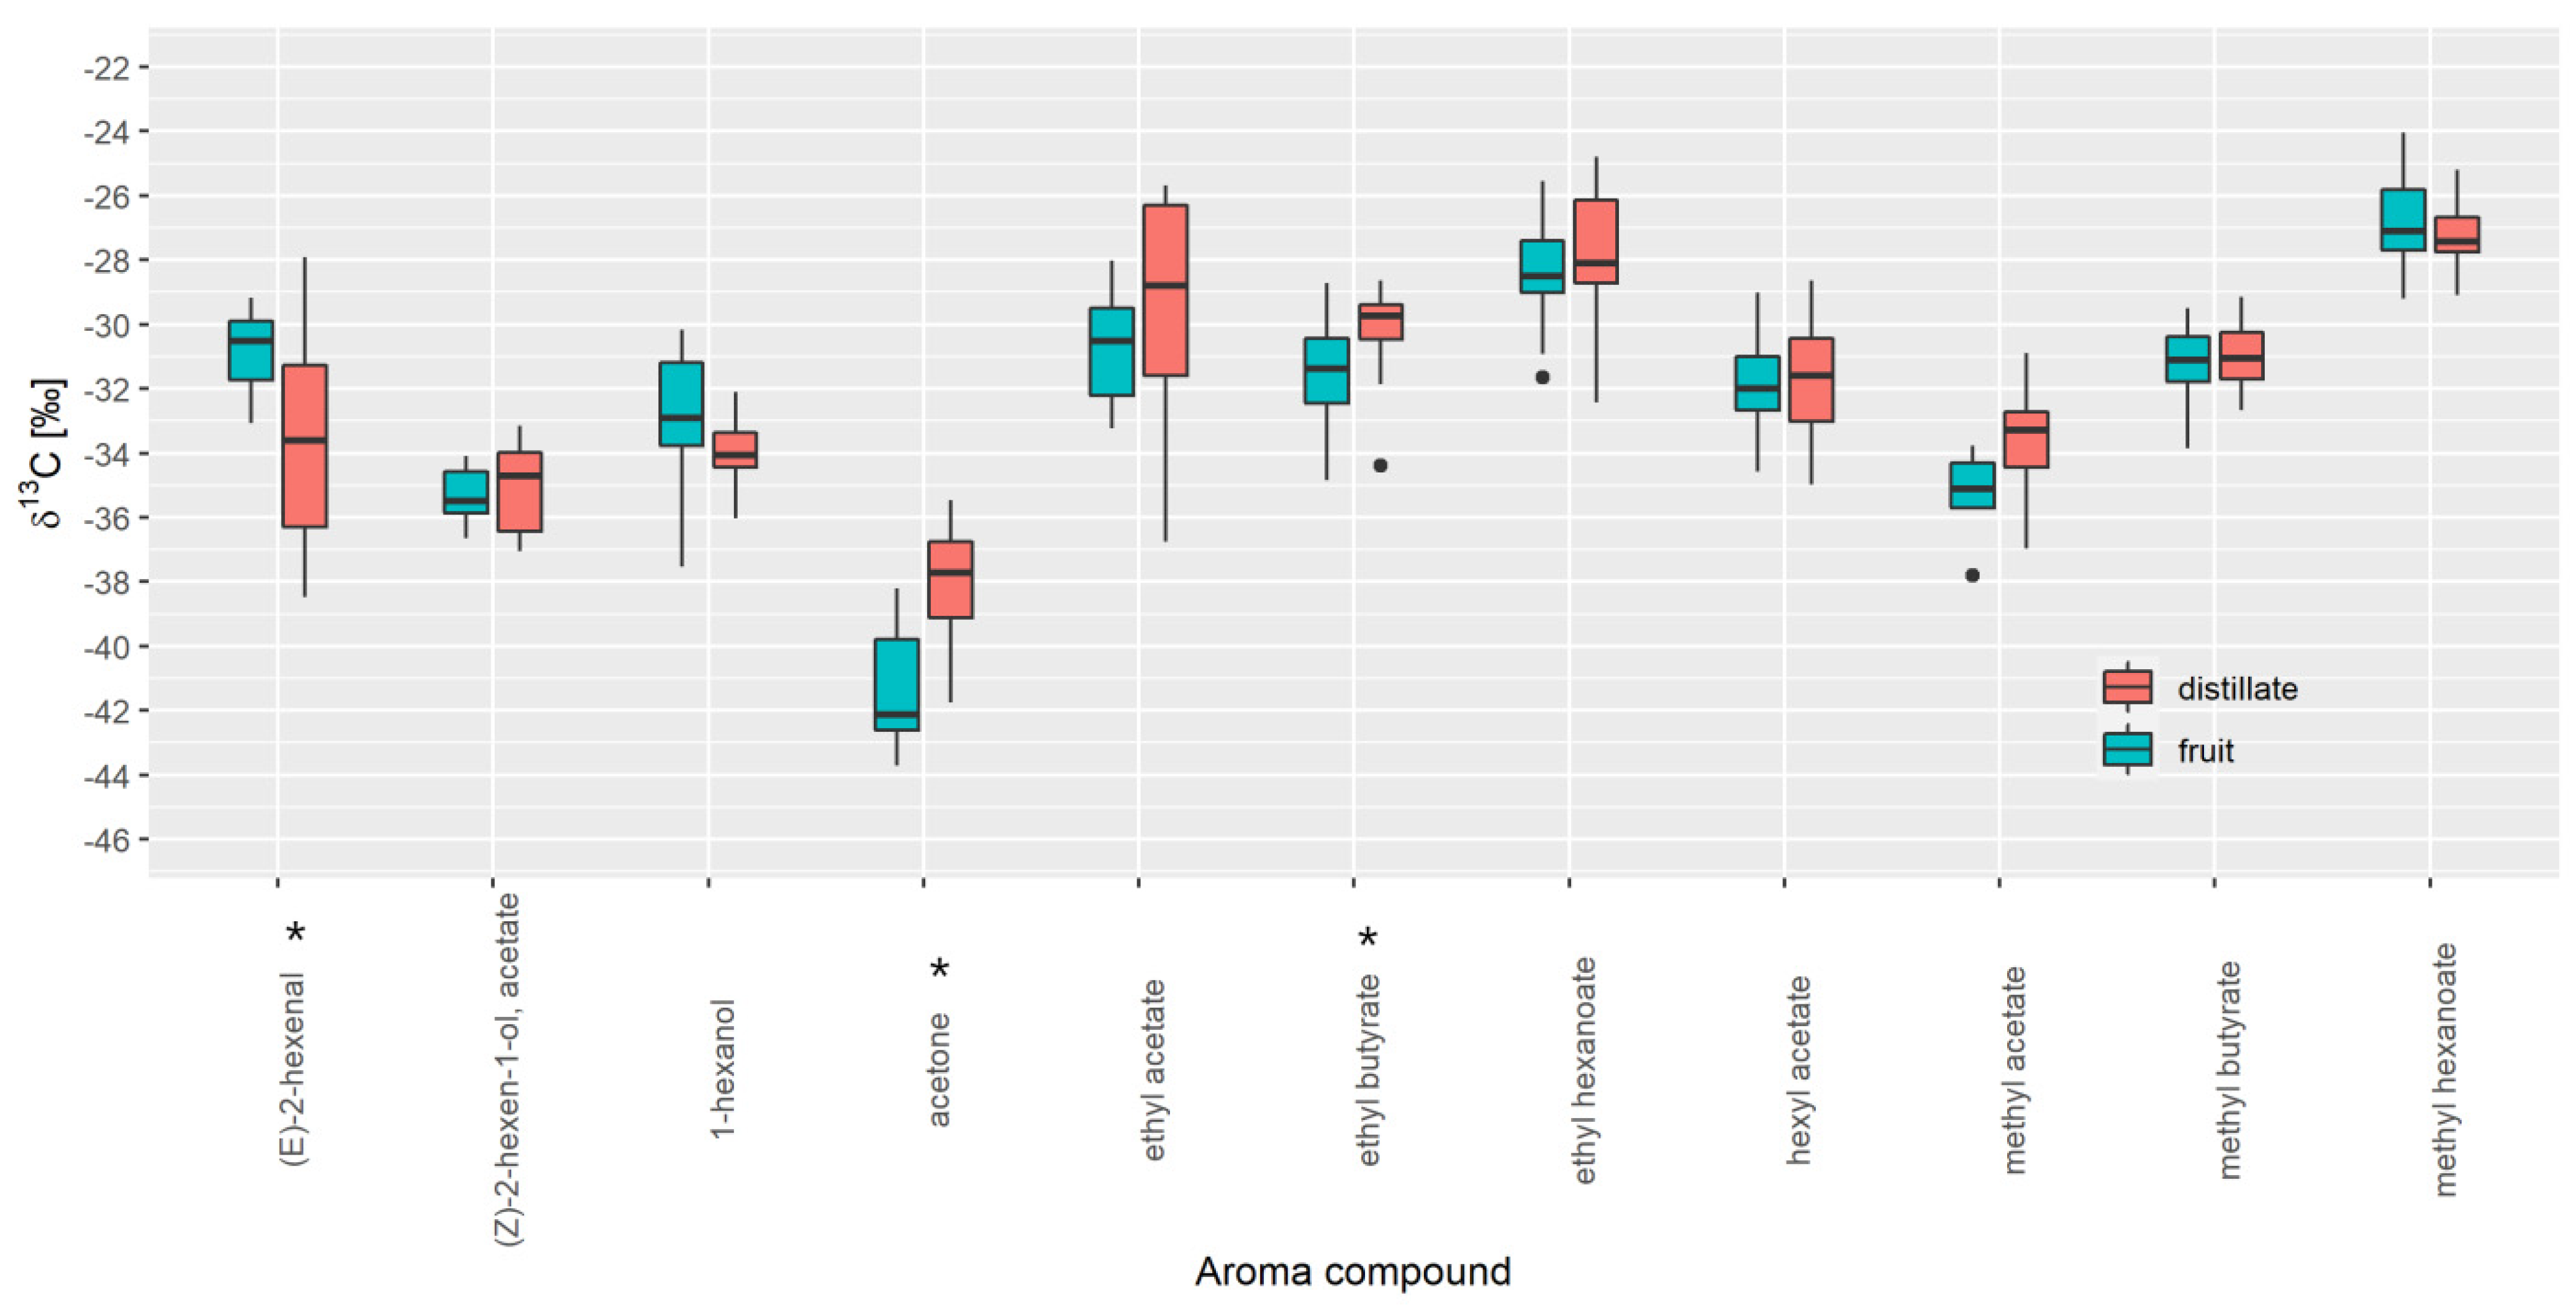
3. Results and Discussion

The primary purpose of creating the IsoVoc stable isotope database for food flavour authentication within the present study is its applicability and usefulness for industrial partners to determine the authenticity of raw ingredients. For this reason, the database must be as broad as possible to cover the widest variety of flavoured fruit products. Therefore, in establishing the IsoVoc database, the following steps were included: selecting authentic reference samples, database creation and authenticity assessment of commercial samples.

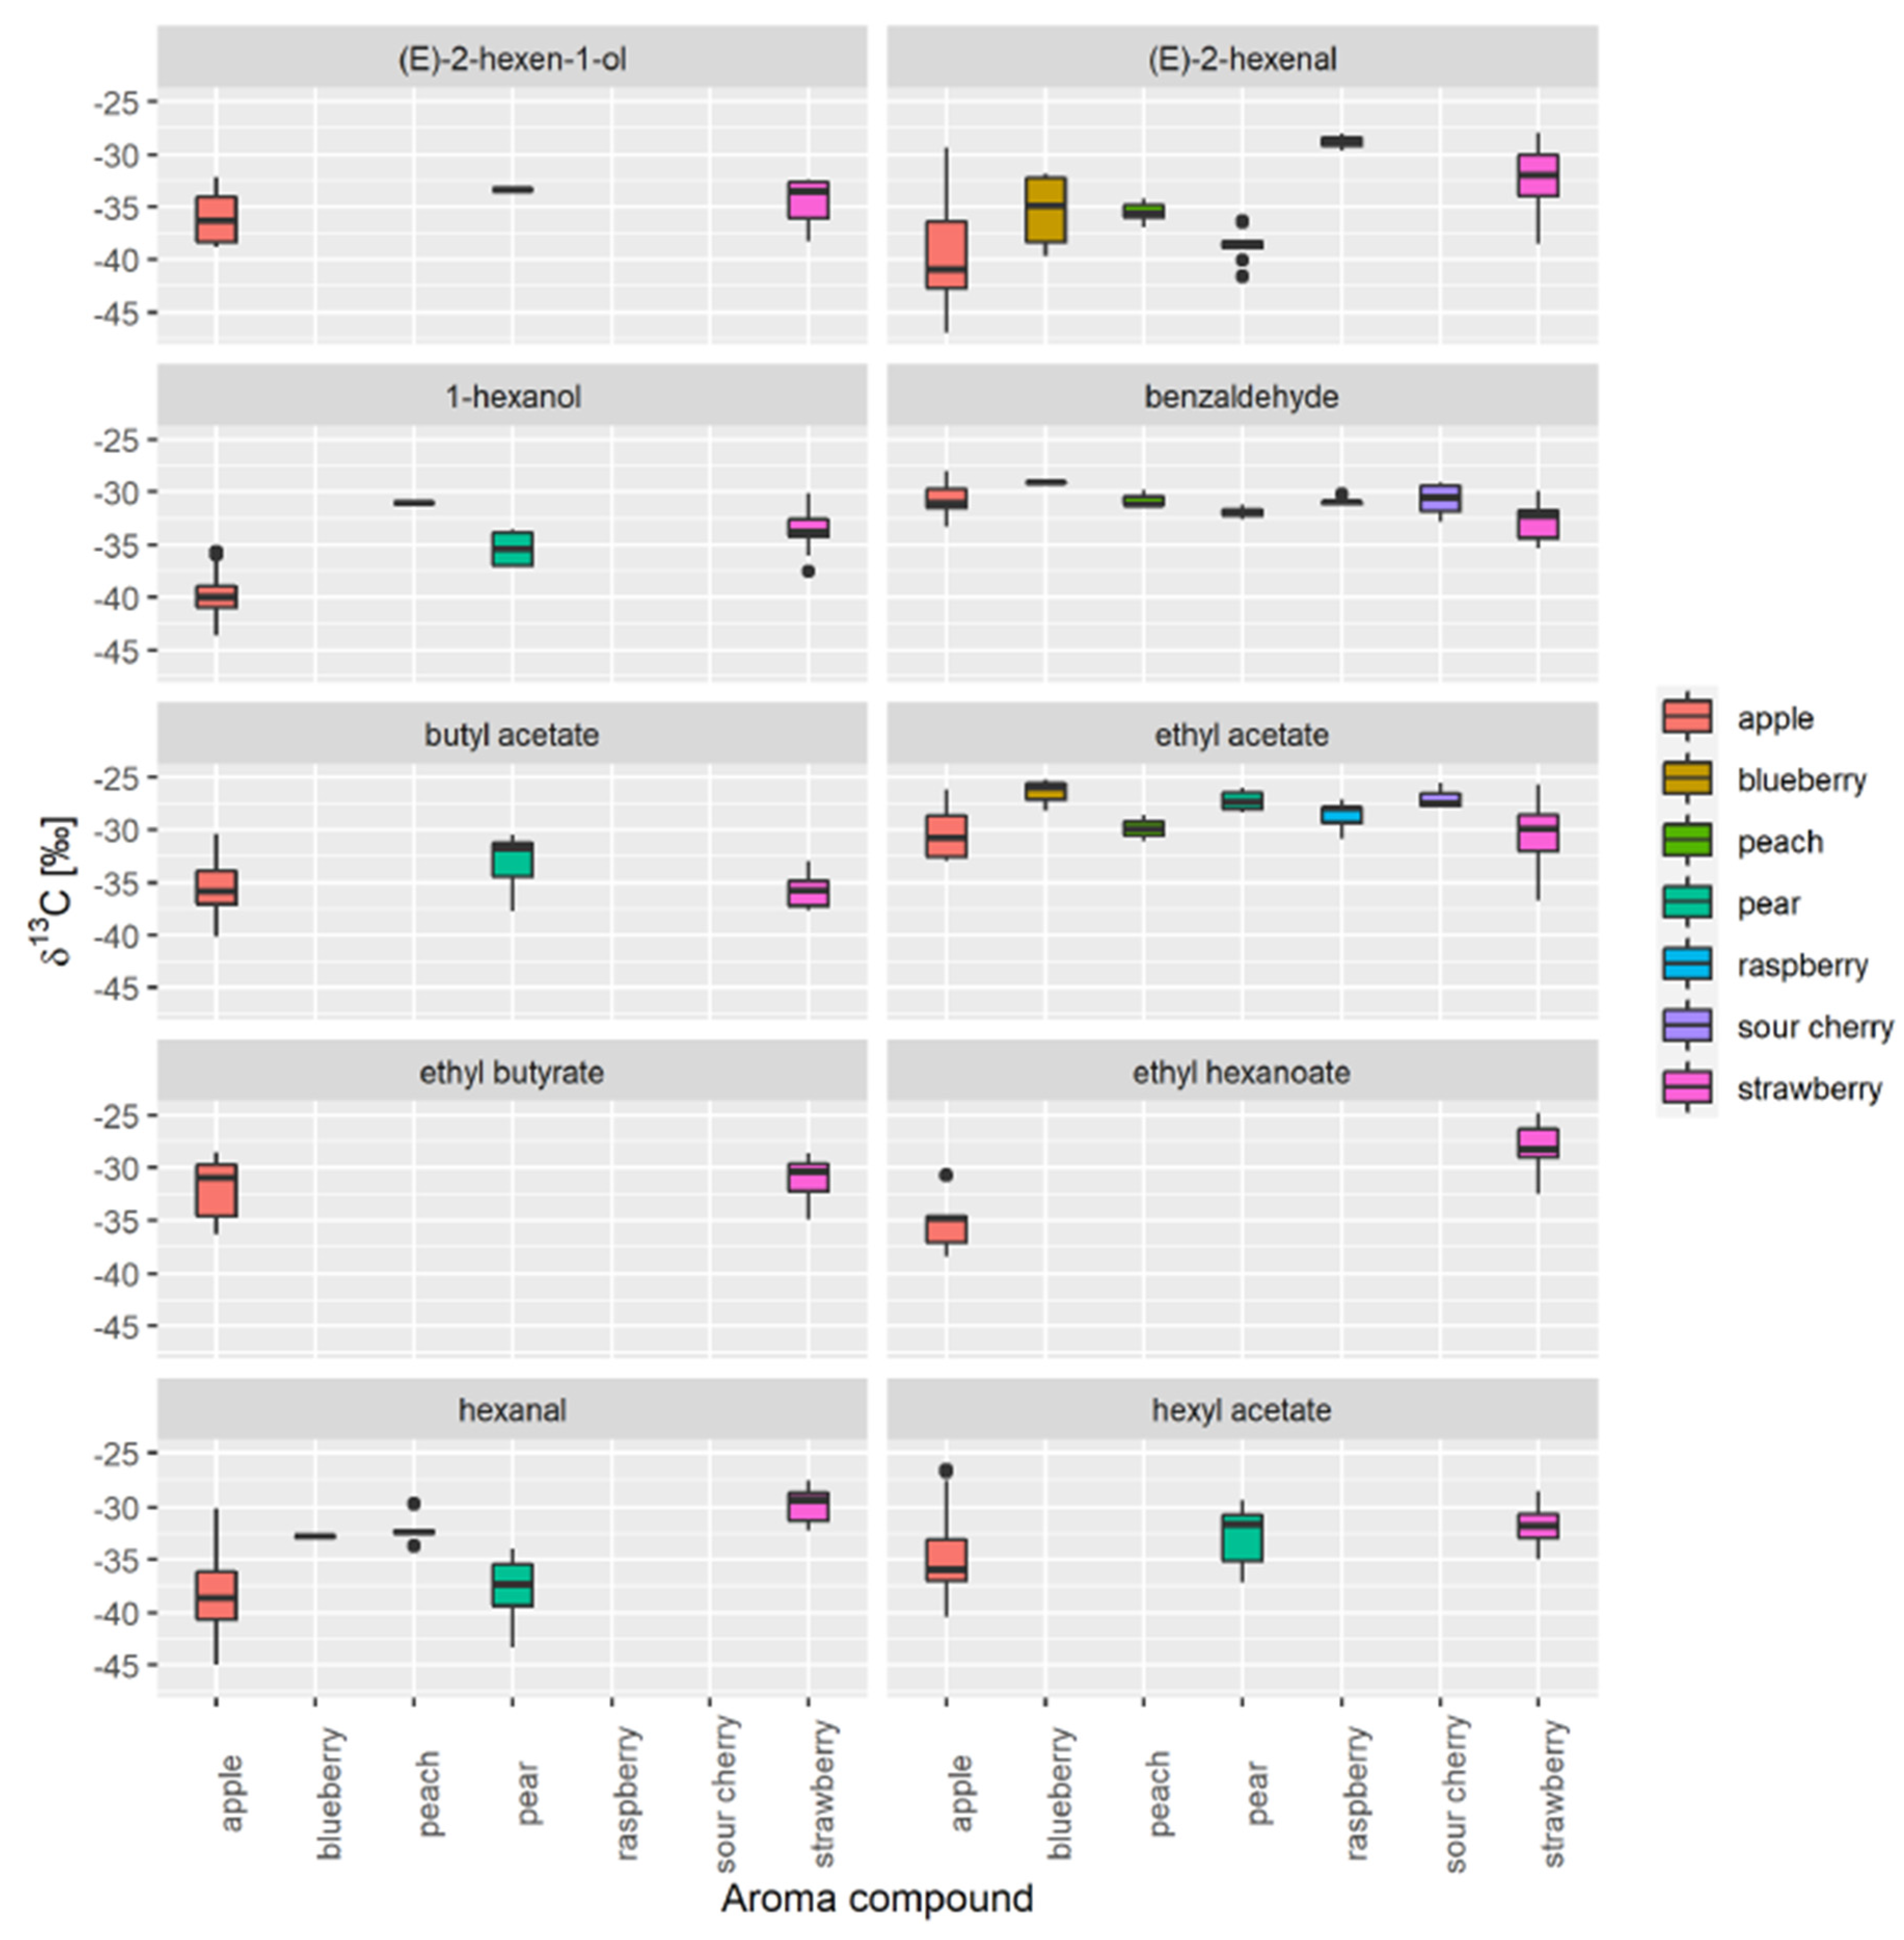
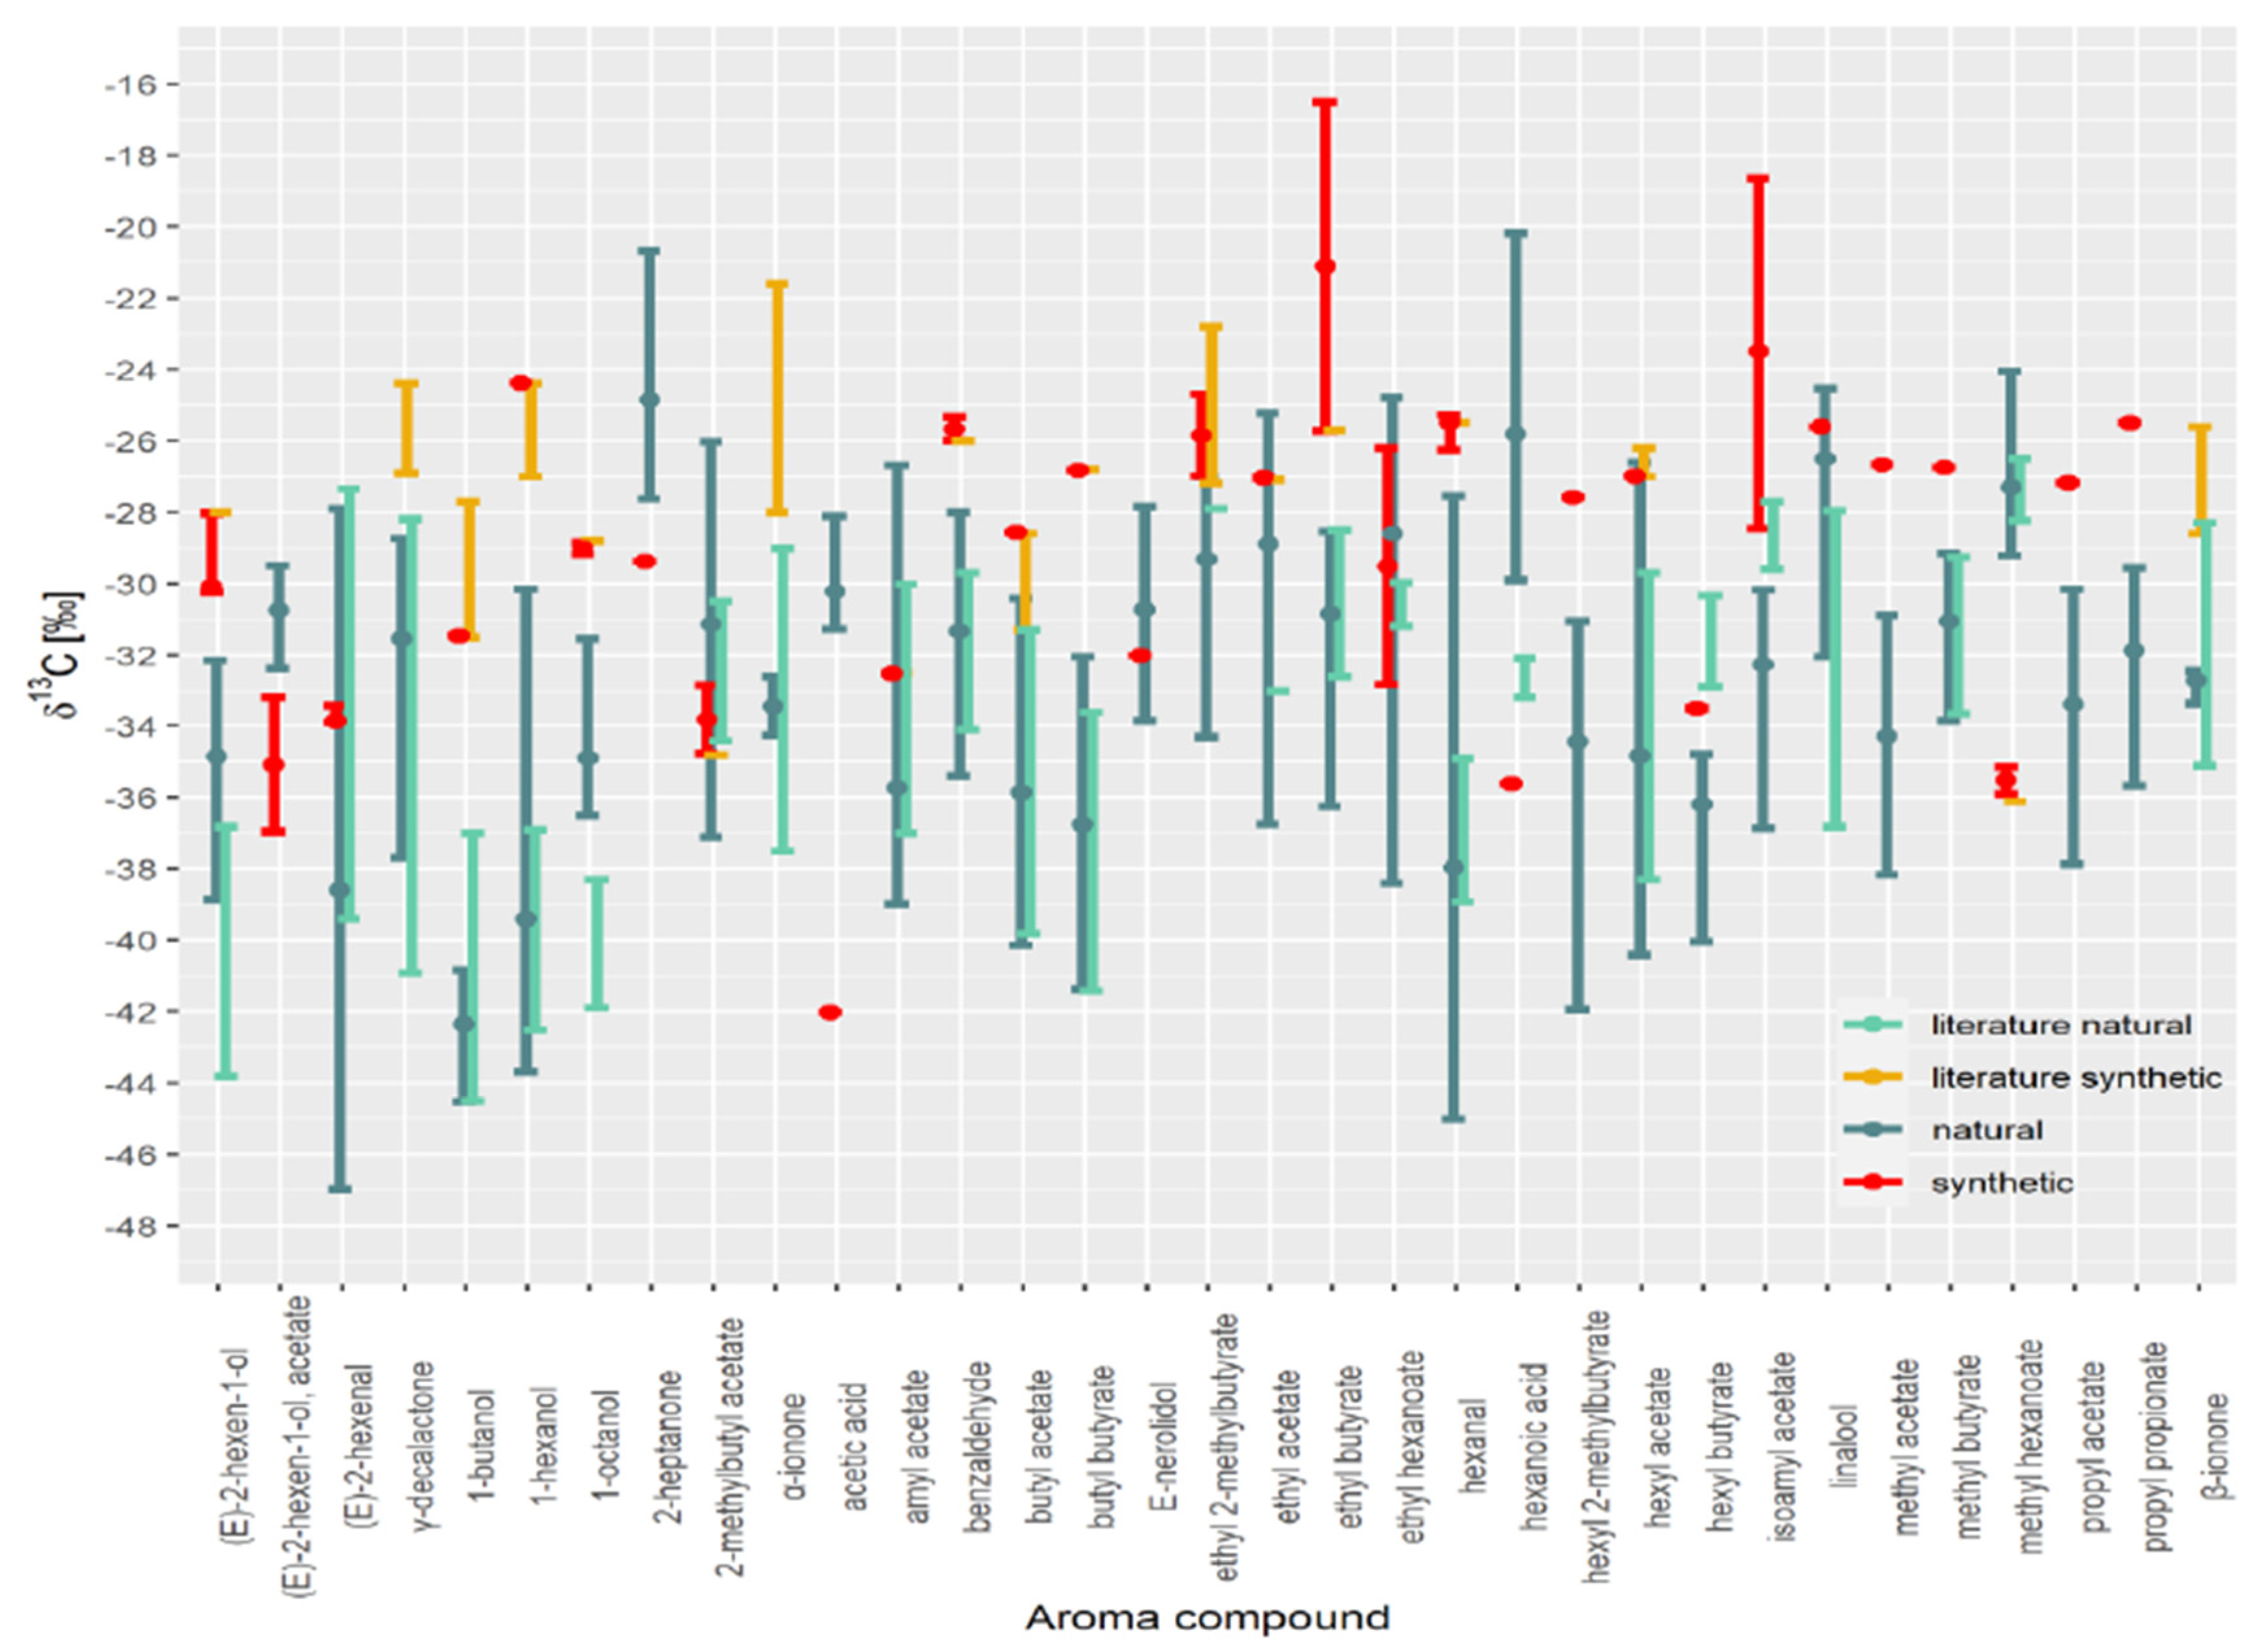
3.1. Selection of Authentic Reference Sample

To address the usefulness of fresh fruits instead of distillates for database creation, we compared the δ13C values of specific VOCs present in distillates and fresh fruit samples of apple and strawberry. Only aroma compounds that occur in at least five samples per group (fruit samples and distillates), wherein the compound must be present in both groups, were accepted for further data analysis. In this way, we identified 15 characteristic aroma compounds for apple and 11 aroma compounds for strawberry.
We included 49 recovery aromas and 99 samples of fresh apple juice (Figure 1). For the 15 aroma compounds, δ13C values ranged between −43.7‰ (acetone in fruit) and −24.1‰ (methyl hexanoate in fruit). A Mann-Whitney U test revealed statistically significant differences in median isotope values for (E)-2-hexanal (−42.2‰; −35.1‰), amyl acetate (−36.5‰; −31.4‰), butyl acetate (−36.2‰; −33.6‰), butyl propionate (−36.8‰; −30.5‰), hexanal (−40.1‰; −35.9‰), hexyl 2-methyl butyrate (−33.9‰; −37.6‰) and hexyl acetate (−36.7‰; −32.3‰) between fruit samples and distillates respectively.
For strawberry, 17 distillates and 17 fresh strawberry samples were analysed (Figure 2). For the selected 11 aroma compounds, δ13C values ranged between −47.0‰ ((E)-2-hexenal in fruit) and −26.0‰ (2-methylbutyl acetate in distillate). In this case, the Mann-Whitney U test revealed statistically significant differences for (E)-2-hexanal, (−30.5‰; −33.6‰), acetone (−42.1‰; −37.7‰) and ethyl butyrate (−31.4‰; −29.7‰) between fruit samples and distillates, respectively.
Data analysis also revealed several outliers in apple and strawberry that were not a result of analytical problems or random errors but are likely due to differences in variety, stage of maturity, and geographical origin, although further investigation is required. The outliers were not removed from the database. It is also necessary to consider natural isotopic variation caused by, e.g., geographical location, variety, temporal and seasonal variation, and processing to make the database more robust. Further, before data analysis it is important to understand if various technological processes such as distillation cause any isotope fractionation in isotopic values of aroma compounds in specific sample type. When comparing distillates with the freshly prepared fruit juice, we observed a difference in δ13C values for seven investigated VOCs in apple and three in strawberry. Although Ells et al. [28] did not find a significant isotopic effect caused by technological treatment for (E)-2-hexanal, (E)-2-hexanol, and hexanal, in this study, we found that for (E)-2-hexanal and hexanal, preparing the fresh juice can modify the isotopic data. In apple, the isotopic values for (E)-2-hexanal are lower for fruit juice than distillates. In the case of strawberry aroma, the opposite is true. Except for hexyl-2-methyl butyrate, the median isotope values are lower in the fruit samples. Isotope fractionation that we observed in many volatile compounds is most likely compound dependent. For volatiles that are produced as a result of tissue disruption (secondary compounds, like aldehydes (E)-2-hexanal and hexanal), it seems that different types of fruit processing can cause isotope fractionation in different ways resulting in the difference in isotopic ratios between distillates and fruit juice samples. Beside fruit processing, different fractionation of compounds could be a consequence of flavour changes occurring through maturation, harvest, and subsequent storage. We also observed some differences in isotope values between varieties (such as in red delicious for apples) and samples from different geographical locations (samples from Poland and Japan differentiate from Slovenian ones) that could be important when understanding isotope fractionation rates. However, we cannot draw any general conclusion on this subject since we are dealing with a limited number of samples, and further investigation in this field is required.
Importantly, the following question arises: can fresh fruit samples substitute distillates in the database? For all aroma compounds where the δ13C values are within the min and max value of the distillates, this is possible, as in the case of 1-hexanol, (E)-2-hexen-1-ol, 2-methylbutyl acetate, ethyl butyrate, and propyl acetate for apples and 1-hexanol, ethyl butyrate, hexyl acetate, methyl butyrate, and methyl hexanoate for strawberries. That means that an authenticity assessment will not be influenced by this effect. However, if we want to cover more fruit VOCs, we need to include both distillates and fruit samples in the database.
Next, for apple and strawberry, distillates and fruits were first combined into a single group (Figure 3). Finally, we compared the data with that for raspberries, blueberries, peaches, pears, and sour cherries to find out which aroma compounds are common to the selected fruit types and which occur most frequently. We then evaluated the δ13C values of 1-hexanol, (E)-2-hexen-1-ol, (E)-2-hexenal, benzaldehyde, butyl acetate, ethyl acetate, ethyl butyrate, ethyl hexanoate, hexanal, and hexyl acetate. We also found that apples and strawberries account for most of the most variability in the natural range of δ13C values and contain the highest number of VOCs, which makes them the most appropriate fruits for database creation.

3.2. Database Creation

The number of unique VOCs present in at least five samples was 39 (Table 1). Not all variables were present in all samples. Since the dataset included many missing values for individual variables and contained only δ13C values for authentic natural samples and not for the synthetic samples, we used the Mann-Whitney U test rather than principal component analysis, PCA. We also excluded butyl propionate, isobutyl acetate, estragole, acetone, (Z)-2-hexen-1-ol, acetate, and isopropyl butyrate from Table 1, since there are no data on δ13C values reported in the literature. However, the δ13C values for authentic compounds determined in our study are presented, since they could be of a general interest to other researchers and are as follows:: butyl propionate (n = 18; δ13C from −38.3 to −29.6‰), isobutyl acetate (n = 8; δ13C from −34.6 to −27.7‰), estragole (n = 34; δ13C from −44.1 to −36.5‰) in apple, and acetone (n = 23; δ13C from −43.7 to −35.5‰), (Z)-2-hexen-1-ol, acetate (n = 14; δ13C from −37.1 to −33.2‰) and isopropyl butyrate (n = 9; δ13C from −52.9 to −45.1) in strawberry.
All authentic samples were combined in one range (shown in dark green in Figure 4). What is clear is the overlap between individual ranges in δ13C values. Most data are in good agreement with literature data. For example, Elss et al. [28] reported δ13C values for trans-2-hexenal ranging from −39.1 to −31.5‰, 1-hexanol ranging from −42.5 to −38.4‰ and trans-2-hexenol ranging from −42.2 to −36.8‰ in apple aroma.
However, for certain VOCs, the authentic range of δ13C values observed in the literature is slightly shifted (e.g., 1-octanol, (E)-2-hexen-1-ol, hexanoic acid, hexyl butyrate, isobutyl acetate and linalool) compared with this study. For example, isoamyl acetate δ13C values for bananas are higher, ranging from −29.6 to −27.2‰ [22] compared to our study. This difference likely results from the different preparation method used or technological production, or unique fruit characteristics. In addition, the broad range of δ13C values in the literature data for γ-decalactone, α-ionone, β-ionone is most likely due to the low number of samples and, consequently, the smaller variation in δ13C values in samples used in our study. The δ13C values for γ-decalactone and δ-decalactone in prunus fruits such as peaches, apricots, and nectarines ranged from −38.4 to −34.0‰ [11] and were lower compared to strawberries, where the δ13C values of γ-decalactone ranged from −31 to −28‰ [7]. In this study, the δ13C values for γ-decalactone in organically produced strawberries range from −29.7 to −28.2‰ and cannot be distinguished from other natural strawberry samples. Raspberry has also been subjected to isotope analysis [13]. The δ13C values for α-ionone, β-ionone, and α-ionol in these samples ranged from −36.6 to −30.3‰, which shows that it is possible to differentiate between natural and synthetic derived compounds. Although compounds appearing in peach and raspberry are well researched, many more samples are needed to represent better the actual variation in δ13C values for those compounds.
A database should not contain only the isotopic values of authentic natural samples. For example, we observed several overlaps in the isotopic values of synthetic samples, which meant that it was not possible to differentiate between natural and synthetic samples, mainly (E)-2-hexanal, 2-methylbutyl acetate, amyl acetate, E-nerolidol, ethyl acetate, ethyl hexanoate, hexyl acetate, and linalool δ13C values. In addition, having only natural aroma compounds in the database is likely to result in samples being misclassified. Different market brands should also be analysed to increase the range of δ13C values observed in synthetic samples.
Despite this overlap, the method could successfully separate 25 of the 33 VOCs for which we have data for the synthetic compounds (γ-decalactone, α-ionone, β-ionone from the literature).

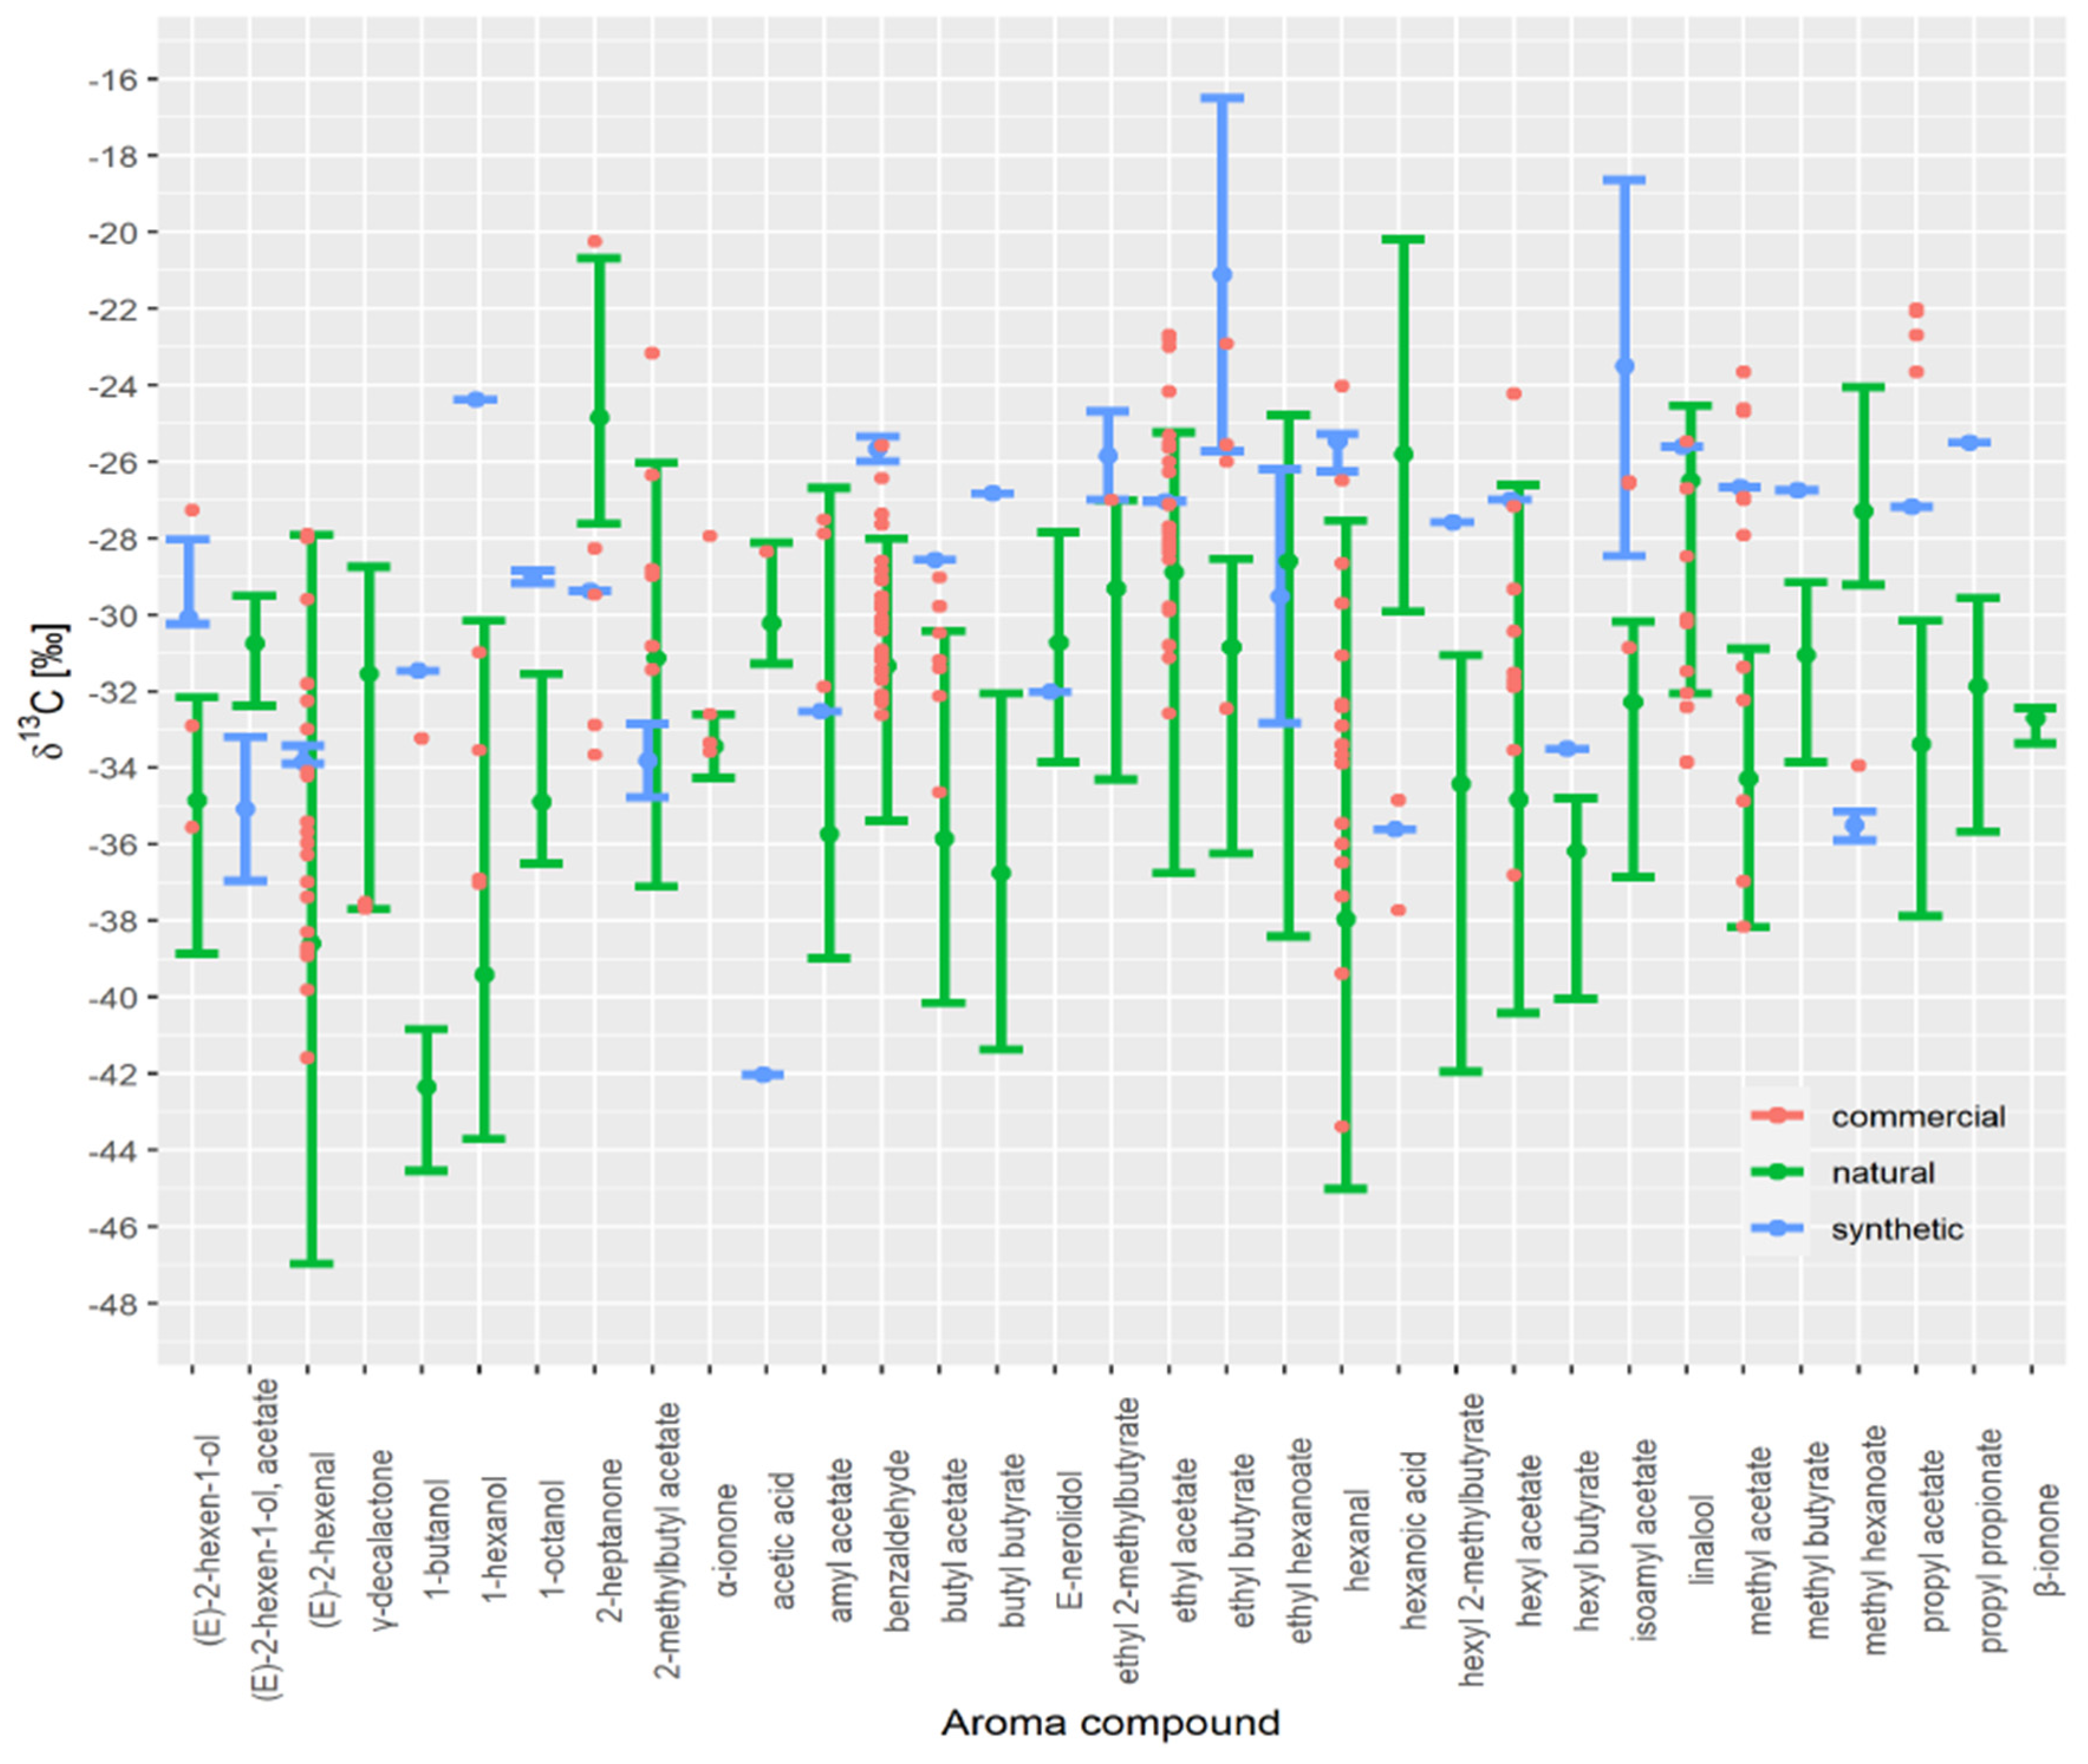
3.3. Authenticity Assessment of Commercial Samples

Based on isotopic mass balance using δ13C values of individual compounds, estimating the average amount of synthetic compound in the sample is possible, as shown by Strojnik et al. [16]. Here we adapted the method to work for any distribution, not necessarily a normal one, where δ13C distribution is described by the min, max, and median value. Thus, the δ13C value of a mixture (mix) of two compounds, both natural (nat) and synthetic (syn), can be expressed with the following relationship:
δ 13 C m i x = ( 1 x ) δ 13 C n a t + x δ 13 C s y n ,
where fraction x corresponds to the added synthetic compound in the mixture, and in the case where x = 0.5, both components are present in equal amounts. Assuming an extensive dataset of samples that is representative of the population, we can use δ 13 C n a t , m a x   a n d   δ 13 C n a t , m i n as the range of δ13C values in natural compounds (with a median value M) to estimate the lowest value x that can be detected for compounds in those regions where natural and synthetic samples are separated.
When the range of synthetic δ13C values is higher than the natural range, we use the following expression:
x = δ 13 C n a t   m a x δ 13 C n a t δ 13 C s y n δ 13 C n a t .
For example, we chose benzaldehyde with a median δ13Cnat value of −31.3‰ and max value δ 13 C n a t   m a x of −28.0‰. If the median δ13Csyn value is −25.7‰, then x = 0.59, meaning that if a mixed sample contains more than 59% of a synthetic fraction, it is likely (with 50% chance) that adulteration will be suspected since the shift in the δ13C values will be significant (i.e., out of range of natural compounds). If the calculation is made using the minimum measured values of δ13Cnat = δ13Cnat min and δ13Csyn = δ13Csyn min, then x = 0.79, meaning that if a mixed sample contains more than 79% of a synthetic fraction, the measured δ13C value will fall out of natural sample range.
If the range of synthetic δ13C values is lower than natural ones, the corresponding fraction x of a synthetic sample is calculated by replacing the maximum values of the measured ranges with the minimum values and vice versa. The detectable fractions of synthetic compounds for different VOCs are presented in Table 2.
The necessary synthetic fraction of selected aroma compounds lies between 5% and 83% for a 50% detection threshold and between 19% and 100% for a 100% detection threshold. Therefore, the method is the most sensitive for detecting adulteration with β-ionone, acetic acid, α-ionone, and 1-butanol and less sensitive at detecting adulteration of ethyl 2-methyl butyrate and hexanal. However, evaluating their usefulness will require a study on how adding different amounts of synthetic aroma compounds to a sample with a weak intrinsic aroma can affect the odour.
Finally, we assessed the authenticity of 33 commercial fruit flavourings, including natural banana, blueberry, peach, grape, pear, apple, strawberry, kiwi, raspberry, blackberry, plum, and sour cherry aroma. A shift in the δ13C values towards the synthetic range for 2-heptanone, benzaldehyde, butyl acetate, ethyl butyrate, hexanal, hexanoic acid, isoamyl acetate, methyl acetate, methyl hexanoate, and propyl acetate suggest the possible falsification of specific fruit VOCs despite being labelled as natural fruit extracts (Figure 5). Results imply that the authenticity of flavoured products on the market can be questioned, and extensive testing is necessary.
We can also estimate the amount of synthetic fraction x present in the commercial fruit distillates by using the measured δ 13 C m i x   values and the minimum, maximum, or average synthetic fraction from the variability of data defining the natural and synthetic database range. By using the median values of VOCs for natural and synthetic samples ( δ 13 C n a t and δ 13 C s y n ) we can estimate the median amount of the added synthetic fraction. In the same way, we can also determine the maximum and minimum range of synthetic fraction by using limit database values (minima or maxima) of natural and synthetic samples. Table 3 shows examples for several measured commercial samples that fall outside of the natural range. For example, in the exemplary case of benzaldehyde where the commercial sample has a δ13C = −26.4‰, using the max value of the synthetic range (−25.3‰) and natural range (−28.0‰), we can estimate that the minimum amount of synthetic fraction is 59%, but it can range up to 95%.
It is impossible to distinguish certain synthetic (petroleum-based) VOCs from natural ones since they can have a δ13C signature similar to that of a plant [42], which was also observed in our study for (E)-2-hexanal, 2-methylbutyl acetate, amyl acetate, E-nerolidol, ethyl acetate, ethyl hexanoate, hexyl acetate, and linalool. Therefore, developing an HS-SPME-GC-IRMS method for 2D-isotope fingerprinting (13C and 2H) of VOCs would be needed to prove their natural authenticity.

4. Conclusions

The falsification of natural flavours by either dilution, mixing with synthetic compounds, or false declaration of origin of natural ingredients creates a demand to control their authenticity. HS-SPME-GC-C-IRMS analysis of volatile fruit compounds is a valuable tool for differentiating between synthetic and naturally occurring aromas and, together with a database containing flavour compounds with well-defined origins, can be used for authenticity assessment. However, selecting suitable reference samples that need to be analysed to create such a database is critical. When comparing distillates with freshly prepared fruit juice, differences in isotope values in some of the investigated VOCs in apple and strawberry samples is observed. We needed to include both distillates and raw fruit samples to obtain maximal natural stable isotope variability of selected VOCs. A database of δ13C values for 39 aroma compounds present in fruit and distillate samples (apples, strawberries, blueberries, pears, raspberries, peaches, and sour cherries) and 31 VOC of synthetic origin were established. This study proves that samples of apple and strawberry are sufficient for database construction regarding the variability in δ13C values. The data are comparable with literature data, and despite some overlap between the natural and synthetic range of values, the method allows the successful separation of 25 of the 33 target VOCs. When testing commercial fruit distillates, the results show possible falsification for several fruit aroma compounds. However, extensive testing of flavoured products on the market is necessary to determine the extent of adulteration and evaluate the usefulness of IsoVoc for different flavoured products. Moreover, the development of an HS-SPME-GC-IRMS method for 2H/1H ratio determination of fruit VOCs is required to upgrade the existing database, which could be more successfully used in fruit flavour authenticity studies.

Author Contributions

Conceptualisation, L.S.; methodology, L.S., E.Z., D.K.; software, L.S. and M.S. (Martin Strojnik); validation, L.S.; formal analysis, L.S.; investigation, L.S.; resources, N.O., J.H., N.C.W., D.K., M.S. (Matej Stopar); data curation, L.S.; writing—original draft preparation, L.S.; writing—review and editing, N.O.; visualisation, L.S., M.S. (Martin Strojnik); supervision, N.O.; project administration, N.O.; funding acquisition, N.O. All authors have read and agreed to the published version of the manuscript.

Funding

This research received no external funding.

Institutional Review Board Statement

Not applicable.

Informed Consent Statement

Not applicable.

Data Availability Statement

No data available.

Acknowledgments

The research was performed in the framework of the Slovenian Smart Specialisation Program: Food for Future, financially supported by the Ministry of Education, Science and Sport under GA no. C3330-16-529005 and takes part in MASSTWIN (H2020, GA no. 692241), ERA Chair ISO-FOOD (FP7, GA no. 621329) projects and P1-0143 program financially supported by Slovenian Research Agency. The authors would like to thank Stojan Žigon for technical support.

Conflicts of Interest

The authors declare no conflict of interest.

Appendix A

Supplementary data to this article can be found in Table A1.
Table A1. Literature data on stable isotope analysis of fruit volatile organic compounds.
Fruit TypeMethod of
Sample
Preparation a
Stable
Isotopic Value
Samples with Known Origin (No. Samples)Aroma Compound (No. of Samples Where VOC Was Detected)Reference
strawberry, peach, plum, apricotSDEδ13Cfruit (NS); synthetic (NS);
microbial (NS)
γ-decalactone (7; 3; 2)[8]
raspberriesNAδ13Cfruit (NA); synthetic (NS);biotechnological (NS)(E)-α-ionone (2; NS; NS), (E)-β-ionone (2; NS; NS)[18]
bergamot oilSCF extractionδ13Cessential oil (2)linalyl acetate (NS), limonene (NS), linalool (NS), β-pinene (NS), γ-terpinene (NS), β-mycrene (NS), neryl acetate (NS),
geranyl acetate (NS)
[5]
raspberriesNAδ13Cfruit (NS)α-ionone (NS), β-ionone (NS), δ-decalactone (NS), cis-3-hexen-1-ol (NS)[19]
strawberrySDEδ13Cfruit (NS)methyl hexanoate (NS), pentyl valerate (NS), butanoic acid (NS), 2-methylbutanoic acid (NS), 4-methylvaleric acid (NS),
hexanoic acid (NS), γ-decalactone (NS), γ-uncalactone (NS), γ-dodecalactone (NS)
[20]
raspberrySCF extractionδ13Cfruit (NS); synthetic (NS)(E)-α-ionone (NS), (E)-β-ionone (NS)[27]
bananaLLEδ13Cfruit (7)pentan-2-one (NS), isobutyl acetate (NS), isoamyl acetate (NS), pentan-2-ol (NS), isobutyl butyrate (NS), isoamyl butyrate (NS),
isoamyl isovalerate (NS), isobutyl acetate (NS), isoamyl acetate (NS), isoamyl alcohol (NS), isoamyl butyrate (NS)
[22]
bitter almond oils, sweet cherry, sour cherry, peach,
nectarine
SDEδ2Hfruit (NS);
essential oil (NS);
synthetic (NS);
“natural” (NS)
benzaldehyde (NS)[23]
cactus pearSDEδ13Cfruit (NS)1-hexanol (NS), E-2-hexenol (NS), E-2-nonenol (NS), E,Z-2,6-nonadienol (NS)[24]
different essential oils, orange,
apple,
nectarine/peach
LLE, SDEδ2Hfruit/juice/aroma (NS);
essential oil (NS);
synthetic (NS);
“natural” (NS)
linalool (5; 50; 0; 1), linalyl acetate (0; 19; 5; 2), E-2-hexenal (23; 0; 5; 4), E-2-hexenol (35; 0; 5; 0)[25]
pineappleLLEδ13C, δ2Hfruit/recovery aroma (16);synthetic (NS);
“natural” (NS)
methyl 2-methylbutanate (6; 5; 2), ethyl 2-methylbutanoate (9; 5; 6), methyl hexanoate (17; 5; NA), ethyl hexanoate (14; 0; 0),
2,5-dimethyl-4-methoxy-3-(2H)-furanone (12; 1; 0)
[9]
raspberriesSDEδ13C, δ2Hfruit (NS);
nature-identical (NS); “natural” (NS)
(E)-α-ionone (10; 4; 1), (E)-β-ionone (10; 4; 1)[10]
peach,
apricot,
nectarine
SDEδ13C, δ2Hfruit (18);
nature-identical (NS); “natural” (NS)
γ-decalactone (16; 2; 5), δ-decalactone (12; 1; 3)[11]
pearSDE, LLEδ13C, δ2Hfruit (20); synthetic (NS); “natural” (NS)butyl acetate (14; 3; 3), 1-butanol (18; 3; 2), hexyl acetate (16; 2; 7), 1-hexanol (3; 11; 8), methyl E, Z-2,4-decadienaoate (6; 2; 0),
ethyl E,Z-2,4-decadienoate (10; 5; 3), ethyl E,E-2,4-decadienoate (2; 0; 0)
[12]
appleSDEδ13C, δ2Hjuice/recovery aroma (62)E-2-hexenal (NS), 1-hexanol (NS), E-2-hexenol (NS)[28]
raspberry, litsea cubeba, lemongrassSDEδ13C, δ2Hfruit (8); essential oil (NS); synthetic (NS);
“natural” (NS)
acetone (NS), citral (NS), α-ionone (NS), β-ionone (NS)[13]
blackberrySDEδ13C, δ2H, δ18Ofruit (10); synthetic (3)2-heptanol (10; 1), trans-linalool oxide (10; 1), cis-linalool oxide (10; 1)[14]
strawberry, pineapple, peachHS-SPMEδ13Cfruit (NS)methyl butanoate (NS), ethyl butanoate (NS), E-2-hexenal (NS), methyl hexanoate (NS), butyl butyrate (NS), ethyl hexanoate (NS),
hexyl acetate (NS), linalool (NS), hexyl butyrate (NS), octyl isovalerate (NA), γ-decalactone (NS), octyl hexanoate (NS)
[7]
sweet orangeHS-SPMEδ13Cessential oil (20)myrcene (20), limonene (20), nonanal (20), decanal (20), linalool (20), α-terpineol (20), geranial (20)[15]
wolfberryHS-SPMEδ13Cfruit (52)limonene (NS), tetramethylpyrazine (NS), safranal (NS), geranylacetone (NA), β-ionone (NS)[32]
appleHS-SPMEδ13Crecovery aroma (18);
synthetic (16)
ethyl acetate (1; 1), ethyl butyrate (1; 1), ethyl-2-methyll butyrate (1; 1), butyl acetate (6; 1), 1-hexanal (12; 1),
2-methylbutyl acetate (10; 1), 1-butanol (15; 1), amyl acetate (8; 1), butyl butyrate (8; 1), trans-2-hexenal (12; 1), hexyl acetate (8; 1),
2-hexen-1-ol, acetate (1, 1), 1-hexanol (15; 1), trans-2-hexenol (2; 1), benzaldehyde (15; 1), 1-octanol (8; 1)
[16]
a Method of sample preparation: SDE (simultaneous distillation extraction), HS-SPME (headspace solid-phase microextraction), LLE (liquid-liquid extraction), SCF (supercritical fluid extraction). NS: not specified.

References

  1. Jiang, Y.; Song, J. Fruits and fruit flavor: Classification and biological characterization. In Handbook of Fruit and Vegetable Flavors; John Wiley & Sons, Inc.: Hoboken, NJ, USA, 2010; pp. 1–23. [Google Scholar]
  2. A Helpful Guide to Fruit Flavor Combinations. Available online: https://www.thespruceeats.com/fruit-flavor-combinations-for-cocktails-760298 (accessed on 19 January 2021).
  3. Longo, M.A.; Sanromán, M.A. Production of food aroma compounds: Microbial and enzymatic methodologies. Food Technol Biotechnol Production of Food Aroma Compounds: Microbial and Enzymatic Methodologies. Food Technol. Biotechnol. 2006, 3, 335–353. [Google Scholar]
  4. Economic Adulteration and the Need for Carbon-14 Testing in the Natural Products Industry, Nutritional Outlook. Available online: https://www.nutritionaloutlook.com/view/economic-adulteration-and-need-carbon-14-testing-natural-products-industry (accessed on 20 January 2021).
  5. Martin, G.J. Multisite and multicomponent approach for the stable isotope analysis of aromas and essential oils. Fruit Flavor Biog. Charact. Authentication (ACS 596) 1993, 596, 94–113. [Google Scholar]
  6. Richling, E.; Appel, M.; Heckel, F.; Kahle, K.; Kraus, M.; Preston, C.; Hümmer, W.; Schreier, P. Flavor authenticity studies by isotope ratio mass spectrometry: Perspectives and limits. In Authentication of Food and Wine; American Chemical Society: Washington, DC, USA, 2006; pp. 75–86. [Google Scholar]
  7. Schipilliti, L.; Dugo, P.; Bonaccorsi, I.; Mondello, L. Headspace-solid phase microextraction coupled to gas chromatography–combustion-isotope ratio mass spectrometer and to enantioselective gas chromatography for strawberry flavoured food quality control. J. Chromatogr. A 2011, 1218, 7481–7486. [Google Scholar] [CrossRef] [PubMed]
  8. Bernreuther, A.; Koziet, J.; Brunerie, P.; Krammer, G.; Christoph, N.; Schreier, P. Chirospecific capillary gaschromatographic (HRGC) and on-line HRGC-isotope ratio mass spectrometry of -decalactone from various sources. Z. Leb. Unters. Forsch. 1990, 191, 299–301. [Google Scholar] [CrossRef]
  9. Preston, C.; Richling, E.; Elss, S.; Appel, M.; Heckel, F.; Hartlieb, A.; Schreier, P. On-line gas chromatography combustion/pyrolysis isotope ratio mass spectrometry (HRGC-C/P-IRMS) of pineapple (Ananas comosus L. Merr.) volatiles. J. Agric. Food Chem. 2003, 51, 8027–8031. [Google Scholar] [CrossRef]
  10. Sewenig, S.; Bullinger, D.; Hener, U.; Mosandl, A. Comprehensive authentication of (E)-α(β)-ionone from raspberries, using constant flow MDGC-C/P-IRMS and enantio-MDGC-MS. J. Agric. Food Chem. 2005, 53, 838–844. [Google Scholar] [CrossRef] [PubMed]
  11. Tamura, H.; Appel, M.; Richling, E.; Schreier, P. Authenticity assessment of γ- and δ-decalactone from Prunus fruits by gas chromatography combustion/pyrolysis isotope ratio mass spectrometry (GC-C/P-IRMS). J. Agric. Food Chem. 2005, 53, 5397–5401. [Google Scholar] [CrossRef]
  12. Kahle, K.; Preston, C.; Richling, E.; Heckel, F.; Schreier, P. On-line gas chromatography combustion/pyrolysis isotope ratio mass spectrometry (HRGC-C/P-IRMS) of major volatiles from pear fruit (Pyrus communis) and pear products. Food Chem. 2005, 91, 449–455. [Google Scholar] [CrossRef]
  13. Caja, D.M.; Preston, C.; Kempf, M.; Schreier, P. Flavor authentication studies of alpha-ionone, beta-ionone, and alpha-ionol from various sources. J. Agric. Food Chem. 2007, 55, 6700–6704. [Google Scholar] [CrossRef]
  14. Greule, M.; Mosandl, A. Heptan-2-ol and trans-linalool oxide (fur.) as inherent indicators of natural blackberry flavour using enantioselective and multielement-MDGC-IRMS analysis. Eur. Food Res. Technol. 2008, 226, 1001–1006. [Google Scholar] [CrossRef]
  15. Schipilliti, L.; Bonaccorsi, I.; Cotroneo, A.; Dugo, P.; Mondello, L. Carbon isotope ratios of selected volatiles in Citrus sinensis and in orange-flavoured food. J. Sci. Food Agric. 2015, 95, 2944–2950. [Google Scholar] [CrossRef]
  16. Strojnik, L.; Stopar, M.; Zlatič, E.; Kokalj, D.; Gril, M.N.; Ženko, B.; Žnidaršič, M.; Bohanec, M.; Boshkovska, B.M.; Luštrek, M.; et al. Authentication of key aroma compounds in apple using stable isotope approach. Food Chem. 2019, 277, 766–773. [Google Scholar] [CrossRef]
  17. van Leeuwen, K.A.; Prenzler, P.D.; Ryan, D.; Camin, F. Gas chromatography-combustion-isotope ratio mass spectrometry for traceability and authenticity in foods and beverages. Compr. Rev. Food Sci. Food Saf. 2014, 13, 814–837. [Google Scholar] [CrossRef] [Green Version]
  18. Braunsdorf, R.; Hener, U.; Lehmann, D.; Mosandl, A. Analytische Differenzierung zwischen natürlich gewachsenen, fermentativ erzeugten und synthetischen (naturidentischen) Aromastoffen. I, Herkunftsspezifische Analyse des (E)-α(β)-Ionons. Dtsch. Leb. 1991, 87, 227–280. [Google Scholar]
  19. Casabianca, H.; Graff, J.B. Enantiomeric and isotopic analysis of flavour compounds of some raspberry cultivars. J. Chromatogr. A 1994, 684, 360–365. [Google Scholar] [CrossRef]
  20. Schumacher, K.; Turgeon, H.; Mosandl, A. Sample preparation for gas chromatography isotope ratio mass spectrometry-an investigation with volatile components from strawberries. Phytochem. Anal. 1995, 6, 258–261. [Google Scholar] [CrossRef]
  21. Zhang, B.L.; Lees, M.; Martin, G.J. Stable isotope fractionation in fruit juice concentrates: Application to the authentication of grape and orange products. J. Agric. Food Chem. 1995, 43, 2411–2417. [Google Scholar] [CrossRef]
  22. Salmon, B.; Martin, G.J.; Remaud, G.; Fourel, F. Compositional and isotopic studies of fruit flavours. Part I. The banana aroma. Flavour Fragr. J. 1996, 11, 353–359. [Google Scholar] [CrossRef]
  23. Ruff, C.; Hör, K.; Weckerle, B.; Schreier, P.; König, T. 2H/1H Ratio analysis of flavor compounds by on-line gas chromatography pyrolysis isotope ratio mass spectrometry (HRGC-P-IRMS): Benzaldehyde. J. High Resolut. Chromatogr. 2000, 23, 357–359. [Google Scholar] [CrossRef]
  24. Weckerle, B.; Bastl-Borrmann, R.; Richling, E.; Hör, K.; Ruff, C.; Schreier, P. Cactus pear (Opuntia ficus indica) flavour constituents-Chiral evaluation (MDGC-MS) and isotope ratio (HRGC-IRMS) analysis. Flavour Fragr. J. 2001, 16, 360–363. [Google Scholar] [CrossRef]
  25. Hör, K.; Ruff, C.; Weckerle, B.; König, T.; Schreier, P. Flavor Authenticity Studies by 2H/1H Ratio Determination Using On-line Gas Chromatography Pyrolysis Isotope Ratio Mass Spectrometry. J. Agric. Food Chem. 2001, 49, 21–25. [Google Scholar] [CrossRef]
  26. Strojnik, L.; Camin, F.; Ogrinc, N. Compound-specific carbon and hydrogen isotope analysis of volatile organic compounds using headspace solid-phase microextraction. Talanta 2020, 219, 121264. [Google Scholar] [CrossRef]
  27. Mosandl, A. Enantioselective capillary gas chromatography and stable isotope ratio mass spectrometry in the authenticity control of flavors and essential oils. Food Rev. Int. 1995, 11, 597–664. [Google Scholar] [CrossRef]
  28. Elss, S.; Preston, C.; Appel, M.; Heckel, F.; Schreier, P. Influence of technological processing on apple aroma analysed by high resolution gas chromatography-mass spectrometry and on-line gas chromatography-combustion/pyrolysis-isotope ratio mass spectrometry. Food Chem. 2006, 98, 269–276. [Google Scholar] [CrossRef]
  29. El Hadi, M.A.M.; Zhang, F.J.; Wu, F.F.; Zhou, C.H.; Tao, J. Advances in fruit aroma volatile research. Molecules 2013, 18, 8200–8229. [Google Scholar] [CrossRef]
  30. Gonçalves, B.; Oliveira, I.; Bacelar, E.; Morais, M.C.; Aires, A.; Cosme, F.; Ventura-Cardoso, J.; Anjos, R.; Pinto, T. Aromas and flavours of fruits. In Generation of Aromas and Flavours; InTech: London, UK, 2018. [Google Scholar]
  31. Perini, M.; Pianezze, S.; Strojnik, L.; Camin, F. C and H stable isotope ratio analysis using solid-phase microextraction and gas chromatography-isotope ratio mass spectrometry for vanillin authentication. J. Chromatogr. A 2019, 1595, 168–173. [Google Scholar] [CrossRef] [PubMed]
  32. Meng, J.; Liu, Z.; Gou, C.L.; Rogers, K.M.; Yu, W.J.; Zhang, S.S.; Yuan, Y.W.; Zhang, L. Geographical origin of Chinese wolfberry (goji) determined by carbon isotope analysis of specific volatile compounds. J. Chromatogr. B Anal. Technol. Biomed. Life Sci. 2019, 1105, 104–112. [Google Scholar] [CrossRef]
  33. Schipilliti, L.; Bonaccorsi, I.L.; Mondello, L. Characterization of natural vanilla flavour in foodstuff by HS-SPME and GC-C-IRMS. Flavour Fragr. J. 2017, 32, 85–91. [Google Scholar] [CrossRef]
  34. Hansen, A.-M.S.; Fromberg, A.; Frandsen, H.L. Authenticity and traceability of vanilla flavors by analysis of stable isotopes of carbon and hydrogen. J. Agric. Food Chem. 2014, 62, 10326–10331. [Google Scholar] [CrossRef] [PubMed]
  35. Schipilliti, L.; Bonaccorsi, I.L.; Occhiuto, C.; Dugo, P.; Mondello, L. Authentication of citrus volatiles based on carbon isotope ratios. J. Essent. Oil Res. 2018, 30, 1–15. [Google Scholar] [CrossRef]
  36. Spangenberg, J.E.; Vogiatzaki, M.; Zufferey, V. Gas chromatography and isotope ratio mass spectrometry of Pinot Noir wine volatile compounds (δ13C) and solid residues (δ13C, δ15N) for the reassessment of vineyard water-status. J. Chromatogr. A 2017, 1517, 142–155. [Google Scholar] [CrossRef] [PubMed]
  37. Xiaobo, Z.; Jiewen, Z. Comparative analyses of apple aroma by a tin-oxide gas sensor array device and GC/MS. Food Chem. 2008, 107, 120–128. [Google Scholar] [CrossRef]
  38. Jin, X.; Zhang, L.; Wu, S.; Huang, M.; Yu, W.; Zhang, S. Developing an authentication approach using SPME-GC-IRMS based on compound-specific δ13C analysis of six typical volatiles in wine. Food Qual. Saf. 2021, 5, 1–11. [Google Scholar] [CrossRef]
  39. Wernig, F.; Buegger, F.; Pritsch, K.; Splivallo, R. Composition and authentication of commercial and home-made white truffle-flavored oils. Food Control 2018, 87, 9–16. [Google Scholar] [CrossRef] [Green Version]
  40. Kelly, S.; Heaton, K.; Hoogewerff, J. Tracing the geographical origin of food: The application of multi-element and multi-isotope analysis. Trends Food Sci. Technol. 2005, 16, 555–567. [Google Scholar] [CrossRef]
  41. Donarski, J.; Camin, F.; Fauhl-Hassek, C.; Posey, R.; Sudnik, M. Sampling guidelines for building and curating food authenticity databases. Trends Food Sci. Technol. 2019, 90, 187–193. [Google Scholar] [CrossRef]
  42. Webinar Review: Use of Stable Isotope Analysis in Commercial Food Authenticity Testing-New Food Magazine. Available online: https://www.newfoodmagazine.com/article/41431/stable-isotope-analysis-food-authenticity-testing/ (accessed on 19 January 2021).
Figure 1. Comparison of δ13C values of volatile organic compounds (VOCs) present in apple fruit and apple distillates. * p < 0.05 (Mann-Whitney test, statistically significant).
Foods 10 01550 g001
Figure 2. Comparison of δ13C values of VOCs present in strawberry fruit and distillate. * p < 0.05 (Mann-Whitney test).
Foods 10 01550 g002
Figure 3. Comparison of δ13C values of VOCs in different fruit samples. Only aroma compounds present in at least five samples are shown.
Foods 10 01550 g003
Figure 4. δ13C values of VOCs of natural and synthetic samples (this study) and literature values.
Foods 10 01550 g004
Figure 5. Comparison of δ13C values of commercial fruit distillates with δ13C values from the database of natural samples and synthetic standards.
Foods 10 01550 g005
Table 1. δ13C (‰) values of volatile organic compounds in synthetic standards, fruits obtained experimentally and from the literature.
(E)-2-hexen-1-ol(E)-2-hexen-1-ol, acetate(E)-2-hexenal1-butanol1-hexanol1-octanol 2-heptanone2-methylbutyl AcetateAcetic AcidAmyl AcetateBenzaldehydeButyl AcetateButyl ButyrateE-nerolidolethyl 2-methylbutyrateEthyl AcetateEthyl ButyrateEthyl HexanoateHexanalHexanoic Acidhexyl 2-methylbutyrateHexyl AcetateHexyl ButyrateIsoamyl AcetateLinaloolMethyl AcetateMethyl ButyrateMethyl HexanoatePropyl AcetatePropyl Propionateα-iononeβ-iononeγ-decalactone
Synthetic
No.323112 121121112222311113111211
min−30.2−37.0−33.9−31.4−24.4−29.2 −29.4−34.8−42.0−32.5−26.0−28.6−26.8−32.0−27.0−27.1−25.7−32.8−26.2−35.6−27.6−27.0−33.5−28.5−25.6−26.7−26.7−35.9−27.2−25.5
max−28.0−33.2−33.4−31.4−24.4−28.8 −29.4−32.9−42.0−32.5−25.3−28.6−26.8−32.0−24.7−27.0−16.5−26.2−25.3−35.6−27.6−27.0−33.5−18.6−25.6−26.7−26.7−35.1−27.2−25.5
Apple
No.19112720594 100 603310033 1513186121 35102242 259
min−38.8−31.9−47.0−44.5−43.7−33.3 −37.1 −39.0−33.3−40.1−41.4 −34.3−33.0−36.2−38.4−45.0 −41.9−40.4−40.0−36.9 −37.9−35.7
max−32.2−31.9−29.4−40.8−35.7−31.5 −26.0 −26.7−28.0−30.4−32.1 −27.0−26.2−28.5−30.8−30.1 −31.0−26.6−34.8−36.4 −30.2−29.6
Strawberry
No.121022 137 1315 1610 5324292676 27138202928 7
min−38.2−32.4−38.5 −37.5−36.5 −27.6−33.4−31.3 −35.4−37.6 −33.8−29.1−36.7−34.8−32.4−32.2−29.9 −35.0−35.0−33.7−26.9−37.8−33.8−29.2 −35.6
max−32.4−29.5−27.9 −30.2−34.4 −20.7−33.4−28.1 −29.9−33.0 −27.8−27.4−25.7−28.6−24.8−27.5−20.2 −28.6−35.0−30.2−24.5−30.9−29.2−24.1 −28.7
Blueberry
No. 5 1 1 3 1 14
min −39.6 −28.4 −29.1 −28.2 −32.7 −28.5−38.2
max −31.8 −28.4 −29.1 −25.2 −32.7 −28.5−32.5
Pear
No.1 9 4 3 457 6 9 6 1
min−33.4 −41.6 −37.0 −30.8 −31.9−32.6−37.7 −28.4 −43.4 −37.2 −30.9
max−33.4 −36.3 −33.5 −27.3 −27.5−31.2−30.5 −26.0 −33.9 −29.3 −30.9
Raspberry
No. 2 2 5 6 5 86
min −29.6 −32.7 −31.2 −30.9 −32.0 −34.2−33.4
max −28.0 −31.4 −30.2 −27.1 −30.1 −32.6−32.4
Peach
No. 5 1 3 3 5 2
min −37.0 −31.0 −31.2 −31.1 −33.7 −37.7
max −34.2 −31.0 −29.8 −28.6 −29.7 −37.5
Sour cherry
No. 4.0 3.0 1.0
min −32.8 −27.8 −25.5
max −29.1 −25.5 −25.5
Synthetic literature
min−28.0 −31.5−27.0−28.8 −34.8 −32.5−26.0−31.3−26.8 −27.2−27.1−25.7 −25.5 −27.0 −36.1
max−28.0 −27.7−24.4−28.8 −34.8 −32.5−26.0−28.6−26.8 −22.8−27.1−25.7 −25.5 −26.2 −36.1
Natural literature
min−43.8 −39.4−44.5−42.5−41.9 −34.4 −37.0−34.1−39.8−41.4 −27.9−33.0−32.6−31.2−38.9−33.2 −38.3−32.9 −36.8 −33.7−28.2
max−36.8 −27.3−37.0−36.9−38.3 −30.5 −30.0−29.7−31.3−33.6 −27.9−33.0−28.5−30.0−34.9−32.1 −29.7−30.3 −28.0 −29.3−26.5
Table 2. The calculated fractions of added synthetic volatile organic compounds in commercial samples based on the isotope mass balance model.
Aroma CompoundNatural CompoundSynthetic CompoundDetectable Synthetic Fraction
MinMaxMedianMinMaxMedian xx
δ13C (‰)δ13C (‰)50% Threshold100% Threshold
γ-decalactone−37.7−28.7−31.5−26.9−24.4−26.10.520.83
1-butanol−44.5−40.8−42.3−31.4−31.4−31.40.140.28
1-hexanol−43.7−30.2−39.4−24.4−24.4−24.40.610.70
1-octanol−36.5−31.5−34.9−29.2−28.8−29.00.570.68
2-heptanone−27.6−20.7−24.8−29.4−29.4−29.40.610.80
(E)-2-hexen-1-ol−38.8−32.2−34.9−30.2−28.0−30.10.560.78
(E)-2-hexen-1-ol, acetate, −32.4−29.5−30.8−37.0−33.2−35.10.370.78
acetic acid−31.3−28.1−30.2−42.0−42.0−42.00.090.23
benzaldehyde−35.4−28.0−31.3−26.0−25.3−25.70.590.79
butyl acetate−40.1−30.4−35.8−28.6−28.6−28.60.750.84
butyl butyrate−41.4−32.1−36.8−26.8−26.8−26.80.470.64
ethyl 2-methyl butyrate−34.3−27.0−29.3−27.0−24.7−25.80.661.00
ethyl butyrate−36.2−28.5−30.9−25.7−16.5−21.10.240.73
hexanal−45.0−27.5−38.0−26.2−25.3−25.50.830.93
hexanoic acid−29.9−20.2−25.8−35.6−35.6−35.60.420.63
hexyl 2-methyl butyrate−41.9−31.0−34.4−27.6−27.6−27.60.490.76
hexyl butyrate−40.0−34.8−36.2−33.5−33.5−33.50.520.80
isoamyl acetate−36.9−30.2−32.3−28.5−18.6−23.50.240.80
methyl acetate−38.2−30.9−34.3−26.7−26.7−26.70.450.63
methyl butyrate−33.8−29.2−31.1−26.7−26.7−26.70.440.66
methyl hexanoate−29.2−24.1−27.3−35.9−35.1−35.50.230.47
propyl acetate−37.9−30.2−33.4−27.2−27.2−27.20.520.72
propyl propionate−35.7−29.6−31.9−25.5−25.5−25.50.360.60
α-ionone−34.2−32.6−33.4−28.0−21.6−25.90.110.26
β-ionone−33.4−32.4−32.7−28.6−25.6−27.70.050.19
Table 3. Estimation of the amount of synthetic fraction in commercial fruit distillate.
Aroma
Compound
Commercial Fruit
Distillate Isotope Value
Min Estimated
Synthetic Fraction
Median Estimated
Synthetic Fraction
Max Estimated
Synthetic Fraction
δ13C (‰)xxx
hexanal−26.50.460.920.99
butyl acetate−29.80.340.830.89
benzaldehyde−26.40.590.860.95
ethyl butyrate−26.00.210.500.97
methyl hexanoate−34.00.710.810.89
methyl acetate−27.00.920.960.97
2-heptanone−28.30.380.760.87
hexanoic acid−34.80.860.920.95
Publisher’s Note: MDPI stays neutral with regard to jurisdictional claims in published maps and institutional affiliations.

