
The Provenance of Slovenian Milk Using 87Sr/86Sr Isotope Ratios

 , ,
, ,  , ,
, ,
Abstract
: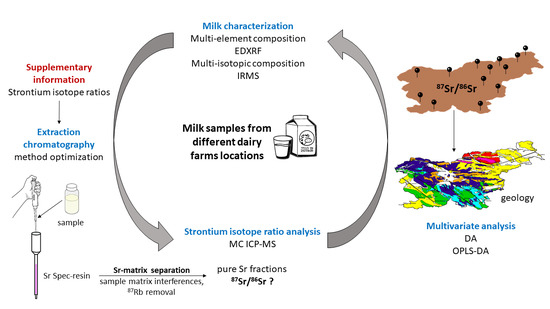
1. Introduction
2. Materials and Methods
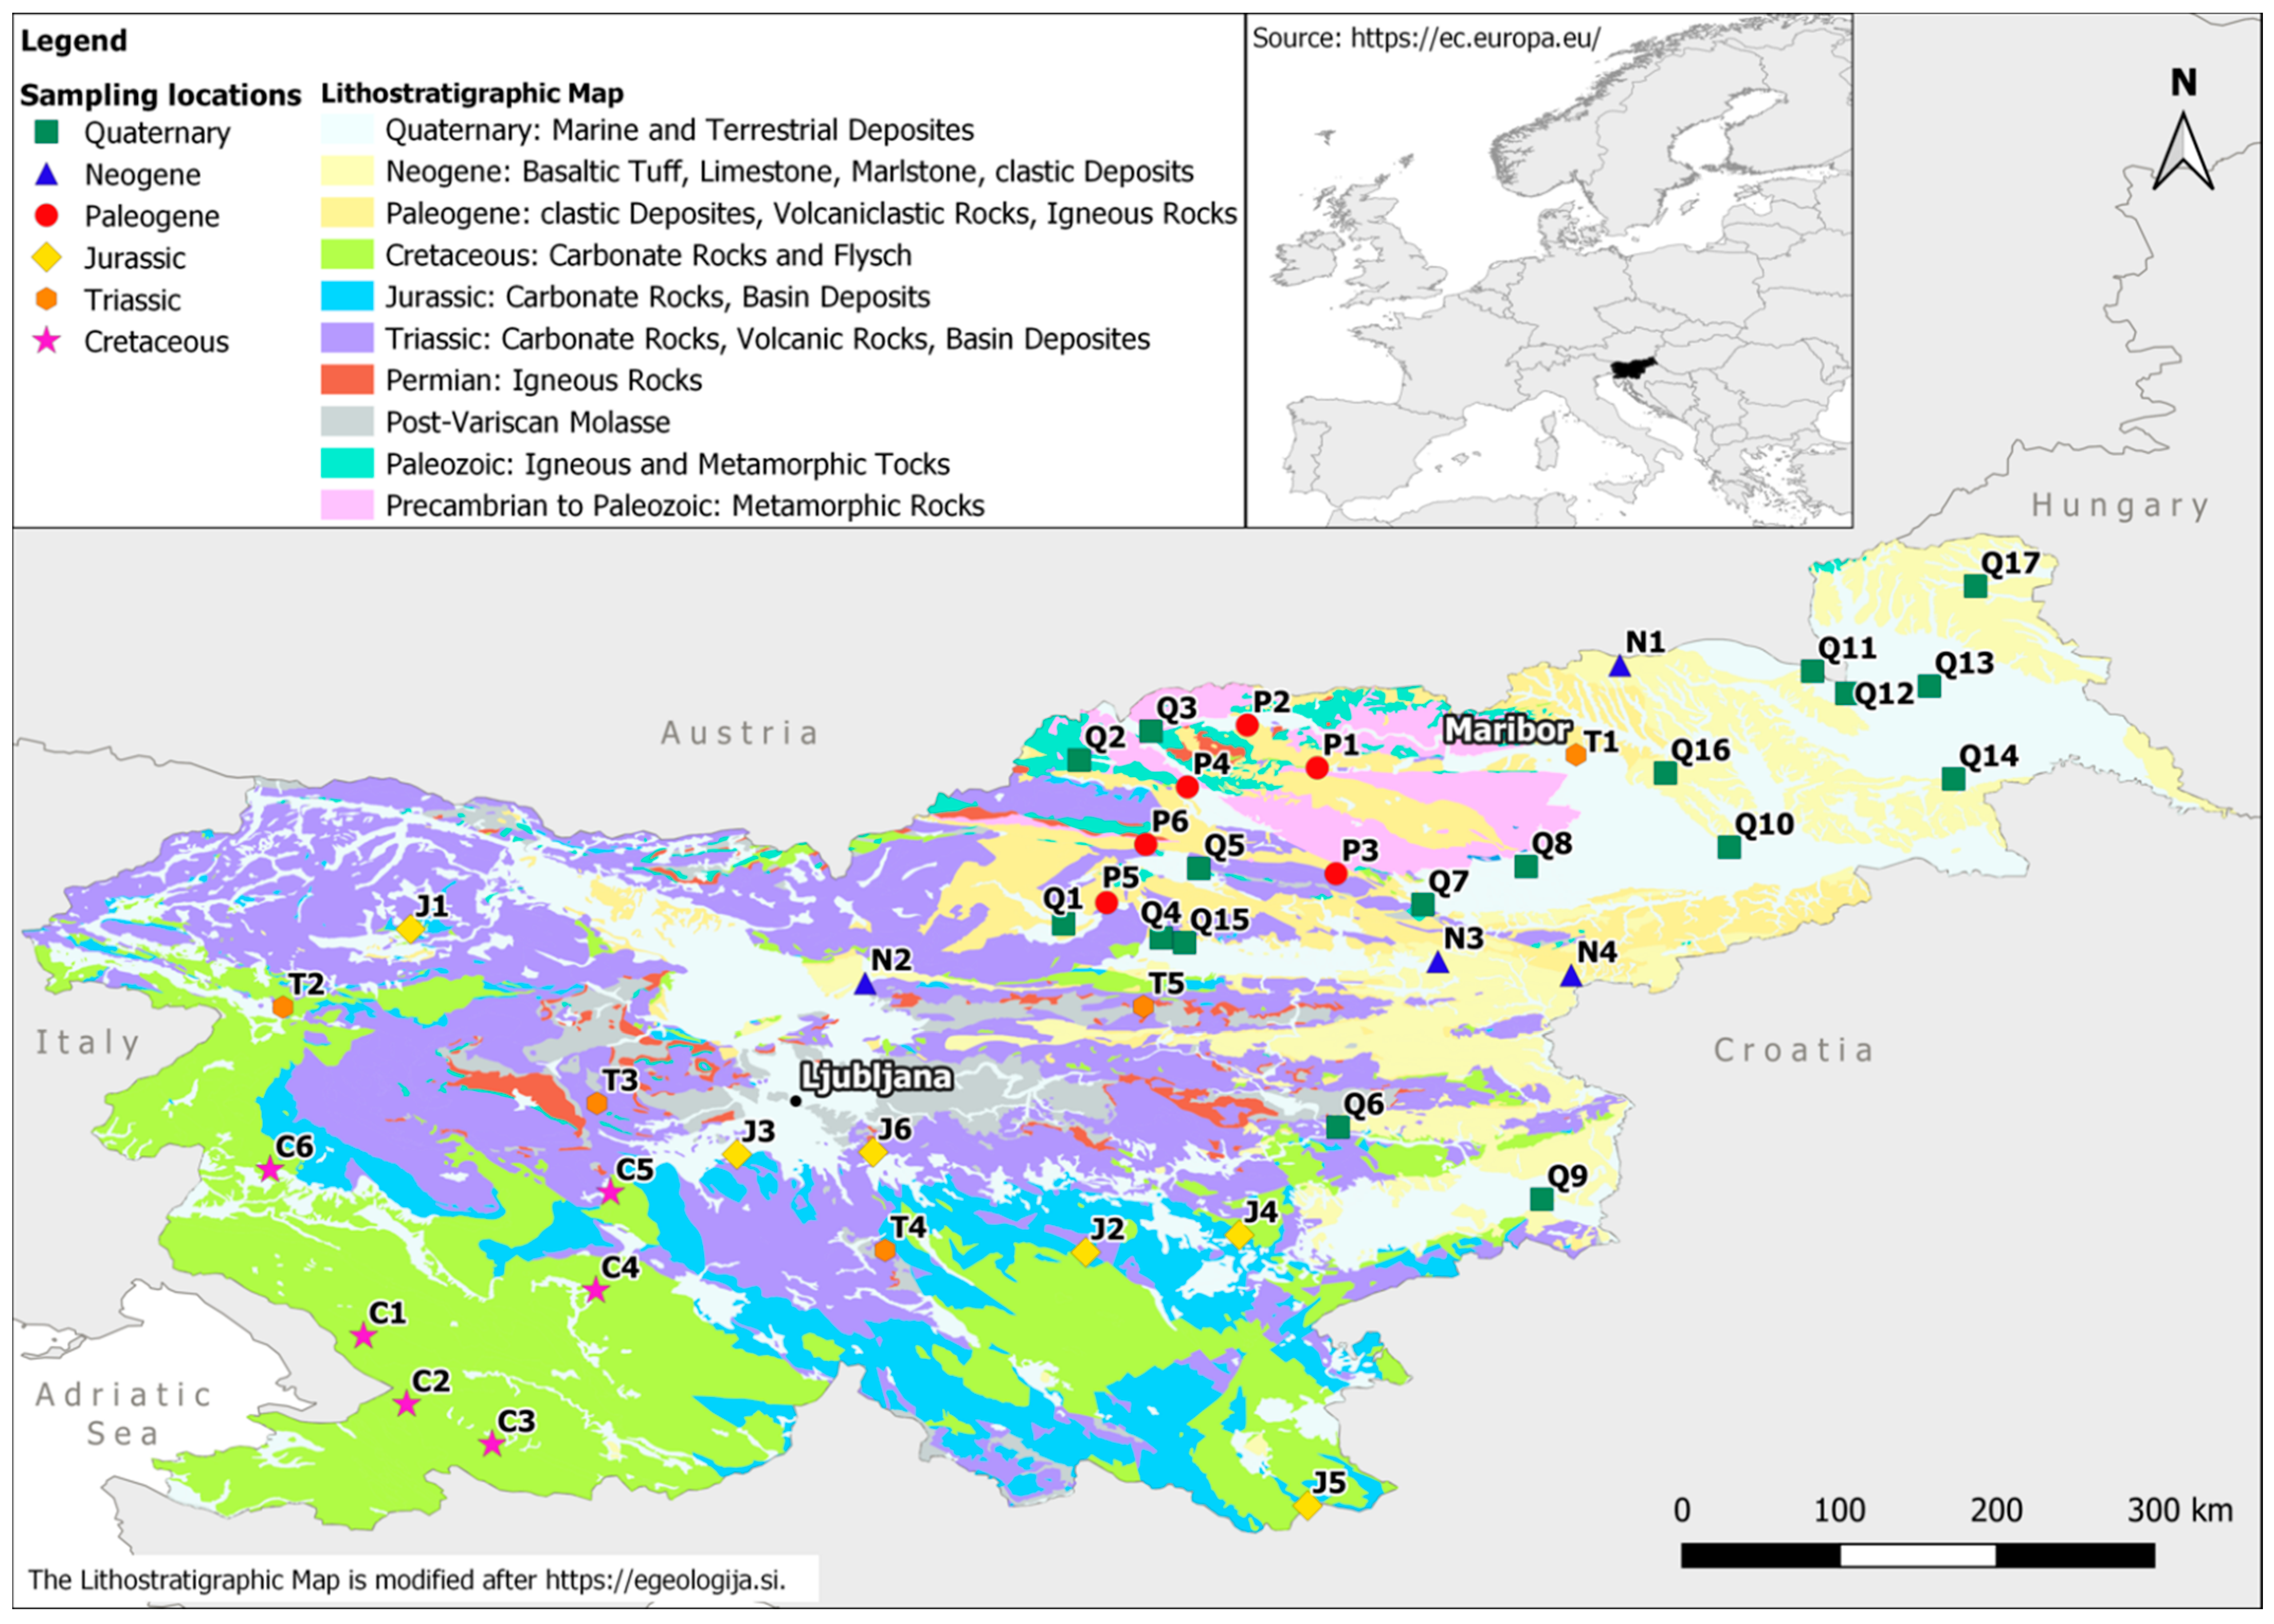
2.1. Sampling
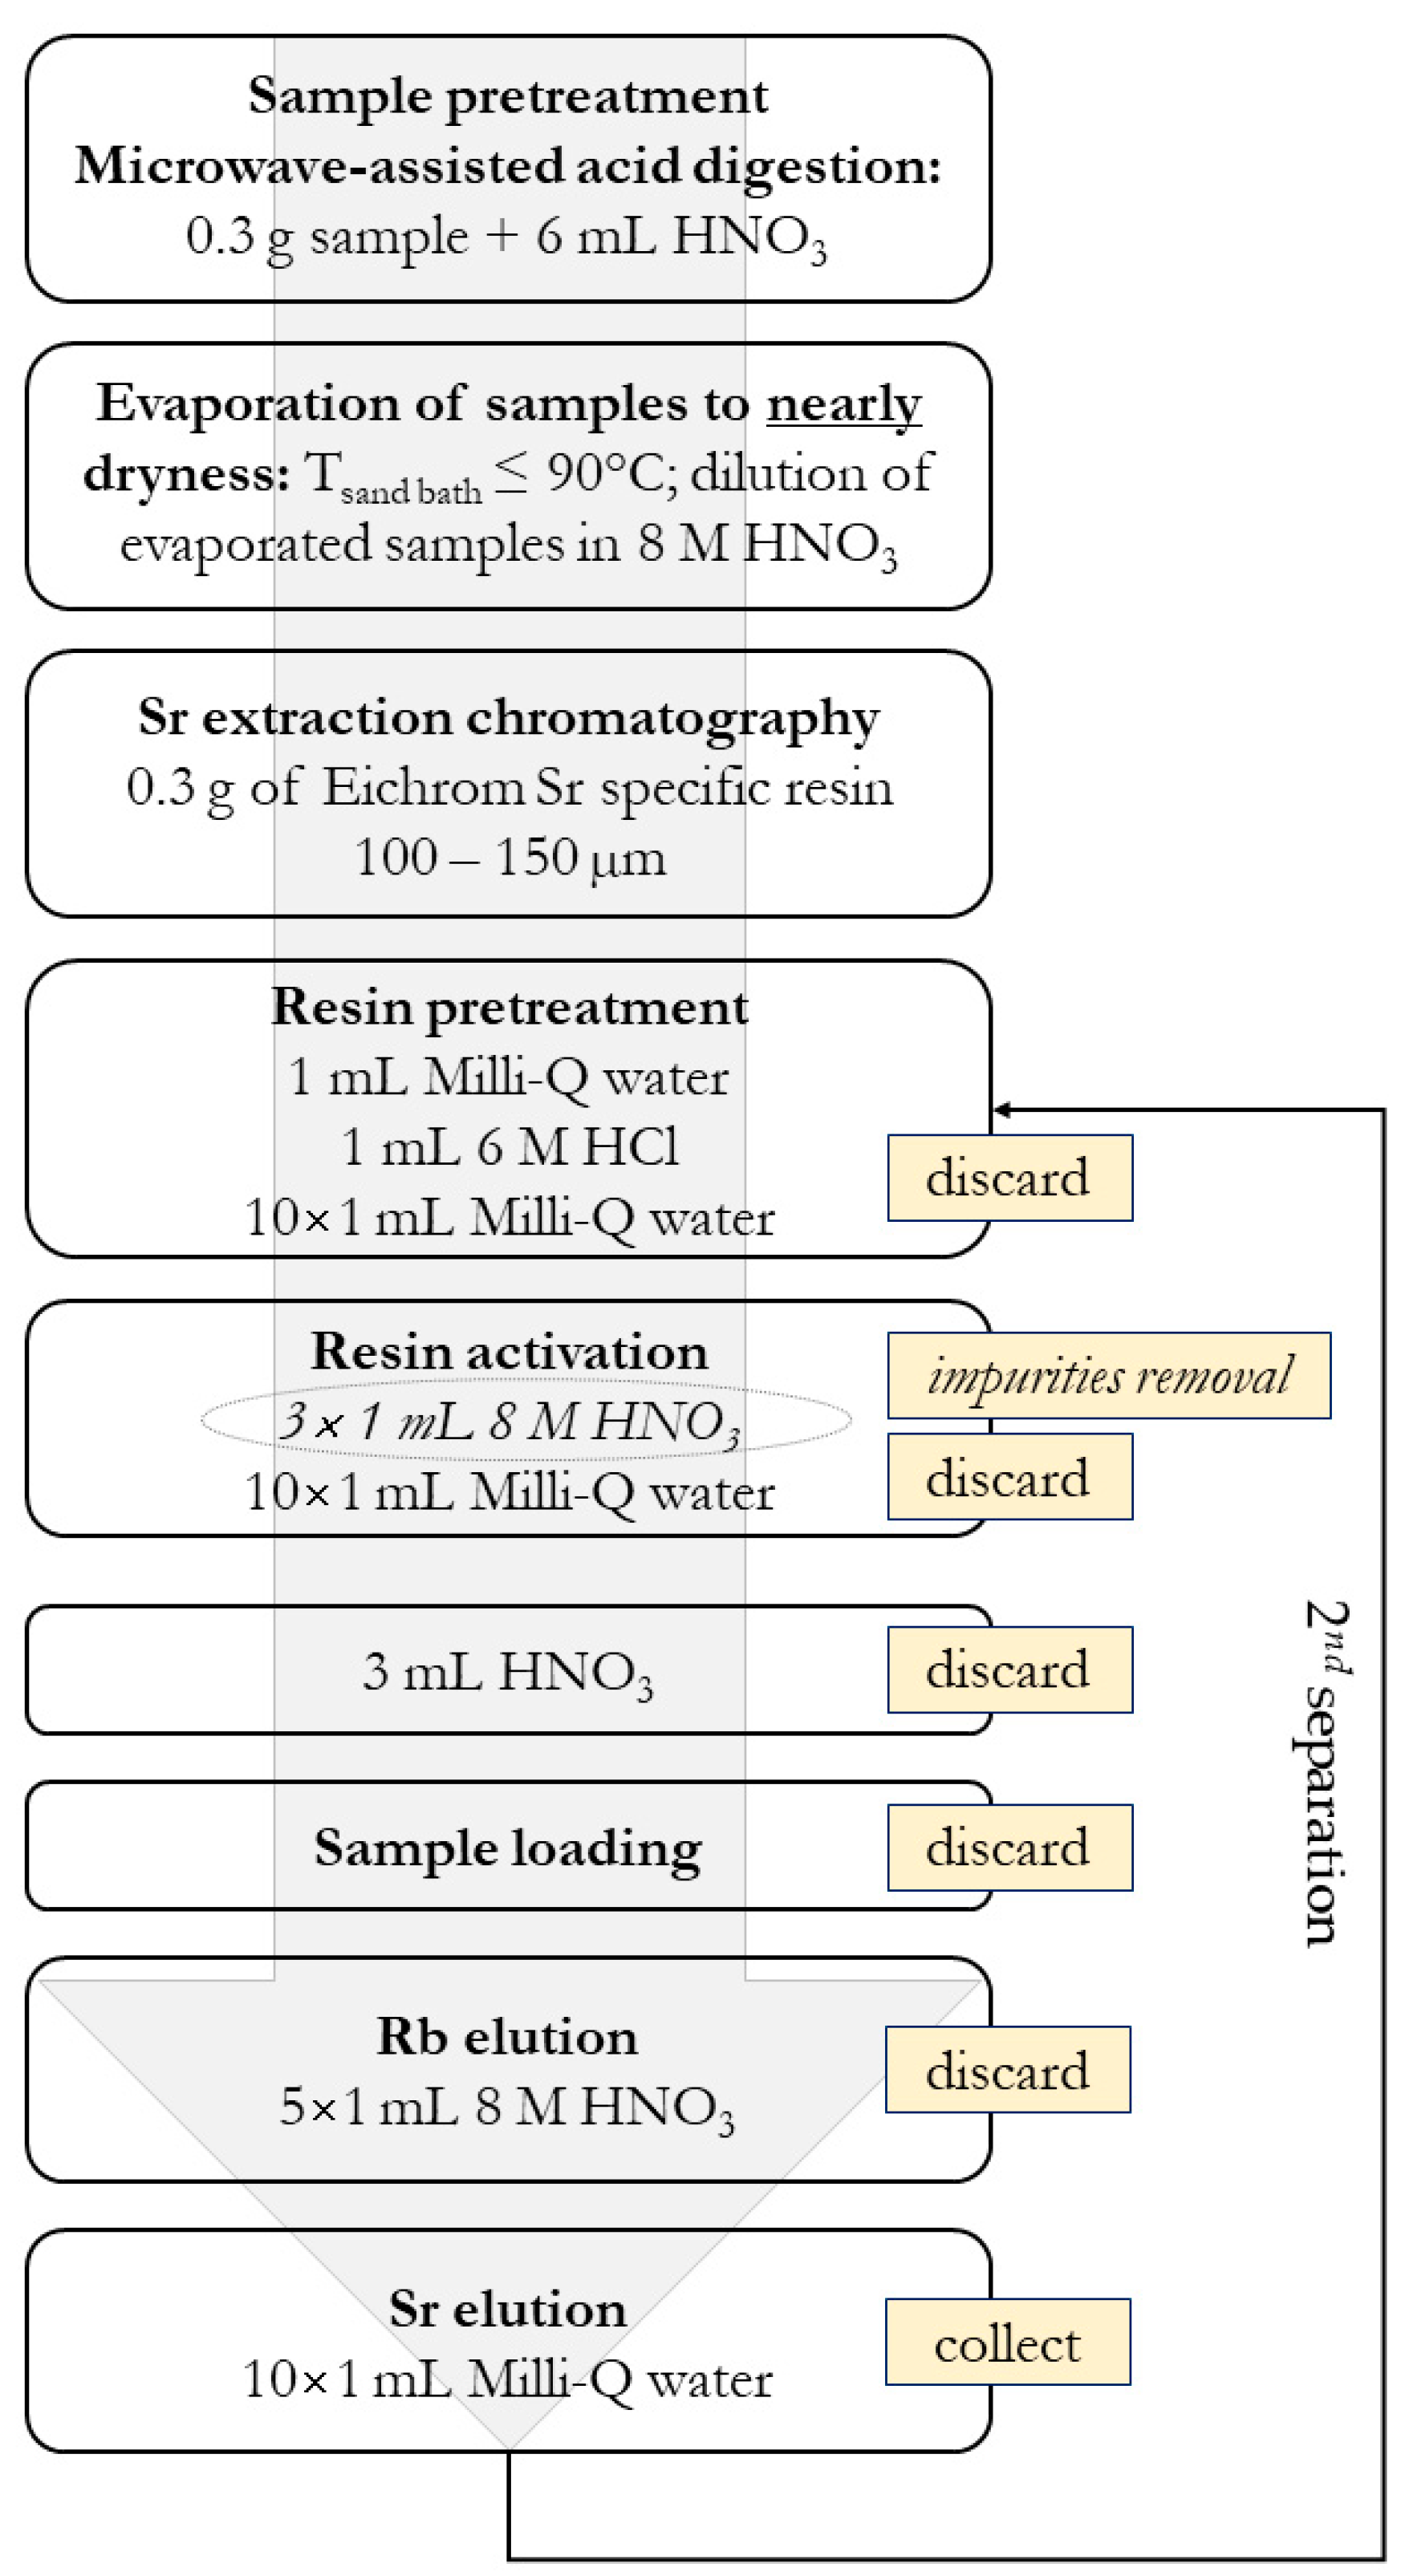
2.2. 87Sr/86Sr Isotope Ratio in Authentic Slovenian Milk
Isotope Analysis Using MC ICP-MS
2.3. Multi-Elemental Analysis Using EDXRF
2.4. Isotope Ratio Mass Spectrometry (IRMS) Measurements
2.5. Statistical Analysis
3. Results and Discussion
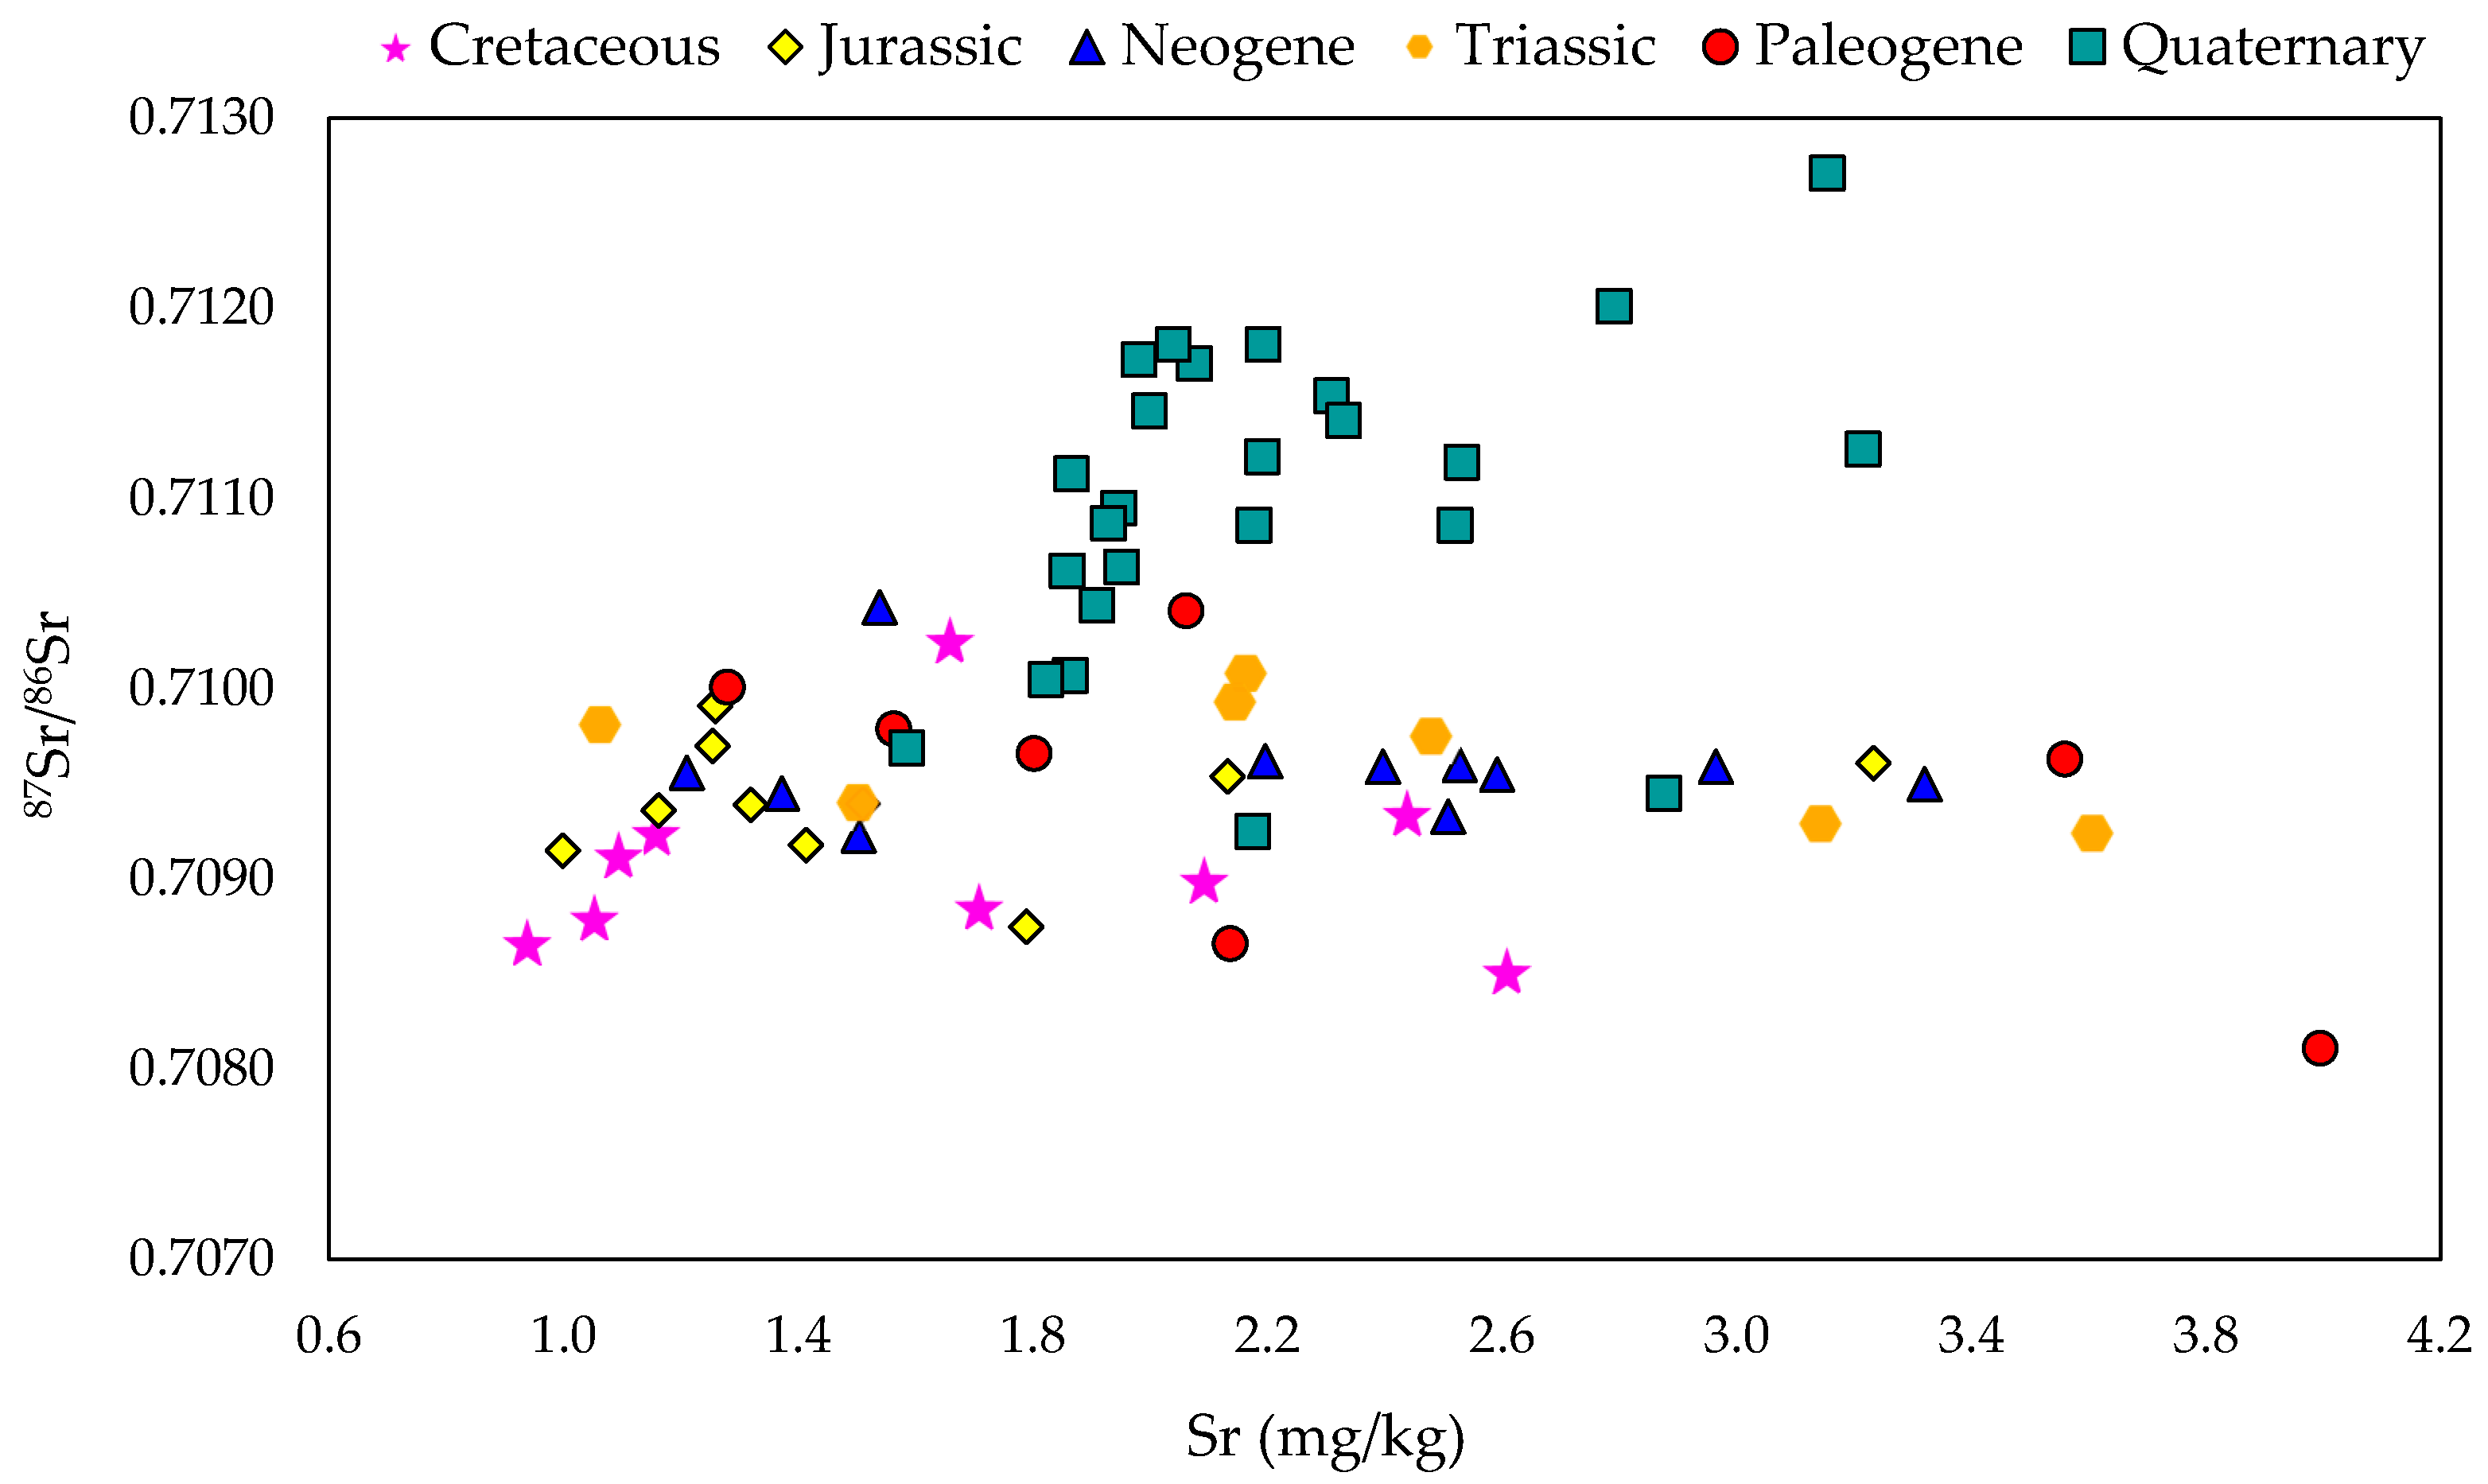
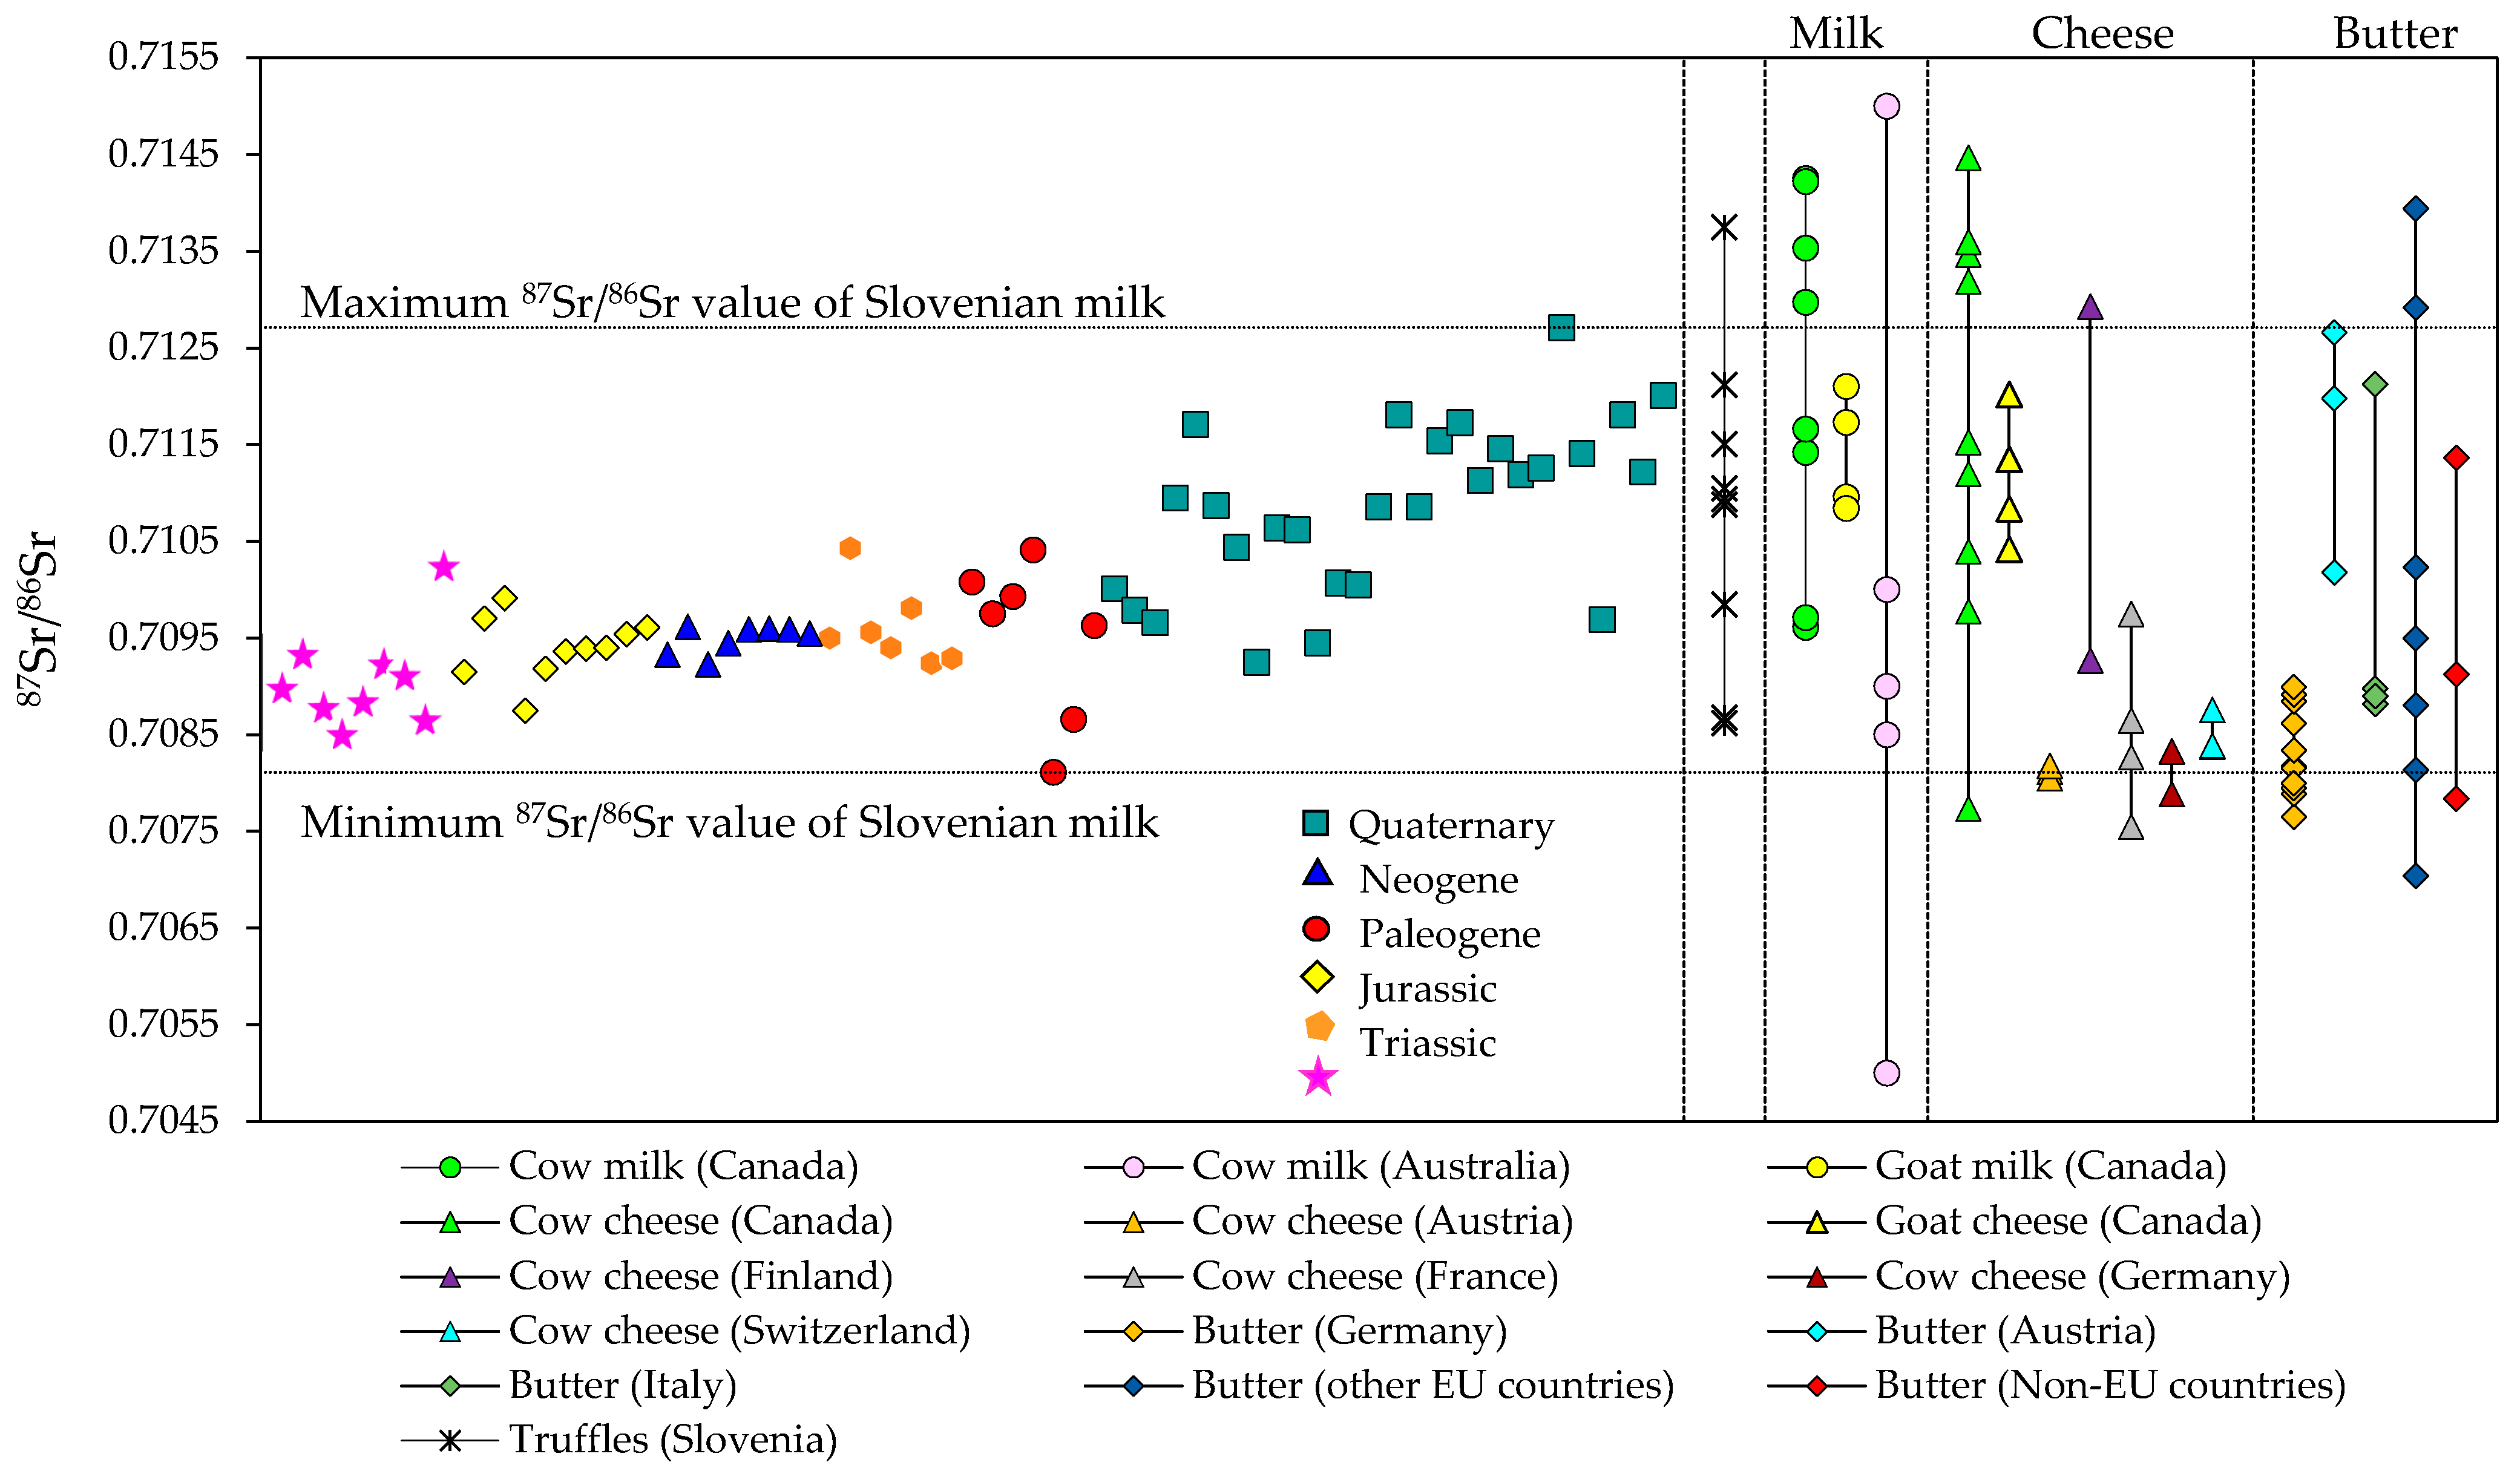
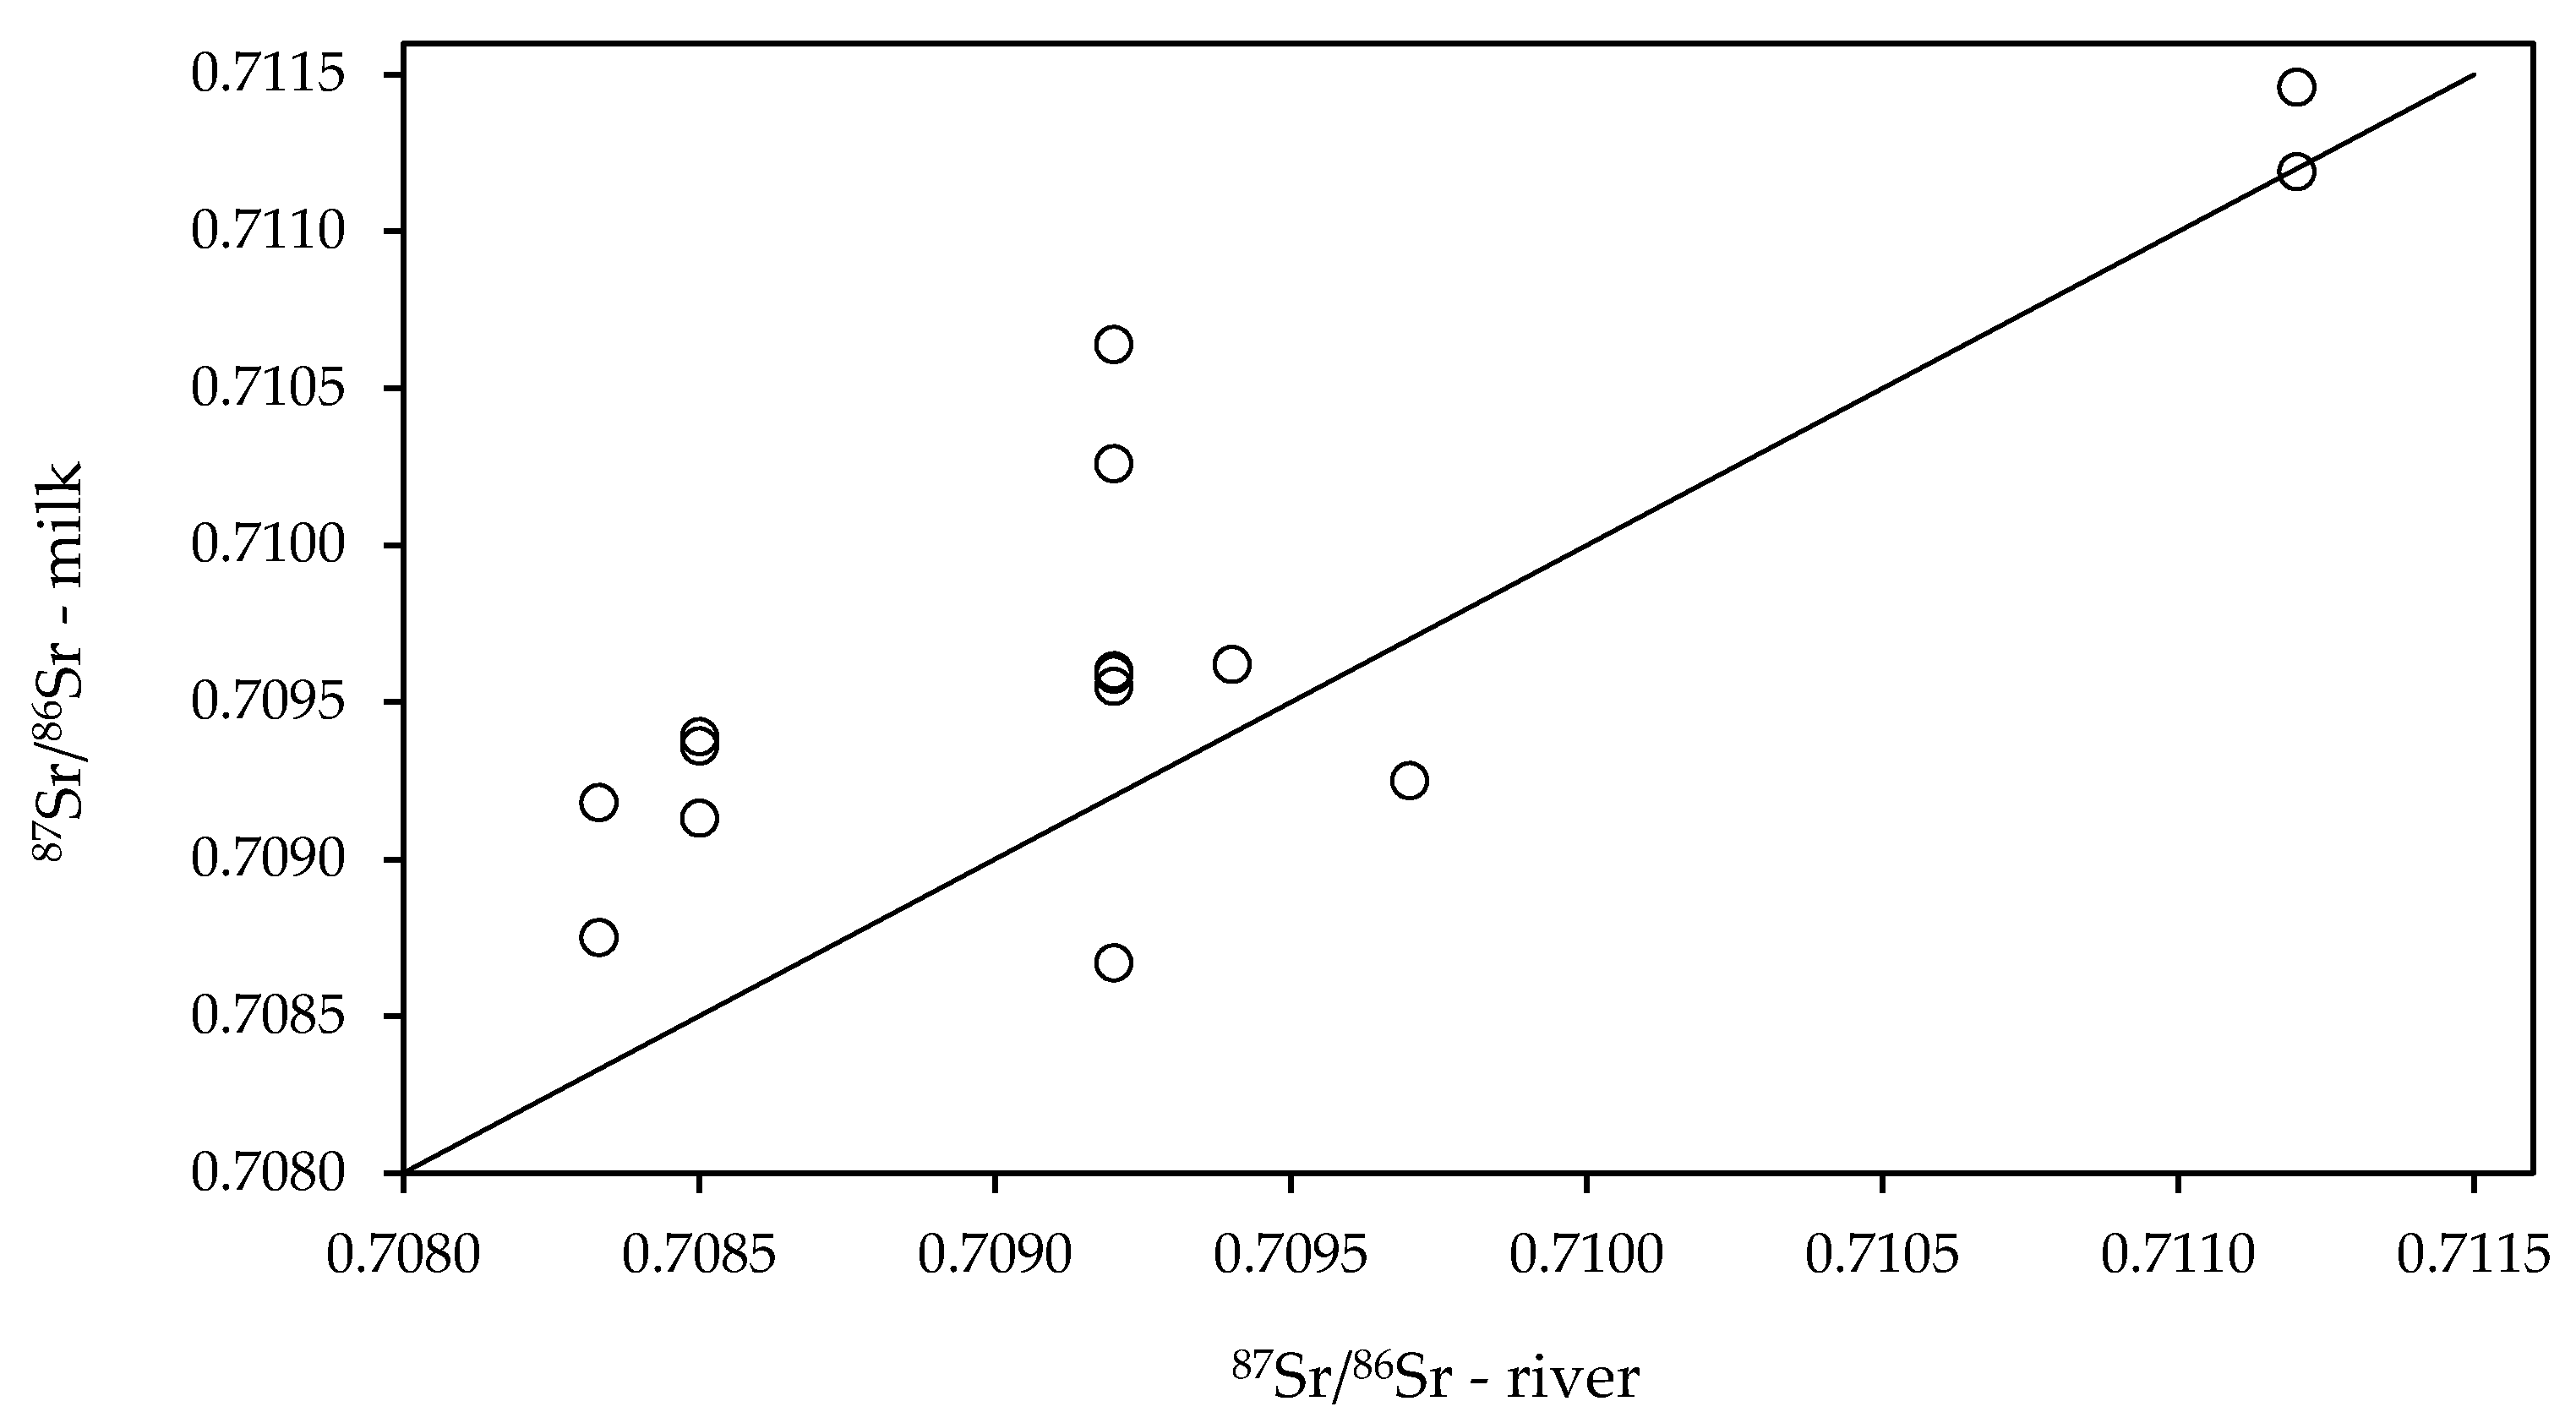
3.1. Strontium Isotope Ratio of Authentic Slovenian Milk
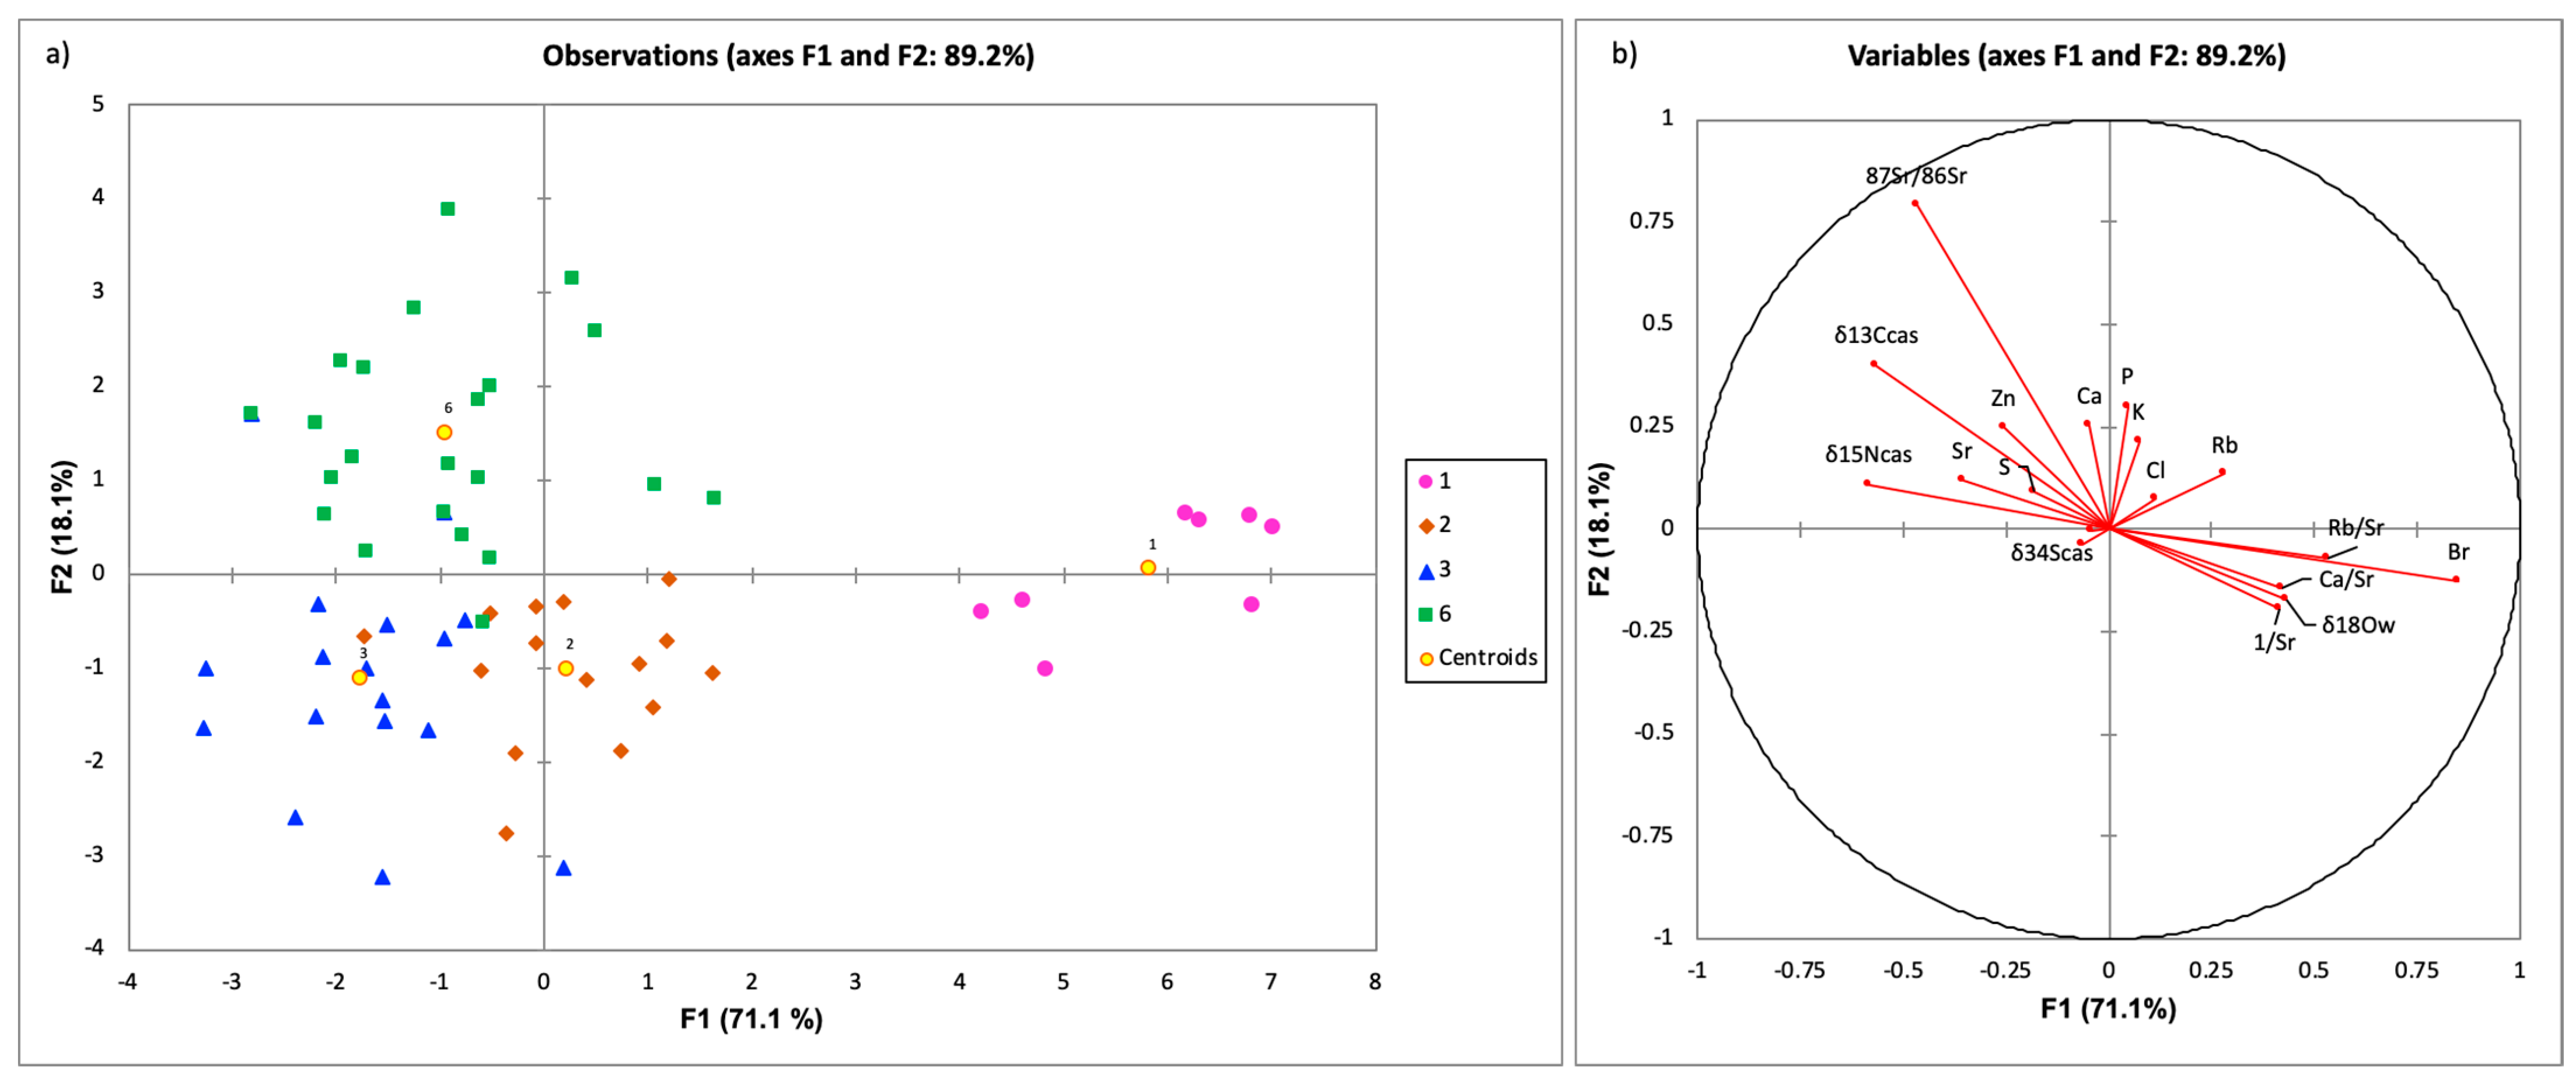
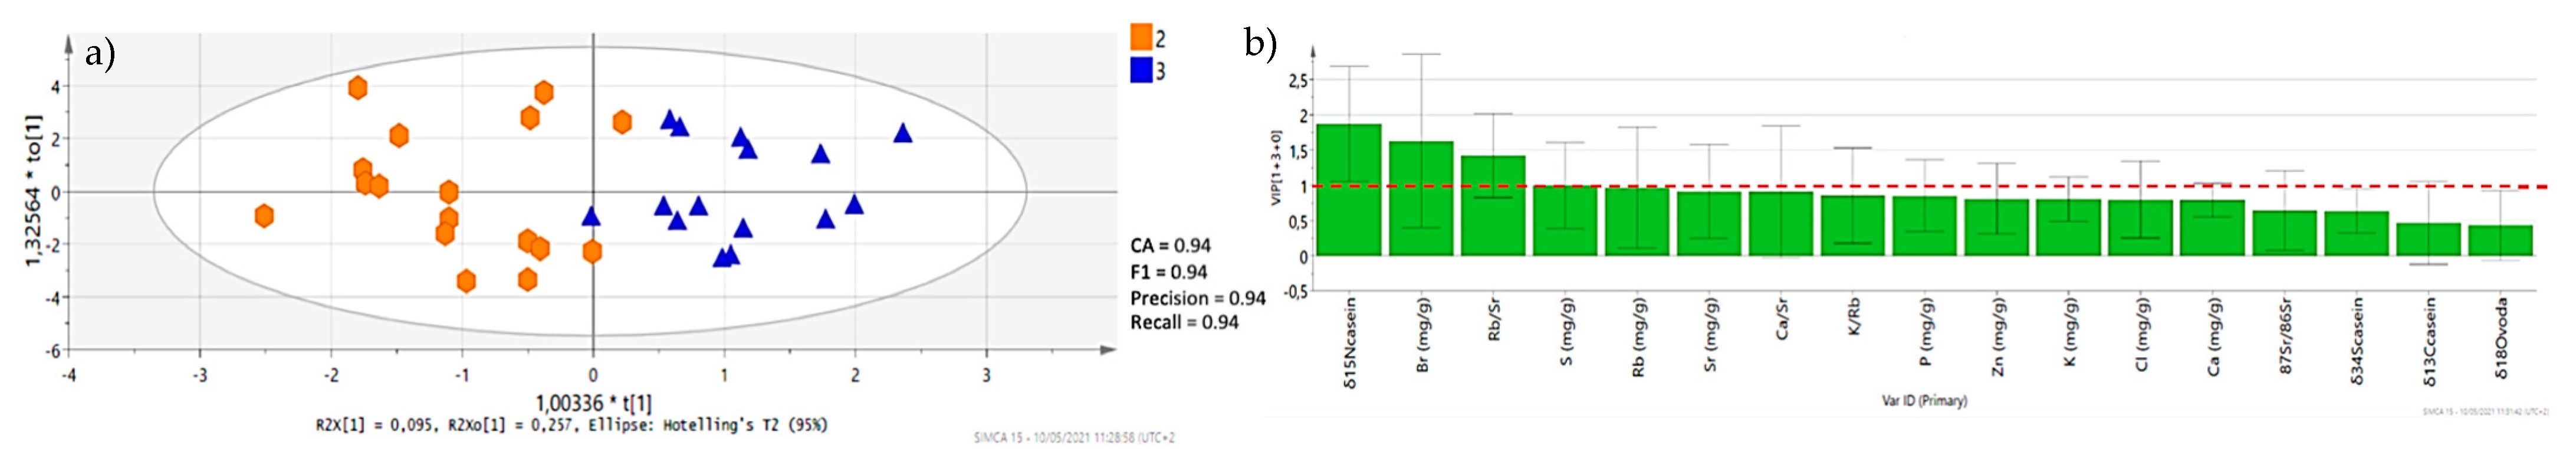
3.2. Discriminant Analysis
4. Conclusions
Supplementary Materials
Author Contributions
Funding
Institutional Review Board Statement
Informed Consent Statement
Data Availability Statement
Acknowledgments
Conflicts of Interest
References
- Manca, G.; Franco, M.A.; Versini, G.; Camin, F.; Rossmann, A.; Tola, A. Correlation Between Multielement Stable Isotope Ratio and Geographical Origin in Peretta Cows’ Milk Cheese. J. Dairy Sci. 2006, 89, 831–839. [Google Scholar] [CrossRef]
- Camin, F.; Perini, M.; Colombari, G.; Bontempo, L.; Versini, G. Influence of dietary composition on the carbon, nitrogen, oxygen and hydrogen stable isotope ratios of milk. Rapid Commun. Mass Spectrom. 2008, 22, 1690–1696. [Google Scholar] [CrossRef] [PubMed]
- Chesson, L.A.; Valenzuela, L.O.; O’Grady, S.P.; Cerling, T.E.; Ehleringer, J.R. Hydrogen and Oxygen Stable Isotope Ratios of Milk in the United States. J. Agric. Food Chem. 2010, 58, 2358–2363. [Google Scholar] [CrossRef] [PubMed]
- Luo, D.; Dong, H.; Luo, H.; Xian, Y.; Guo, X.; Wu, Y. Multi-Element (C, N, H, O) Stable Isotope Ratio Analysis for Determining the Geographical Origin of Pure Milk from Different Regions. Food Anal. Methods 2015, 9, 437–442. [Google Scholar] [CrossRef]
- Nečemer, M.; Potočnik, D.; Ogrinc, N. Discrimination between Slovenian cow, goat and sheep milk and cheese according to geographical origin using a combination of elemental content and stable isotope data. J. Food Compos. Anal. 2016, 52, 16–23. [Google Scholar] [CrossRef]
- Bontempo, L.; Barbero, A.; Bertoldi, D.; Camin, F.; Larcher, R.; Perini, M.; Sepulcri, A.; Zicarelli, L.; Piasentier, E. Isotopic and elemental profiles of Mediterranean buffalo milk and cheese and authentication of Mozzarella di Bufala Campana PDO: An initial exploratory study. Food Chem. 2019, 285, 316–323. [Google Scholar] [CrossRef] [PubMed]
- Griboff, J.; Baroni, M.V.; Horacek, M.; Wunderlin, D.A.; Monferran, M.V. Multielemental + isotopic fingerprint enables linking soil, water, forage and milk composition, assessing the geographical origin of Argentinean milk. Food Chem. 2019, 283, 549–558. [Google Scholar] [CrossRef] [PubMed]
- Potočnik, D.; Nečemer, M.; Perišić, I.; Jagodic, M.; Mazej, D.; Camin, F.; Eftimov, T.; Strojnik, L.; Ogrinc, N. Geographical verification of Slovenian milk using stable isotope ratio, multi-element and multivariate modelling approaches. Food Chem. 2020, 326, 126958. [Google Scholar] [CrossRef]
- Flockhart, D.T.; Kyser, T.K.; Chipley, D.; Miller, N.G.; Norris, D.R. Experimental evidence shows no fractionation of strontium isotopes (87Sr/86Sr) among soil, plants, and herbivores: Implications for tracking wildlife and forensic science. Isot. Environ. Health Stud. 2015, 51, 372–381. [Google Scholar] [CrossRef]
- Swoboda, S.; Brunner, M.; Boulyga, S.F.; Galler, P.; Horáček, M.; Prohaska, T. Identification of Marchfeld asparagus using Sr isotope ratio measurements by MC-ICP-MS. Anal. Bioanal. Chem. 2007, 390, 487–494. [Google Scholar] [CrossRef]
- Ariyama, K.; Shinozaki, M.; Kawasaki, A. Determination of the Geographic Origin of Rice by Chemometrics with Strontium and Lead Isotope Ratios and Multielement Concentrations. J. Agric. Food Chem. 2012, 60, 1628–1634. [Google Scholar] [CrossRef] [PubMed]
- Lagad, R.A.; Singh, S.K.; Rai, V.K. Rare earth elements and 87Sr/86Sr isotopic characterization of Indian Basmati rice as potential tool for its geographical authenticity. Food Chem. 2017, 217, 254–265. [Google Scholar] [CrossRef]
- Lagad, R.A.; Alamelu, D.; Laskar, A.H.; Rai, V.K.; Singh, S.K.; Aggarwal, S.K. Isotope signature study of the tea samples produced at four different regions in India. Anal. Methods 2013, 5, 1604–1611. [Google Scholar] [CrossRef]
- Chang, C.-T.; You, C.-F.; Aggarwal, S.K.; Chung, C.-H.; Chao, H.-C.; Liu, H.-C. Boron and strontium isotope ratios and major/trace elements concentrations in tea leaves at four major tea growing gardens in Taiwan. Environ. Geochem. Health 2015, 38, 737–748. [Google Scholar] [CrossRef] [PubMed]
- Techer, I.; Lancelot, J.; Descroix, F.; Guyot, B. About Sr isotopes in coffee ‘Bourbon Pointu’ of the Réunion Island. Food Chem. 2011, 126, 718–724. [Google Scholar] [CrossRef]
- Rodrigues, C.; Brunner, M.; Steiman, S.; Bowen, G.J.; Nogueira, J.M.F.; Gautz, L.; Prohaska, T.; Máguas, C. Isotopes as Tracers of the Hawaiian Coffee-Producing Regions. J. Agric. Food Chem. 2011, 59, 10239–10246. [Google Scholar] [CrossRef]
- Rummel, S.; Hoelzl, S.; Horn, P.; Rossmann, A.; Schlicht, C. The combination of stable isotope abundance ratios of H, C, N and S with 87Sr/86Sr for geographical origin assignment of orange juices. Food Chem. 2010, 118, 890–900. [Google Scholar] [CrossRef]
- Victor, V.; Ross, S.; Karine, P.; André, P.; Jean-François, H.; David, W. Strontium Isotope Characterization of Wines from the Quebec (Canada) Terroir. Procedia Earth Planet. Sci. 2015, 13, 252–255. [Google Scholar] [CrossRef] [Green Version]
- Catarino, S.; Castro, F.P.; Brazão, J.; Moreira, L.; Pereira, L.; Fernandes, J.R.; Dias, J.E.; Graça, A.; Martins-Lopes, P. 87Sr/86Sr isotopic ratios in vineyard soils and varietal wines from Douro Valley. BIO Web Conf. 2019, 12, 02031. [Google Scholar] [CrossRef]
- Epova, E.N.; Bérail, S.; Séby, F.; Vacchina, V.; Bareille, G.; Médina, B.; Sarthou, L.; Donard, O.F. Strontium elemental and isotopic signatures of Bordeaux wines for authenticity and geographical origin assessment. Food Chem. 2019, 294, 35–45. [Google Scholar] [CrossRef]
- Yang, Y.-H.; Wu, F.-Y.; Liu, Z.-C.; Chu, Z.-Y.; Xie, L.-W.; Yang, J.-H. Evaluation of Sr chemical purification technique for natural geological samples using common cation-exchange and Sr-specific extraction chromatographic resin prior to MC-ICP-MS or TIMS measurement. J. Anal. At. Spectrom. 2012, 27, 516–522. [Google Scholar] [CrossRef]
- Pin, C.; Gannoun, A.; Dupont, A. Rapid, simultaneous separation of Sr, Pb, and Nd by extraction chromatography prior to isotope ratios determination by TIMS and MC-ICP-MS. J. Anal. Spectrom. 2014, 29, 1858–1870. [Google Scholar] [CrossRef]
- Vroon, P.Z.; Van Der Wagt, B.; Koornneef, J.M.; Davies, G.R. Problems in obtaining precise and accurate Sr isotope analysis from geological materials using laser ablation MC-ICPMS. Anal. Bioanal. Chem. 2007, 390, 465–476. [Google Scholar] [CrossRef] [Green Version]
- Rossmann, A.; Haberhauer, G.; Hölzl, S.; Horn, P.; Pichlmayer, F.; Voerkelius, S. The potential of multielement stable isotope analysis for regional origin assignment of butter. Eur. Food Res. Technol. 2000, 211, 32–40. [Google Scholar] [CrossRef]
- Horwitz, E.P.; Chiarizia, R.; Dietz, M.L. A novel strontium-selective extraction chromatographic resin*. Solvent Extr. Ion Exch. 1992, 10, 313–336. [Google Scholar] [CrossRef]
- Pillonel, L.; Badertscher, R.; Froidevaux, P.; Haberhauer, G.; Hölzl, S.; Horn, P.; Jakob, A.; Pfammatter, E.; Piantini, U.; Rossmann, A.; et al. Stable isotope ratios, major, trace and radioactive elements in emmental cheeses of different origins. LWT-Food Sci. Technol. 2003, 36, 615–623. [Google Scholar] [CrossRef]
- Fortunato, G.; Mumic, K.; Wunderli, S.; Pillonel, L.; Bosset, J.O.; Gremaud, G. Application of strontium isotope abundance ratios measured by MC-ICP-MS for food authentication. J. Anal. At. Spectrom. 2004, 19, 227–234. [Google Scholar] [CrossRef]
- Bontempo, L.; Larcher, R.; Camin, F.; Hölzl, S.; Rossmann, A.; Horn, P.; Nicolini, G. Elemental and isotopic characterisation of typical Italian alpine cheeses. Int. Dairy J. 2011, 21, 441–446. [Google Scholar] [CrossRef]
- Crittenden, R.G.; Andrew, A.S.; LeFournour, M.; Young, M.D.; Middleton, H.; Stockmann, R. Determining the geographic origin of milk in Australasia using multi-element stable isotope ratio analysis. Int. Dairy J. 2007, 17, 421–428. [Google Scholar] [CrossRef]
- Stevenson, R.; Desrochers, S.; Hélie, J.-F. Stable and radiogenic isotopes as indicators of agri-food provenance: Insights from artisanal cheeses from Quebec, Canada. Int. Dairy J. 2015, 49, 37–45. [Google Scholar] [CrossRef]
- Bavec, M.; Novak, M.; Poljak, M.; Čertalič, S. Geološka Karta Slovenije 1:1.000.000 = Geological Map of Slovenia 1:1.000.000; Geološki zavod Slovenije: Ljubljana, Slovenia, 2013. [Google Scholar]
- Zuliani, T.; Kanduč, T.; Novak, R.; Vreča, P. Characterization of Bottled Waters by Multielemental Analysis, Stable and Radiogenic Isotopes. Water 2020, 12, 2454. [Google Scholar] [CrossRef]
- Nečemer, M.; Kump, P.; Ščančar, J.; Jaćimović, R.; Simčič, J.; Pelicon, P.; Budnar, M.; Jeran, Z.; Pongrac, P.; Regvar, M.; et al. Application of X-ray fluorescence analytical techniques in phytoremediation and plant biology studies. Spectrochim. Acta Part B Spectrosc. 2008, 63, 1240–1247. [Google Scholar] [CrossRef]
- Nečemer, M.; Kump, P.; Vogel-Mikuš, K. Use of X-Ray Fluorescence-Based Analytical Techniques in Phytoremediation. In Handbook of Phytoremediation; Golubev, I.A., Ed.; Environmental Science, Engineering and Technology; Nova Science Publishers, Inc.: New York, NY, USA, 2011; pp. 331–358. [Google Scholar]
- Potocnik, D.; Necemer, M.; Mazej, D.; Jacimovic, R.; Ogrinc, N. Multi-elemental composition of Slovenian milk: Analytical approach and geographical origin determination. Acta IMEKO 2016, 5, 15–21. [Google Scholar] [CrossRef]
- Brand, W.A.; Coplen, T.B.; Vogl, J.; Rosner, M.; Prohaska, T. Assessment of international reference materials for isotope-ratio analysis (IUPAC Technical Report). Pure Appl. Chem. 2014, 86, 425–467. [Google Scholar] [CrossRef]
- Kornexl, B.E.; Werner, T.; Roßmann, A.; Schmidt, H.L. Measurement of stable isotope abundances in milk and milk ingredients—A possible tool for origin assignment and quality control. Z. Lebensm. Und-Forsch. A 1997, 205, 19–24. [Google Scholar] [CrossRef]
- Hoogewerff, J.A.; Reimann, C.; Ueckermann, H.; Frei, R.; Frei, K.M.; van Aswegen, T.; Stirling, C.; Reid, M.; Clayton, A.; Ladenberger, A.; et al. Bioavailable 87Sr/86Sr in European soils: A baseline for provenancing studies. Sci. Total. Environ. 2019, 672, 1033–1044. [Google Scholar] [CrossRef] [Green Version]
- Gregorčič, S.H.; Strojnik, L.; Potočnik, D.; Vogel-Mikuš, K.; Jagodic, M.; Camin, F.; Zuliani, T.; Ogrinc, N. Can We Discover Truffle’s True Identity? Molecules 2020, 25, 2217. [Google Scholar] [CrossRef] [PubMed]
- Geological Overview. Available online: https://mern.gouv.qc.ca/en/mines/geology/geological-overview/ (accessed on 17 May 2021).
- Horn, P.; Schaaf, P.; Holbach, B.; Hölzl, S.; Eschnauer, H. 87Sr/86Sr from rock and soil into vine and wine. Z. Lebensm. Unters. Forsch. 1993, 196, 407–409. [Google Scholar] [CrossRef]
- Ogrinc, N.; Kocman, D.; Miljević, N.; Vreča, P.; Vrzel, J.; Povinec, P. Distribution of H and O stable isotopes in the surface waters of the Sava River, the major tributary of the Danube River. J. Hydrol. 2018, 565, 365–373. [Google Scholar] [CrossRef]
- Vrzel, J.; Ludwig, R.; Gampe, D.; Ogrinc, N. Hydrological system behaviour of an alluvial aquifer under climate change. Sci. Total. Environ. 2019, 649, 1179–1188. [Google Scholar] [CrossRef]
- Thomsen, E.; Andreasen, R. Agricultural lime disturbs natural strontium isotope variations: Implications for provenance and migration studies. Sci. Adv. 2019, 5, eaav8083. [Google Scholar] [CrossRef] [Green Version]
- Boito, M. Acqua, Alimentazione e Latte: Relazioni fra i Caratteri Isotopici e Chimici. Doctoral Thesis, Università Degli Studi di Parma, Dipartimento di Scienze Chimiche Della vita e Della Sostenibilità Ambientale, Parma, Italy, 2021. [Google Scholar]
- Chung, I.-M.; Kim, J.-K.; Yang, Y.-J.; An, Y.-J.; Kim, S.-Y.; Kwon, C.; Kim, S.-H. A case study for geographical indication of organic milk in Korea using stable isotope ratios-based chemometric analysis. Food Control. 2020, 107, 106755. [Google Scholar] [CrossRef]
- Philip Horwitz, E.; Dietz, M.L.; Fisher, D.E. Separation and Preconcentration of Strontium from Biological, Environmental, and Nuclear Waste Samples by Extraction Chromatography Using a Crown Ether. Anal. Chem. 1991, 63, 522–525. [Google Scholar] [CrossRef] [PubMed]
- De Muynck, D.; Huelga-Suarez, G.; Van Heghe, L.; Degryse, P.; Vanhaecke, F. Systematic Evaluation of a Strontium-Specific Extraction Chromatographic Resin for Obtaining a Purified Sr Fraction with Quantitative Recovery from Complex and Ca-Rich Matrices. J. Anal. At. Spectrom. 2009, 24, 1498. [Google Scholar] [CrossRef] [Green Version]
- Scher, H.D.; Griffith, E.M.; Buckley, W.P. Accuracy and Precision of 88Sr/86Sr and 87Sr/86Sr Measurements by MC-ICPMS Compromised by High Barium Concentrations: Sr Isotopes from Ba-Rich Matrices. Geochem. Geophys. Geosyst. 2014, 15, 499–508. [Google Scholar] [CrossRef]
- Irrgeher, J.; Prohaska, T. Application of Non-Traditional Stable Isotopes in Analytical Ecogeochemistry Assessed by MC ICP-MS - A Critical Review. Anal. Bioanal. Chem. 2016, 408, 369–385. [Google Scholar] [CrossRef] [Green Version]
- Liu, W.-G.; Li, Z.-D.; Wei, S.; Chen, J.; Liu, Y.; Ao, C.; Xiao, Z.-B.; Zhou, H.-Y.; Liu, H. Rapid Separation and Precise Determination of Strontium Isotopic from Geological Samples with High Rubidium/Strontium Ratios. Chin. J. Anal. Chem. 2019, 47, 1054–1060. [Google Scholar] [CrossRef]
- Trincherini, P.R.; Baffi, C.; Barbero, P.; Pizzoglio, E.; Spalla, S. Precise Determination of Strontium Isotope Ratios by TIMS to Authenticate Tomato Geographical Origin. Food Chem. 2014, 145, 349–355. [Google Scholar] [CrossRef] [PubMed]
- Liu, H.; Wei, Y.; Lu, H.; Wei, S.; Jiang, T.; Zhang, Y.; Guo, B. Combination of the 87Sr/86Sr Ratio and Light Stable Isotopic Values (δ13C, δ15N and δD) for Identifying the Geographical Origin of Winter Wheat in China. Food Chem. 2016, 212, 367–373. [Google Scholar] [CrossRef] [PubMed]
- Evaluation of Measurement Data—An Introduction to the “Guide to the Expression of Uncertainty in Measurement” and Related Documents. Available online: https://www.bipm.org/en/publications/guides/gum.html (accessed on 17 May 2021).
- ISO. Guide to the Expression of Uncertainty in Measurement, 98-3:2008; ISO: Geneva, Switzerland, 2008. [Google Scholar]


| Location ID | Latitude | Longitude | Season | Year | Sr (mg/kg) | 87Sr/86Sr ± SD |
|---|---|---|---|---|---|---|
| C1 | 45.70862 | 13.87428 | summer | 2014 | 2.09 | 0.70900 ± 0.00011 |
| C1 | 45.70862 | 13.87428 | winter | 2014 | 2.44 | 0.70935 ± 0.00011 |
| C2 | 45.60928 | 13.93719 | summer | 2014 | 1.05 | 0.70880 ± 0.00012 |
| C2 | 45.60928 | 13.93719 | winter | 2014 | 2.60 | 0.70852 ± 0.00015 |
| C2 | 45.60928 | 13.93719 | winter | 2015 | 2.26 | 0.70898 ± 0.00019 |
| C3 | 45.55083 | 14.06222 | summer | 2014 | 1.71 | 0.70886 ± 0.00010 |
| C3 | 45.55083 | 14.06222 | winter | 2014 | 1.16 | 0.70925 ± 0.00018 |
| C3 | 45.55083 | 14.06222 | winter | 2015 | 2.02 | 0.70880 ± 0.00019 |
| C4 | 45.77504 | 14.21382 | winter | 2014 | 1.09 | 0.70913 ± 0.00010 |
| C4 | 45.77504 | 14.21382 | winter | 2015 | 1.79 | 0.70918 ± 0.00012 |
| C5 | 45.91761 | 14.23516 | summer | 2014 | 0.94 | 0.70867 ± 0.00012 |
| C5 | 45.91761 | 14.23516 | winter | 2014 | 1.65 | 0.71026 ± 0.00014 |
| J1 | 46.30065 | 13.94305 | summer | 2014 | 1.00 | 0.70915 ± 0.00015 |
| J2 | 45.83072 | 14.92945 | summer | 2014 | 1.25 | 0.70970 ± 0.00010 |
| J2 | 45.83072 | 14.92945 | winter | 2014 | 1.26 | 0.70991 ± 0.00013 |
| J2 | 45.83072 | 14.92945 | winter | 2015 | 1.21 | 0.70932 ± 0.00012 |
| J3 | 45.97324 | 14.41981 | summer | 2014 | 1.79 | 0.70875 ± 0.00015 |
| J3 | 45.97324 | 14.41981 | winter | 2014 | 1.41 | 0.70918 ± 0.00012 |
| J4 | 45.85574 | 15.15377 | summer | 2014 | 1.16 | 0.70936 ± 0.00015 |
| J4 | 45.85574 | 15.15377 | winter | 2014 | 1.32 | 0.70939 ± 0.00015 |
| J5 | 45.46142 | 15.25357 | summer | 2014 | 1.51 | 0.70940 ± 0.00010 |
| J5 | 45.46142 | 15.25357 | winter | 2014 | 2.13 | 0.70954 ± 0.00012 |
| J6 | 45.97639 | 14.61882 | winter | 2014 | 3.23 | 0.70961 ± 0.00010 |
| N1 | 46.68544 | 15.70966 | summer | 2014 | 2.51 | 0.70933 ± 0.00014 |
| N1 | 46.68544 | 15.70966 | winter | 2014 | 2.20 | 0.70962 ± 0.00022 |
| N2 | 46.22219 | 14.60712 | summer | 2014 | 1.50 | 0.70923 ± 0.00017 |
| N2 | 46.22219 | 14.60712 | winter | 2014 | 1.37 | 0.70945 ± 0.00012 |
| N3 | 46.25371 | 15.44393 | summer | 2014 | 2.40 | 0.70959 ± 0.00021 |
| N3 | 46.25371 | 15.44393 | winter | 2014 | 2.53 | 0.70960 ± 0.00015 |
| N4 | 46.23378 | 15.63860 | summer | 2014 | 2.96 | 0.70959 ± 0.00015 |
| N4 | 46.23378 | 15.63860 | winter | 2014 | 2.59 | 0.70955 ± 0.00015 |
| T1 | 46.55463 | 15.64563 | winter | 2014 | 3.32 | 0.70950 ± 0.00017 |
| T2 | 46.18696 | 13.75652 | summer | 2014 | 1.54 | 0.71043 ± 0.00011 |
| T2 | 46.18696 | 13.75652 | winter | 2014 | 1.21 | 0.70956 ± 0.00012 |
| T3 | 46.04773 | 14.21534 | winter | 2014 | 1.50 | 0.70940 ± 0.00019 |
| T3 | 46.04773 | 14.21534 | winter | 2015 | 3.41 | 0.70928 ± 0.00017 |
| T4 | 45.83366 | 14.63623 | winter | 2014 | 1.06 | 0.70981 ± 0.00011 |
| T5 | 46.18810 | 15.01356 | summer | 2014 | 3.61 | 0.70924 ± 0.00018 |
| T5 | 46.18810 | 15.01356 | winter | 2014 | 3.14 | 0.70929 ± 0.00019 |
| P1 | 46.53564 | 15.26751 | summer | 2014 | 2.16 | 0.71008 ± 0.00015 |
| P1 | 46.53564 | 15.26751 | winter | 2014 | 2.48 | 0.70975 ± 0.00013 |
| P2 | 46.59800 | 15.16536 | winter | 2014 | 2.14 | 0.70993 ± 0.00014 |
| P4 | 46.50779 | 15.07791 | winter | 2014 | 2.06 | 0.71041 ± 0.00010 |
| P5 | 46.33926 | 14.95994 | summer | 2014 | 3.99 | 0.70811 ± 0.00014 |
| P5 | 46.33926 | 14.95994 | winter | 2014 | 2.14 | 0.70866 ± 0.00015 |
| P6 | 46.42414 | 15.01712 | winter | 2014 | 3.56 | 0.70963 ± 0.00015 |
| Q1 | 46.30849 | 14.89704 | summer | 2014 | 1.28 | 0.71001 ± 0.00012 |
| Q1 | 46.30849 | 14.89704 | summer | 2014 | 1.56 | 0.70979 ± 0.00011 |
| Q1 | 46.30849 | 14.89704 | winter | 2014 | 1.80 | 0.70966 ± 0.00012 |
| Q2 | 46.54691 | 14.91991 | winter | 2014 | 1.95 | 0.71095 ± 0.00011 |
| Q3 | 46.58922 | 15.02460 | summer | 2014 | 2.07 | 0.71171 ± 0.00018 |
| Q3 | 46.58922 | 15.02460 | winter | 2014 | 1.93 | 0.71087 ± 0.00014 |
| Q4 | 46.28804 | 15.03957 | winter | 2014 | 1.91 | 0.71044 ± 0.00015 |
| Q4 | 46.28804 | 15.03957 | winter | 2015 | 1.92 | 0.70902 ± 0.00012 |
| Q6 | 46.01295 | 15.29799 | winter | 2014 | 2.17 | 0.70925 ± 0.00017 |
| Q7 | 46.33665 | 15.42204 | summer | 2014 | 1.95 | 0.71064 ± 0.00015 |
| Q7 | 46.33665 | 15.42204 | winter | 2014 | 1.86 | 0.71062 ± 0.00011 |
| Q8 | 46.39199 | 15.57278 | winter | 2014 | 2.88 | 0.70945 ± 0.00015 |
| Q9 | 45.90793 | 15.59578 | summer | 2014 | 1.86 | 0.71007 ± 0.00015 |
| Q9 | 45.90793 | 15.59578 | winter | 2014 | 1.82 | 0.71005 ± 0.00015 |
| Q10 | 46.42006 | 15.86960 | summer | 2014 | 2.52 | 0.71086 ± 0.00023 |
| Q10 | 46.42006 | 15.86960 | winter | 2014 | 2.04 | 0.71181 ± 0.00023 |
| Q10 | 46.42006 | 15.86960 | winter | 2014 | 2.18 | 0.71086 ± 0.00013 |
| Q10 | 46.42006 | 15.86960 | winter | 2014 | 2.31 | 0.71154 ± 0.00021 |
| Q10 | 46.42006 | 15.86960 | winter | 2015 | 1.83 | 0.71010 ± 0.00013 |
| Q11 | 46.67660 | 15.99125 | summer | 2014 | 1.98 | 0.71173 ± 0.00020 |
| Q11 | 46.67660 | 15.99125 | winter | 2014 | 1.87 | 0.71113 ± 0.00020 |
| Q12 | 46.64402 | 16.04111 | summer | 2014 | 2.00 | 0.71146 ± 0.00021 |
| Q12 | 46.64402 | 16.04111 | winter | 2014 | 2.53 | 0.71119 ± 0.00025 |
| Q13 | 46.65485 | 16.16190 | summer | 2014 | 3.22 | 0.71126 ± 0.00018 |
| Q13 | 46.65485 | 16.16190 | winter | 2014 | 3.15 | 0.71271 ± 0.00025 |
| Q13 | 46.65485 | 16.16190 | winter | 2015 | 2.52 | 0.71233 ± 0.00019 |
| Q14 | 46.51955 | 16.19726 | summer | 2014 | 2.33 | 0.71141 ± 0.00019 |
| Q15 | 46.28095 | 15.07375 | winter | 2014 | 1.58 | 0.70969 ± 0.00016 |
| Q16 | 46.52806 | 15.77623 | summer | 2014 | 2.19 | 0.71181 ± 0.00010 |
| Q16 | 46.52806 | 15.77623 | winter | 2014 | 2.19 | 0.71122 ± 0.00019 |
| Q17 | 46.80051 | 16.22926 | winter | 2014 | 2.79 | 0.71201 ± 0.00020 |
Publisher’s Note: MDPI stays neutral with regard to jurisdictional claims in published maps and institutional affiliations. |
© 2021 by the authors. Licensee MDPI, Basel, Switzerland. This article is an open access article distributed under the terms and conditions of the Creative Commons Attribution (CC BY) license (https://creativecommons.org/licenses/by/4.0/).
Share and Cite
Gregorčič, S.H.; Ogrinc, N.; Frew, R.; Nečemer, M.; Strojnik, L.; Zuliani, T. The Provenance of Slovenian Milk Using 87Sr/86Sr Isotope Ratios. Foods 2021, 10, 1729. https://doi.org/10.3390/foods10081729
Gregorčič SH, Ogrinc N, Frew R, Nečemer M, Strojnik L, Zuliani T. The Provenance of Slovenian Milk Using 87Sr/86Sr Isotope Ratios. Foods. 2021; 10(8):1729. https://doi.org/10.3390/foods10081729
Chicago/Turabian StyleGregorčič, Staša Hamzić, Nives Ogrinc, Russell Frew, Marijan Nečemer, Lidija Strojnik, and Tea Zuliani. 2021. "The Provenance of Slovenian Milk Using 87Sr/86Sr Isotope Ratios" Foods 10, no. 8: 1729. https://doi.org/10.3390/foods10081729
APA StyleGregorčič, S. H., Ogrinc, N., Frew, R., Nečemer, M., Strojnik, L., & Zuliani, T. (2021). The Provenance of Slovenian Milk Using 87Sr/86Sr Isotope Ratios. Foods, 10(8), 1729. https://doi.org/10.3390/foods10081729