3.1. E. coli O121 and O26 Load Reduction in Wheat during Tempering
Sodium bisulfate (pKa = 1.99, MW = 120.0 g/mol) is a dry acid salt that is soluble in water, dissociating into sodium, hydrogen, and sulfate ions [
16]. The MIC of SBS against both
E. coli O121 and O26 was 0.32%
w/
v. This demonstrates the inhibitory effects of SBS against STECs (O121 and O26), which is linked to its acidifying properties that lowered the pH of the growth media.
E. coli O121 and O26 were used in this study as these serotypes were the most frequent cause of flour recalls [
8].
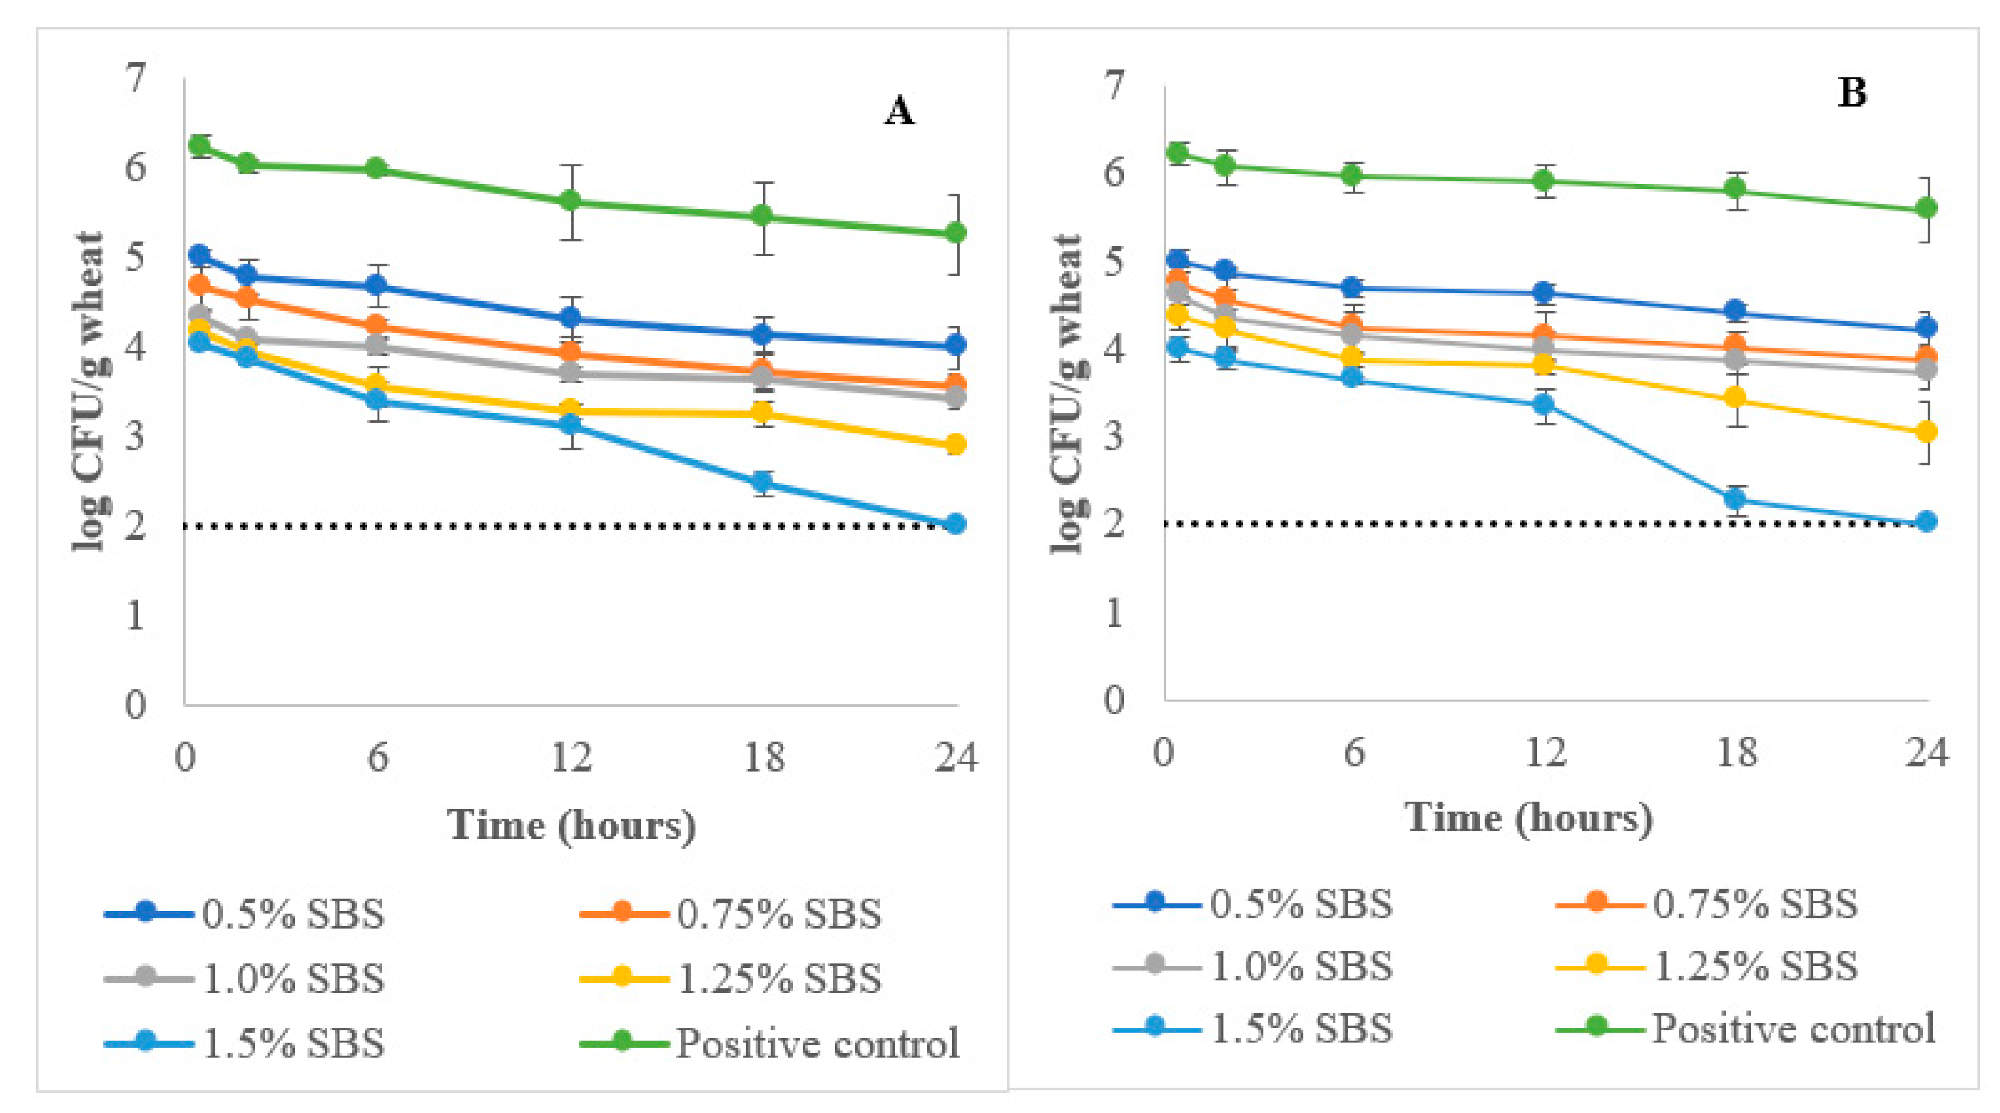
Based on
Figure 1, the positive control showed a gradual decrease in
E. coli (O121 and O26) load of the wheat during tempering. At the end of tempering (24 h) phase, there were small but significant (
p ≤ 0.05) reductions in the
E. coli O121 (0.8 logs) and O26 (0.6 logs) load of the wheat tempered with the control treatment (0% SBS). These reductions were based on the initial (0.5 h) wheat
E. coli (O121 and O26) load (6.2 ± 0.3 log CFU/g). The observations demonstrate that the increased moisture levels of the wheat due to tempering were still insufficient to promote
E. coli survival in wheat kernels. The tempering moisture used (17% moisture) in this study corresponds to wheat water activity (aw) levels of approximately 0.70 [
17]. This a
w level is known to inhibit multiplication of bacterial cells such as
E. coli, which requires a
w levels of ≥ 0.95 for growth. No colonies were recovered after plating in all sampling intervals for the negative control treatment.
The addition of SBS in the tempering water was effective in reducing the
E. coli load of wheat (
Figure 1). At 0.5% SBS, a ~1.0 log reduction was observed in 0.5 h of tempering. A maximum of a 2.0 log reduction for both
E. coli serogroups was observed at 0.5 h tempering at SBS concentrations of 1.25 and 1.5% SBS. At the end of the tempering step, the 1.5% SBS concentration was able to reduce both
E. coli O121 and O26 loads of wheat below detection limits (<2.0 log CFU/g) (
p ≤ 0.05). Load reductions (log CFU/g) observed after tempering were 2.2 (0.5%), 2.5 (0.75%), 2.7 (1.0%), and 3.5 (1.25%) for
E. coli O121 (
p ≤ 0.05). As for
E. coli O26, load reductions (log CFU/g) observed were 2.0 (0.5%), 2.4 (0.75%), 2.5 (1.0%), and 3.2 (1.25%) at the end of tempering (
p ≤ 0.05). The reductions were calculated based on the
E. coli (O121 and O26) load of the positive control sample at 0.5 h tempering. An interaction between tempering time and SBS concentrations was also observed (
p ≤ 0.05) wherein longer tempering times were needed to achieve maximum
E. coli (O121 and O26) load reduction in wheat due to SBS tempering.
SBS is recognized as a GRAS (Generally Recognized as Safe) substance. This classification means that it can be used by food manufacturers without the need for a pre-market review verifying its safety. Furthermore, the use of GRAS substances is permitted as long as they are used in accordance with the manufacturers’ Good Manufacturing Practices (GMPs). The observed MIC of SBS (0.32%
w/
v) in this study was also comparable with several common organic acids such as lactic (0.5%), and acetic (0.5%) [
18,
19]. The lower MIC observed indicates that lower amounts of SBS are required to inhibit STECs (O121 and O26), which could represent an economic benefit to manufacturers.
Sodium bisulfate is also used for farm litter management [
20]. Its acidifying property controls the enteric microbial load of animal manure with reported 2 to 5 log reductions upon application of SBS [
21].
Table 1 shows that the addition of SBS lowered (
p ≤ 0.05) the pH of the tempering water, resulting in a lower pH of the wheat kernels. These lowered pH values contributed to the reduction of the
E. coli load of wheat during tempering. Higher pH values were observed for the treated wheats compared to the SBS tempering solutions prepared, showing that wheat kernels have some buffering capabilities allowing them to resist acidification [
22]. In addition, the pH drops of wheat kernels decreased as the SBS tempering concentration increased, but higher STEC load reductions were still observed. The reductions could be explained by the increased acidity and osmolarity caused by the increased SBS concentration in the tempering solutions. This was also enhanced by the hygroscopic properties of SBS, which could have resulted in a drier wheat surface, resulting in the higher log reductions observed. The antimicrobial activity of acids is usually linked to the movement of acids across the cell membrane lowering internal cell pH, which disrupts cell activities [
23,
24]. As SBS is considered an acid salt, the ions from SBS salt changes the osmolarity of the wheat grain (cell environment) leading to cell dehydration. Bacterial cells expel water from their cells to balance out solute concentrations between the cell and its environment [
25].
The maximum reductions observed upon addition of SBS were comparable with non-thermal intervention steps applied for wheats such as lactic acid (1.6 logs-non-O157 STECs, 1.8 logs-O157 STECs), ozone (3.2 logs-aerobic counts), and gamma irradiation (2 logs-aerobic counts) treatment of wheat [
3,
26,
27]. SBS reductions were also comparable with the reductions from the thermal treatment of wheat flour (70 °C, 60 min) which gave 4.1 log reductions in
E. coli O26 [
5]. The results indicate that SBS tempering is effective in reducing the STEC load of wheat after tempering as normal levels of
E. coli in wheat were reported to be only around 1.0 log CFU/g [
28]. This reduction could then limit
E. coli cross-contamination from wheat to milling equipment and mill fractions.
3.2. Flour Quality Evaluation
The impact of SBS tempering concentrations of 1.25 and 1.5% SBS on wheat flour quality was evaluated as they resulted in ≥3.0 log reductions after tempering. This reduction level is commonly accepted by most flour industry consumers for antimicrobial interventions applied to wheat flours [
29]. No mandatory performance standards have been set by regulating bodies (e.g., Food and Drug Administration) with regards to pathogen reduction processes for wheat milling.
Table 2 summarizes the milling yields (% as-is) of wheat tempered with different SBS concentrations (0. 1.25, and 1.5% SBS). The wheat moisture after tempering (16.10–16.39%) for all treatments was within the moisture levels (15–17% moisture) used in hard wheat milling [
30]. Bran yields decreased with increasing SBS concentrations while increasing (
p ≤ 0.05) yields were observed for the shorts fraction. This suggests that SBS tempering could have increased bran friability resulting in more fine bran particles. Similar yields were observed (
p > 0.05) for the straight-grade flours (73.66–74.72%). For the individual flour fractions, SBS tempering resulted in slightly higher sizing (SZ) flour and lower break (BK) flour yields while reduction (RD) flour yields were similar. Quantifying the yields for the individual flour fractions (break, sizing, and reduction) is important as they possess different attributes such as size and damaged starch content, altering the straight grade flour characteristics.
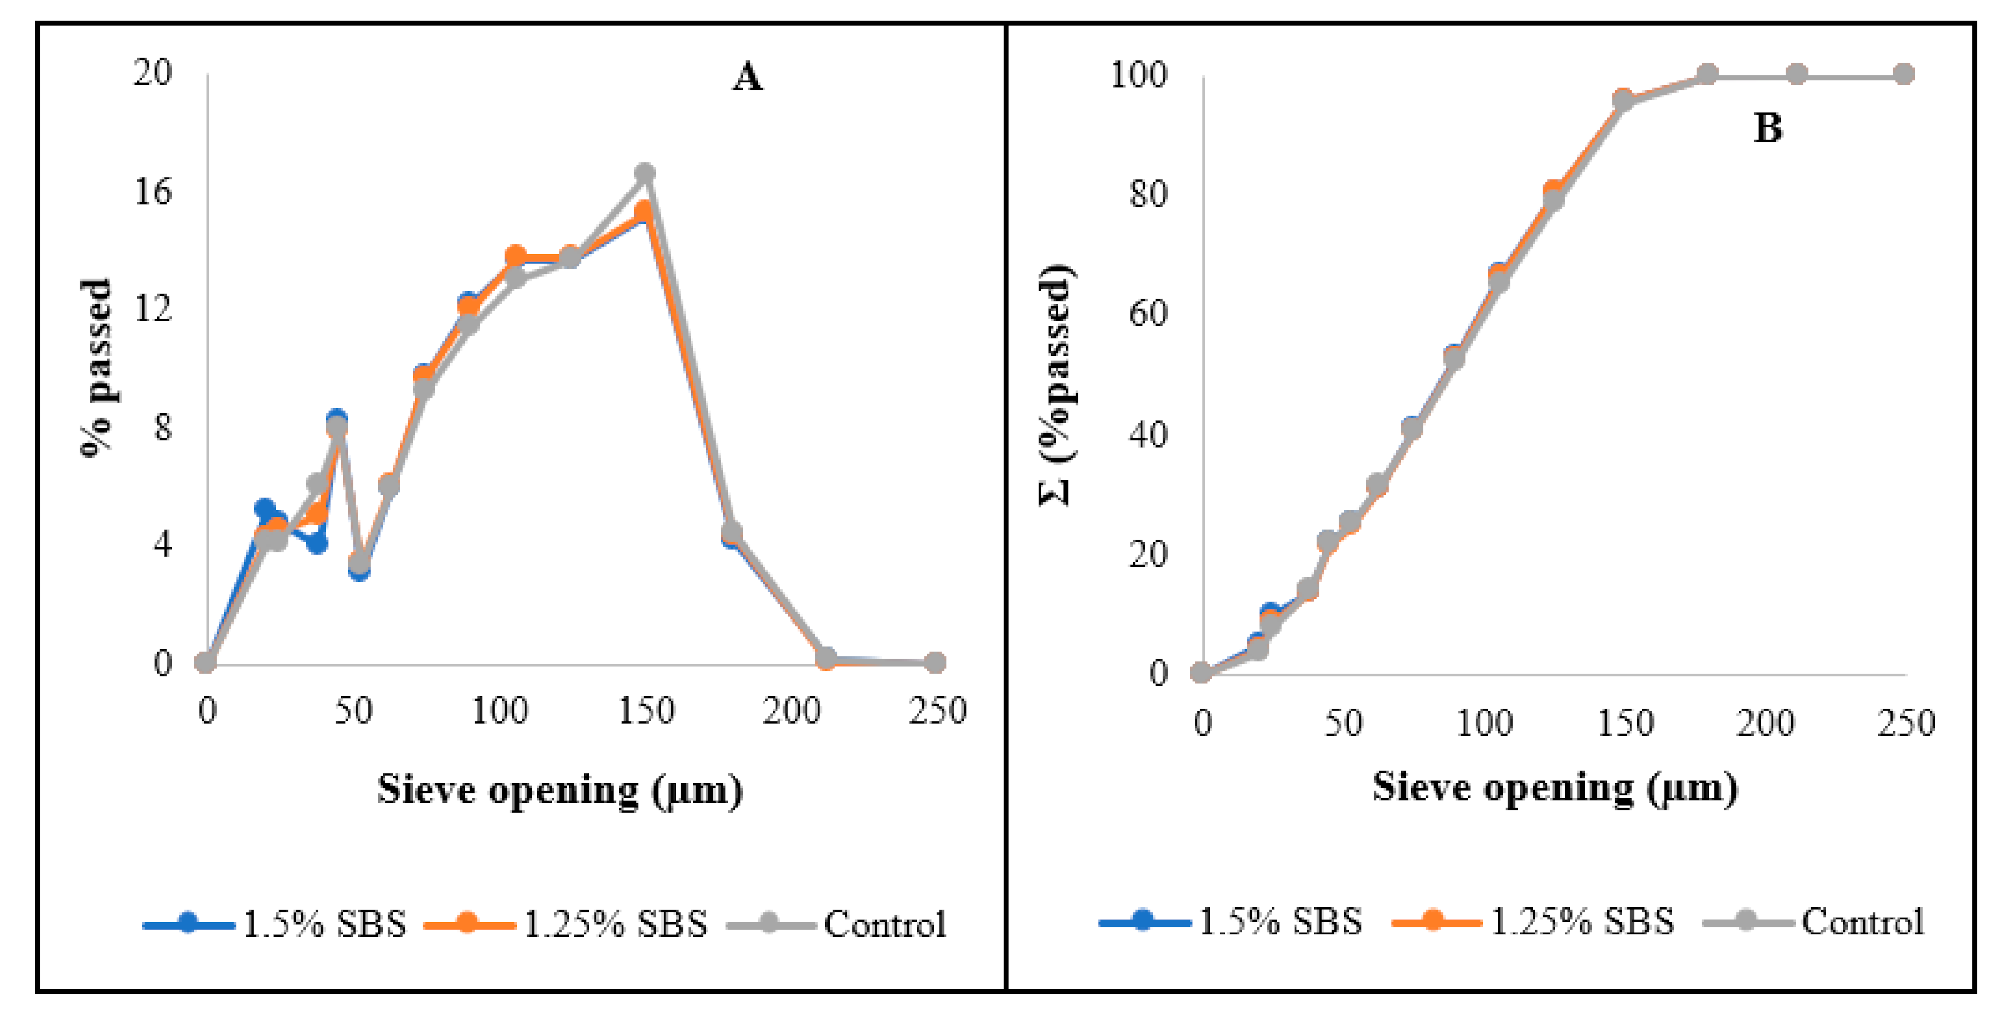
The flours obtained also had relatively similar particle size distributions (
Figure 2) wherein most of the flour particles had particle sizes ranging from 50 to 150 µm, satisfying the regulatory requirement for wheat flour particle size, which states that ≥98% of particles should be below 212 µm [
31]. Aside from the regulatory requirements, particle size of wheat flours is also important since it affects the hydration and mixing properties of wheat flours and based on
Figure 2, changes in the flour characteristics due to particle size for the treatments would be minimal as all treatments had relatively similar PSD.
Tempering with SBS also resulted in more acidic milling fractions (
Table 3) with the 1.5% SBS treatment yielding the most acidic milling fractions (
p ≤ 0.05). The pH values for the flour fractions (BK, SZ, RD, and SG flours) ranged from 5.23 to 5.56. These values were lower than the pH of the control treatment (pH = 6.67). These observations indicate that part of the SBS salt added to the wheat kernels diffused from the bran layer into the endosperm during tempering. The lower pH of the bran and shorts fraction indicate that more SBS molecules were retained on the surface of the wheat kernels (bran) relative to the endosperm layer.
The proximate composition of the wheat flours obtained from SBS-tempered wheats was comparable with that of the control treatment (
Table 4). Moisture values for all the flours obtained were higher than the standard (14%) moisture for flours. This is related to the reduced workflow of laboratory-scale mills as moisture loss in flours during milling occurs due to the heat produced by successive roller milling. Higher ash and fiber contents (
p ≤ 0.05) were observed with increasing SBS concentrations. This could be due to the increased concentration of salts in the wheat flours due to the added SBS salts in the tempering step. Higher (
p ≤ 0.05) wheat flour protein and carbohydrate contents were observed with increasing SBS tempering concentrations although the changes were relatively small (<0.3%). As for the starch contents, tempering with SBS (1.25 and 1.50%) resulted in higher total and damaged starch contents, which could have implications for the pasting and dough properties of the wheat flours. Falling number (FN) values for all wheat flour samples were >250 s, indicating minimal amylase activity. Furthermore, FN values decreased with increasing SBS concentrations, which is related to the increased hydrolysis of the starch molecules into smaller glucose units due to acid and heat stresses [
32]. The wheat flours from SBS-tempered wheats generally had lower L* and higher a* and b* values, indicating lower brightness, higher red, and yellow tones. The color changes could be linked to the higher ash and fiber contents of the 1.25 and 1.5% SBS wheat flours, which are indicators of bran contamination in wheat flours.
No significant differences (
p > 0.05) were observed for the gluten index and dry gluten values (
Table 5) of the wheat flours obtained. The observations indicate that SBS tempering did not significantly affect gluten strength (gluten index) and quantity (dry gluten). Lower (
p ≤ 0.05) wet gluten values were observed for SBS-tempered wheats (1.25 and 1.5%) relative to the control, showing lower gluten water-binding capacity (
Table 5). The differences were due to the lowered wheat flour pH, which could have altered the gluten formation and structure, reducing the flour water -binding capacity [
33].
Solvent retention capacity (SRC) values are commonly used for assessing the baking performance of flours. The use of lactic acid, sodium carbonate, and sucrose solvents provide insights into the glutenin, damaged starch, pentosan, and gliadin quality, respectively, of wheat flours [
34]. Water is a universal solvent that measures the overall quality of the flour [
35]. The inclusion of SBS (1.25 and 1.5%) during wheat tempering yielded higher water, sucrose, and sodium carbonate SRC values for the wheat flours (
Table 5). Lower lactic acid SRC values were observed for SBS wheat flours relative to the control. These observations indicate improved pentosan, damaged starch, gliadin characteristics, and lower gluten strength for the wheat flours produced from SBS-tempered wheats (1.25 and 1.50% SBS).
Higher peak viscosities and breakdown values (
p ≤ 0.05) were observed (
Table 5) for flours from SBS- tempered wheats. The higher peak viscosity observed could be due to the increased salt concentration in the flour due to the added SBS. The peak viscosity (RVA profile) of wheat flour suspensions was reported to increase with the addition of phosphate salts [
36]. The higher breakdown and lower trough values indicate lowered hot paste holding strength. These changes could be explained by the increased rate of hydrolysis of the leeched amylopectin and amylose components due to heat and acid stresses [
32]. Lower final viscosity, and setback values were observed for wheat flours from SBS wheat flours showing better retrogradation properties. The lower extent of retrogradation could be explained by the acidic pH and increased salt concentration present in the flour as these are known methods for retarding starch retrogradation during cooling [
37]. Pasting temperatures for the wheat flours were similar, although slightly lower peak times were observed with increasing SBS tempering concentrations.
Similar values (
p > 0.05) were observed for the water absorption, development time (time to C1), mixing stability, and amplitude (dough elasticity) values of SBS-wheat flours relative to the control (
Table 6). C2 values for the wheat flours were also similar (
p > 0.05), indicating similar protein qualities of wheat flours for all tempering treatments. C3 and C4 values for the 1.5% SBS were lower (
p ≤ 0.05) than those of the control (0% SBS), indicating lower dough viscosity and gel stability during heating. C5 values of wheat flours from SBS-tempered wheats (1.25 and 1.5% SBS) were significantly lower than those of the control, indicating less starch retrogradation during the cooling phase. Mixolab behavior of the flours during the heating phase were relatively similar to the RVA curves, indicating that the differences could also be explained by the difference in salt and acidity of the wheat flours.
The breadmaking characteristics of the wheat flours are shown in
Table 7 and the images of bread loaf bread slices are presented in
Figure 3. Loaf volume and specific bread volume of SBS wheat flours (1.25 and 1.5% SBS) were comparable (
p > 0.05) to those of the control (0% SBS). These characteristics are mostly dependent on the protein (gluten quantity and quality) attributes of the wheat flour [
38]. This agrees with the trends observed for wheat flour gluten properties (
Table 5) and protein quantity (
Table 1). This observation also agrees with the mixolab values (C2 and stability) as these values were reported to have a high correlation with bread making qualities of wheat cultivars [
39].
The crumb structure of the bread slices made from the obtained wheat flours is summarized in
Table 7. Crumb structures of breads form as the water and alcohols evaporate from the dough during baking, resulting in the formation of the cells. The gluten structure then sets, maintaining the bread structure. Wheat flours from SBS-tempered wheats (1.25 and 1.5% SBS) produced breads with significantly (
p ≤ 0.05) higher cell counts and smaller crumb structure (lower cell diameter and volume) compared to the control. Breads made from SBS-tempered wheats also had lower (
p ≤ 0.05) wall thickness compared to the control (0% SBS). The significance of c-cell characteristics depends on the target characteristics of bread that is produced. Bread texture measurements are also shown in
Table 7. Bread hardness (
Table 7) generally increased with increasing amounts of SBS used for tempering, with the 1.5% SBS treatment giving the highest bread hardness value among the treatments. Furthermore, the resilience (ability of bread to spring back to its original shape), springiness (elastic recovery of bread after the removal of compression), chewiness (rubbery texture of bread during chewing), and cohesion (resistance to deformation of breads) increased with higher SBS concentrations used for tempering. Overall, SBS tempering resulted in breads with a finer crumb structure and higher texture profile values. This could be due to the increased salt and acidity concentration of the bread due to the SBS. These factors are known to help improve the structure of breads as they improve gluten strength [
40].


